Article

Retrospective Modeling of NO2 and PM10 Concentrations over the Lyon Metropolitan Area (France), 1990–2010—Performance Evaluation, Exposure Assessment and Correlation between Pollutants

1
Department Prevention Cancer and Environment, Centre Léon Bérard, 69008 Lyon, France
2
Inserm U1296 «Radiation: Defense, Health Environment», Centre Léon Bérard, 69008 Lyon, France
3
Laboratoire de Mécanique des Fluides et d’Acoustique, UMR CNRS 5509, University of Lyon Ecole Centrale de Lyon, INSA Lyon, Université Claude Bernard Lyon I, 36, Avenue Guy de Collongue, 69134 Ecully, France
4
National Institute for Industrial Environment and Risks (INERIS), Parc Technologique ALATA, 60550 Verneuil-en-Halatte, France
5
Centre for Environmental Health and Sustainability, School of Geography, Geology and the Environment, University of Leicester, Leicester LE1 7RH, UK
6
Centre de Recherche en Epidémiologie et Santé des Populations (CESP, Inserm U1018), Facultés de Médecine, Université Paris-Saclay, UPS UVSQ, Gustave Roussy, 114 rue Edouard-Vaillant, 94805 Villejuif CEDEX, France
*
Author to whom correspondence should be addressed.
Atmosphere 2021, 12(2), 239; https://doi.org/10.3390/atmos12020239
Submission received: 29 December 2020 / Revised: 3 February 2021 / Accepted: 4 February 2021 / Published: 10 February 2021
(This article belongs to the Special Issue Air Pollution and Environment in France)

Abstract

:
Numerous cancers develop years after subjects have been exposed to chemical compounds. Thus, environmental epidemiological studies need to accurately reconstruct exposures over long periods. To estimate exposure to NO2 and PM10 concentrations, we modelled ground-level air concentrations, at very fine temporal (1 h) and spatial (10 m) resolutions, over a large European metropolitan area and at subject’s address of a French national cohort, for five different years (1990, 1995, 2000, 2005 and 2010). Model performances were assessed by comparing the annual modelled concentration against monitoring station measurements. As input data, we used background concentrations from a large-scale dispersion model. The relevance of our approach was assessed by comparing results in 2010, with a modelling using monitoring values as background data. The comparison with measurement data showed good performance of the model for the majority of the period, with a performance declined in 1990. Concentrations at the subject’s residence decreased by 45% for PM10 and 38% for NO2. The proportion of subjects exposed above the WHO recommendations declined from 100% to 50% for PM10 and from 79% to 16% for NO2. The results of this study would provide a reference for future models to assess chronic exposures to PM10 and NO2 on a larger scale.

1. Introduction

Air pollution is a major public health concern and has been consistently linked to a range of adverse health effects. According to the Global Burden of Disease Study, air pollution was responsible worldwide for 19% of cardiovascular deaths, 24% of ischemic heart disease deaths and 21% of stroke deaths in 2015 [1]. In Europe, despite decreasing pollutant concentration levels over the last decades, the annual excess mortality rate from ambient air pollution is considered to be close to 790,000 (95% CI 645,000–934,000) [2].
In an urban context, air pollution is a complex mixture of multiple pollutants, including several agents classified by the International Agency for Research on Cancer (IARC) as carcinogenic or probably carcinogenic to humans such as particulate matter (PM) or diesel exhaust [3,4]. The two main pollutants in urban and peri-urban environments are PM and nitrogen dioxide (NO2). For both, there is evidence of effects on human health associated with exposure to concentration levels that are lower than current legislation thresholds [5,6,7,8,9]. These observations have raised questions about the contribution of long-term exposure to low-level PM and NO2 concentrations and the occurrence of a variety of pathologies. Long-term exposure to PM has been associated, with the risk of lung cancer, with sufficient evidence for a causal link and bladder cancer [4]. Epidemiological studies have also suggested a positive association with breast cancer [10]. Concerning long-term exposure to NO2, previous studies have reported positive associations with breast [11,12,13,14] and colorectal cancer [15].
Given the long latency of cancer development, the reliable characterization of long-term exposure to these pollutants raises important challenges, since it requires the estimate of pollutant concentrations over several decades and a fine spatial resolution over the whole study period. Assessment of exposure in European cities prior to the year 2000, has to face two main problems: the lack of direct concentration measurements and the lack of reliable estimates of pollutant emissions by different source typologies (traffic, domestic heating and industry). The lack of concentration measurements severely limits the use of statistical models, such as Land Use Regression Models, whose calibration relies on the availability of a relatively large number of measurement stations [16]. The high uncertainty in the emission scenarios is instead reflected on considerable uncertainties in the concentration estimates provided by dispersion models. The accuracy of the output of such models is further affected by the difficulties in accurately estimating background concertation levels. Indeed, these are typically estimated by sub-urban or rural measurement stations, yet rarely available before 2000 or as output of regional dispersion models [17] whose estimates suffer from the aforementioned uncertainties in the emission scenarios.
As a consequence, the longer the study period, the more the lack of knowledge about historical air pollution levels may lead to misclassification of study subjects, resulting in uncertainty and bias in the risk estimates [18,19].
In order to address these features, this study presented the results obtained with an urban dispersion model (SIRANE) for the assessment of NO2 and PM10 concentrations in the Lyon Metropolitan Area (LMA) between 1990 and 2010. Historical pollutant concentration fields at a fine temporal (1 h) and spatial (10 m) resolution were reconstructed for five different years: 1990, 1995, 2000, 2005 and 2010. The aims of the study were: (i) to evaluate the accuracy of the model outputs (assessed by comparison with available field measurements) using different methods to estimate background concentrations; and (ii) to assess the exposure of study subjects of the French national E3N cohort living in the LMA during the 1990–2010 period in the framework of a case-control study on the effects of long-term air pollution exposure on breast cancer risk [20]. The E3N study (Etude Epidémiologique auprès de femmes de la Mutuelle Générale de l’Education Nationale) is an ongoing prospective cohort involving 98,995 French female volunteers, enrolled in 1990 and born between 1925 and 1950 [21].

2. Materials and Methods

2.1. Study Area, Period and Population

The present study was conducted in the LMA, a 30 km × 34 km urban area (Figure 1), which has the second largest population in France (1.4 million people). The choice of the LMA in this present study was principally based on the availability of measurements of NO2 and PM10 concentrations in ambient air, from 1990 onwards, which was rare in the French context.
The domain includes a network (Figure 1) of 24,815 streets comprising 4985 streets classified as canyons (i.e., with a ratio width/height ≤ 3), which cover approximately 15% of the total length of the street network. In 2010, 15 permanent monitoring stations of NO2 and 13 of PM10 (Figure 1) were located in the area. The number progressively reduces to only 5 stations, going back in 1990, for both pollutants.
For the present study, we selected 476 subjects from the E3N cohort study who lived in the LMA in 1990. The residential history was collected through self-administer questionnaires sent to the women in the cohort every 2 to 3 years. For the purpose of the study, we considered the residential addresses that remain unchanged over the whole study period (1990–2010) as done in a previous study evaluating model performance for dioxin and cadmium exposure assessment [22].

2.2. Atmospheric Dispersion Modeling

2.2.1. The SIRANE Model

The numerical simulations were performed with SIRANE, an operational model conceived to simulate pollutant dispersion at the local urban scale, assuming steady meteorological conditions over hourly time steps [23]. For that purpose, SIRANE represents the urban canopy as a network of connected streets whose relative pollutant exchange is modelled adopting ad hoc parameterizations, notably considering three exchange processes [24]: the advection of pollutant along the street axis [25], the dispersion at the intersections [26] and the ventilation through the turbulent exchange at the roof level [27].
Input data of the SIRANE model include the urban geometry, the meteorological data, the industrial, traffic and surface emissions (see Section 2.2.2) and the background concentrations (see Section 2.2.3). The only chemical reactions taken into account concern the cycle NO-NO2-O3, computed assuming a photo-stationary equilibrium [28]. To date, SIRANE has been extensively validated, both against wind tunnel experiments [29,30] or field measurements over the LMA [31,32] and other European cities [33].
All the simulations were carried out with the same street network (Figure 1), therefore ignoring potential modifications in the urban geometry and vehicle circulation that occurred over the study period. The meteorological conditions were reconstructed (with an hourly time step) from data registered at the Météo-France station at the Saint-Exupery airport. Further details on the model are provided by Soulhac et al. [23,31,32].

2.2.2. Emissions

The emissions associated with traffic were represented as line sources. Emissions from road tunnel stacks and large facilities were represented as punctual elevated sources. Other miscellaneous emissions, such as domestic heating or small industries, were represented by a regular 1 × 1 km emission grid (See Supplementary Materials 1).
Emission data of NO2, NO and PM10 were provided by Atmo Auvergne-Rhône-Alpes, the local authority for air quality as 1 × 1 km grid, in 2000, 2005 and 2010. Emissions were classified based on the activity sectors according to the Selected Nomenclature for Air Pollution (SNAP). To estimate the missing emissions for 1990 and 1995, we used a 3 × 3 km emissions grid, provided by the French National Institute for Industrial Environment and Risks (INERIS), from 1990 to 2000. We first established the emissions trends from 2000 to 1990 of each SNAP sub-category and for each cell in the INERIS grid and then applied these trends to the corresponding cells in the 1 × 1 km grid to estimate emission in 1995 and 1990.

2.2.3. Background Concentrations

SIRANE takes into account the contribution of hourly background concentrations, that is, due to emissions located outside the studied domain. The background concentration was considered as uniformly distributed over the study area and added to the concentrations estimated by SIRANE before applying the chemistry module (NO2-O3-NO). It can be estimated by means of concentrations measured at monitoring stations placed at the border of the domain and at distance from traffic axes [34,35,36] or by running a dispersion model over a larger (regional) domain [17,37,38].
As for the year 2010, measurement data were available for the background station as well as data from a large-scale dispersion model, the present study was able to compare the two approaches (Section 3.1). The background monitoring station (Saint-Exupery) was located outside the domain at about 20 km from the Lyon city center (Figure 1) with available data on NO2, NO, O3 and PM10 for 2010. The large-scale dispersion simulations were performed by the INERIS with a Chemistry Transport Model, CHIMERE [39]. Hourly concentrations of NO2, NO, O3 and PM10 were simulated over France for years 1990, 1995, 2000, 2005 and 2010, with a spatial resolution of 0.125° × 0.6°.
It is worth noting that, given that no background monitoring station was available for all the studied years and to keep a consistent approach for all the studied years, the SIRANE simulation, described in Section 3.2 and Section 3.3, used CHIMERE outputs as background concentrations.

2.3. Assessment Approach

2.3.1. Concentration Measurements

The annual concentrations modelled in 2010 using two different background data sets (measurement vs CHIMERE) were compared to 15 and 13 measurement stations for NO2 and PM10, respectively.
Simulated annual averaged concentrations for the years 1990, 1995, 2000, 2005 and 2010, using CHIMERE estimates as background data, were compared to annual values from monitoring stations (Figure 1). Over the study period, the number of active measurement stations decreased going back in time: from 20 stations in 2010 to 5 in 1990 for NO2 and from 13 to 5 stations for PM10. The distribution of monitoring stations in 1990 and 2010 for each pollutant are presented in Supplementary Material 2.

2.3.2. Subjects Exposure

To assess the exposure in the study population, annual average concentrations were computed at the residential addresses of the 476 E3N subjects, for five reference years (i.e., 1990, 1995, 2000, 2005 and 2010).
Firstly, we studied the evolution of NO2 and PM10 concentrations at the subject’s address throughout the study period with the WHO recommendations for annual ambient air concentrations as a reference [40].
Secondly, we tested the correlation of exposures to a given pollutant between each year. This provided information about the reliability of data from a single year used to evaluate exposures over the entire period, as performed in many epidemiological studies [41,42,43].
Finally, knowing that some epidemiological studies, due to lack of data, used the exposure data of other pollutants as a proxy of exposure for their evaluation, we studied the capacity of NO2 to predict PM10 exposures over the study period and vice versa.
For these last two steps, the continuous and group rankings of the subjects were compared for each pollutant and each year. We used the Pearson correlation coefficient for continuous ranking and Cohen’s Kappa for group ranking [44], two common statistical indicators used in epidemiological studies.

3. Results and Discussion

3.1. Influence of Background Concentration Data on 2010 Simulations

The present study assessed the performances of the SIRANE model, for 2010, using two different background concentrations as input data. The first simulation using measurements collected at the Saint-Exupery monitoring station and the second simulation using concentration estimated by the regional scale dispersion model CHIMERE at the Saint-Exupery monitoring station location.
The comparisons between annual mean concentrations measured and simulated for NO2 and PM10 are presented in Table 1 and Table 2. Concerning the quality of the estimates at the monitoring stations for NO2 (Table 1), both approaches showed relatively similar deviations (<20%) and correlation coefficients (R2 > 0.80). Concerning the performance of the modelling for PM10 concentrations (Table 2), the SIRANE simulation using measured concentrations as background concentrations led to a better deviation. On the other hand, the correlation coefficients were similar to that observed for NO2.

3.2. Comparison of Simulated Concentrations with Historical Annual Measurements

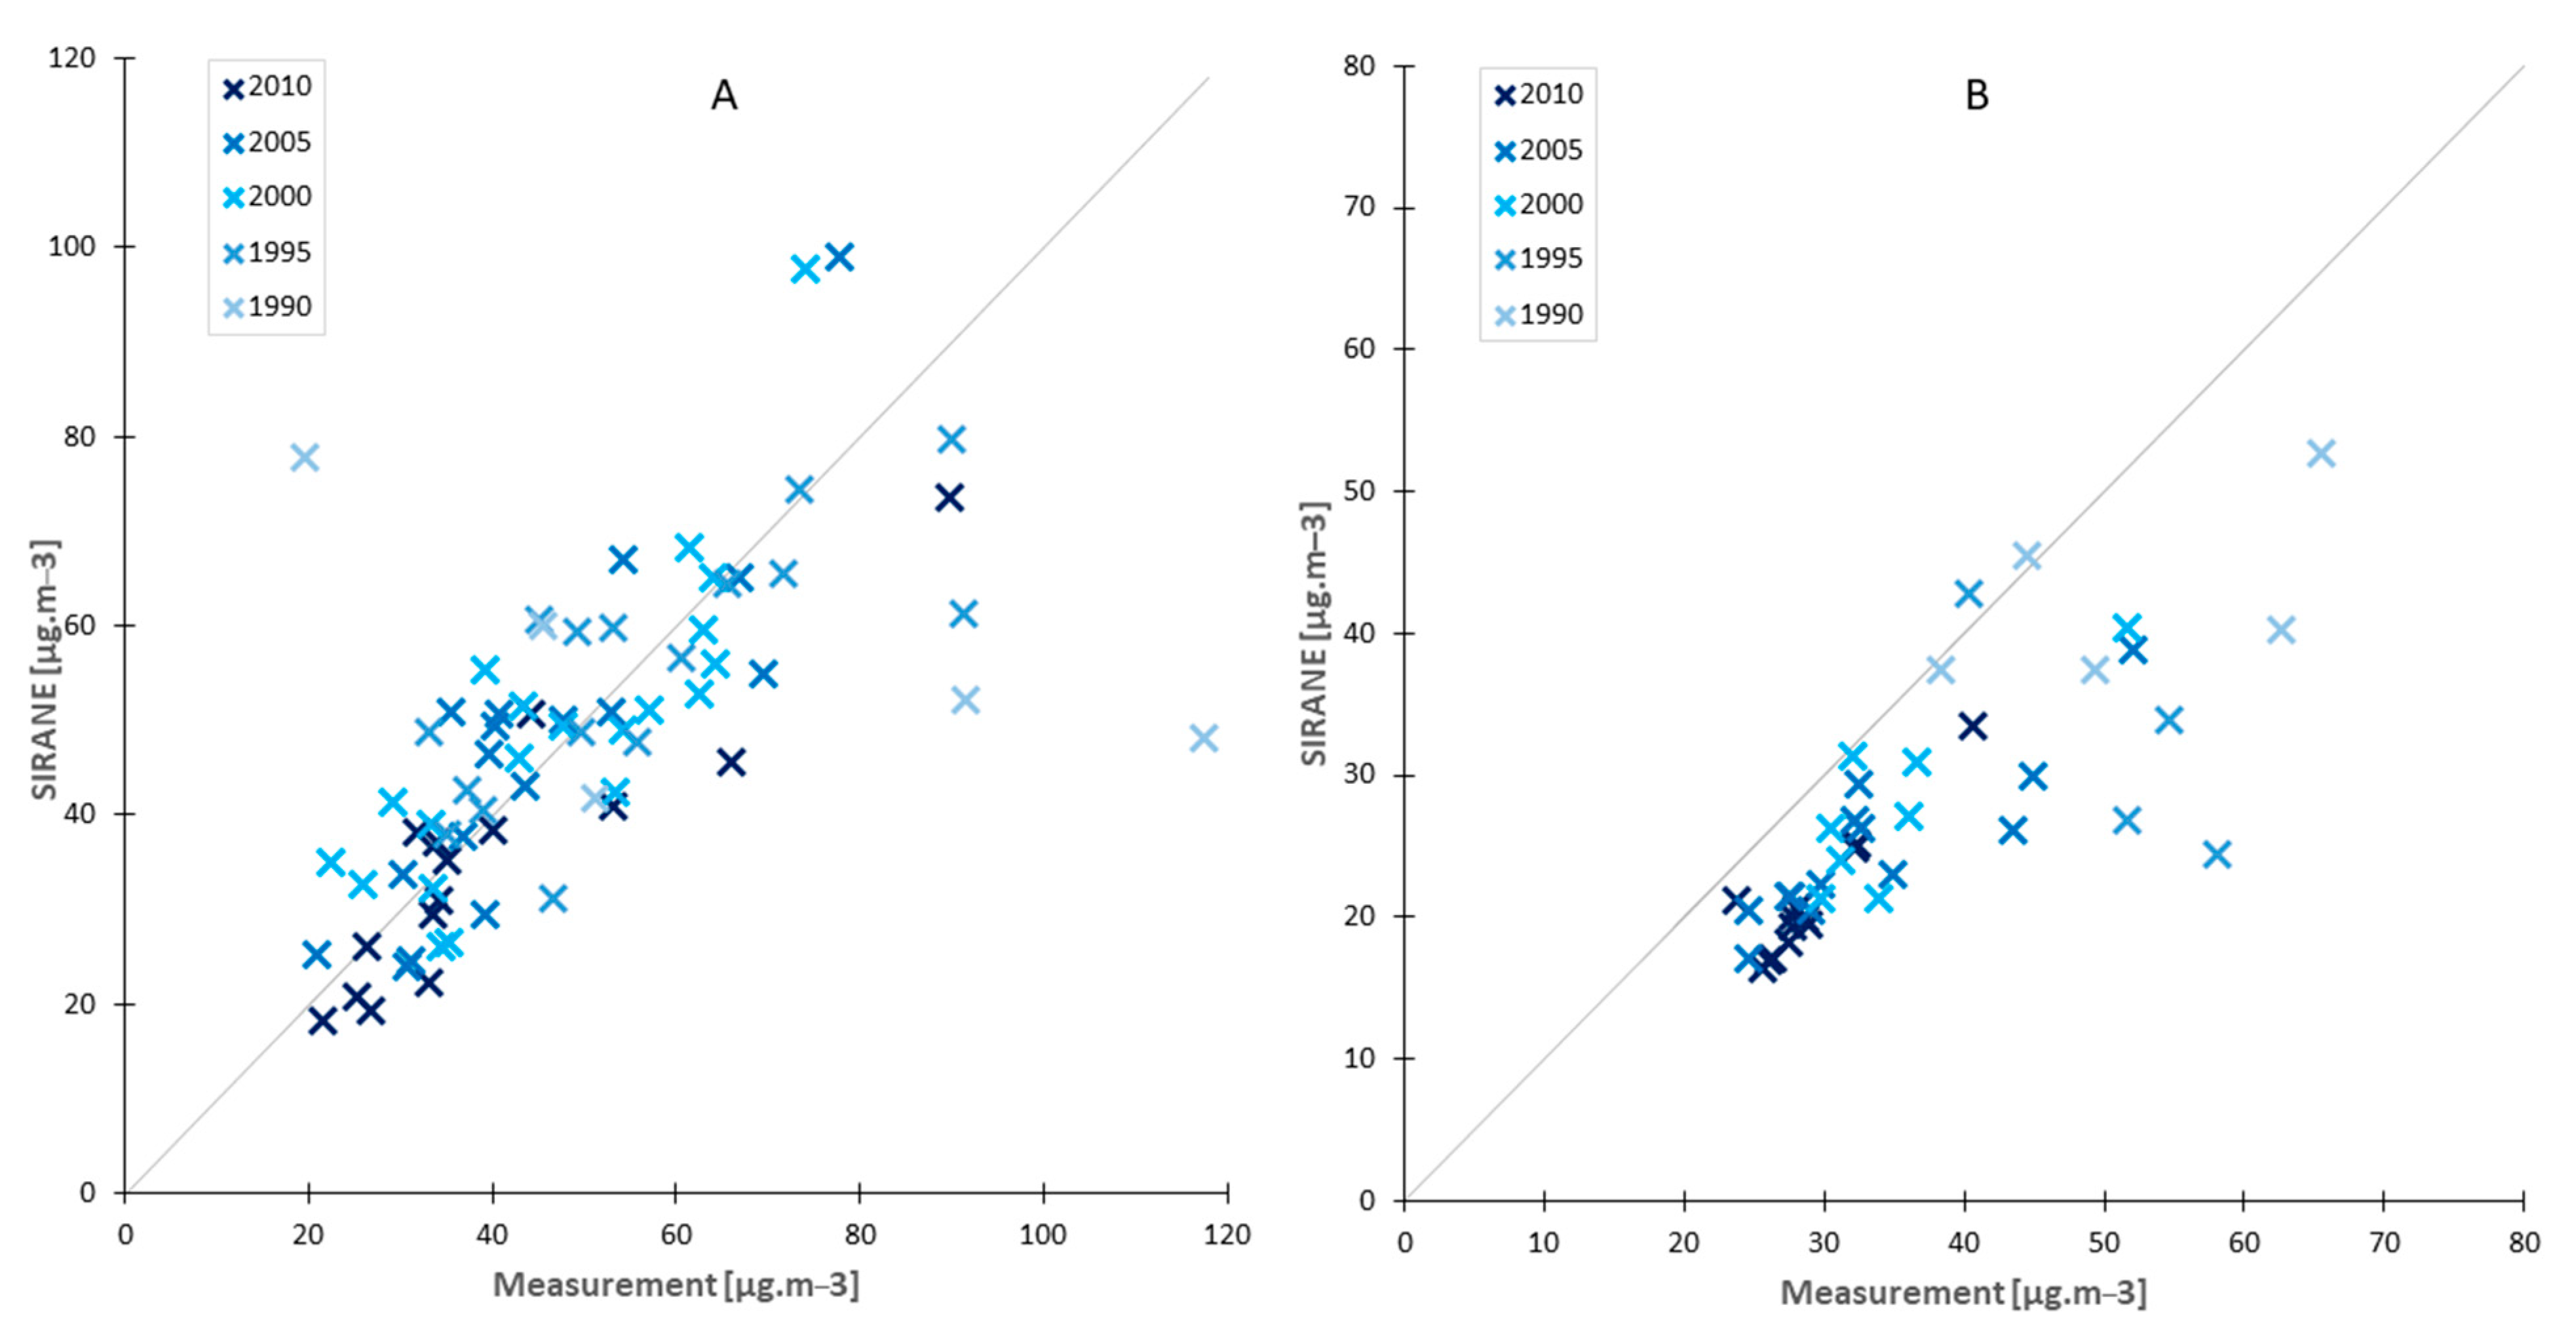
The comparison between modelled and measured NO2 and PM10 annual mean concentrations at the monitoring stations is presented in Figure 2.
Concerning NO2, we observed good modelling performances except for the year 1990. With the exception of this year, the deviations from measurements were relatively constant (between 15% and 19%, Table 3). On the other hand, going back in time, we observed a decrease in the correlation between measured and modelled data with coefficients (R2) passing from 0.82 in 2010 to 0.59 in 1995.
Concerning PM10, the modelled concentrations tended to be systematically underestimated compared to the measured ones. Except for the year 1995, the deviation from the measured concentrations varies around 25% (Table 4). Yet, the correlation between modelled and measured concentrations remain around 0.75 before falling sharply in 1990.
It is worth noting that, for both pollutants, the worst performances were systematically observed, for earlier years, when measuring stations were less, that is, in 1990 for NO2 and 1990 and 1995 for PM10. Results obtained for these 3 years should therefore be taken with caution.
Concerning the systematic underestimate of PM10 concentrations, Nguyen et al. [45] pointed out the high contribution of the background to the PM10 concentrations (over 50%). By comparing the PM10 annual mean concentrations modelled with CHIMERE and measured at the Saint-Exupéry background monitoring station (available for 2005 and 2010, only), we observed that CHIMERE systematically underestimated measured PM10 background concentrations (Table 5). This may therefore explain the systematic underestimation of the PM10 annual mean concentrations.

3.3. Historical Trend in Annual PM10 and NO2 Concentrations

3.3.1. Over the Study Domain

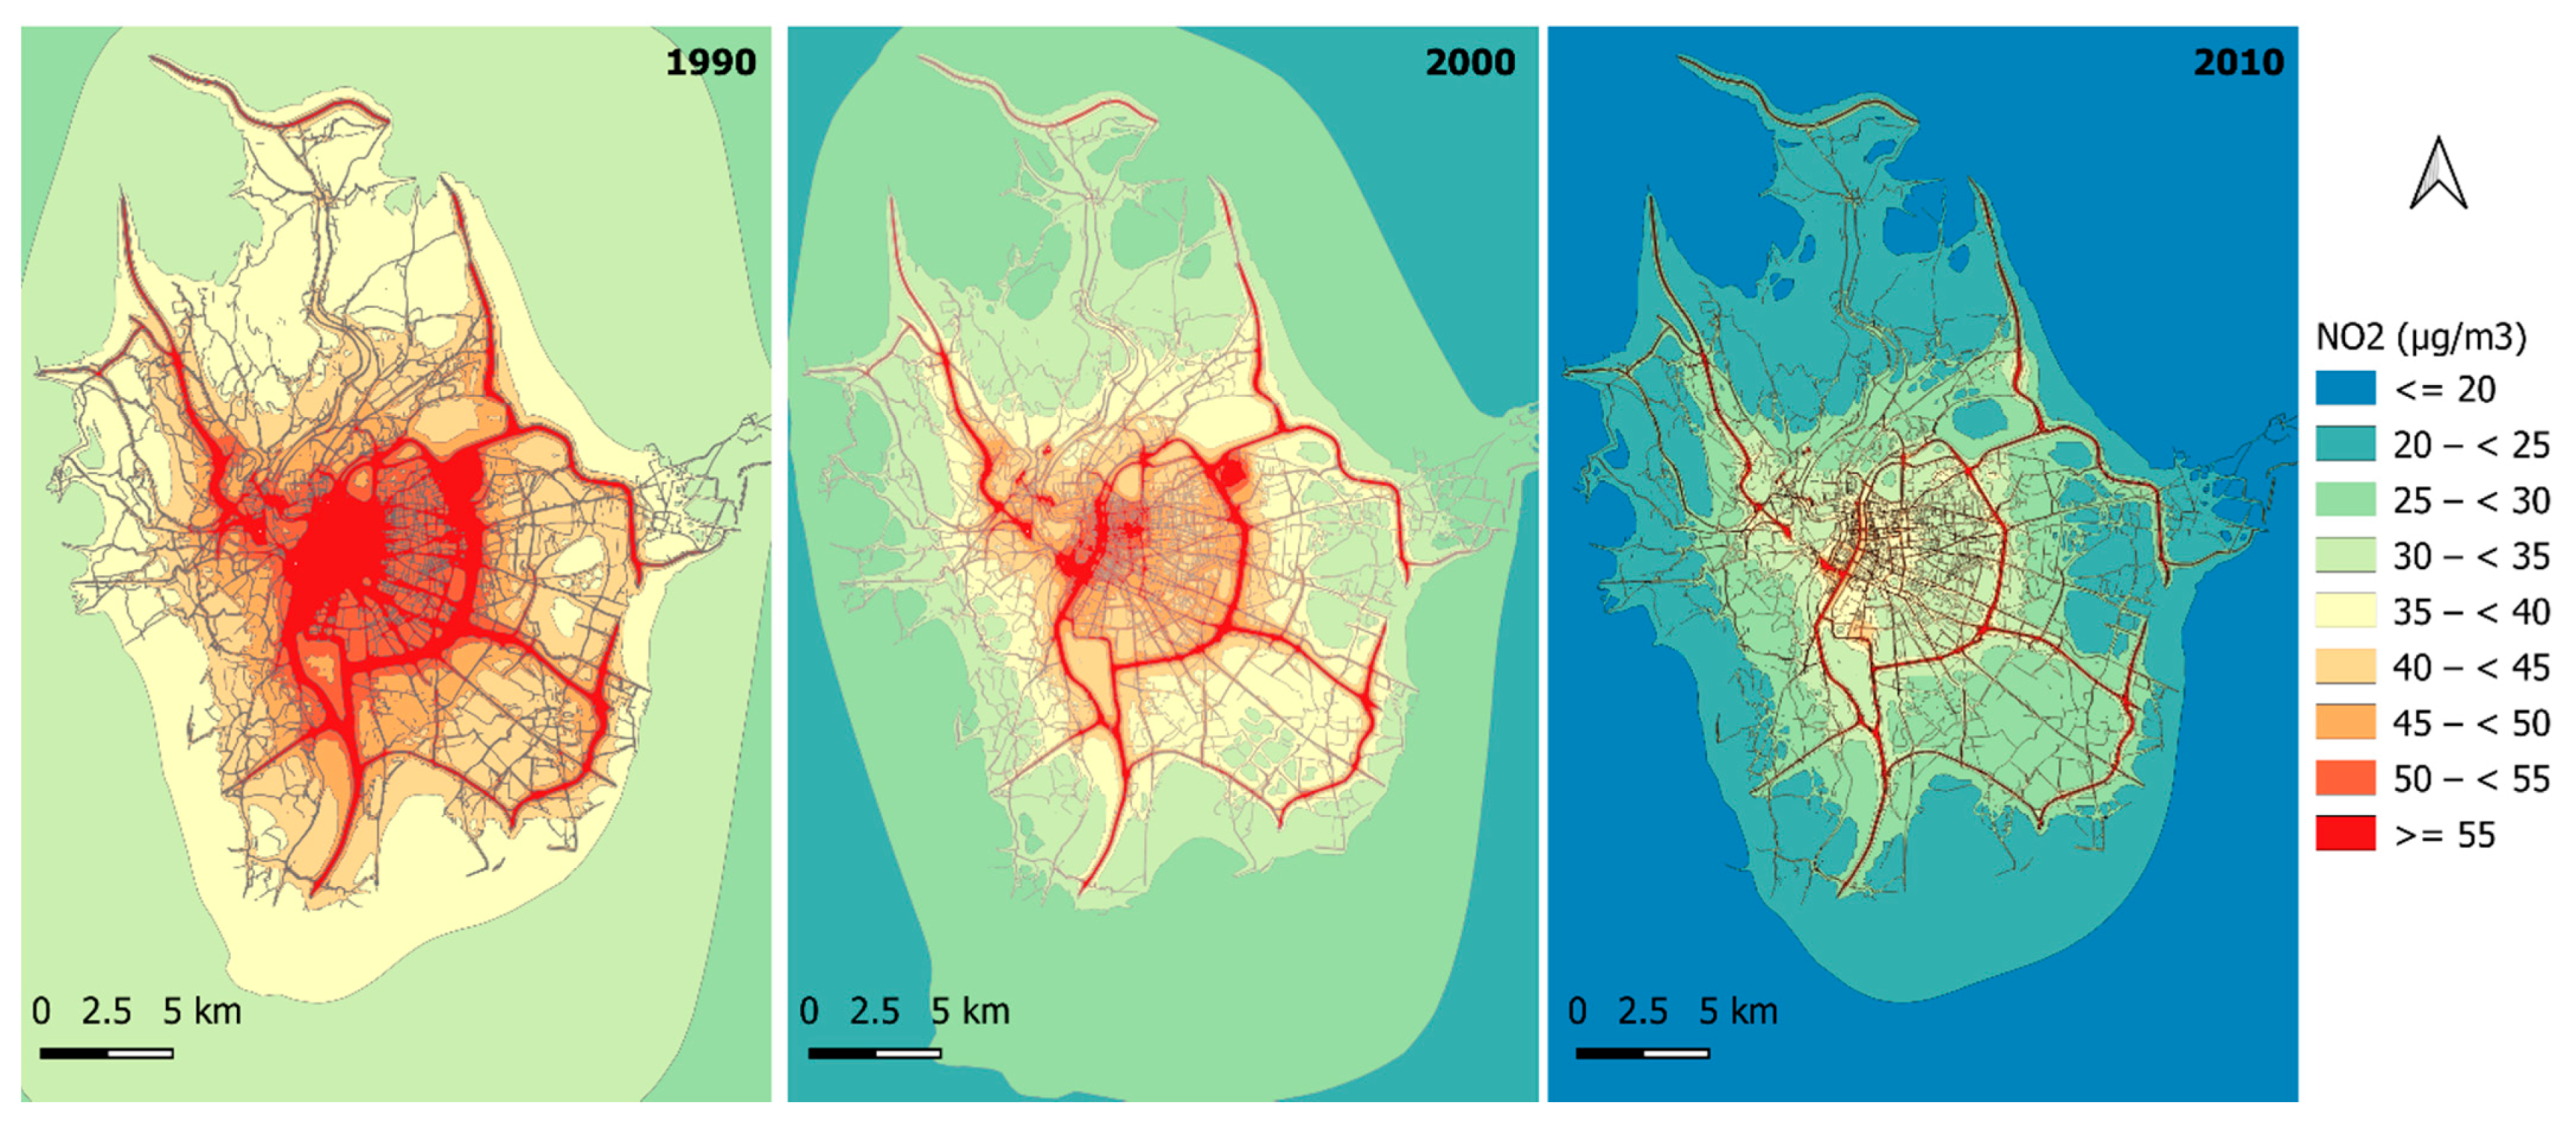
Figure 3 and Figure 4 illustrate the evolution of the annual mean NO2 and PM10 concentrations simulated with the SIRANE model in the LMA from 1990 to 2010. These figures show a global reduction of the annual mean concentrations until 2010.
Concerning NO2 concentrations (Figure 3), in 1990, all the city was exposed to annual concentrations exceeding the WHO recommendation (40 µg/m3) (Figure 3). Hotspots exceeding 90 µg/m3 in annual concentrations were observed near major traffic roads. In comparison, in 2010, the areas where concentrations were above the WHO guideline were limited to the vicinity of major roads and in a few districts of the city center. In terms of hotspots, concentrations around 60 µg/m3 were observed close to major roads.
For PM10, in 1990, the entire study area was characterized by ground-level concentrations above the WHO recommendation (20 µg/m3). In district near the city center, the concentrations systematically exceed 40 µg/m3. Twenty years later, the situation greatly changed and most of the study area was characterized by the concentrations below the WHO guideline. Areas with concentrations slightly above this limit were found in the city center and there were a few places where concentrations were twice this limit (i.e., very close to major roads and tunnel exits).
These observations were confirmed by the study of annual simulated average concentrations, which have fallen in 20 years by 42% and 48% for NO2 and PM10, respectively (Table 6). From 1990 to 2010, the percentage of the studied area with annual mean concentrations exceeding the WHO limit values decreased from 26.5% to 2.2% for NO2 and from 100% to 7.7% for PM10. As regards the most exposed parts of the territory (99th percentiles of annuals concentrations), the drop in concentrations were even more pronounced: from 74 µg/m3 to 42 µg/m3 for NO2 and from 54 µg/m3 to 35 µg/m3 for PM10. All these observations witnessed a relevant improvement of the air quality over the study period.
We noted that average NO2 and PM10 concentrations observed over the study area are similar to evolutions reported in long-term studies on air pollution. Sally Liu et al. [46] modelled the NO2 concentrations in Switzerland with a 200 m resolution and estimated exposure in 1993 and 2003 in the range of 7–76 µg/m3 and 5–68 µg/m3, respectively. Yanosky et al. [47] estimated the PM10 exposure across USA from 1988 to 2007 and observed mean concentration ranging from 25.1 µg/m3 for the 1988–1998 period to 21.5 µg/m3 for the 1999–2007 period.

3.3.2. PM10 and NO2 Concentrations at the Study Subjects’ Address of Residence

The annual median modelled NO2 concentrations at the subjects’ address of residence decrease by 38%, that is, from 51.0 µg/m3 in 1990 to 31.6 µg/m3 in 2010. Whereas in 1990, 79% of the study subjects were exposed to NO2 levels above the WHO limit, only 16% were exposed above this value in 2010 (Table 7). Similar to the decrease of modelled concentrations over the entire LMA, the decrease in concentrations at subjects’ addresses occurs in two stages, first between 1995 and 2000, then in 2005 and 2010. We noted that a few subjects were exposed to extreme values (above 80 µg/m3, twice the WHO recommendation) in 1990 and 1995 and that these subjects remain exposed above 50 µg/m3 until 2010 (Figure 5). All of these hotspots had in common to be very close to roads (but not necessarily to major traffic roads).
Over the 20-year period, median PM10 concentrations at the subjects’ locations decreased by 45%, from 36.3 µg/m3 to 20.0 µg/m3. It was observed that the variability of PM10 exposure in subjects is significantly lower than that of NO2 exposure (Figure 5).
In 1990, all the E3N subjects were exposed to values above the WHO limit for PM10 whereas in 2010, half of them are exposed to concentrations exceeding this value (Table 7). The main reduction occurred between 1990 and 2000 with an 11µg/m3 drop in annual concentration. Some high concentration value (>40 µg/m3, 2-time the WHO recommendation) was therefore observed for a couple of E3N subjects until 2005 (Figure 5). It is worth noting that the addresses with extreme PM10 concentrations were the same as for NO2. This suggests that despite the PM10 concentrations in the area was reduced and traffic was not the major source of PM10 emissions, the highest exposures were still located close to roads.
The results presented here unveil a general trend of air pollution levels that were similar to those presented in other previous studies, even though these were generally focusing on larger domains and with a lower spatial and temporal resolution. Notably, some parallels have been drawn with studies conducted on long-term exposure to NO2 and PM10 in European cohorts. In a study on long-term residential exposure to PM10 and NO2 in a Danish cohort, with a resolution of less than 1 km, Hvidtfeld et al. [48] found median (5th–95th) concentrations of 25.0 (17.9–39.5) for NO2 and 25.1 (23.7–30.3) for PM10, over the 1993–2015 period. In the French context, Bentayeb et al. [49] conducted a study on residential exposures in the Gazel cohort between 1989 and 2008. For NO2, they observed a 40% decrease in concentrations with a median (min-max) value going from 25 (2–94) to 15 (1–71). For PM10, median (min-max) concentrations decreased from 26 (6–44) µg/m3 to 17 (4–29) µg/m3, that is, a 27% drop. Despite the lower resolution used in the Bentayeb study (2 km), the results and trends were comparable to the results presented in this study (Table 7). The study carried out on the ELFE (Étude Longitudinale Française depuis l’Enfance) cohort in France in 2010 and 2011 by Riviere et al. [50] was instead based on concertation fields, the resolution of which was similar to that adopted here. Their estimates of the average exposure of subjects (21 µg/m3 for PM10 and 24 µg/m3 for NO2) were fairly close to ours in 2010 for PM10 (20.0 µg/m3), less for NO2 (32 µg/m3).

3.3.3. Correlation of Subject’s Exposure over Years

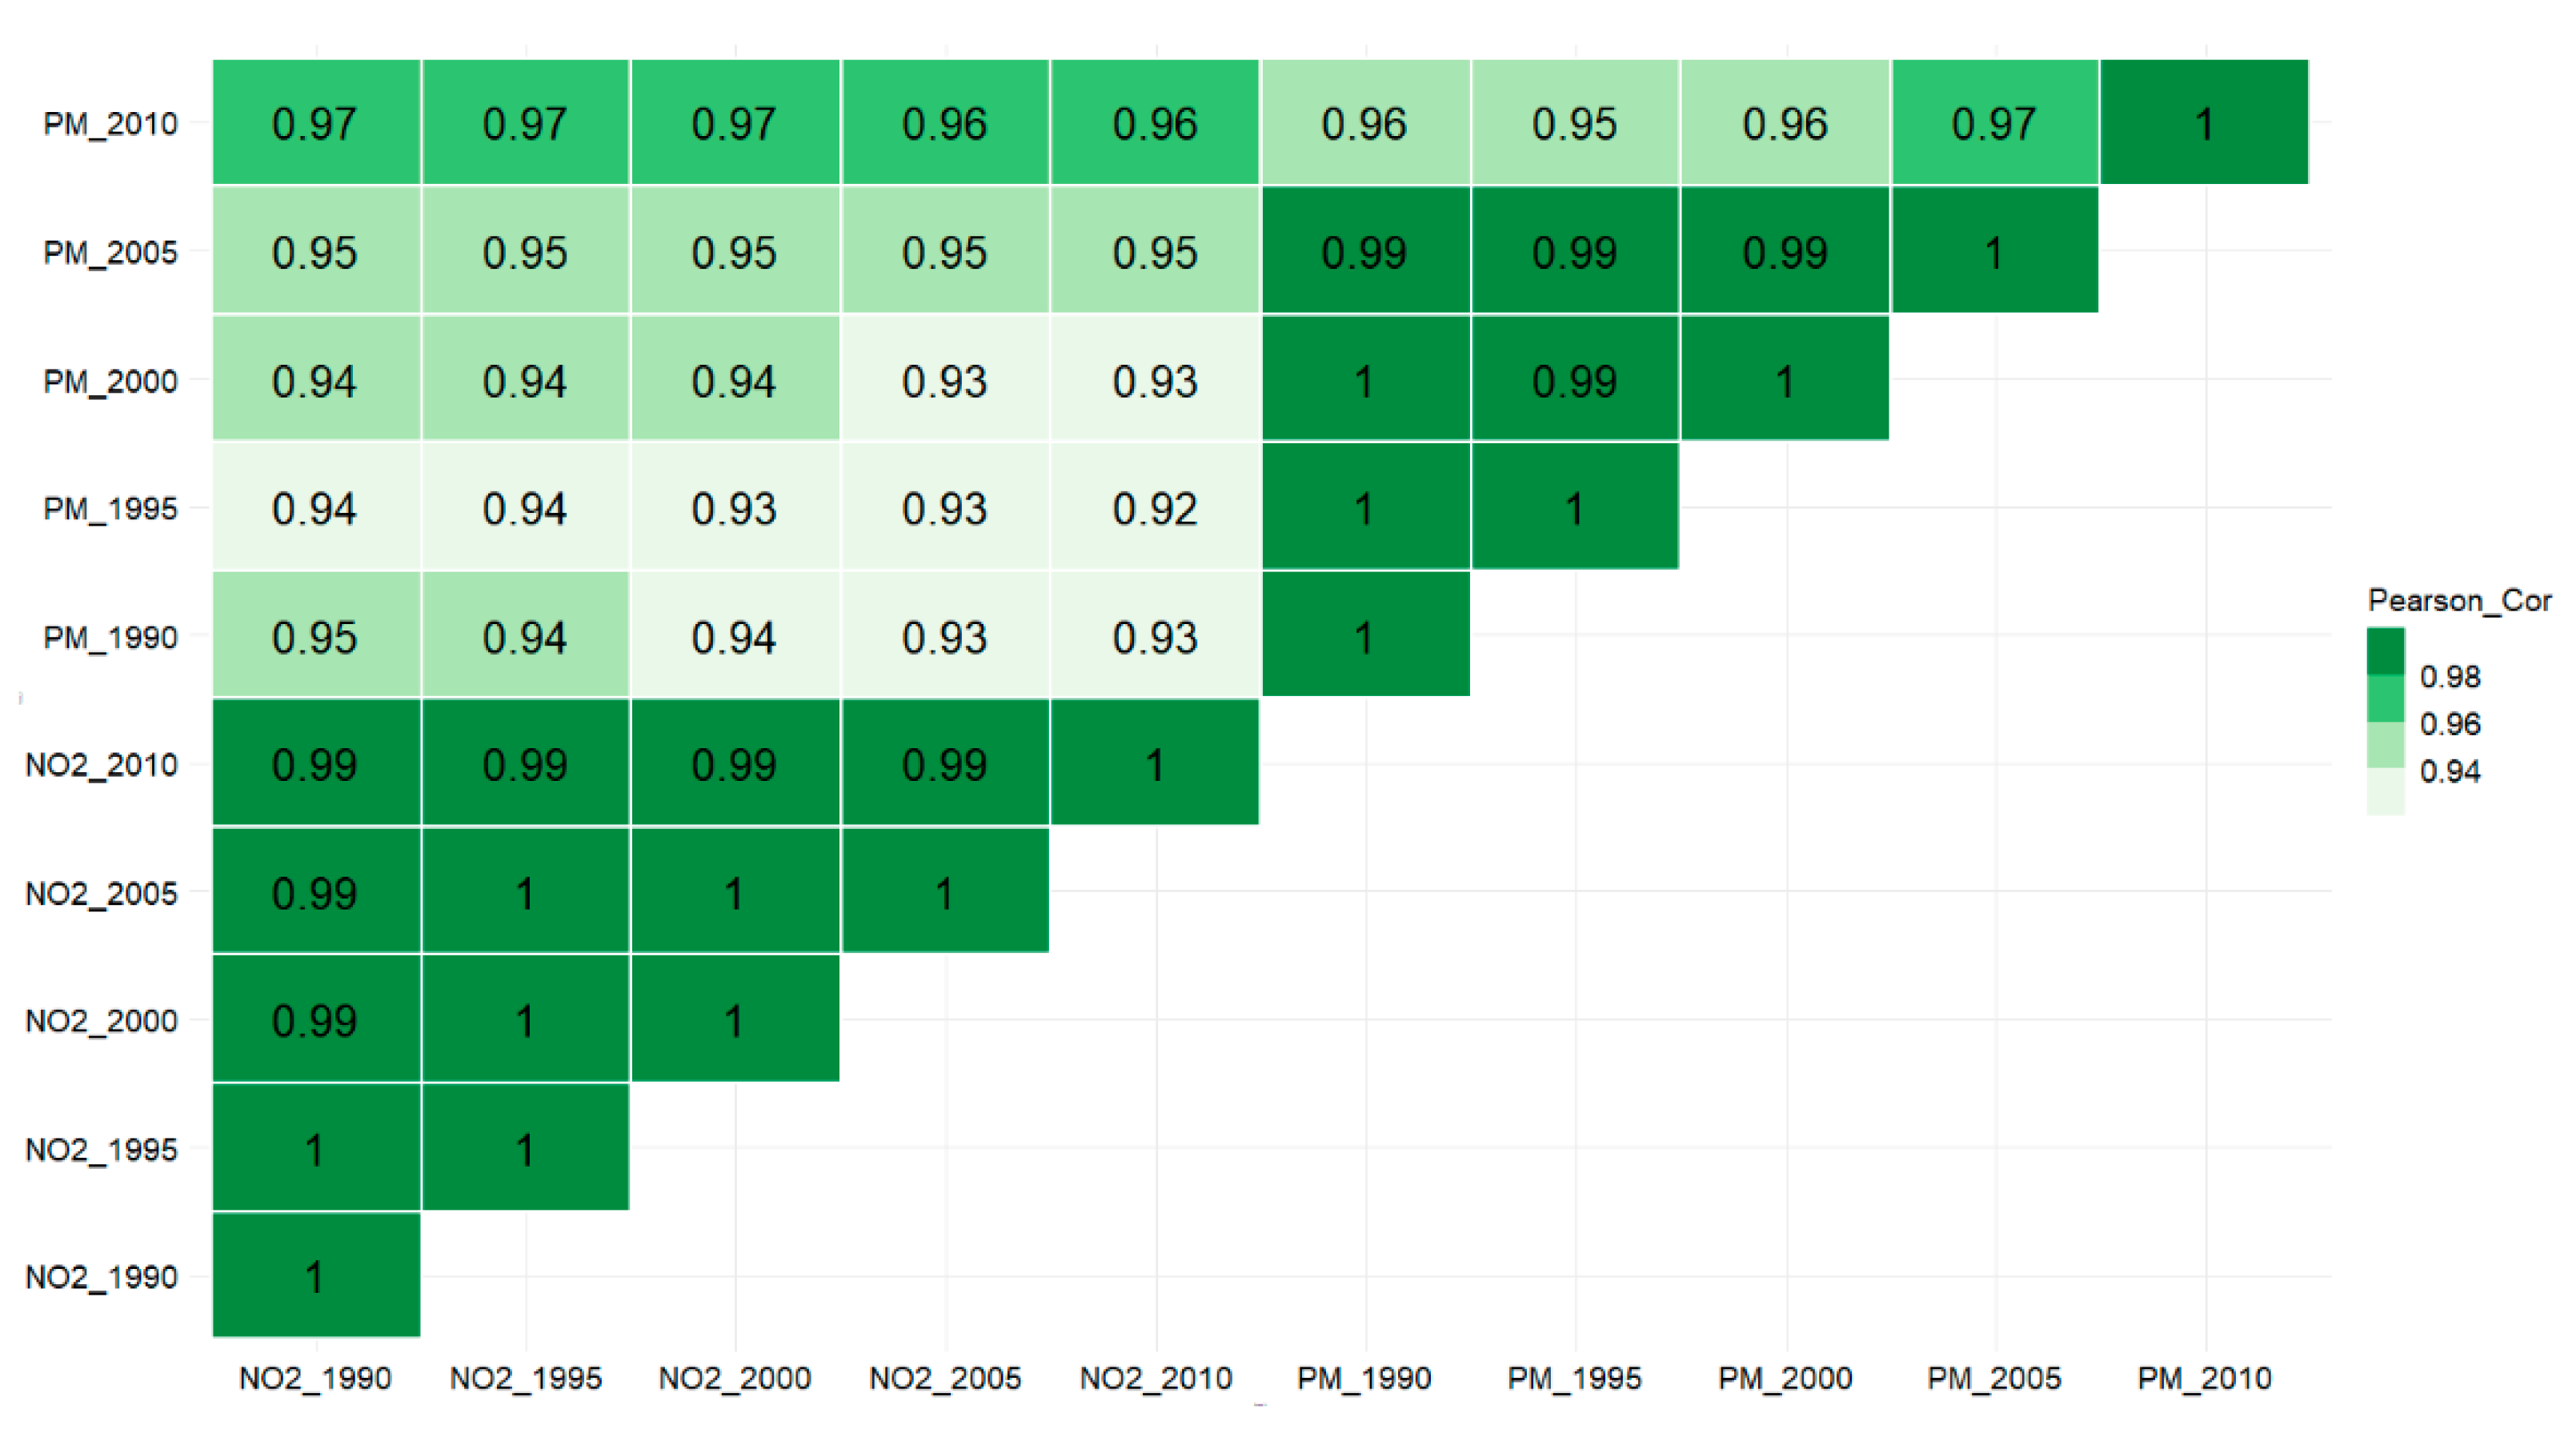
We observed that subjects’ exposures to NO2 for the different years of the study period are highly correlated with each other, with a Pearson’s coefficient close to 1 (Figure 6). The results were similar for PM10 with a Pearson’s coefficient always equal to or greater than 0.95. This implies that any year of the study period was a very good indicator of the subject’s exposure for any other years. In addition, these results also indicated that, in a densely populated urban area, NO2 is a pertinent predictor of PM10 exposure and vice versa, regardless of the year of the study period (minimum coefficient value: 0.93). Among the five years considered here, the best results were however obtained for the most recent year (2010) for both pollutants.
A previous study of exposure to air pollution in France from 1989 to 2007 [49] estimated Pearson correlation coefficients between air pollutant concentrations at a 2 km resolution. As observed in our study, their results also showed a strongly similar spatial distribution of NO2 concentrations over the different years studied (correlation coefficients above 0.97). On the other hand, the correlation observed between PM10 concentrations was less strong than in our study (from 0.63 to 0.87). Similarly, the correlations between PM10 and NO2 concentrations were less marked than in our study (around 0.74).
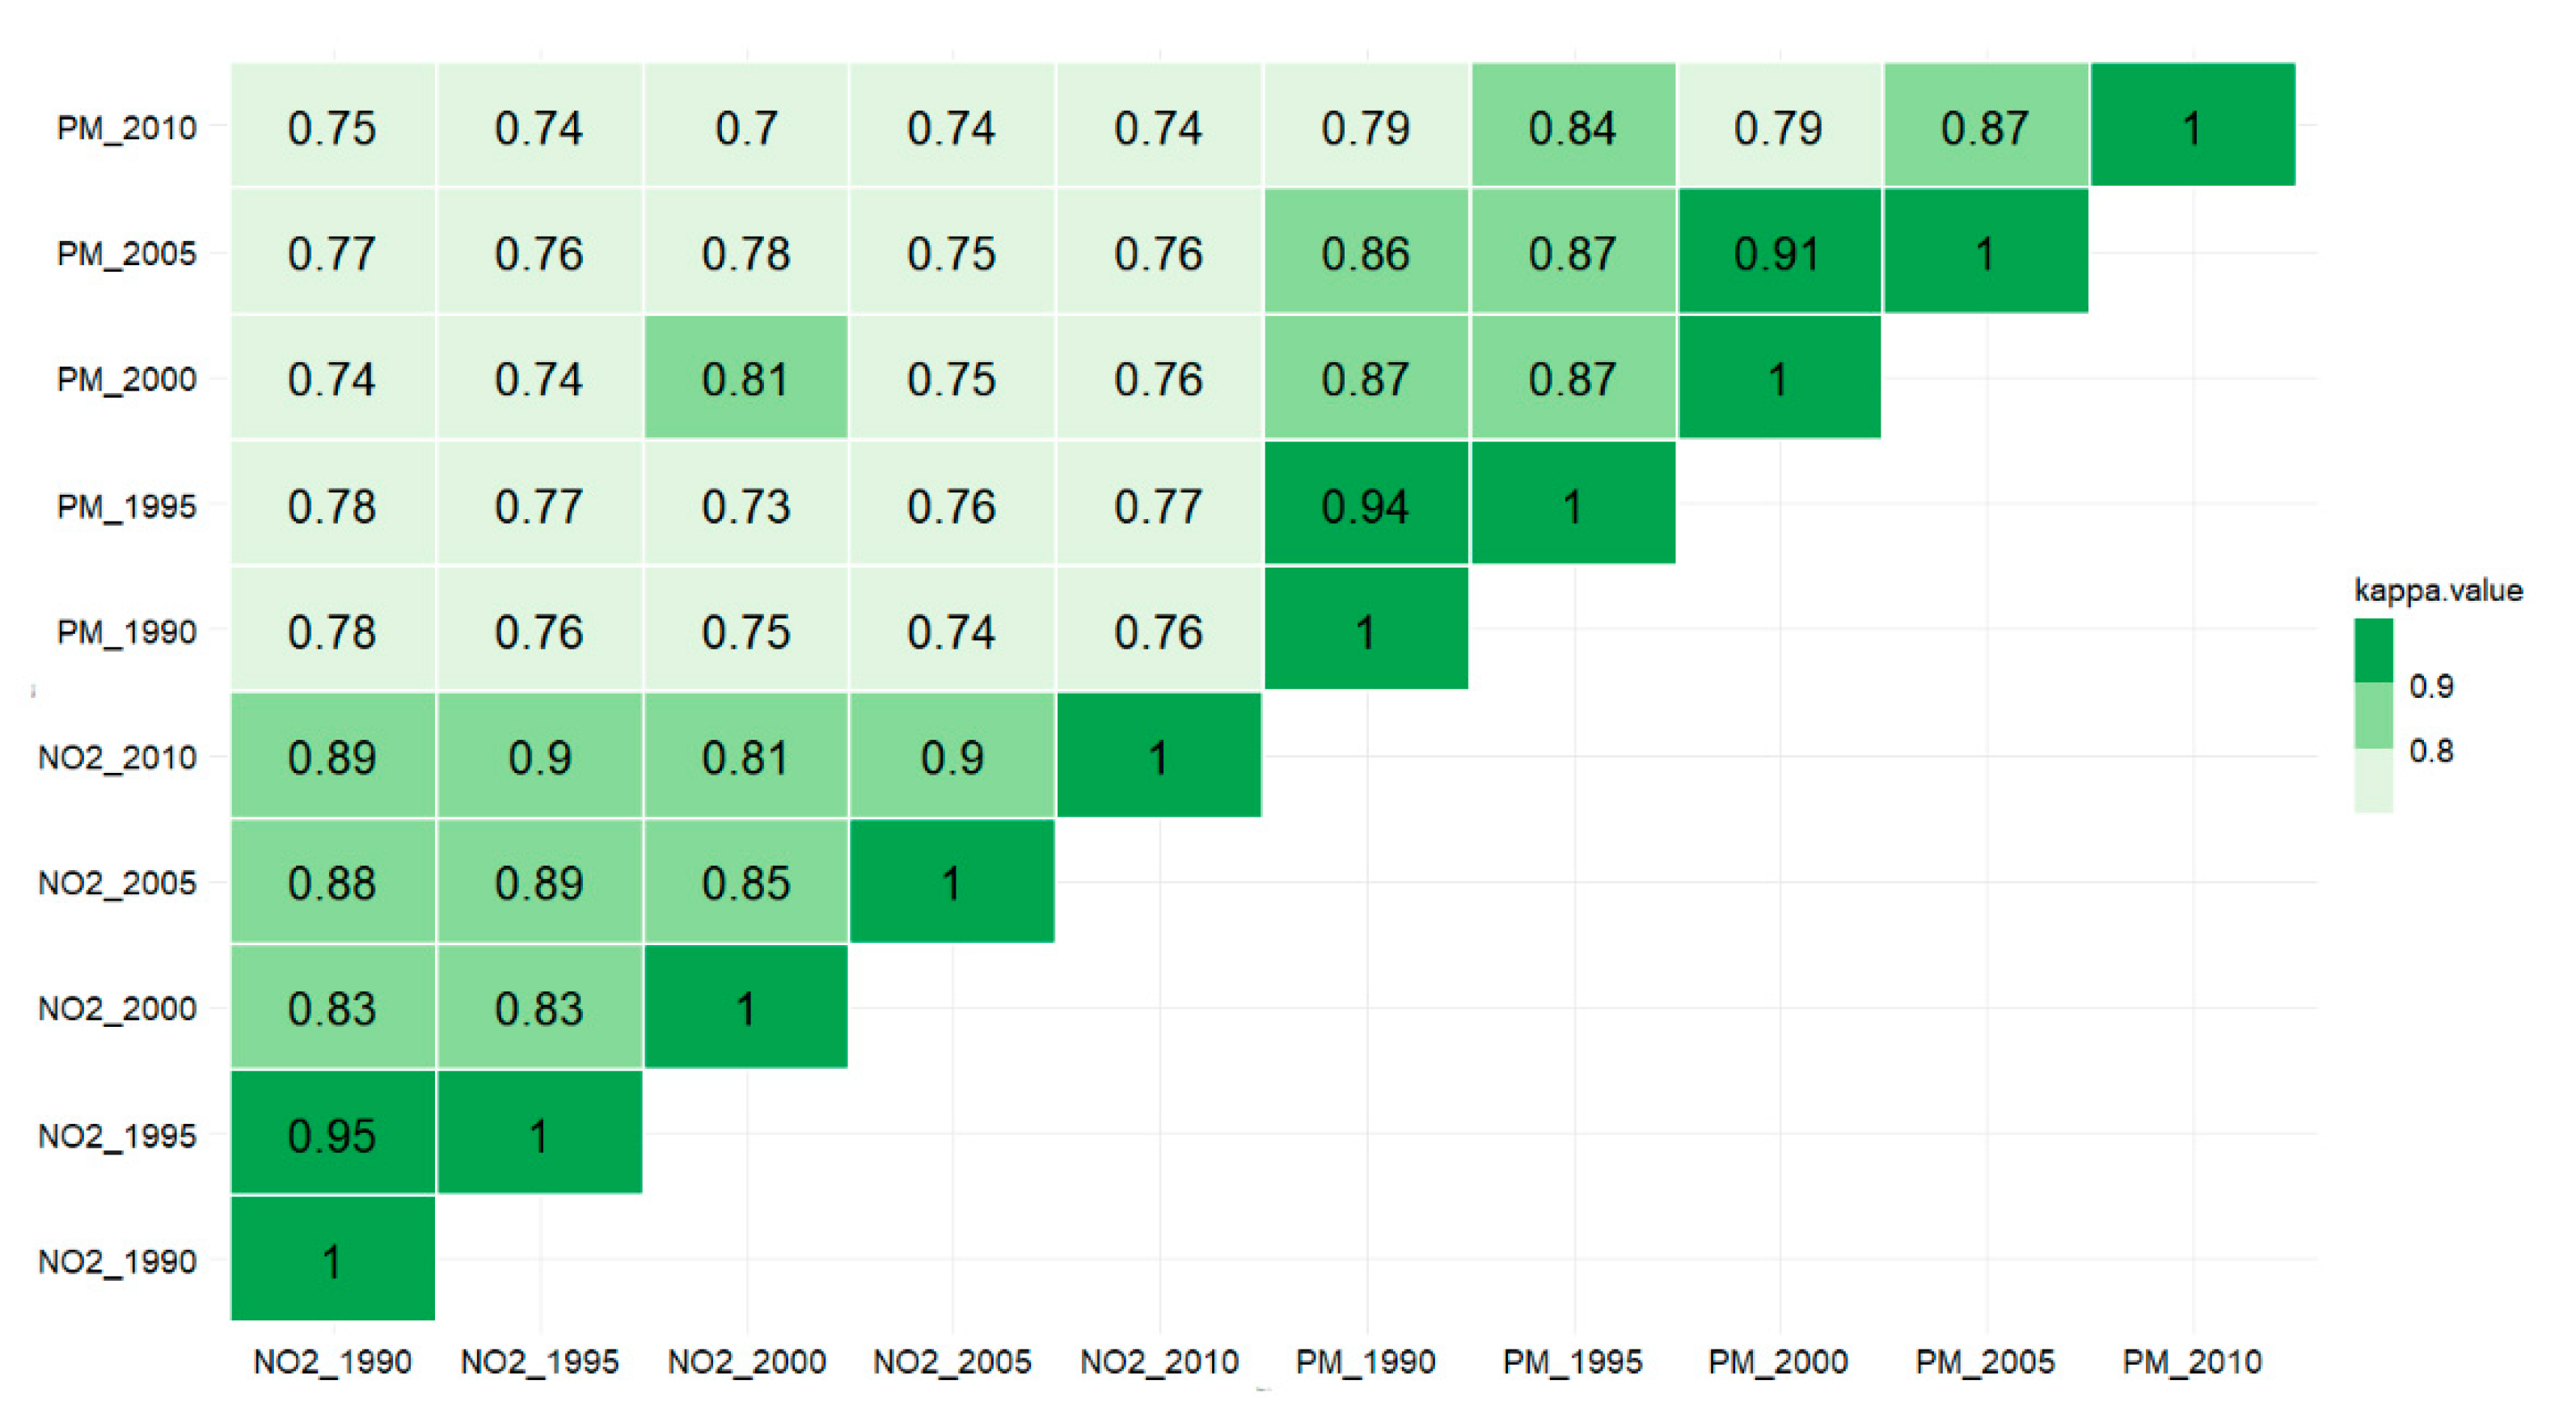
The analyses of the group classification agreement (Figure 7) also showed good results. For NO2, the agreement (kappa coefficients) between the years varied from 0.81 to 0.95, while for PM10, the values varied from 0.79 to 0.94 with only two pairs of years below 0.8 (1990 vs. 2010 and 2010 vs. 2000). A Kappa coefficient between 0.6 and 0.8 indicates a “strong” agreement between the two classifications, while a value above 0.8 indicates an “almost perfect” agreement. The agreement between the PM10 and NO2 group classifications varies from 0.70 to 0.81. For both pollutants individually, the weakest agreements were observed for the year 2000, whereas for the NO2 vs PM10 comparisons, the strongest agreement was observed in 2000.

4. Conclusions

In the framework of a case-control study on the effects of long-term air pollution exposure on breast cancer risk [20], we modelled ground-level air concentrations of PM10 and NO2 over a large European metropolitan area and over the 20 year period at a very fine resolution.
To our knowledge, this is the first study assessing the spatiotemporal variability of PM10 and NO2 concentrations over two decades in a large urban area, with a fine spatial resolution (10 × 10 m), using an urban dispersion model. Modelling results were compared to the available field measurements over the whole study period and were subsequently used to assess exposure at individual residence locations.
A preliminary analysis concerned the role of different typologies to be used as background concertation in the numerical simulations. Notably, for the year 2010, only the background concertation was provided by field measurements and by the output of a regional dispersion model (CHIMERE). Our local-scale modelling results show similar performance when focusing on NO2 concentrations. Larger discrepancies can be instead observed for PM10 annual concentrations, which were shown to be underestimated when using CHIMERE data (−27%) as the background value. Despite this, our results show that, for 2010, both background data provide good performances for the SIRANE model.
The rest of the simulations over the twenty year study period were then performed CHIMERE data as background, since no measurements were available as background data. The comparison with field measurements showed that our modelling results were able to correctly predict annual concentrations over the majority of the study period. For NO2, except the year 1990, the mean deviation remained under 20%. For 1990, the large deviation observed could be related to the uncertainties inherent in the emission data before 2000 also to the large reduction in the number of available measuring stations (from 16 in 2000 to 5 in 1990). For PM10, the median deviation varied between 16.8% and 37.5%. A larger gap was observed for the year 1995. As for NO2, this could be explained by the uncertainties in the emission data and by the very low number of measuring stations (4 in 1995). We observed a high correlation that tended to decrease with the years from 0.82 to 0.59 for NO2 and from 0.84 to 0.71 for PM10.
We noted a systematic underestimate of PM10 concentrations all along the study period, which, as already observed in 2010, directly reflects the underestimation of background concentration as obtained by the CHIMERE output. We can therefore assert that our concern of producing results with a homogeneous methodology over the whole period, using modelled background values instead of measured values (unavailable after 2005), led to a lower model’s performance for PM10.
As expected, over the period 1990–2010, we observed a decrease in modelled concentrations (−48% in PM10 concentrations; −42% in NO2 concentrations). This decrease could be explained by the reduction in emissions due to technological improvements in emission control and increasingly strict regulations. This was a welcome development: the part of the territory exposed above the WHO recommendations has fallen from 26% to 2% for NO2 and from 100% to 7.7% for PM10. Nevertheless, in 2010 there were still a few hotspots in the LMA with concentrations above the WHO.
The study of the exposure of the members of the E3N cohort at their residential addresses makes it possible to refine these results. Although the proportion of the territory exposed to high concentrations has decreased, the most populated areas still are the areas most exposed to air pollution. Thus, even though the exposure at the subject’s residential addresses has fallen sharply (−30% NO2; 45% PM10), still 16% and 50% of addresses were exposed to concentrations exceeding the WHO guidelines for NO2 and PM10 in 2010.
To reconstruct exposures related to a specific pollutant, it is useful to know its degree of correlation with other pollutants perhaps more measured. It is interesting to note that, in our study, these were the same subjects’ addresses that were exposed to extreme concentrations of PM10 and NO2 over the years. Indeed, we observed a high degree of correlation of subjects’ exposures to PM10 and NO2 with Pearson coefficients ranging from 0.92 to 0.97. Likewise, the comparison of the exposure group rankings showed a “strong” agreement. Thus, in this study case, the NO2 data were good predictors of PM10 exposure and vice versa.
One of the main challenges faced by epidemiological studies is to accurately characterize chronic exposures. This is particularly important when these studies concern pathologies that develop with a latency period in relation to exposure (as for cancers). When exposure data are lacking, it is common practice to use exposure data from a single year and to make the assumption that these exposure data are representative of the whole study period [51]. In our case study, for both pollutants, the classification of subjects according to their exposure changed slightly over the years (Pearson coefficient > 0.94). The study of the exposure group rankings of the subjects showed a degree of agreement that can be described as “almost-perfect.” This indicates that, in this study, any year would be a good indicator of exposure for the study period for a given pollutant.
As a final step, it is worth mentioning the main limitations to our work. Firstly, the lack of background pollution measurement data over the whole period forced us to use modelled values as background values, which worsen the modelling results. This degradation is likely to be due to the uncertainties in providing reliable PM emissions data in the large-scale model. Secondly, the lack of local data on emissions for the decade 1990–2000 led us to use emission data with a lower spatial resolution (3 × 3 km). Thirdly, the number of available measurement data was very low in 1990 for both pollutants and in 1995 for PM10, which limited the analysis of the quality of the simulations before 2000.
At this stage, the results obtained in this study cannot be generalized and require to be confirmed by similar studies over other urban areas (with similar spatial and time resolutions). In particular, it would be interesting to see whether the high degree of correlation between exposures to PM10 and NO2 is actually influenced by the relatively small size of the territory studied and by the resolution of the model. This should be investigated in future researches by comparing multiple models in the same area and studying the implications on the misclassification of individuals’ exposure.
The information provided by our numerical results on the historical exposure of the E3N cohort subjects will be used to assess the accuracy of future national size models at the local scale and will improve the results of epidemiological studies.

Supplementary Materials

The following are available online at https://www.mdpi.com/2073-4433/12/2/239/s1, Supplementary materials 1 include Figure S1: Spatial distribution of the traffic sources for NO2 and PM10 in 2010, Figure S2: Spatial distribution of the punctual sources for NO2 and PM10 in 2010 and Figure S3: Spatial distribution of the surface distributed sources for NO2 and PM10 in 2010. Supplementary materials 2 include Figure S4: Spatial distribution of NO2 monitoring stations in 1990 and 2010 and Figure S5: Spatial distribution of PM10 monitoring stations in 1990 and 2010.

Author Contributions

Conceptualization, T.C., C.V.N. and P.S.; methodology, C.V.N. and T.C.; software, C.V.N., P.V., F.C. and L.S.; formal analysis, T.C. and C.V.N.; data curation, T.C., L.G., F.C. and C.V.N.; writing—original draft preparation, T.C. and, C.V.N.; writing—review and editing, T.C., C.V.N., B.F., L.G. and P.S.; visualization, L.G. and T.C.; supervision, P.S.; project administration, J.G., L.S., B.F., P.S. and F.R.M. All authors have read and agreed to the published version of the manuscript.

Funding

This research was supported by funding from The French National Research Program for Environmental and Occupational Health of Anses (2019/1/242), The Fondation de France (n° 00099899) and the ARC Foundations for Cancer Research. Thomas Coudon is supported by a post-doctoral grant from Fondation de France (n°00099901). The E3N cohort is financially supported by Ligue Contre le Cancer, the Mutuelle Générale de l’Education Nationale, the Institut Gustave Roussy and the Institut National de la Santé et de la Recherche.

Institutional Review Board Statement

Not applicable.

Informed Consent Statement

Not applicable.

Data Availability Statement

The simulation data presented in this study may be obtained on request from the corresponding author.

Acknowledgments

The authors thank all participants for providing data and physicians for providing pathology reports. We gratefully acknowledge the ATMO Auvergne Rhone-Alpes for providing air measurement and emissions data and the INERIS for providing concentrations and emissions data.

Conflicts of Interest

The authors declare no conflict of interest. The funders had no role in the design of the study; in the collection, analyses or interpretation of data; in the writing of the manuscript or in the decision to publish the results.

References

  1. Lallukka, T.; Millear, A.; Pain, A.; Cortinovis, M.; Giussani, G. GBD 2015 Mortality and Causes of Death Collaborators Global, Regional, and National Life Expectancy, All-Cause Mortality, and Cause-Specific Mortality for 249 Causes of Death, 1980-2015: A Systematic Analysis for the Global Burden of Disease Study 2015. Lancet 2016, 388, 1459–1544. [Google Scholar] [CrossRef] [Green Version]
  2. Lelieveld, J.; Klingmüller, K.; Pozzer, A.; Pöschl, U.; Fnais, M.; Daiber, A.; Münzel, T. Cardiovascular Disease Burden from Ambient Air Pollution in Europe Reassessed Using Novel Hazard Ratio Functions. Eur. Heart. J. 2019, 40, 1590–1596. [Google Scholar] [CrossRef] [Green Version]
  3. Benbrahim-Tallaa, L.; Baan, R.A.; Grosse, Y.; Lauby-Secretan, B.; El Ghissassi, F.; Bouvard, V.; Guha, N.; Loomis, D.; Straif, K. International Agency for Research on Cancer Monograph Working Group Carcinogenicity of Diesel-Engine and Gasoline-Engine Exhausts and Some Nitroarenes. Lancet Oncol. 2012, 13, 663–664. [Google Scholar] [CrossRef] [Green Version]
  4. Loomis, D.; Grosse, Y.; Lauby-Secretan, B.; El Ghissassi, F.; Bouvard, V.; Benbrahim-Tallaa, L.; Guha, N.; Baan, R.; Mattock, H.; Straif, K.; et al. The Carcinogenicity of Outdoor Air Pollution. Lancet Oncol. 2013, 14, 1262–1263. [Google Scholar] [CrossRef]
  5. Forastiere, F.; Renzi, M.; Cesaroni, G.; Stafoggia, M.; Rodopolou, S.; Vienneau, D.; Andersen, Z.; De Hoogh, K.; Klompmaker, J.; Brunekreef, B.; et al. Low-Level Air Pollution and Natural Cause Mortality in Rome: Comparison of Results Based on European Wide and Local Land Use Regression Models within the ELAPSE Project. Environ. Epidemiol. 2019, 3, 125–126. [Google Scholar] [CrossRef]
  6. Johnson, M.; Brook, J.R.; Brook, R.D.; Oiamo, T.H.; Luginaah, I.; Peters, P.A.; Spence, J.D. Traffic-Related Air Pollution and Carotid Plaque Burden in a Canadian City With Low-Level Ambient Pollution. J. Am. Heart Assoc. 2020, 9, e013400. [Google Scholar] [CrossRef]
  7. Wolf, K.; Hoffmann, B.; Rodopolou, S.; de Hoogh, K.; Ljungman, P.; Samoli, E.; Hoek, G.; Bellander, T.; Peters, S.; Pershagen, G.; et al. Low-Level Air Pollution and Incidence of Asthma among Adults: Pooled Analysis of 2 European Cohorts in the ELAPSE Project. Environ. Epidemiol. 2019, 3, 246. [Google Scholar] [CrossRef]
  8. Vodonos, A.; Awad, Y.A.; Schwartz, J. The Concentration-Response between Long-Term PM2.5 Exposure and Mortality; A Meta-Regression Approach. Environ. Res. 2018, 166, 677–689. [Google Scholar] [CrossRef]
  9. Wolf, K.; Hoffmann, B.; Rodopolou, S.; de Hoogh, K.; Ljungman, P.; Samoli, E.; Hoek, G.; Bellander, T.; Peters, A.; Pershagen, G. Low-Level Air Pollution and Incidence of Acute Coronary Events: Pooled Analysis of 6 European Cohorts in the ELAPSE Project. Environ. Epidemiol. 2019, 3, 443. [Google Scholar] [CrossRef]
  10. Wei, Y.; Davis, J.; Bina, W.F. Ambient Air Pollution Is Associated with the Increased Incidence of Breast Cancer in US. Int. J. Environ. Health Res. 2012, 22, 12–21. [Google Scholar] [CrossRef]
  11. Hamra, G.B.; Laden, F.; Cohen, A.J.; Raaschou-Nielsen, O.; Brauer, M.; Loomis, D. Lung Cancer and Exposure to Nitrogen Dioxide and Traffic: A Systematic Review and Meta-Analysis. Environ. Health Perspect. 2015, 123, 1107–1112. [Google Scholar] [CrossRef]
  12. Hystad, P.; Villeneuve, P.J.; Goldberg, M.S.; Crouse, D.L.; Johnson, K. Exposure to Traffic-Related Air Pollution and the Risk of Developing Breast Cancer among Women in Eight Canadian Provinces: A Case–Control Study. Environ. Int. 2015, 74, 240–248. [Google Scholar] [CrossRef] [PubMed]
  13. Nie, J.; Beyea, J.; Bonner, M.R.; Han, D.; Vena, J.E.; Rogerson, P.; Vito, D.; Muti, P.; Trevisan, M.; Edge, S.B.; et al. Exposure to Traffic Emissions throughout Life and Risk of Breast Cancer: The Western New York Exposures and Breast Cancer (WEB) Study. Cancer Causes Control 2007, 18, 947–955. [Google Scholar] [CrossRef] [Green Version]
  14. Raaschou-Nielsen, O.; Andersen, Z.J.; Hvidberg, M.; Jensen, S.S.; Ketzel, M.; Sorensen, M.; Hansen, J.; Loft, S.; Overvad, K.; Tjonneland, A. Air Pollution from Traffic and Cancer Incidence: A Danish Cohort Study. Environ. Health 2011, 10, 67. [Google Scholar] [CrossRef] [Green Version]
  15. Turner, M.C.; Krewski, D.; Diver, W.R.; Pope, C.A., III; Burnett, R.T.; Jerrett, M.; Marshall, J.D.; Gapstur, S.M. Ambient Air Pollution and Cancer Mortality in the Cancer Prevention Study II. Environ. Health Perspect. 2017, 125, 087013. [Google Scholar] [CrossRef] [Green Version]
  16. Hoek, G.; Beelen, R.; de Hoogh, K.; Vienneau, D.; Gulliver, J.; Fischer, P.; Briggs, D. A Review of Land-Use Regression Models to Assess Spatial Variation of Outdoor Air Pollution. Atmos. Environ. 2008, 42, 7561–7578. [Google Scholar] [CrossRef]
  17. Soulhac, L.; Puel, C.; Duclaux, O.; Perkins, R.J. Simulations of Atmospheric Pollution in Greater Lyon an Example of the Use of Nested Models. Atmos. Environ. 2003, 37, 5147–5156. [Google Scholar] [CrossRef]
  18. Basagana, X.; Aguilera, I.; Rivera, M.; Agis, D.; Foraster, M.; Marrugat, J.; Elosua, R.; Kuenzli, N. Measurement Error in Epidemiologic Studies of Air Pollution Based on Land-Use Regression Models. Am. J. Epidemiol. 2013, 178, 1342–1346. [Google Scholar] [CrossRef] [Green Version]
  19. Cordioli, M.; Ranzi, A.; De Leo, G.A.; Lauriola, P. A Review of Exposure Assessment Methods in Epidemiological Studies on Incinerators. J. Environ. Public Health 2013. [Google Scholar] [CrossRef] [PubMed] [Green Version]
  20. Amadou, A.; Praud, D.; Coudon, T.; Danjou, A.M.N.; Faure, E.; Leffondré, K.; Le Romancer, M.; Severi, G.; Salizzoni, P.; Mancini, F.R.; et al. Chronic Long-Term Exposure to Cadmium Air Pollution and Breast Cancer Risk in the French E3N Cohort. Int. J. Cancer 2020, 146, 341–351. [Google Scholar] [CrossRef]
  21. Clavel-Chapelon, F. Cohort Profile: The French E3N Cohort Study. Int. J. Epidemiol. 2015, 44, 801–809. [Google Scholar] [CrossRef] [PubMed]
  22. Coudon, T.; Hourani, H.; Nguyen, C.; Faure, E.; Mancini, F.R.; Fervers, B.; Salizzoni, P. Assessment of Long-Term Exposure to Airborne Dioxin and Cadmium Concentrations in the Lyon Metropolitan Area (France). Environ. Int. 2018, 111, 177–190. [Google Scholar] [CrossRef] [PubMed]
  23. Soulhac, L.; Salizzoni, P.; Cierco, F.-X.; Perkins, R. The Model SIRANE for Atmospheric Urban Pollutant Dispersion; Part I, Presentation of the Model. Atmos. Environ. 2011, 45, 7379–7395. [Google Scholar] [CrossRef]
  24. Soulhac, L.; Salizzoni, P.; Mejean, P.; Perkins, R.J. Parametric Laws to Model Urban Pollutant Dispersion with a Street Network Approach. Atmos. Environ. 2013, 67, 229–241. [Google Scholar] [CrossRef]
  25. Soulhac, L.; Perkins, R.J.; Salizzoni, P. Flow in a Street Canyon for Any External Wind Direction. Bound. Layer Meteorol. 2008, 126, 365–388. [Google Scholar] [CrossRef]
  26. Soulhac, L.; Garbero, V.; Salizzoni, P.; Mejean, P.; Perkins, R.J. Flow and Dispersion in Street Intersections. Atmos. Environ. 2009, 43, 2981–2996. [Google Scholar] [CrossRef]
  27. Salizzoni, P.; Soulhac, L.; Mejean, P. Street Canyon Ventilation and Atmospheric Turbulence. Atmos. Environ. 2009, 43, 5056–5067. [Google Scholar] [CrossRef]
  28. Seinfeld, J.H. ES Books: Atmospheric Chemistry and Physics of Air Pollution. Available online: https://pubs.acs.org/doi/pdf/10.1021/es00151a602 (accessed on 9 December 2020).
  29. Salem, N.B.; Garbero, V.; Salizzoni, P.; Lamaison, G.; Soulhac, L. Modelling Pollutant Dispersion in a Street Network. Boundary-Layer Meteorol. 2015, 155, 157–187. [Google Scholar] [CrossRef]
  30. Carpentieri, M.; Salizzoni, P.; Robins, A.; Soulhac, L. Evaluation of a Neighbourhood Scale, Street Network Dispersion Model through Comparison with Wind Tunnel Data. Environ. Modell. Softw. 2012, 37, 110–124. [Google Scholar] [CrossRef] [Green Version]
  31. Soulhac, L.; Nguyen, C.V.; Volta, P.; Salizzoni, P. The Model SIRANE for Atmospheric Urban Pollutant Dispersion. PART III: Validation against NO2 Yearly Concentration Measurements in a Large Urban Agglomeration. Atmos. Environ. 2017, 167, 377–388. [Google Scholar] [CrossRef]
  32. Soulhac, L.; Salizzoni, P.; Mejean, P.; Didier, D.; Rios, I. The Model SIRANE for Atmospheric Urban Pollutant Dispersion; PART II, Validation of the Model on a Real Case Study. Atmos. Environ 2012, 49, 320–337. [Google Scholar] [CrossRef]
  33. Bo, M.; Charvolin-Volta, P.; Clerico, M.; Nguyen, C.V.; Pognant, F.; Soulhac, L.; Salizzoni, P. Urban Air Quality and Meteorology on Opposite Sides of the Alps: The Lyon and Torino Case Studies. Urban Clim. 2020, 34, 100698. [Google Scholar] [CrossRef]
  34. Dėdelė, A.; Miškinytė, A. The Statistical Evaluation and Comparison of ADMS-Urban Model for the Prediction of Nitrogen Dioxide with Air Quality Monitoring Network. Environ. Monit. Assess. 2015, 187, 578. [Google Scholar] [CrossRef] [PubMed]
  35. Giambini, P.; Salizzoni, P.; Soulhac, L.; Corti, A. H13-216 Air quality modelling system for traffic scenario analysis in florence: Model validation and identification of critical issues. In Proceedings of the 13th International Conference on Harmonisation within Atmospheric Dispersion Modelling for Regulatory Purposes, Paris, France, 1–4 June 2010; p. 5. [Google Scholar]
  36. Tchepel, O.; Costa, A.M.; Martins, H.; Ferreira, J.; Monteiro, A.; Miranda, A.I.; Borrego, C. Determination of Background Concentrations for Air Quality Models Using Spectral Analysis and Filtering of Monitoring Data. Atmos. Environ. 2010, 44, 106–114. [Google Scholar] [CrossRef]
  37. Pineda Rojas, A.L.; Venegas, L.E. Upgrade of the DAUMOD Atmospheric Dispersion Model to Estimate Urban Background NO2 Concentrations. Atmos. Res. 2013, 120–121, 147–154. [Google Scholar] [CrossRef]
  38. Silver, J.D.; Brandt, J.; Hvidberg, M.; Frydendall, J.; Christensen, J.H. Assimilation of OMI NO2 Retrievals into the Limited-Area Chemistry-Transport Model DEHM (V2009.0) with a 3-D OI Algorithm. Geosci. Model Dev. 2013, 6, 1–16. [Google Scholar] [CrossRef] [Green Version]
  39. Menut, L.; Bessagnet, B.; Khvorostyanov, D.; Beekmann, M.; Blond, N.; Colette, A.; Coll, I.; Curci, G.; Foret, G.; Hodzic, A.; et al. CHIMERE 2013: A Model for Regional Atmospheric Composition Modelling. Geosci. Model Dev. 2013, 6, 981–1028. [Google Scholar] [CrossRef] [Green Version]
  40. WHO Air Quality Guidelines. Global Update 2005. Particulate Matter, Ozone, Nitrogen Dioxide and Sulfur Dioxide. Available online: https://www.euro.who.int/en/health-topics/environment-and-health/Housing-and-health/publications/pre-2009/air-quality-guidelines.-global-update-2005.-particulate-matter,-ozone,-nitrogen-dioxide-and-sulfur-dioxide (accessed on 19 October 2020).
  41. Datzmann, T.; Markevych, I.; Trautmann, F.; Heinrich, J.; Schmitt, J.; Tesch, F. Outdoor Air Pollution, Green Space, and Cancer Incidence in Saxony: A Semi-Individual Cohort Study. BMC Public Health 2018, 18, 715. [Google Scholar] [CrossRef] [PubMed]
  42. Reding, K.W.; Young, M.T.; Szpiro, A.A.; Han, C.J.; DeRoo, L.A.; Weinberg, C.; Kaufman, J.D.; Sandler, D.P. Breast Cancer Risk in Relation to Ambient Air Pollution Exposure at Residences in the Sister Study Cohort. Cancer Epidemiol. Biomark. Prev. 2015, 24, 1907–1909. [Google Scholar] [CrossRef] [PubMed] [Green Version]
  43. White, A.J.; O’Brien, K.M.; Niehoff, N.M.; Carroll, R.; Sandler, D.P. Metallic Air Pollutants and Breast Cancer Risk in a Nationwide Cohort Study. Epidemiology 2019, 30, 20–28. [Google Scholar] [CrossRef]
  44. Viera, A.J.; Garrett, J.M. Understanding Interobserver Agreement: The Kappa Statistic. Fam. Med. 2005, 37, 360–363. [Google Scholar]
  45. Nguyen, C.V. Assimilation de Données et Couplage d’échelles Pour La Simulation de La Dispersion Atmosphérique En Milieu Urbain. Ph.D. Thesis, Université de Lyon, Ecole Doctorale MEGA, Lyon, France, 2017. [Google Scholar]
  46. Sally Liu, L.-J.; Tsai, M.-Y.; Keidel, D.; Gemperli, A.; Ineichen, A.; Hazenkamp-von Arx, M.; Bayer-Oglesby, L.; Rochat, T.; Künzli, N.; Ackermann-Liebrich, U.; et al. Long-Term Exposure Models for Traffic Related NO2 across Geographically Diverse Areas over Separate Years. Atmos. Environ. 2012, 46, 460–471. [Google Scholar] [CrossRef]
  47. Yanosky, J.D.; Paciorek, C.J.; Laden, F.; Hart, J.E.; Puett, R.C.; Liao, D.; Suh, H.H. Spatio-Temporal Modeling of Particulate Air Pollution in the Conterminous United States Using Geographic and Meteorological Predictors. Environ. Health 2014, 13, 63. [Google Scholar] [CrossRef] [PubMed] [Green Version]
  48. Hvidtfeldt, U.A.; Sørensen, M.; Geels, C.; Ketzel, M.; Khan, J.; Tjønneland, A.; Overvad, K.; Brandt, J.; Raaschou-Nielsen, O. Long-Term Residential Exposure to PM2.5, PM10, Black Carbon, NO2, and Ozone and Mortality in a Danish Cohort. Environ. Int. 2019, 123, 265–272. [Google Scholar] [CrossRef] [PubMed]
  49. Bentayeb, M.; Stempfelet, M.; Wagner, V.; Zins, M.; Bonenfant, S.; Songeur, C.; Sanchez, O.; Rosso, A.; Brulfert, G.; Rios, I.; et al. Retrospective Modeling Outdoor Air Pollution at a Fine Spatial Scale in France, 1989–2008. Atmos. Environ. 2014, 92, 267–279. [Google Scholar] [CrossRef]
  50. Riviere, E.; Bernard, J.; Hulin, A.; Virga, J.; Dugay, F.; Charles, M.-A.; Cheminat, M.; Cortinovis, J.; Ducroz, F.; Laborie, A.; et al. Air Pollution Modeling and Exposure Assessment during Pregnancy in the French Longitudinal Study of Children (ELFE). Atmos. Environ. 2019, 205, 103–114. [Google Scholar] [CrossRef]
  51. Ancona, C.; Badaloni, C.; Mataloni, F.; Bolignano, A.; Bucci, S.; Cesaroni, G.; Sozzi, R.; Davoli, M.; Forastiere, F. Mortality and Morbidity in a Population Exposed to Multiple Sources of Air Pollution: A Retrospective Cohort Study Using Air Dispersion Models. Environ. Res. 2015, 137, 467–474. [Google Scholar] [CrossRef] [PubMed] [Green Version]
Figure 1. The Lyon metropolitan area (LMA). The figure shows the locations of the measurement stations and street network (street canyons in purple lines).
Atmosphere 12 00239 g001
Figure 2. Comparison between modelled and measured NO2 (A) and PM10 (B) annual mean concentration at the monitoring stations.
Atmosphere 12 00239 g002
Figure 3. Evolution over time of annual mean NO2 concentration (µg/m3), with a 10 × 10 m resolution, in 1990, 2000 and 2010 in the LMA.
Atmosphere 12 00239 g003
Figure 4. Evolution over time of annual mean PM10 concentration (µg/m3), with a 10 × 10 m resolution, in 1990, 2000 and 2010 in the LMA.
Atmosphere 12 00239 g004
Figure 5. Boxplot of annual concentrations, NO2 (a) and PM10 (b), simulated at the subjects’ location over time.
Atmosphere 12 00239 g005
Figure 6. Pearson correlation coefficient between subjects ‘exposure to PM10 and subject’s exposure to NO2 (using Pearson correlation coefficient).
Atmosphere 12 00239 g006
Figure 7. Agreement on the classification of subjects into five groups according to their exposure (using the Cohen’s kappa).
Atmosphere 12 00239 g007
Table 1. Comparison of NO2 annual mean concentrations modelled with SIRANE (Cp), using two set of background data and concentrations measured at the monitoring stations (Cm).
Background Data from the St Exupery LocationNumber of
Stations
C p ¯   ( S D ) C m ¯   ( S D ) ( | C p C m | C m ) ¯
Measured concentrations 1533.5 (14.5)39.7 (18)18.3%0.82
Simulated concentrations 35.2 (14.5)15.7%0.82
Table 2. Comparison of PM10 annual mean concentrations modelled with SIRANE (Cp), using two set of background data and concentrations measured at the monitoring stations (Cm).
Background Data from the St Exupery Location Number of
Stations
C p ¯   ( S D ) C m ¯   ( S D ) ( | C p C m | C m ) ¯
Measured concentrations1330.1 (4.6)28.9 (4.2)4.8%0.85
Simulated concentrations21.0 (4.6)27.7%0.84
Table 3. Comparison of NO2 annual mean concentrations modelled with SIRANE (Cp) and concentrations measured at the monitoring stations (Cm).
YearsNumber of
Stations
C p ¯   ( S D ) C m ¯   ( S D ) ( | C p C m | C m ) ¯
1990556.0 (13.9)65.0 (39.0)90.4%0.41
19951655.0 (13.3)56.0 (18.2)15.8%0.59
20002048.9 (16.6)47.1 (15.1)19.2%0.67
20051747.2 (18.8)44.6 (15.3)17.3%0.75
20101535.2 (14.5)39.7 (18)15.7%0.82
Table 4. Comparison of PM10 annual mean concentrations modelled with SIRANE (Cp) and concentrations measured at the monitoring stations (Cm).
YearsNumber of
Stations
C p ¯   ( S D ) C m ¯   ( S D ) ( | C p C m | C m ) ¯
1990542.6 (6.5)52.1 (11.7)16.8%0.33
1995432.0 (8.3)51.2 (7.67)37.5%0.75
2000827.9 (6.4)35.2 (7.1)21.0%0.71
20051324.9 (5.6)33.5 (8.4)24.9%0.76
20101321.0 (4.6)28.9 (4.2)27.7%0.84
Table 5. Comparison of PM10 annual mean concentration modelled with CHIMERE (Cp) and measured (Cm) at the Saint-Exupéry background monitoring station for 2005 and 2010.
Years C p C m C m
2005−0.28
2010−0.37
Table 6. Annual mean concentration with standard deviation and percentage of the LMA with annual mean concentration exceeding the limit value mentioned by the WHO (40 µg/m3 for NO2 and 20 µg/m3 for PM10).
NO2PM10
Mean Annual Concentration (µg/m3) (SD)Proportion of Study Area above WHO RecommendationMean Annual Concentration (µg/m3) (SD)Proportion of Study Area above WHO Recommendation
199037.8 (11.1)26.5%33.8 (2.3)100%
199536.0 (11.5)22.9%26.9 (2.5)100%
200030.7 (9.6)11.7%21.9 (2.8)95.1%
200528.2 (9.7)9.0%20.8 (2.6)50.9%
201021.8 (7.1)2.2%17.5 (2.0)7.7%
Table 7. Annual median concentration with standard deviation at the subject location and proportion of subject addresses exposed above the World Health Organization (WHO) guidelines (40 µg/m3 for NO2 and 20 µg/m3 for PM10).
NO2PM10
Median (Min–Max) Concentrations at Subject AdressesProportion of Subject Exposed above WHO RecommendationMedian (Min–Max) Concentrations at Subject AdressesProportion of Subject Exposed above WHO Recommendation
199051.0 (29.5–102.4)79%36.3 (32.2–53.0)100%
199549.6 (27.8–105.6)76%29.6 (25.3–50.8)100%
200043.1 (24.1–90.5)59%25.1 (20.0–46.0)100%
200540.2 (21.7–84.2)51%23.7 (19.2–40.8)93%
201031.6 (16.5–62.1)16%20.0 (16.0–29.5)50%
Publisher’s Note: MDPI stays neutral with regard to jurisdictional claims in published maps and institutional affiliations.