
Overview of the French Operational Network for In Situ Observation of PM Chemical Composition and Sources in Urban Environments (CARA Program)

 ,
,  ,
,  , , ,
, , ,  , ,
, ,  , ,
, ,  , ,
, ,
Abstract
1. Introduction
- Document the chemistry and main sources of PM pollution events;
- Investigate peculiarities possibly leading to local PM10 threshold exceedances;
- Achieve long-term (≥1 y) source apportionment studies at various locations;
- Provide datasets useful for the validation of chemical transport models (CTMs);
- Trigger and/or support further research activities for a better knowledge on air quality fundamentals.
2. Experimental
2.1. PM10 Sampling Network
2.2. Online Monitoring Network
2.3. Data Processing
3. Inter-Laboratory Comparisons (ILC) Exercises
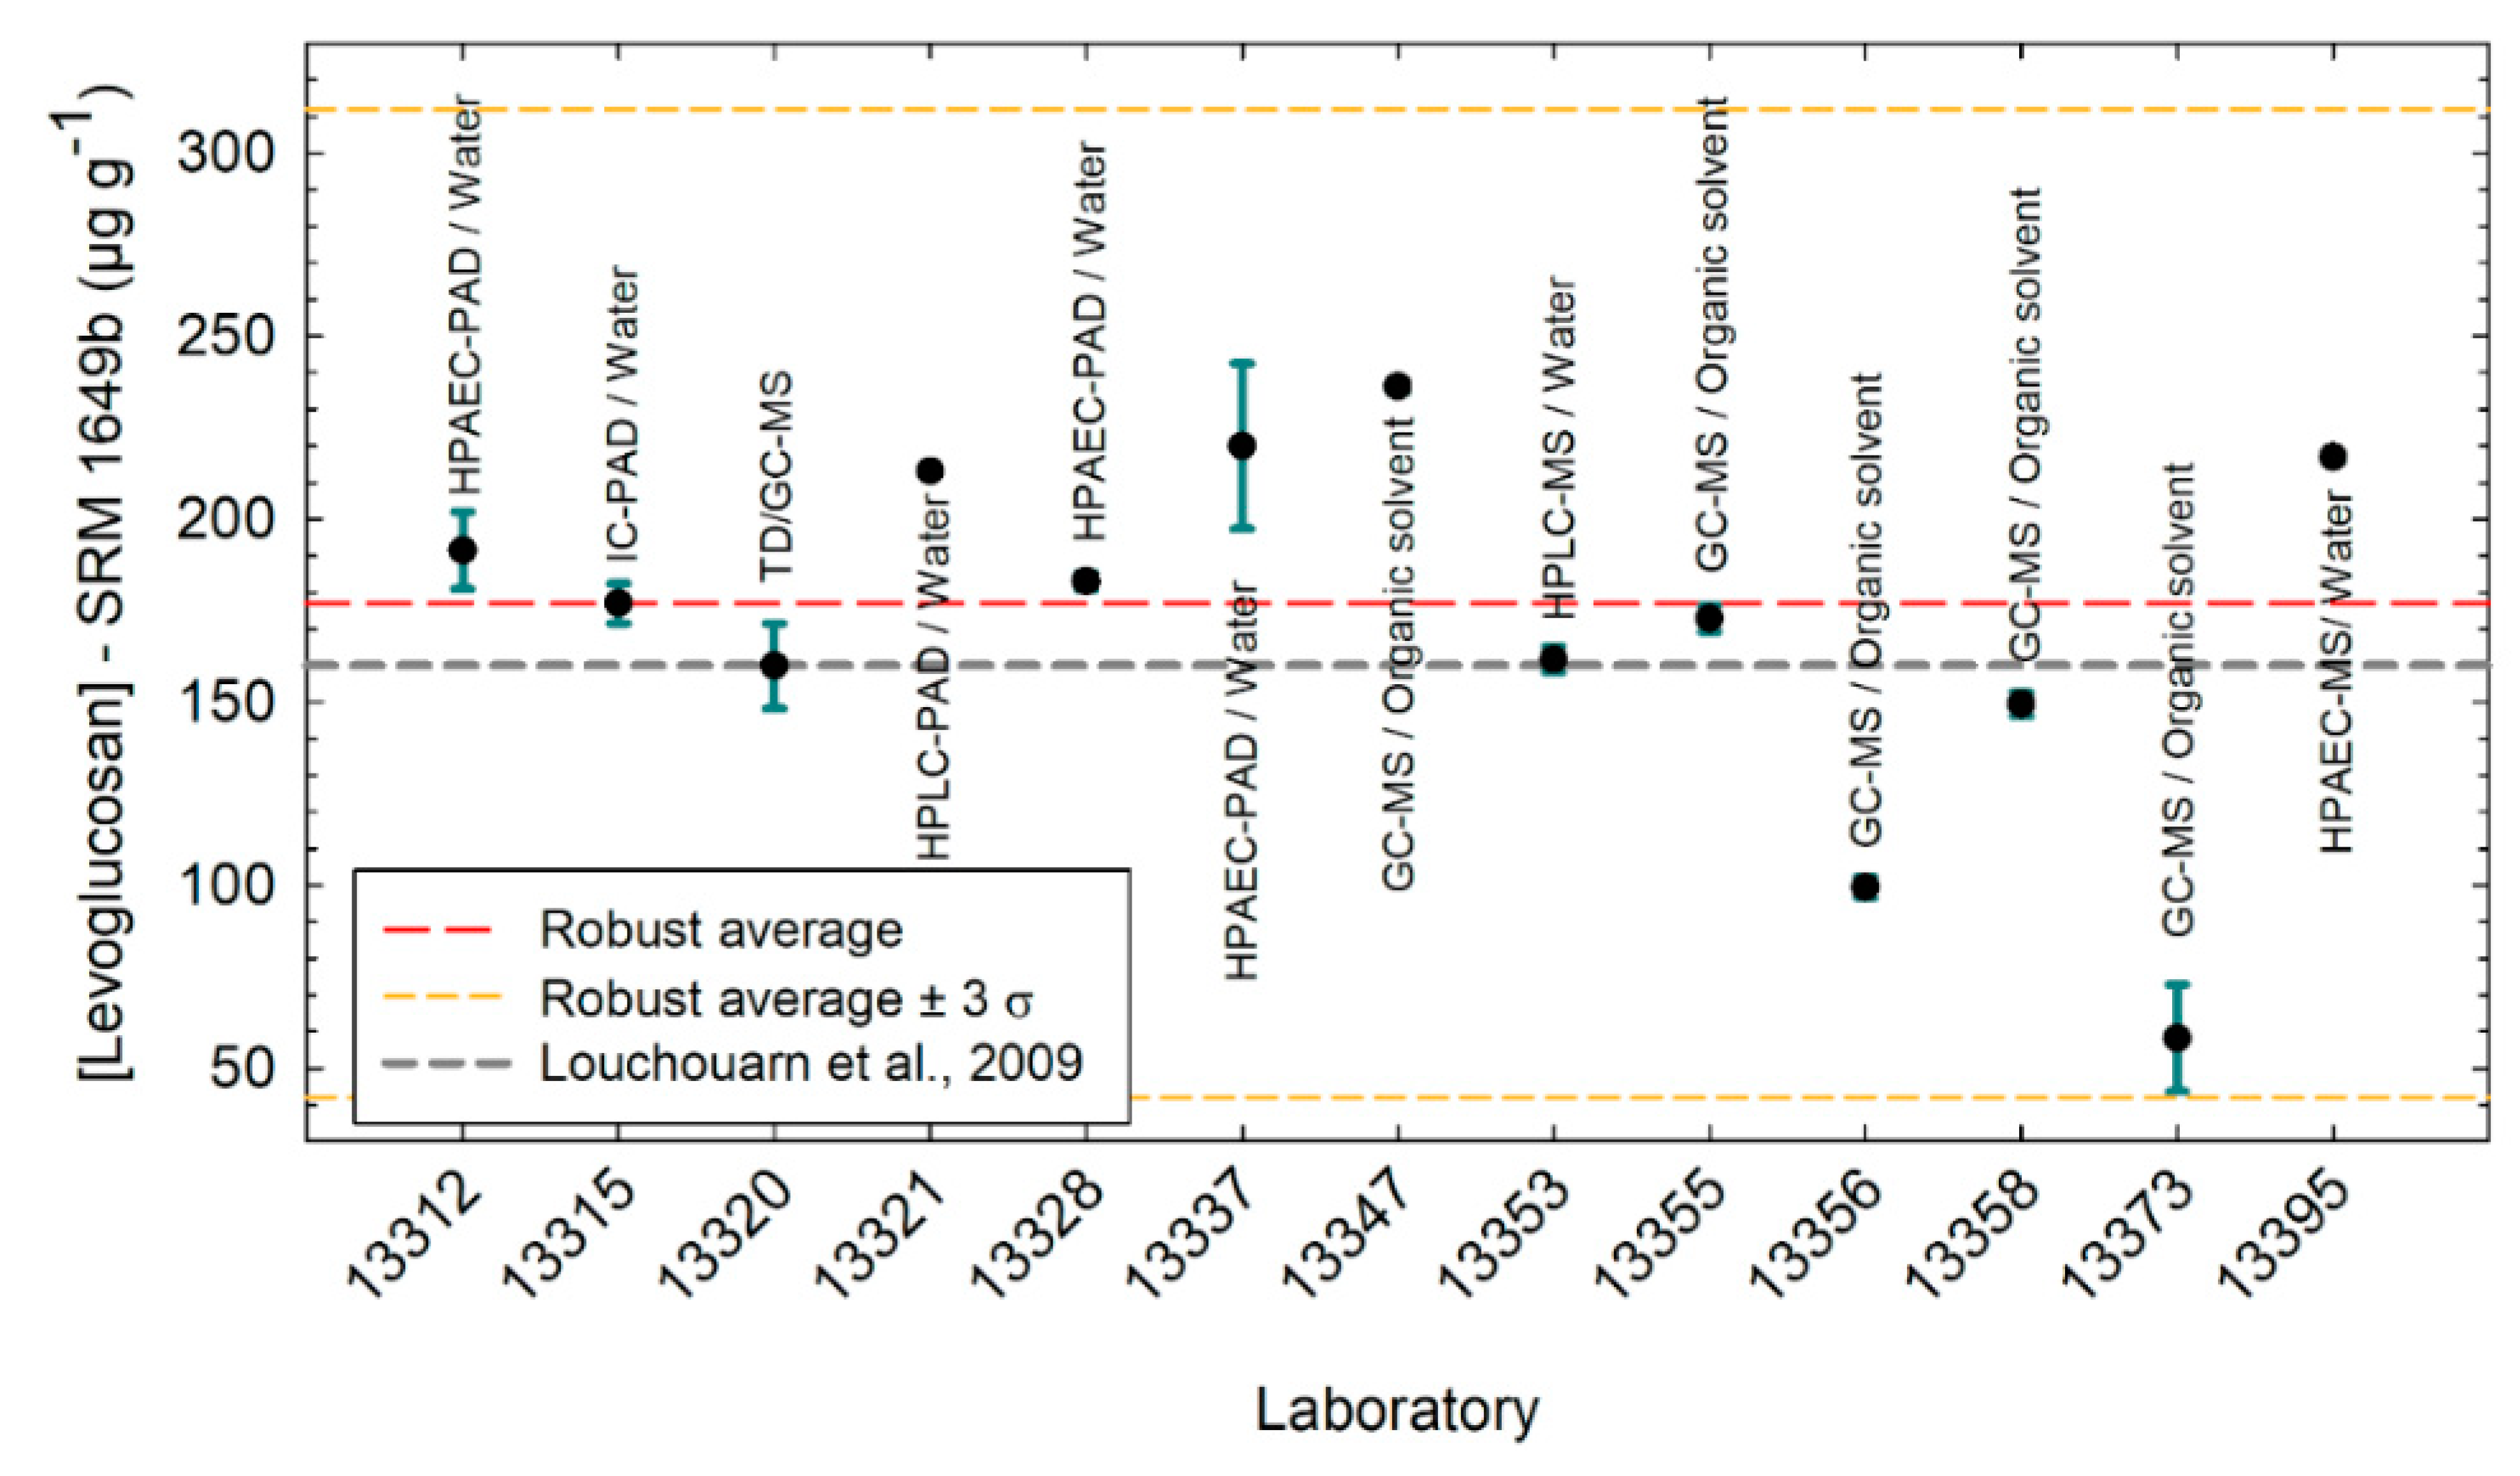
3.1. Levoglucosan
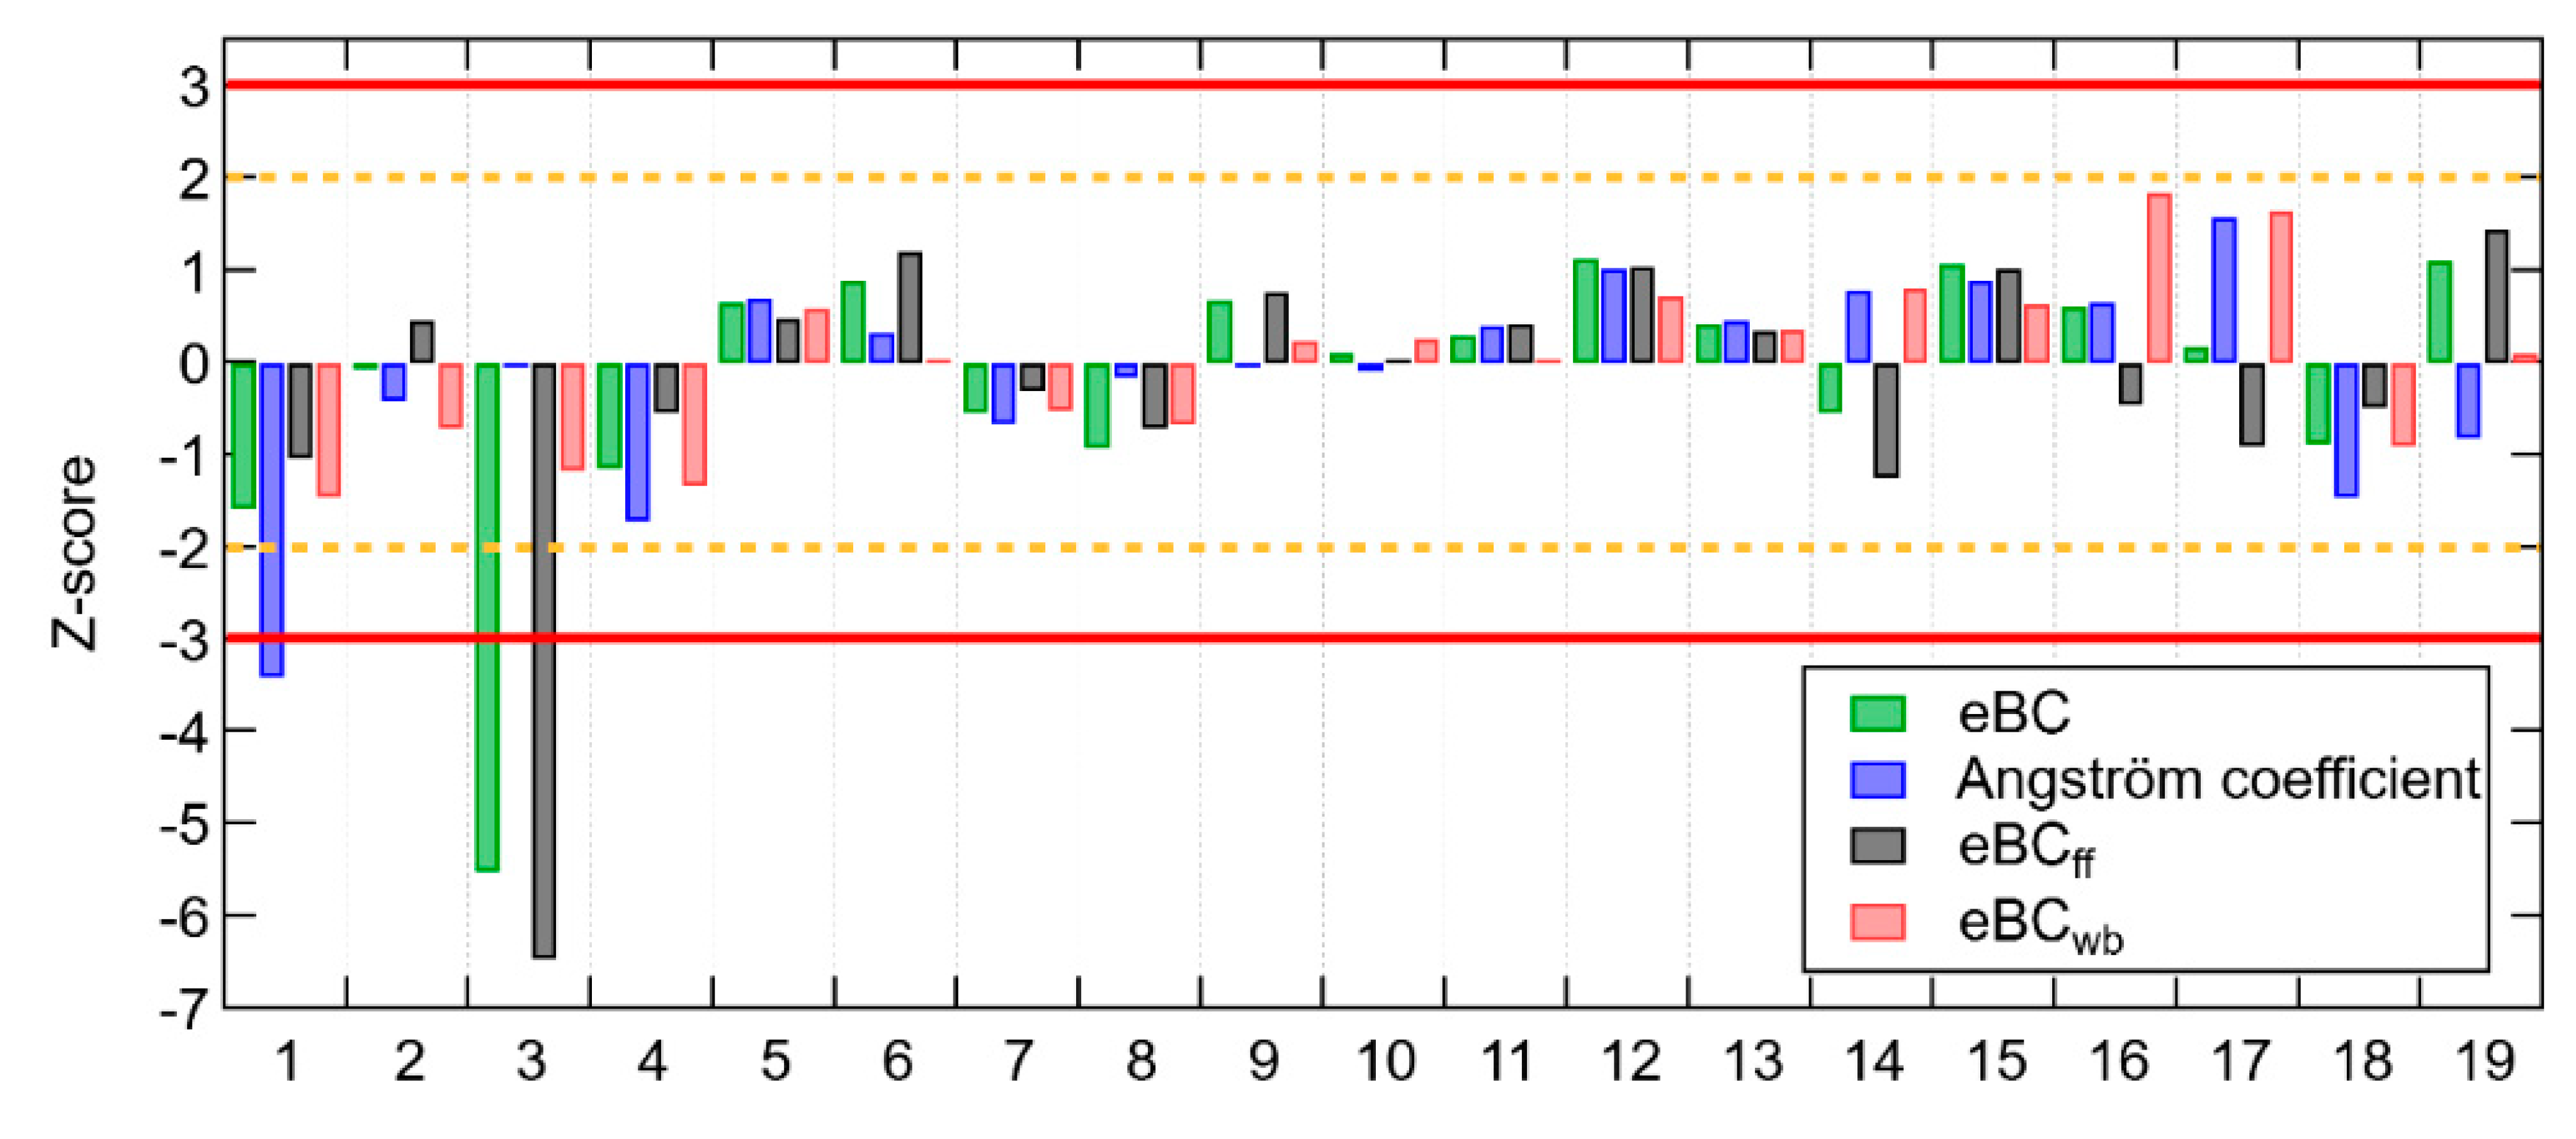
3.2. AE33
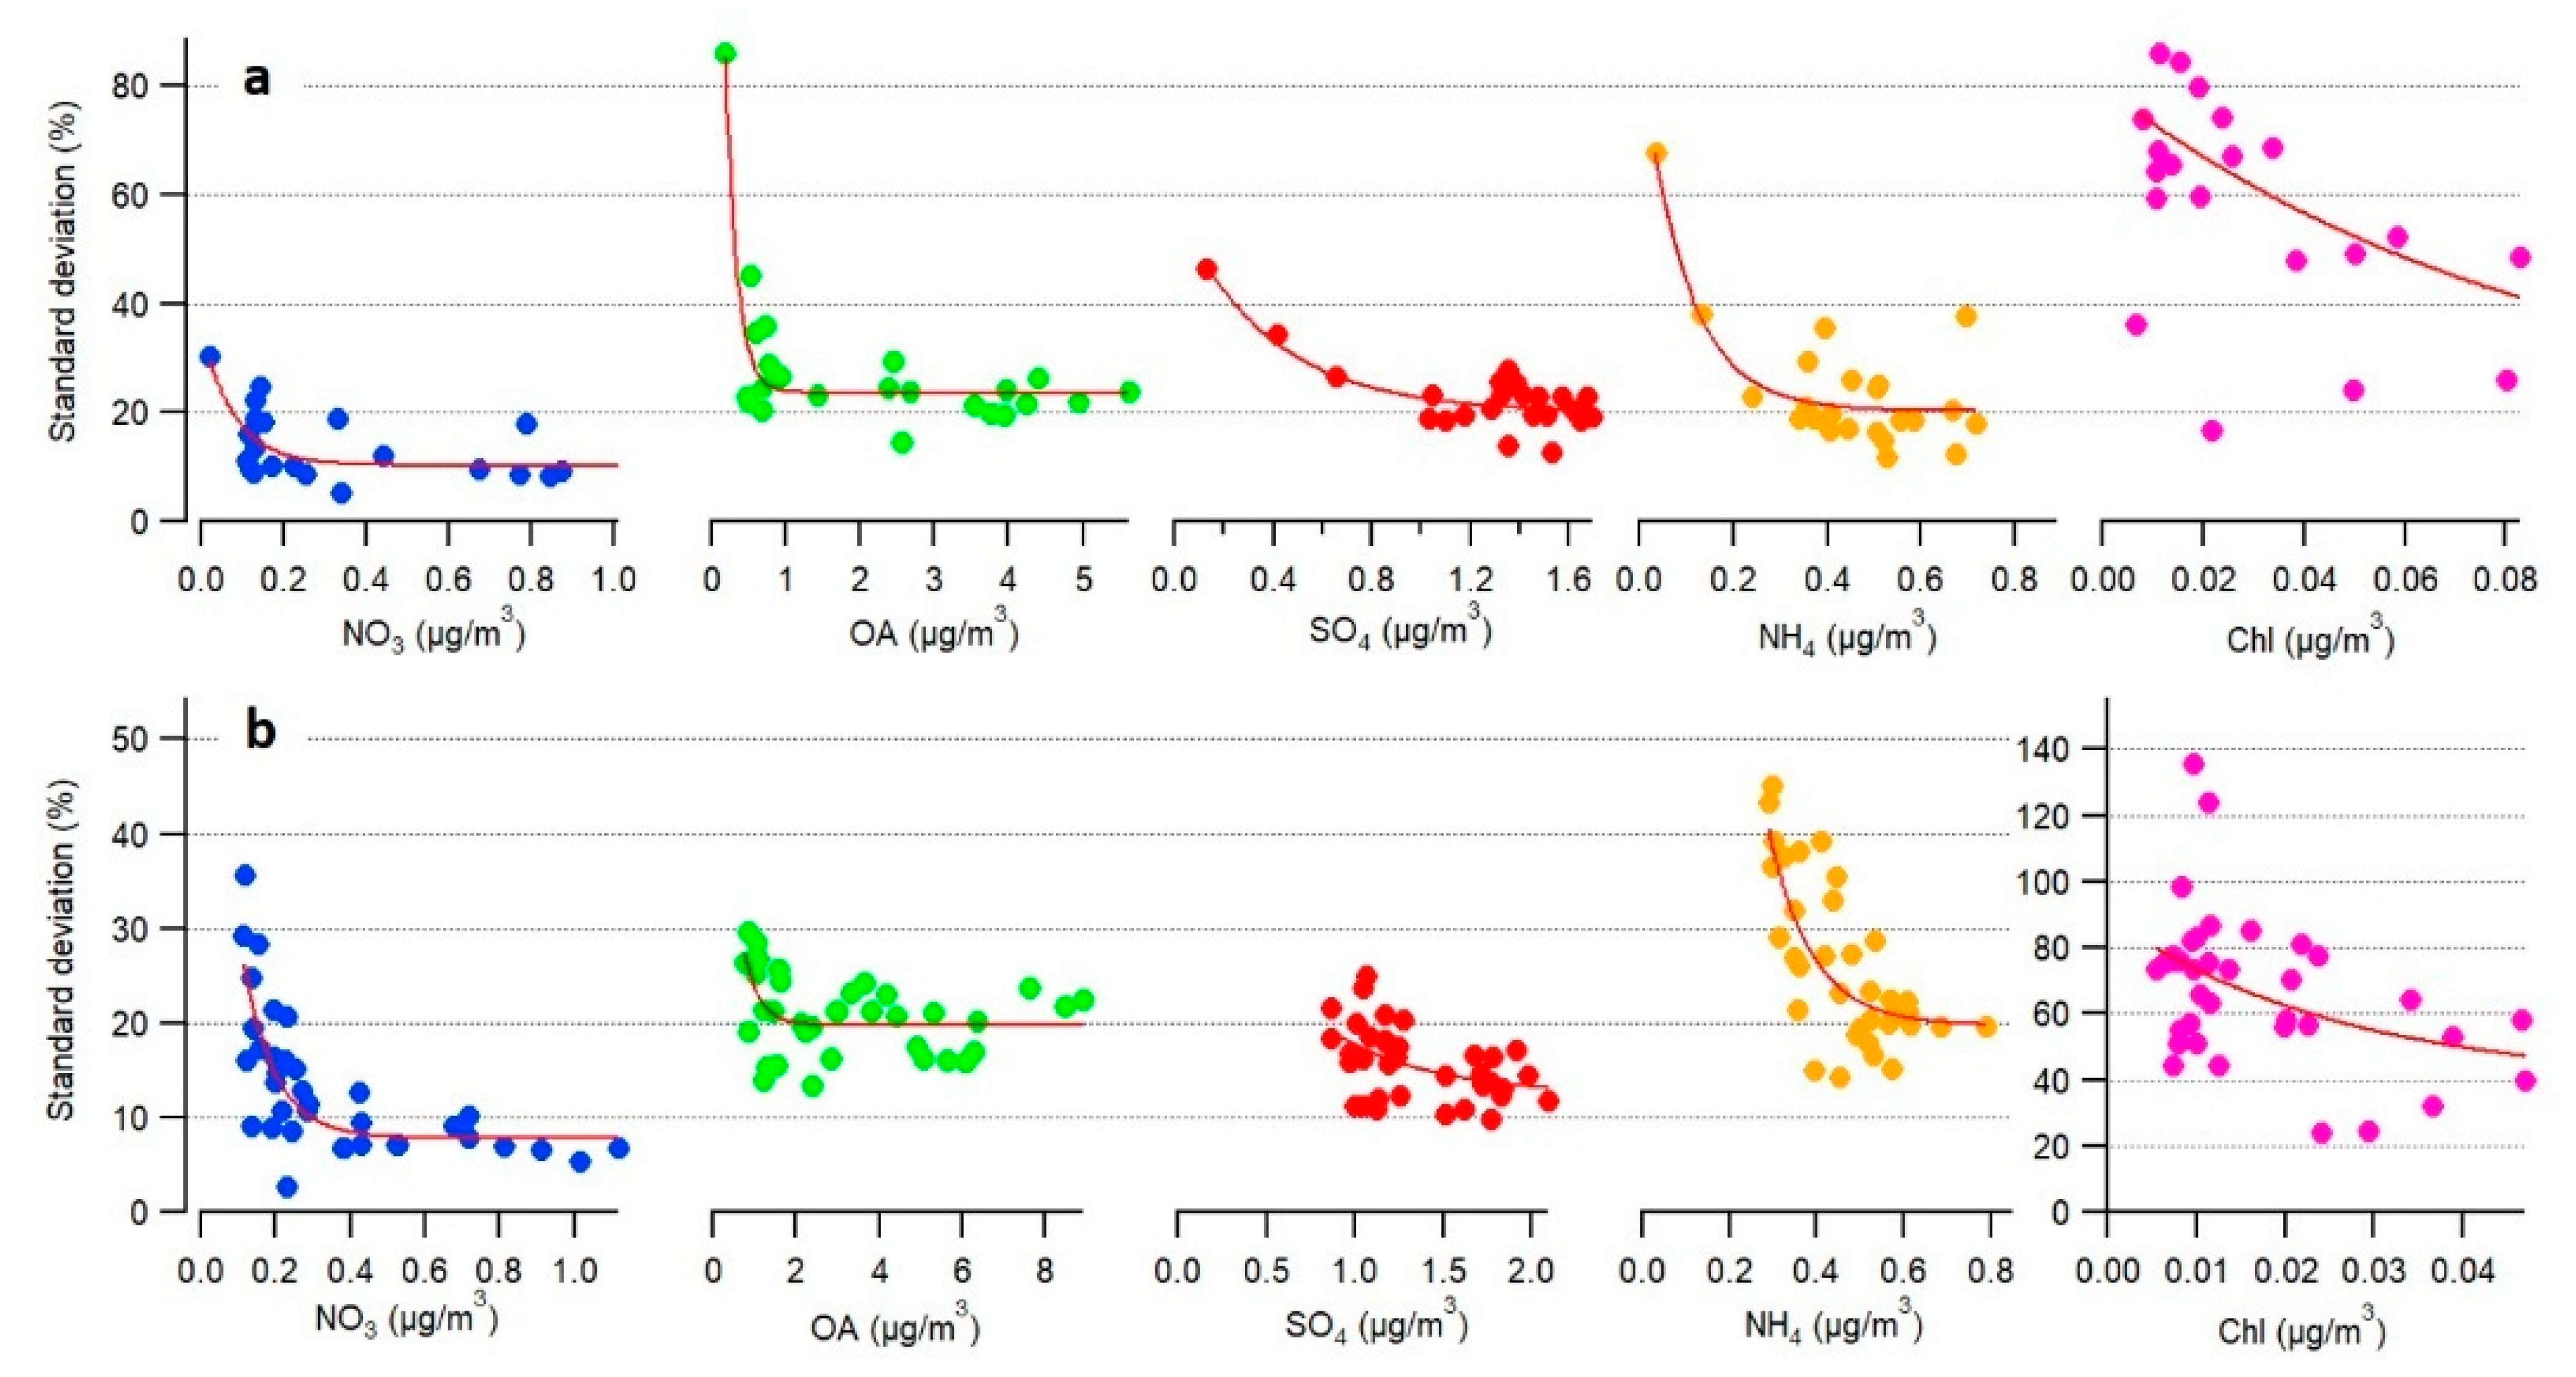
3.3. ACSM
- (1)
- Instruments were installed and operated by AASQAs in ambient air for 3 days.
- (2)
- Response factor and relative ion efficiency calibrations, as well as general tuning operations, were carried out by ACMCC personnel.
- (3)
- Instruments were operated in ambient air for another period of 5 days, to check calibration and tuning accuracies, as well as to compare instrument performances before and after servicing.
4. Aerosol Chemical Composition: Overall Picture
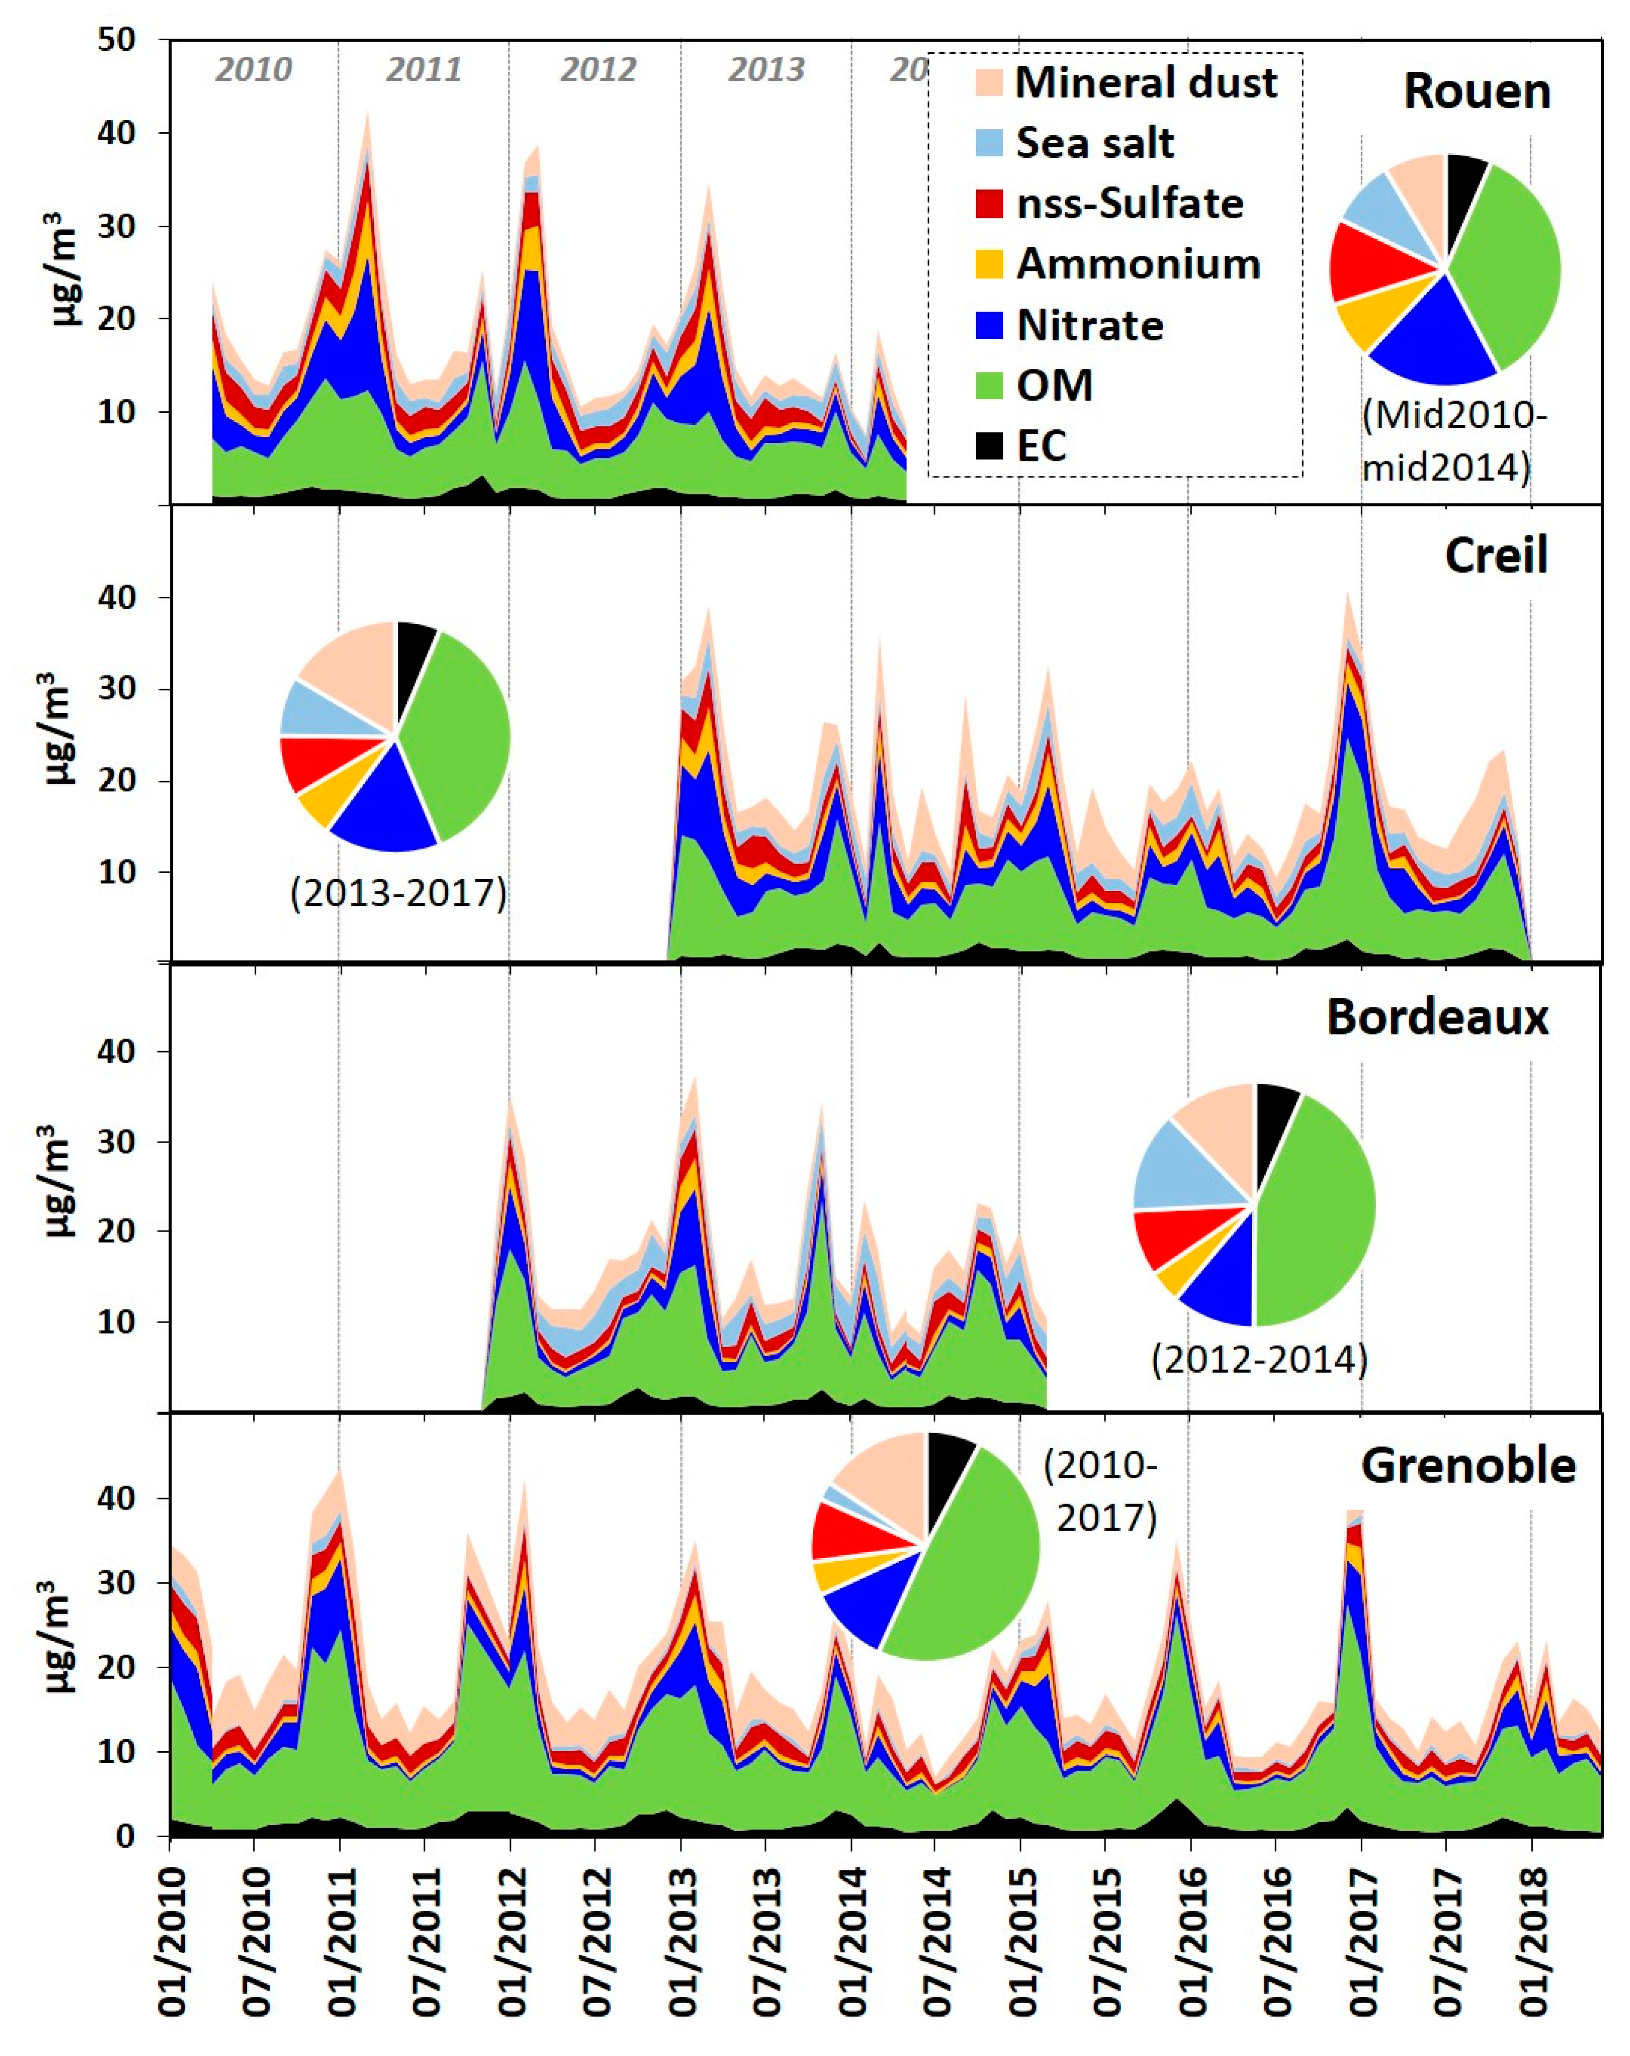
4.1. Seasonality and Spatial Distribution of the Main PM10 Components
- -
- OM = 1.8 × OC (e.g., [53]);
- -
- Sea salts = 3.27 × Na+, and non-sea salt sulfate (nss-SO42+) = SO42+ − 0.25 × Na+, based on seawater composition;
- -
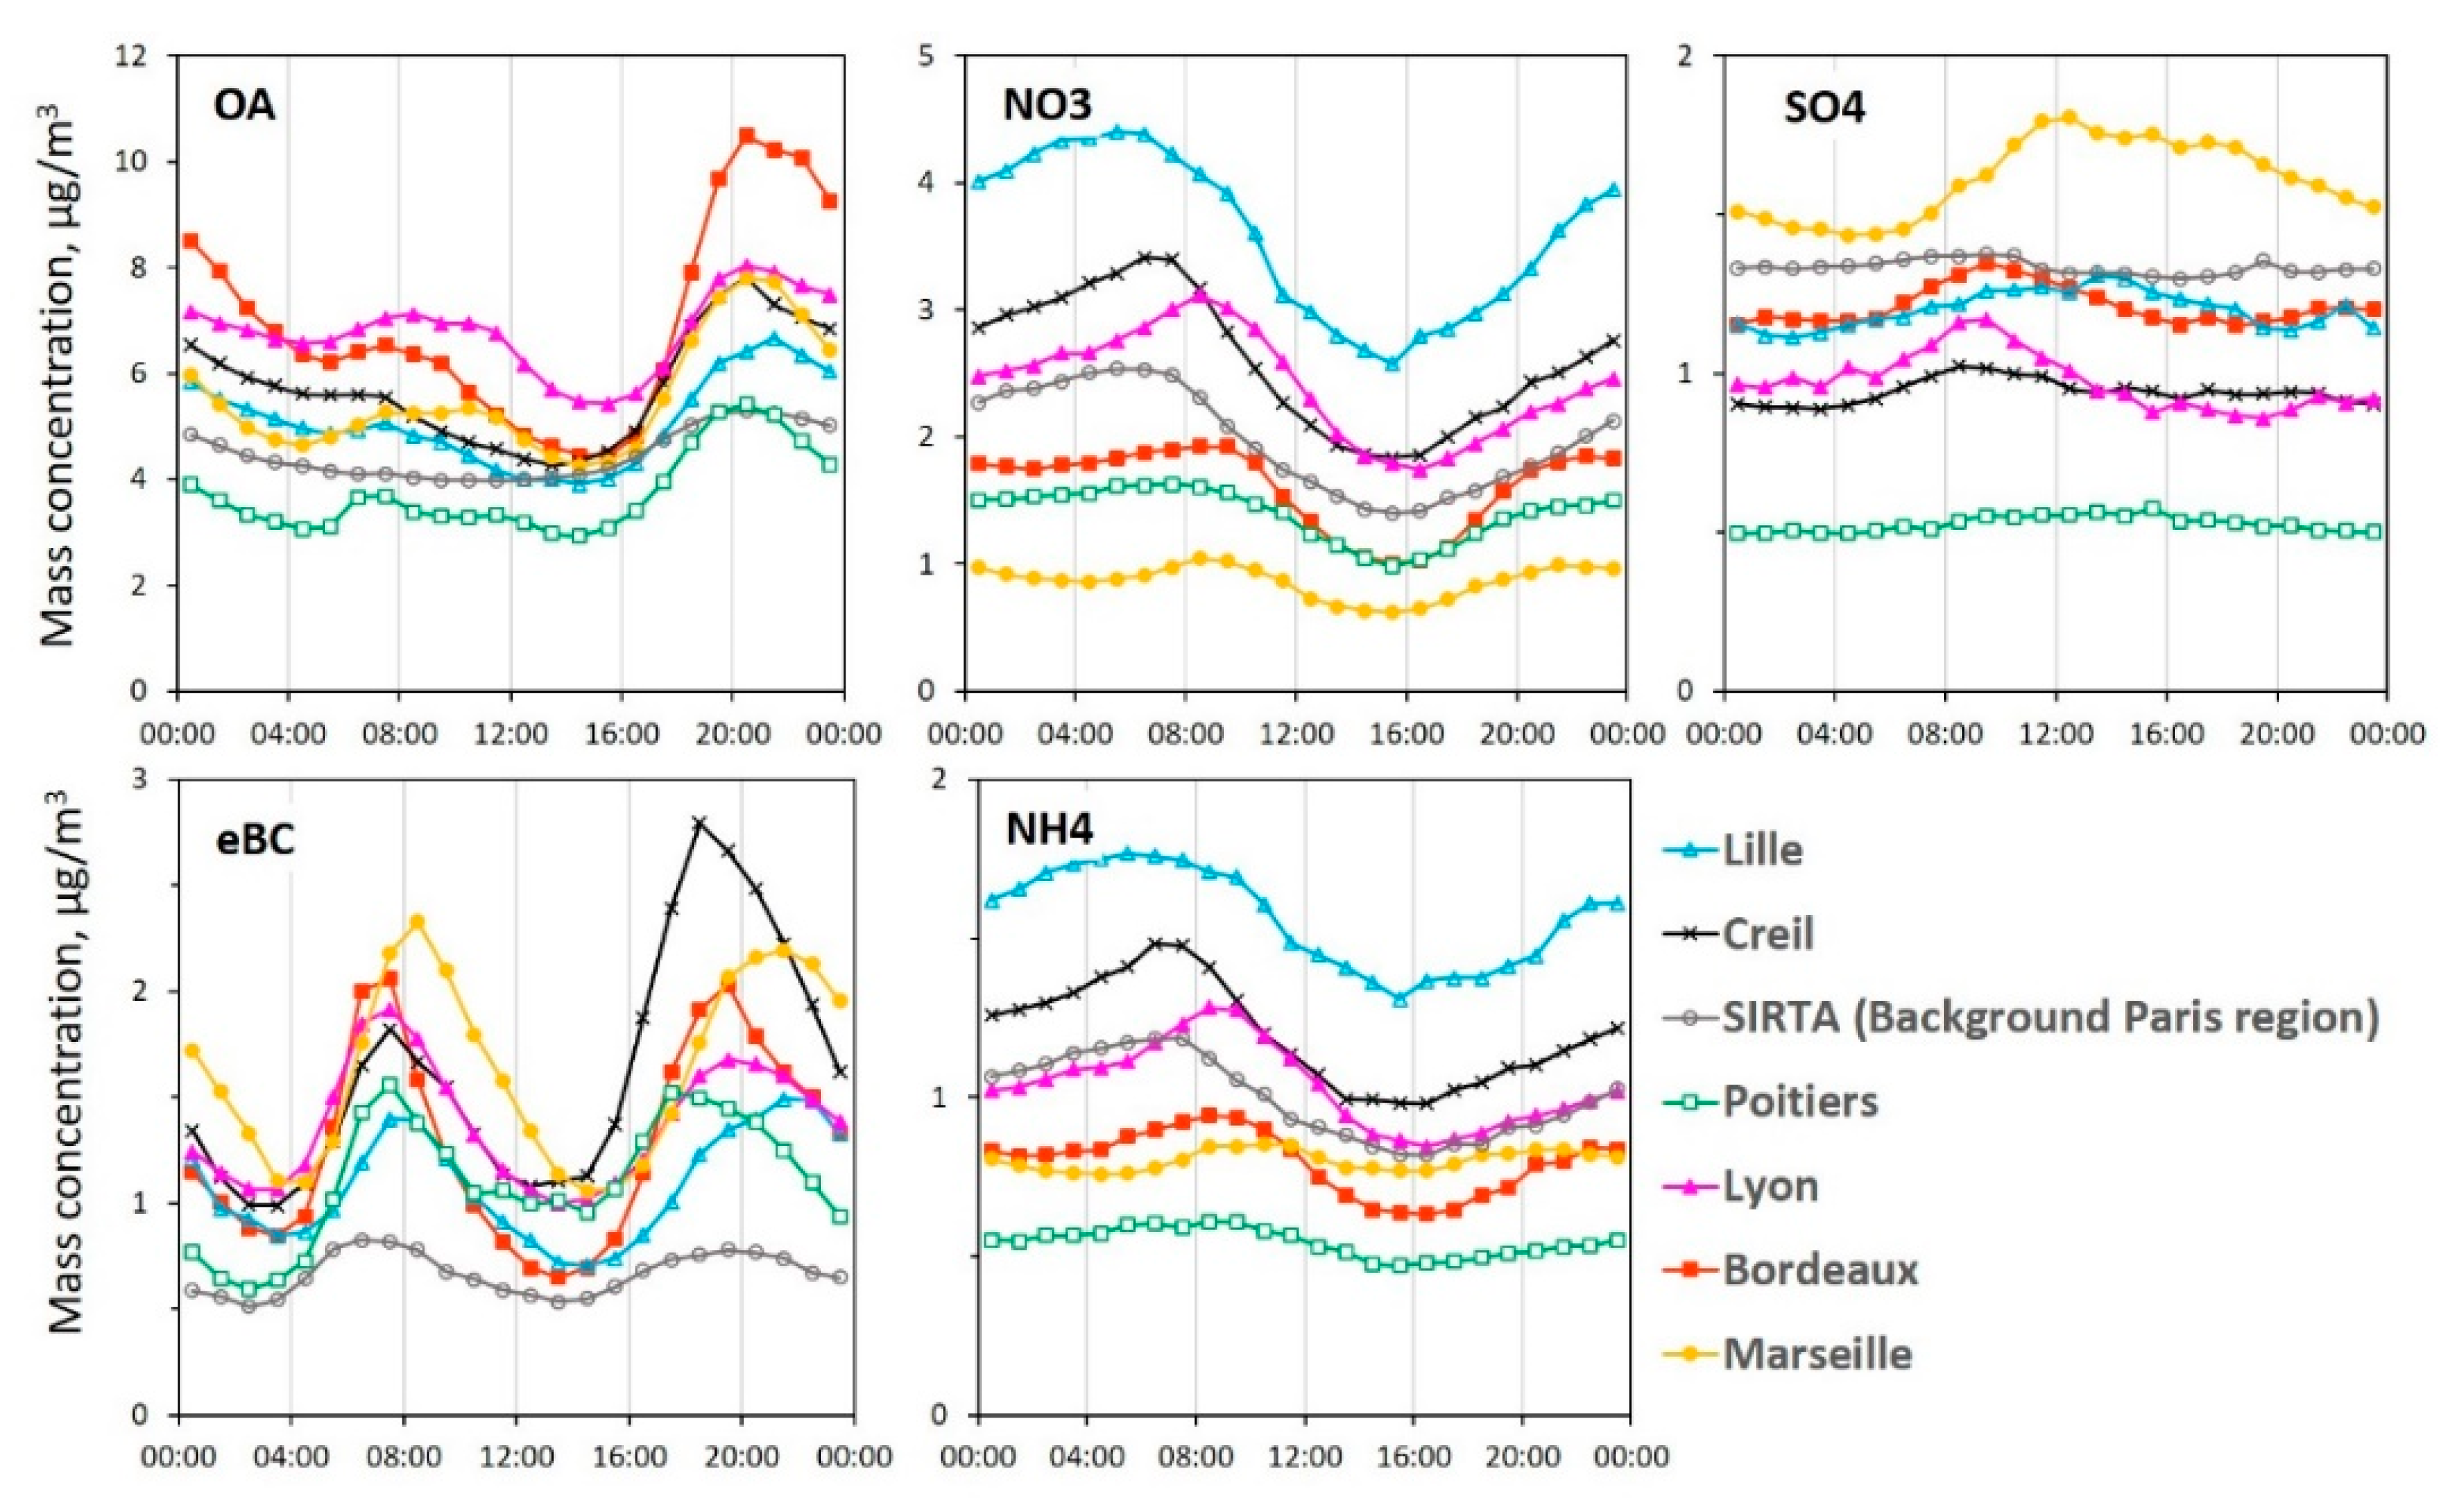
4.2. Diel Variations of the Main Components of the Fine Aerosol Mode
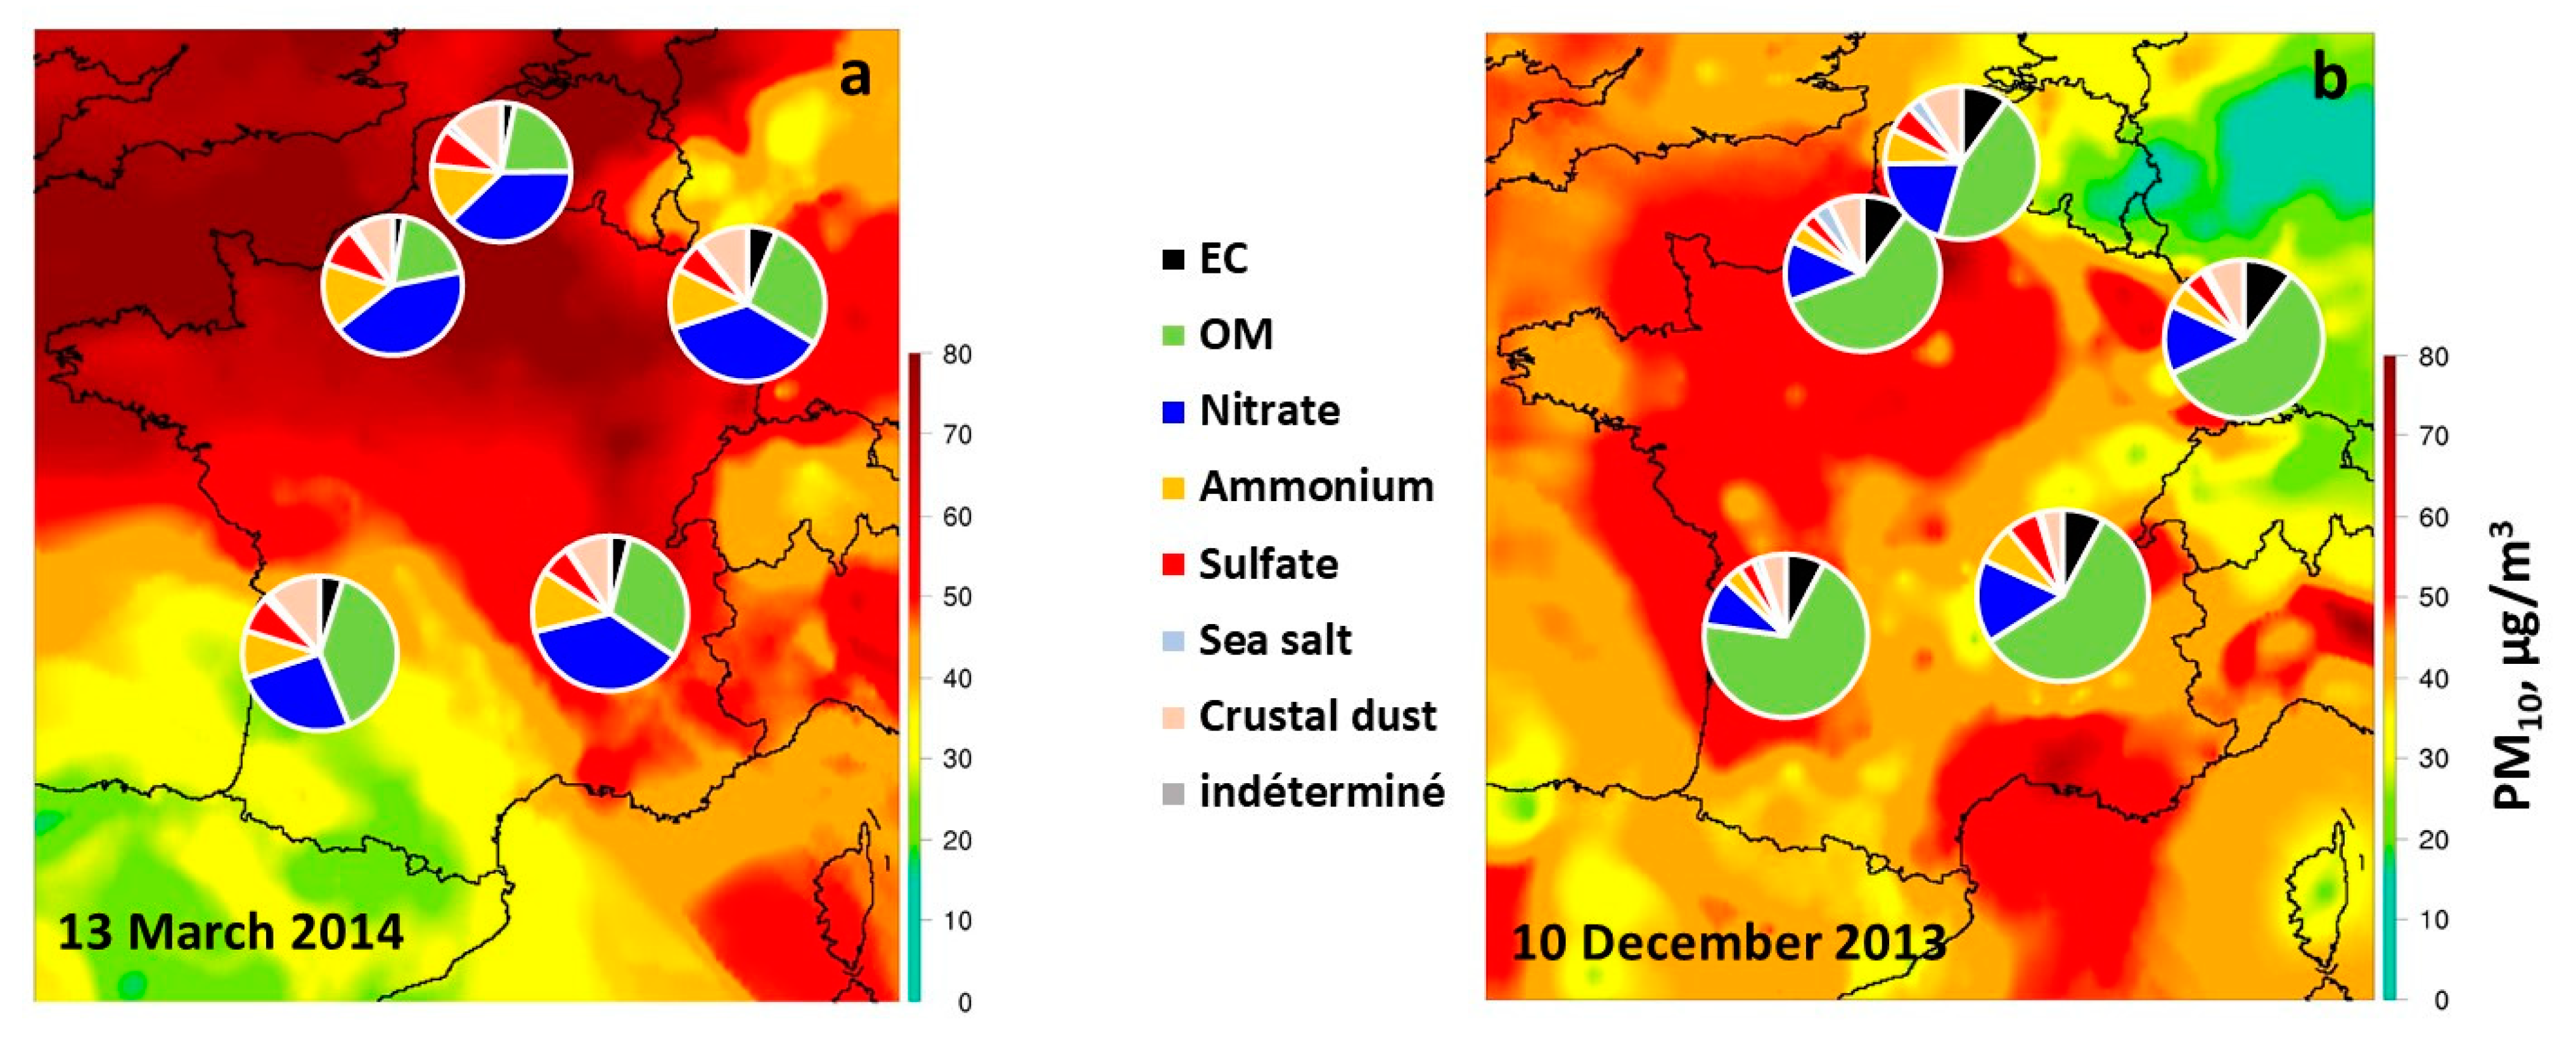
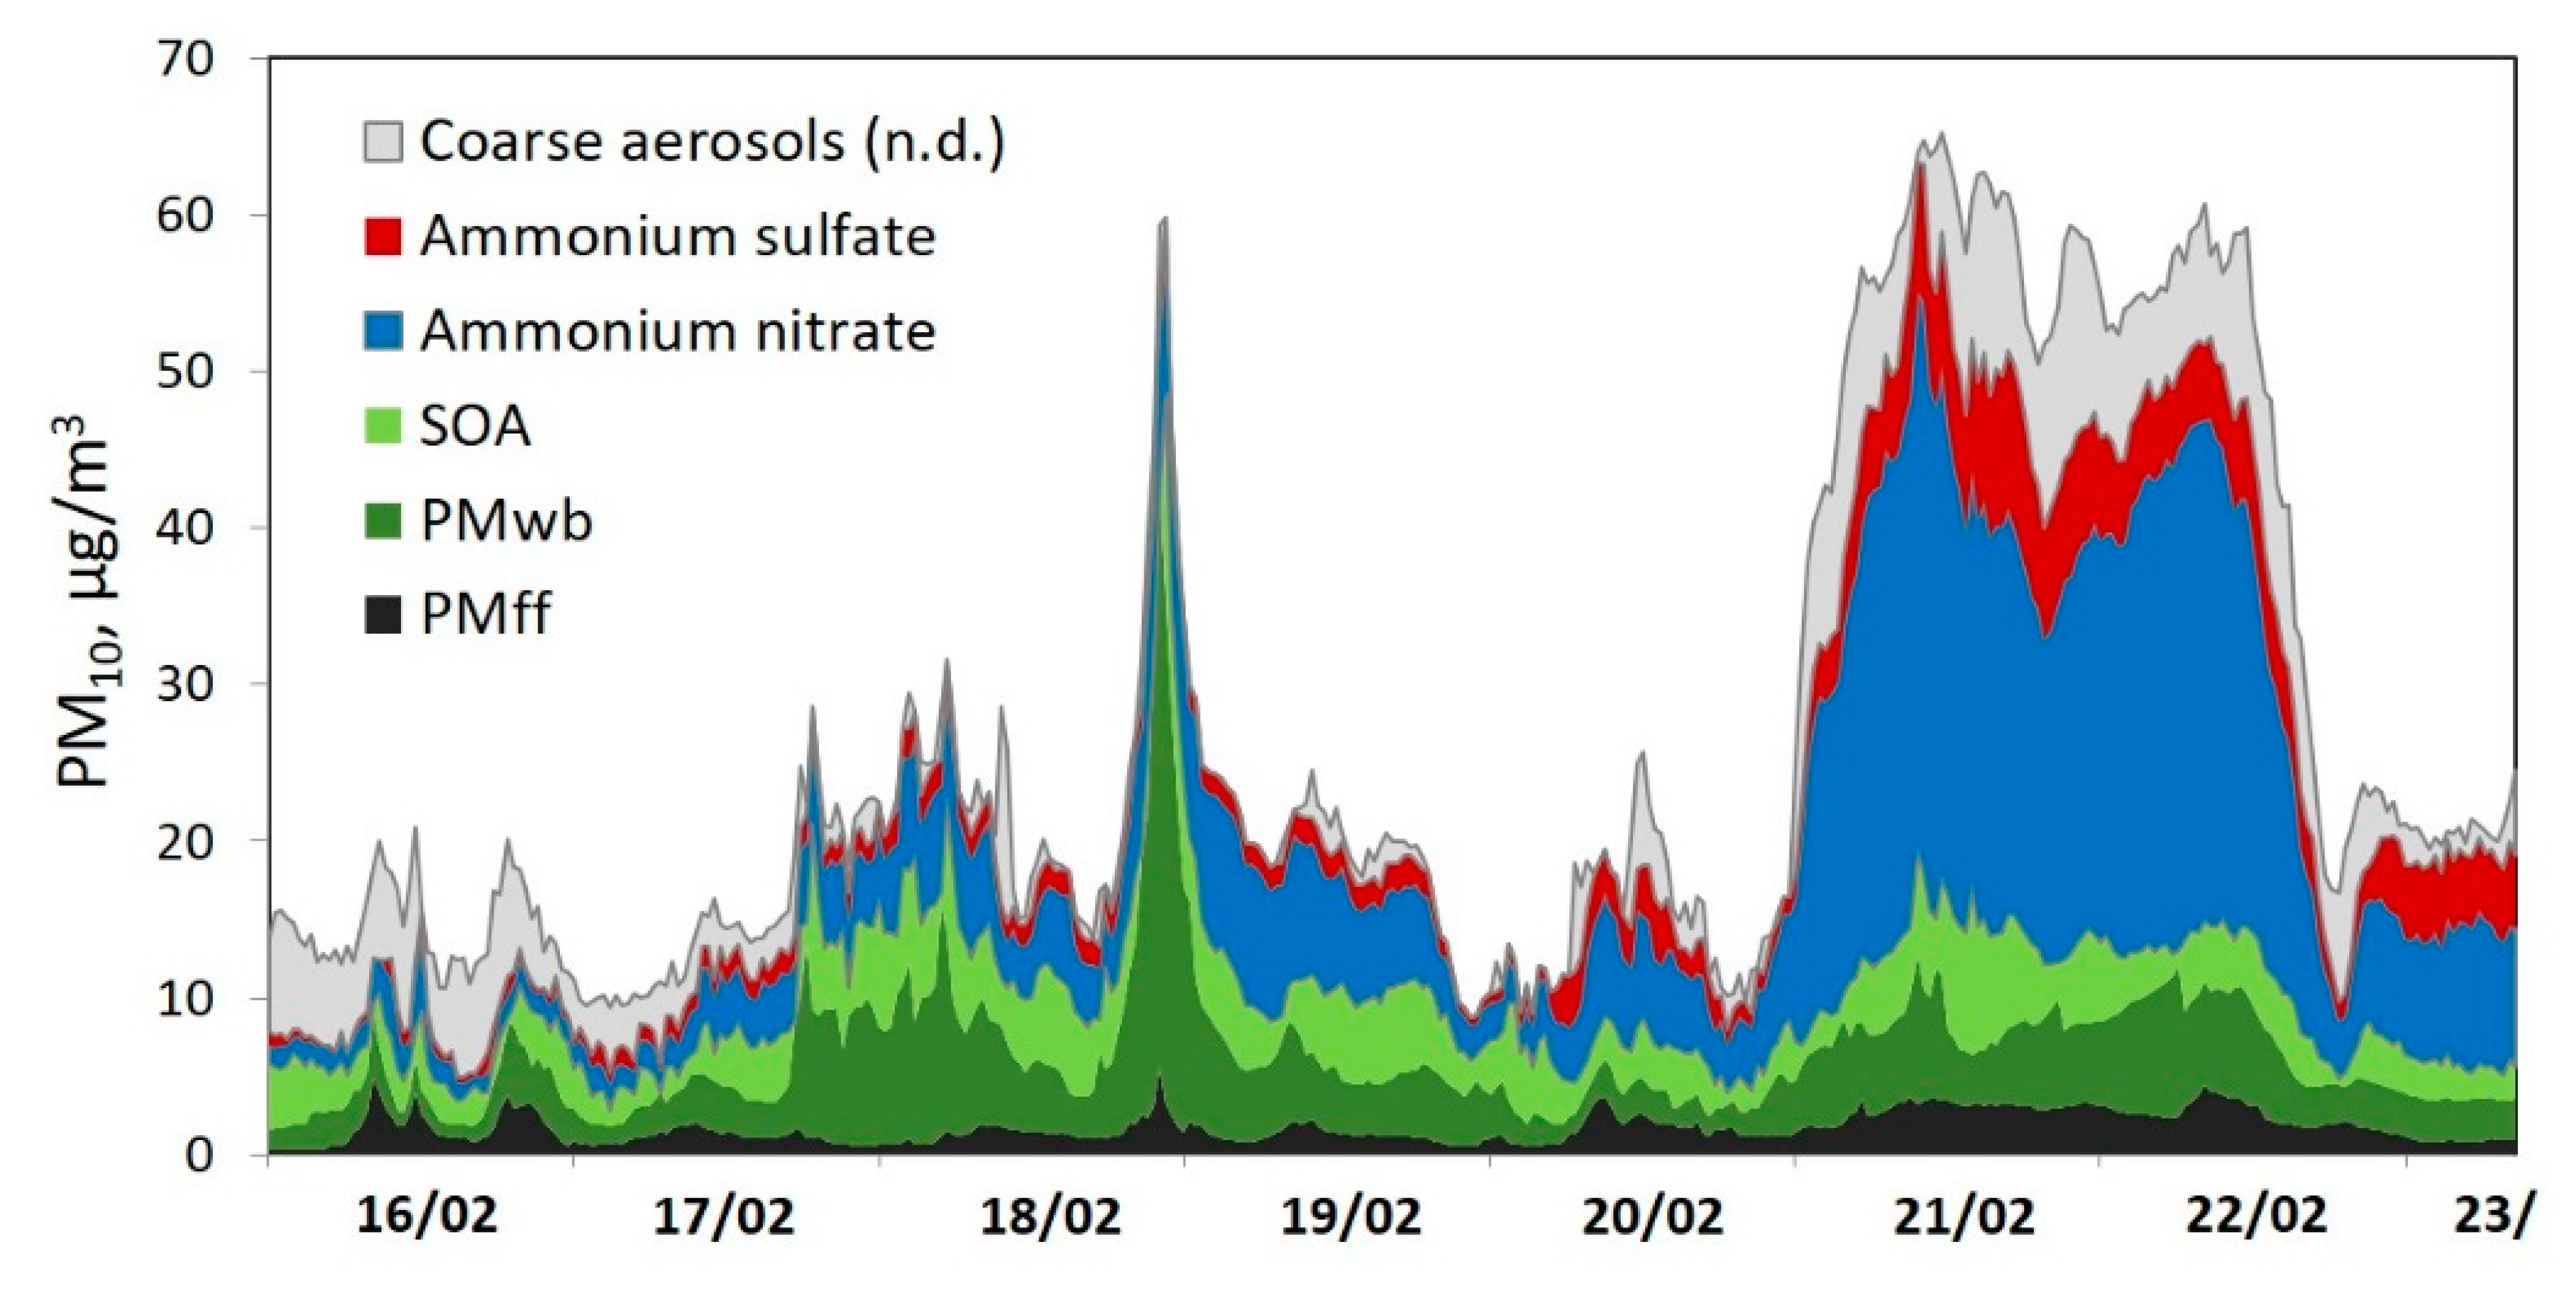
4.3. Pollution Episodes Commonly Observed within the CARA Program
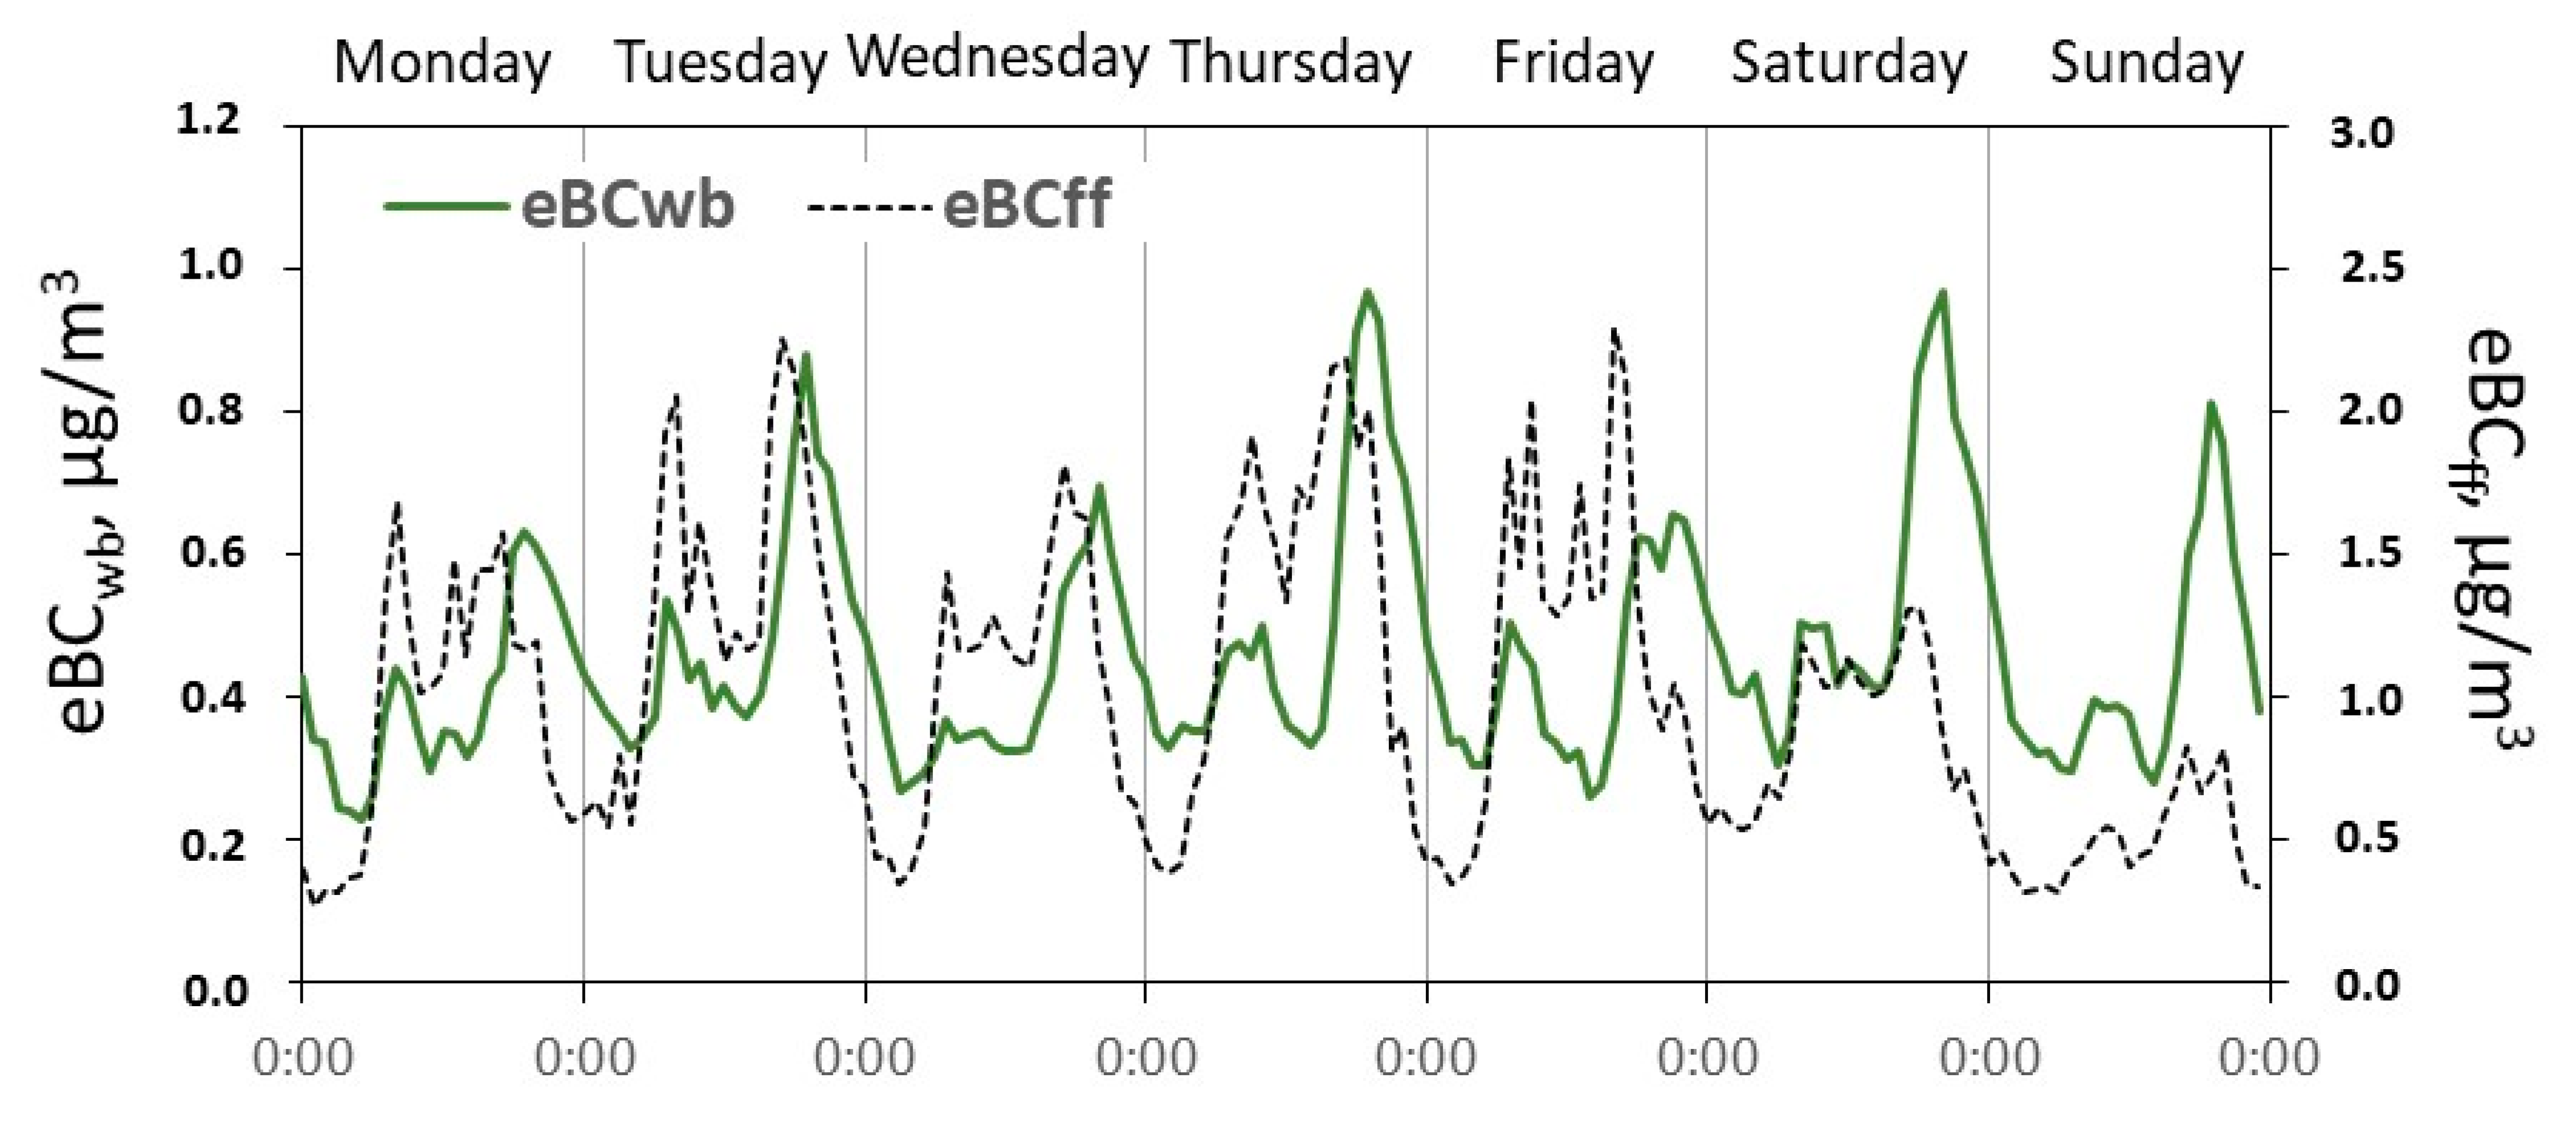
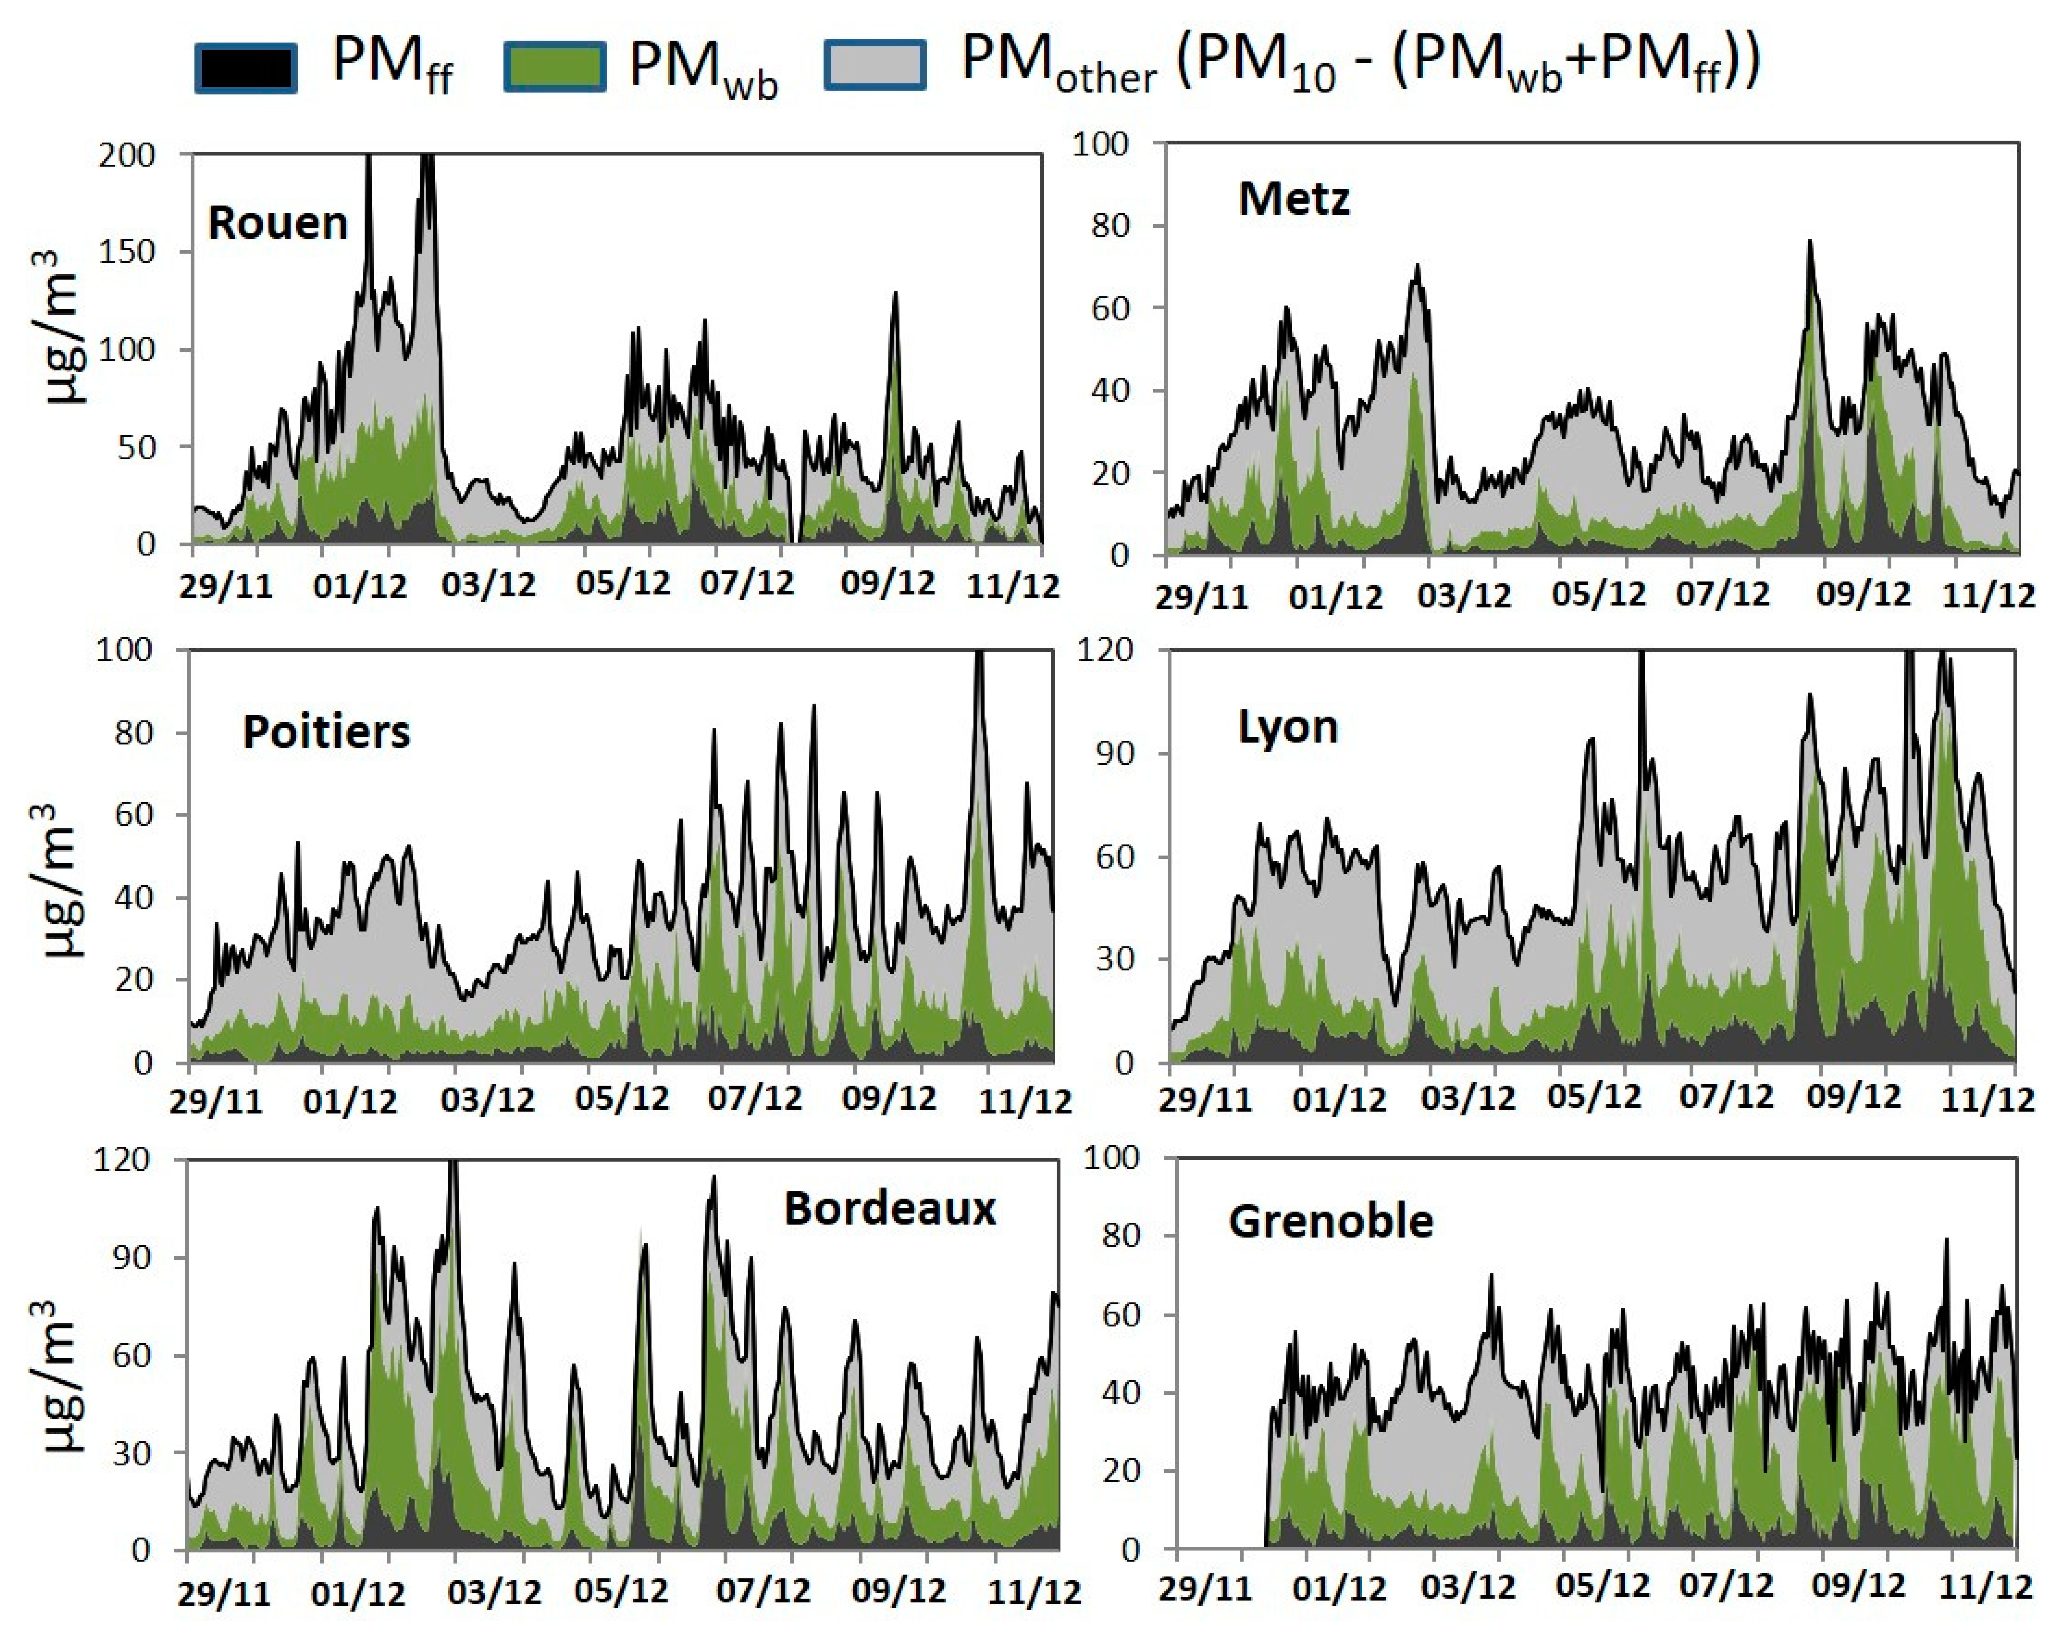
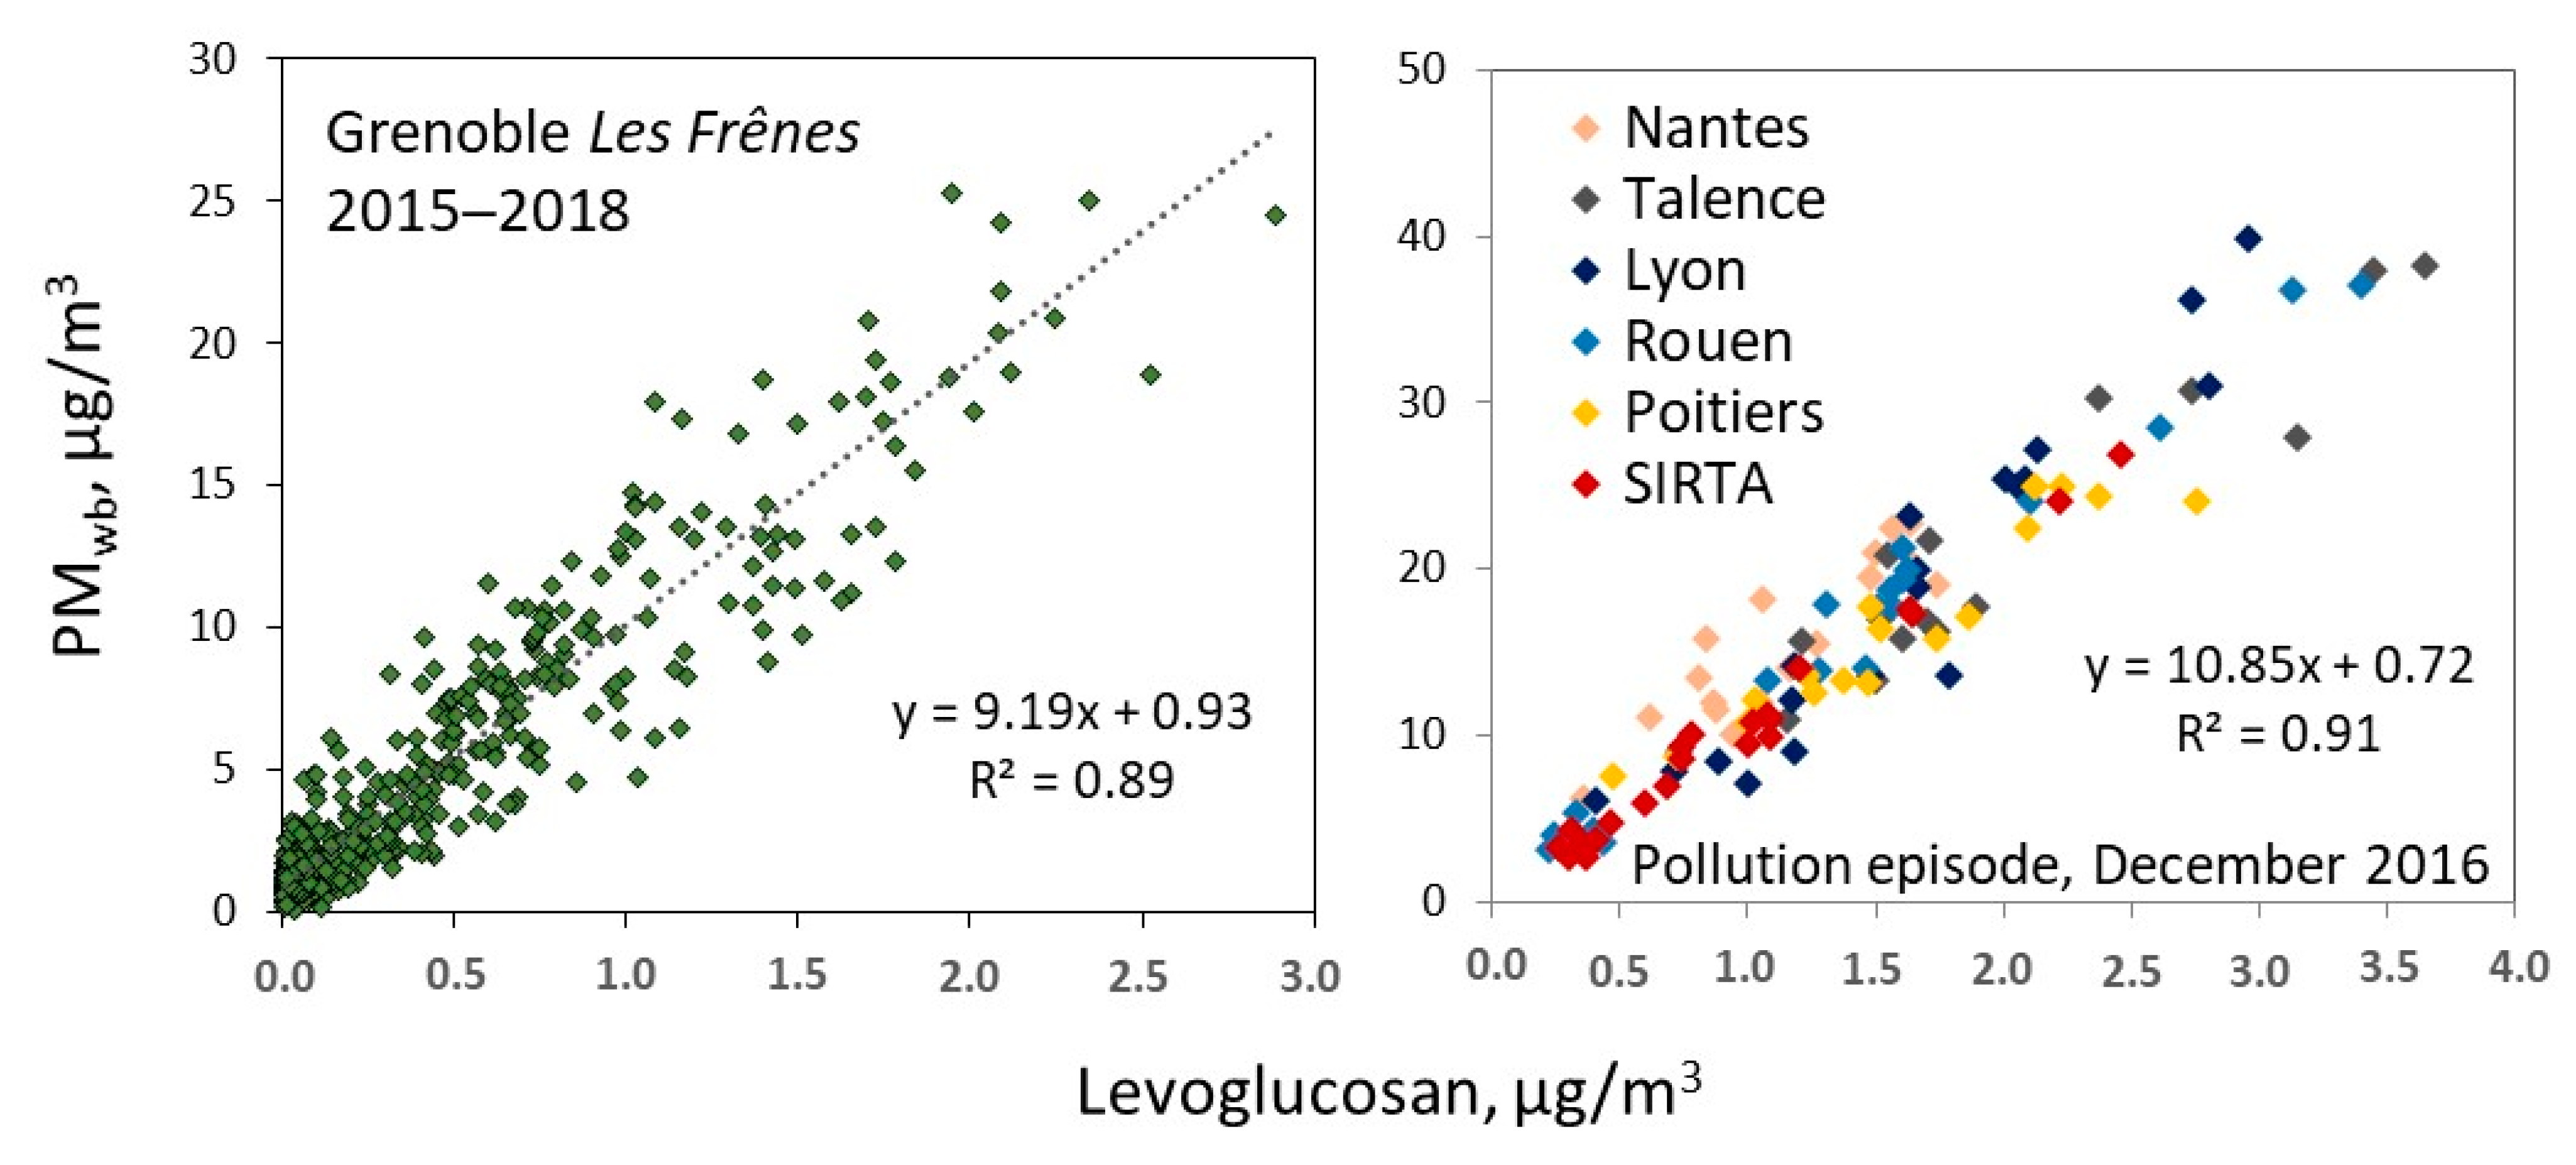
5. Residential Wood Burning
6. Road Transport (Primary Emissions)
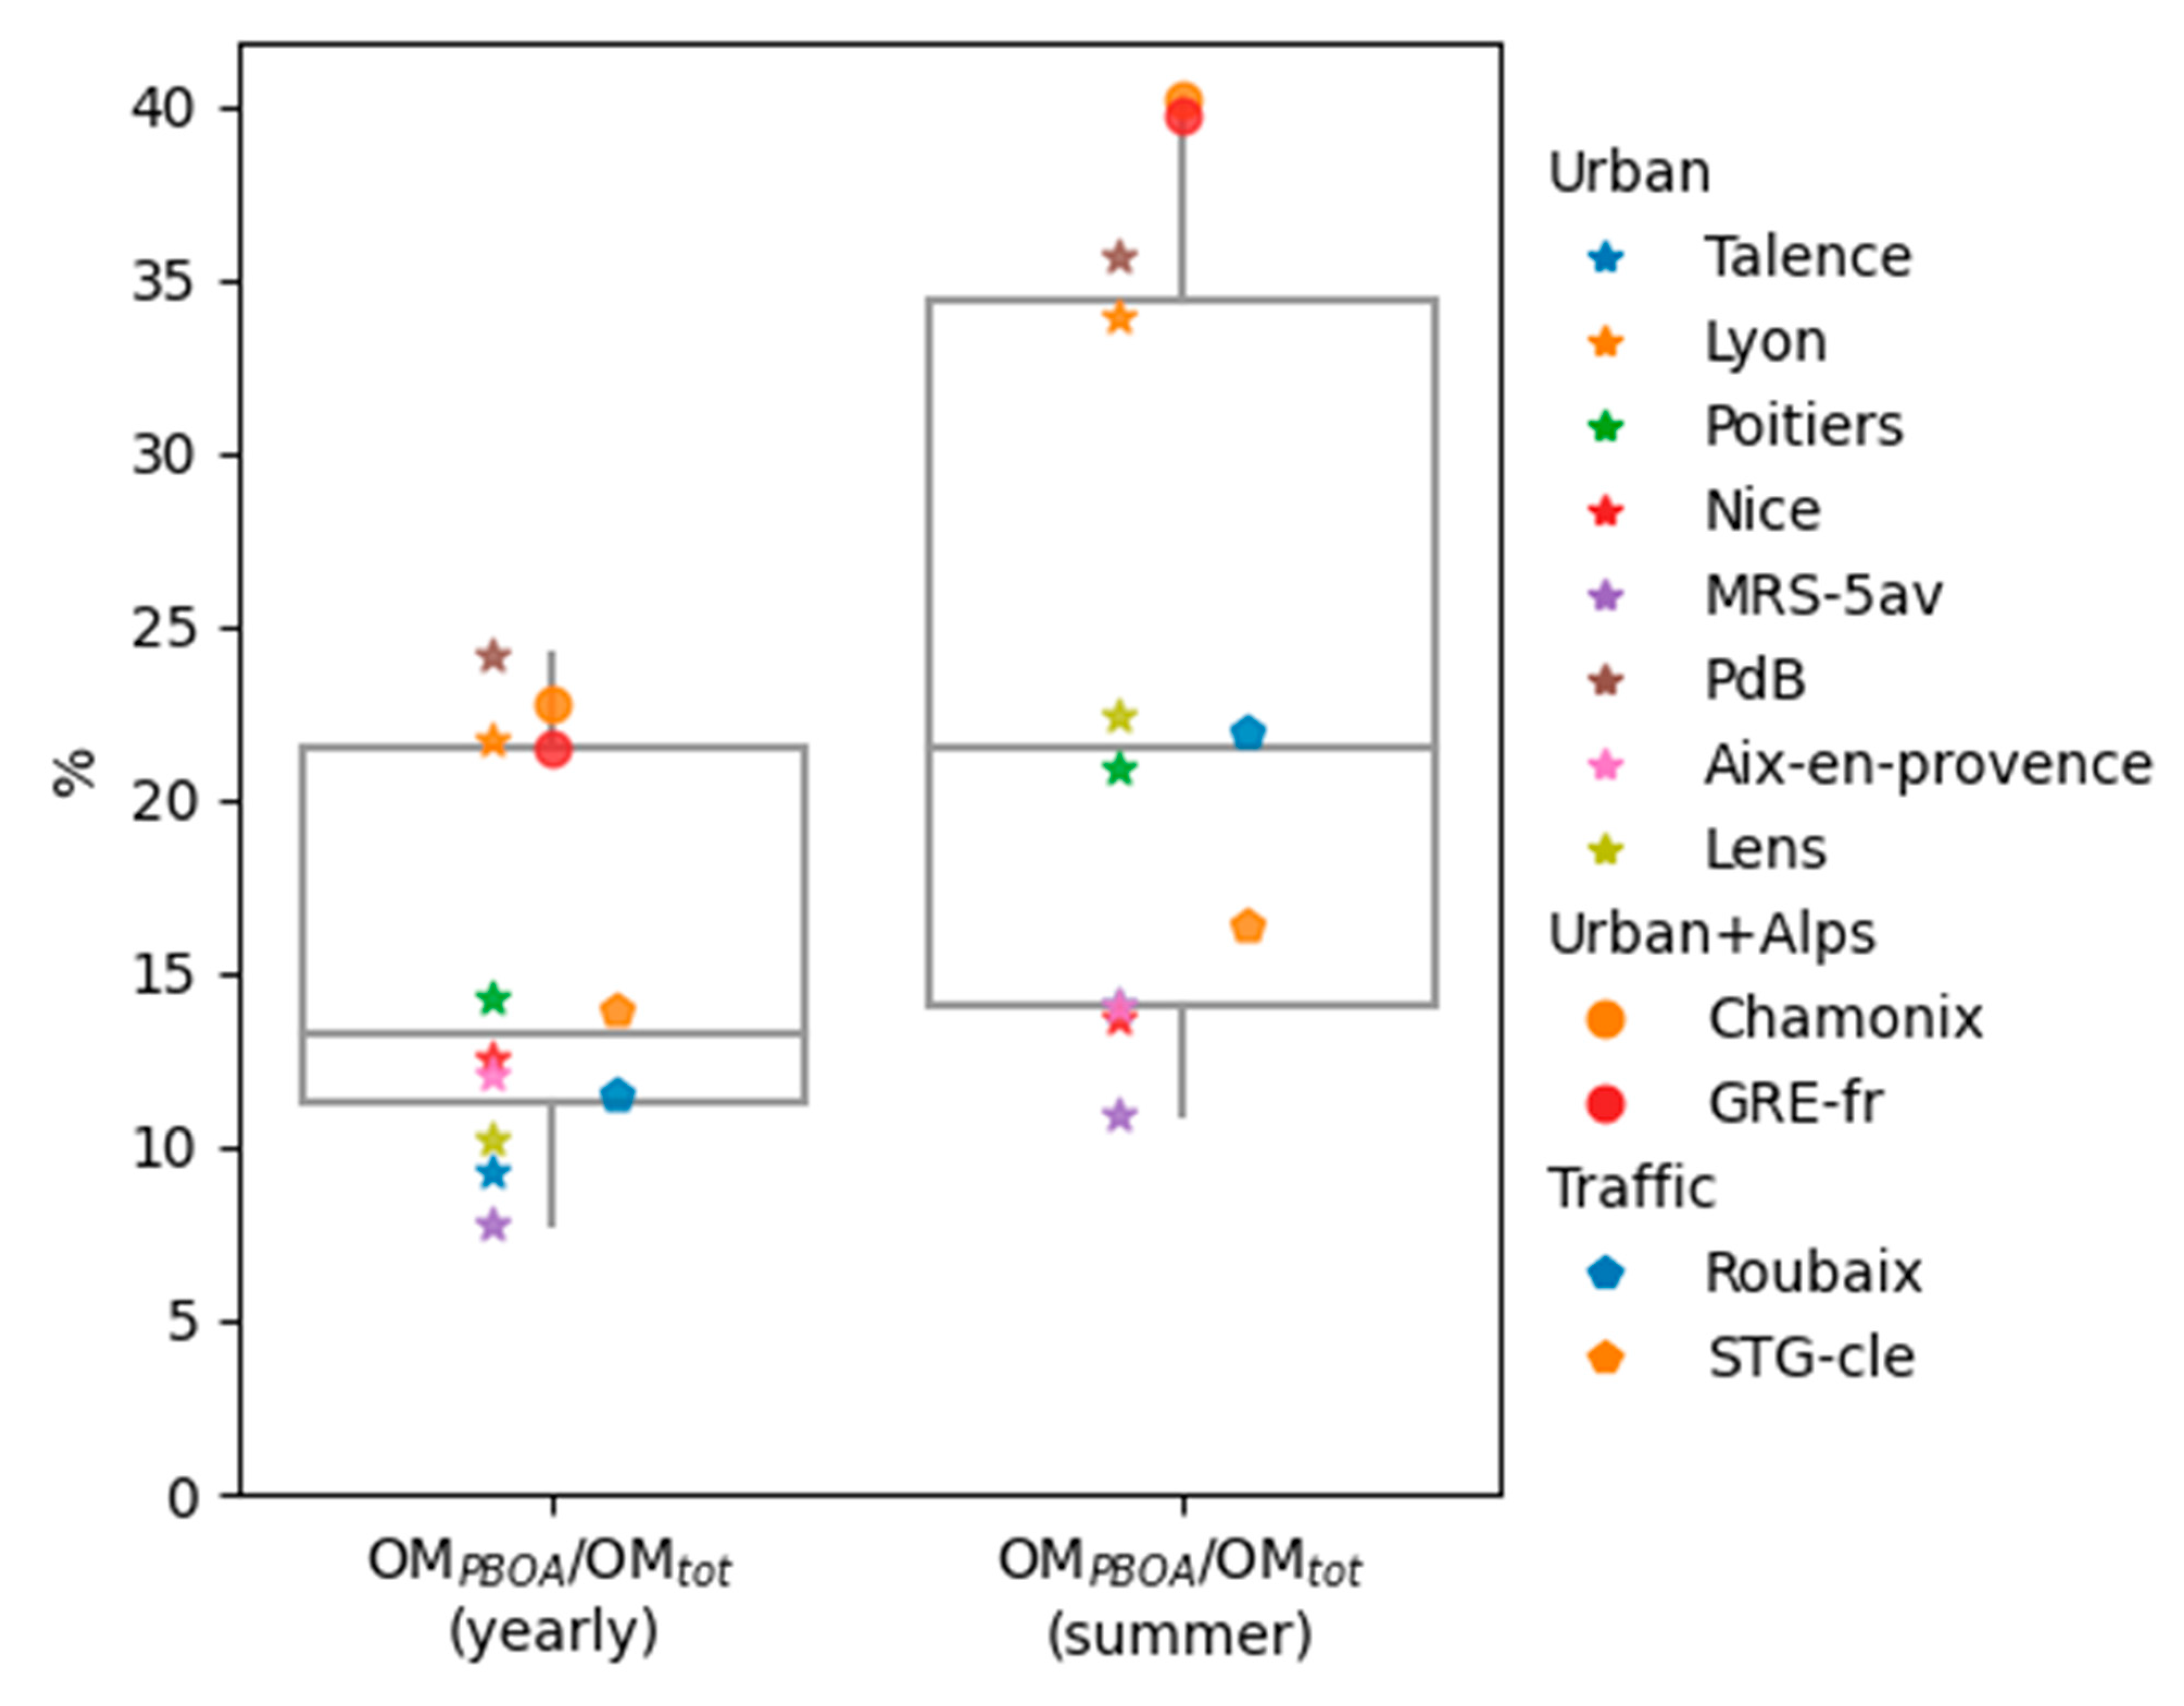
7. Primary Biogenic Organic Aerosols (PBOA)
8. Sea Salts
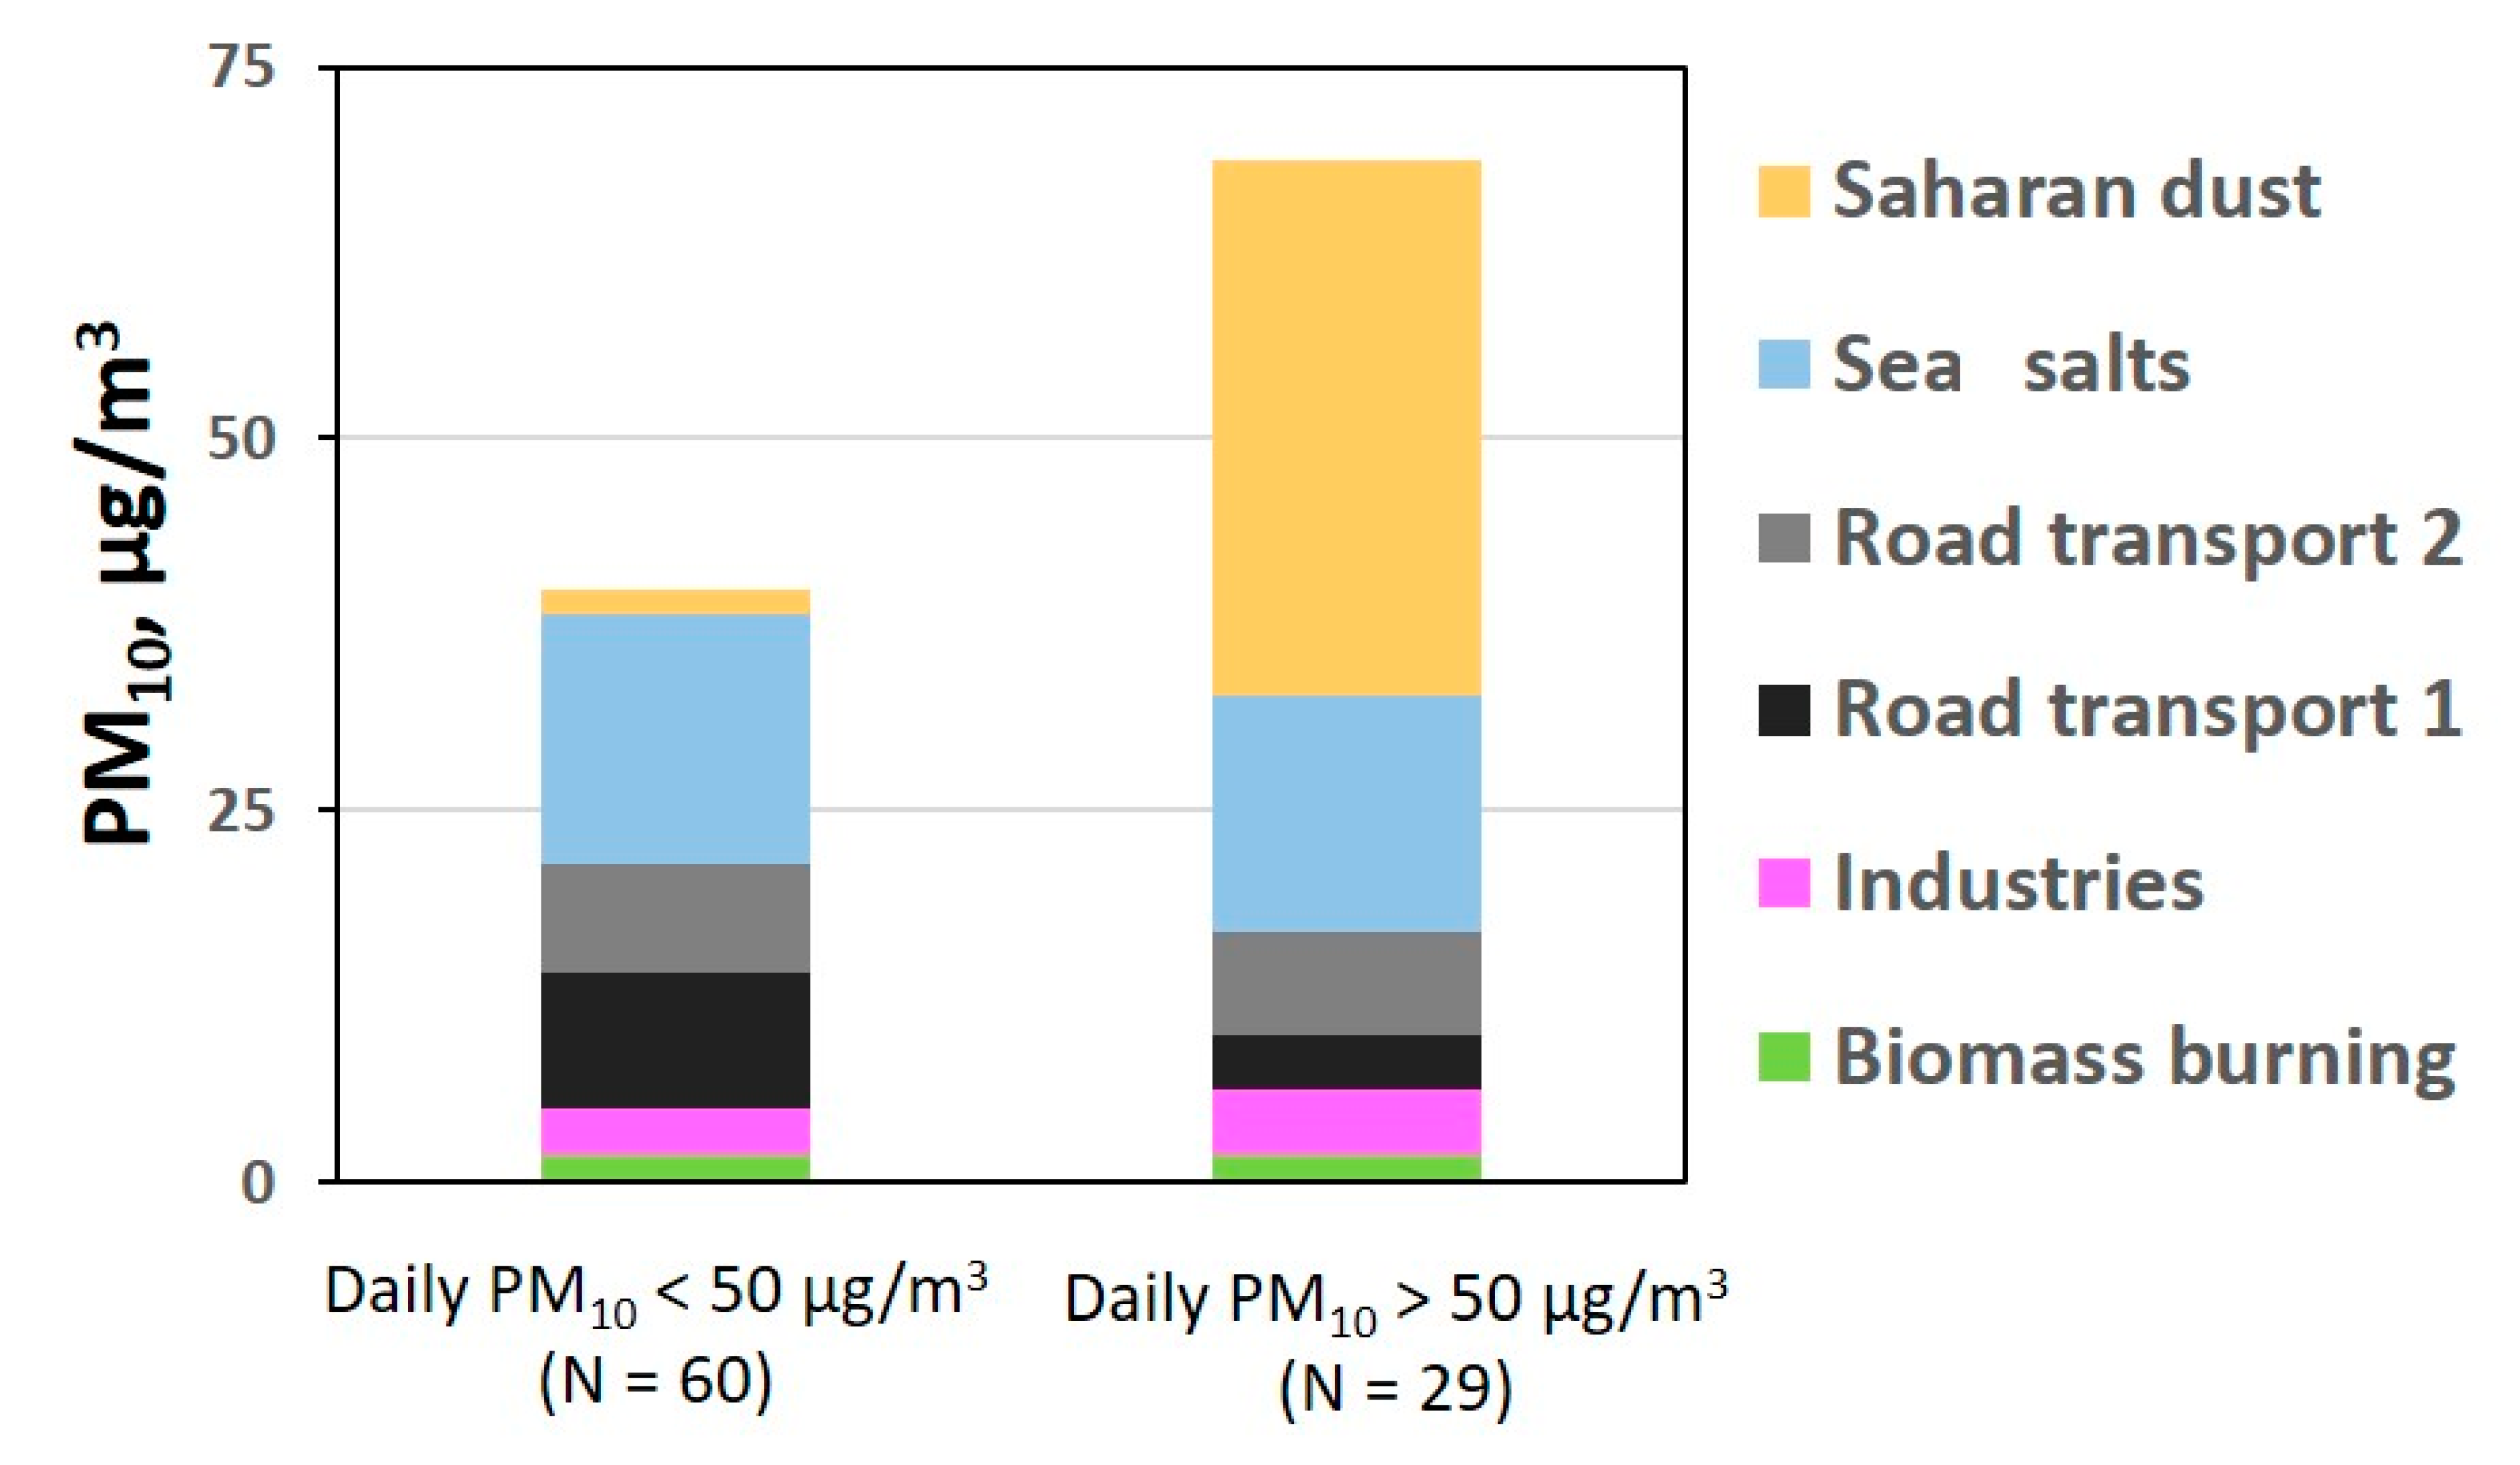
9. Saharan Dust
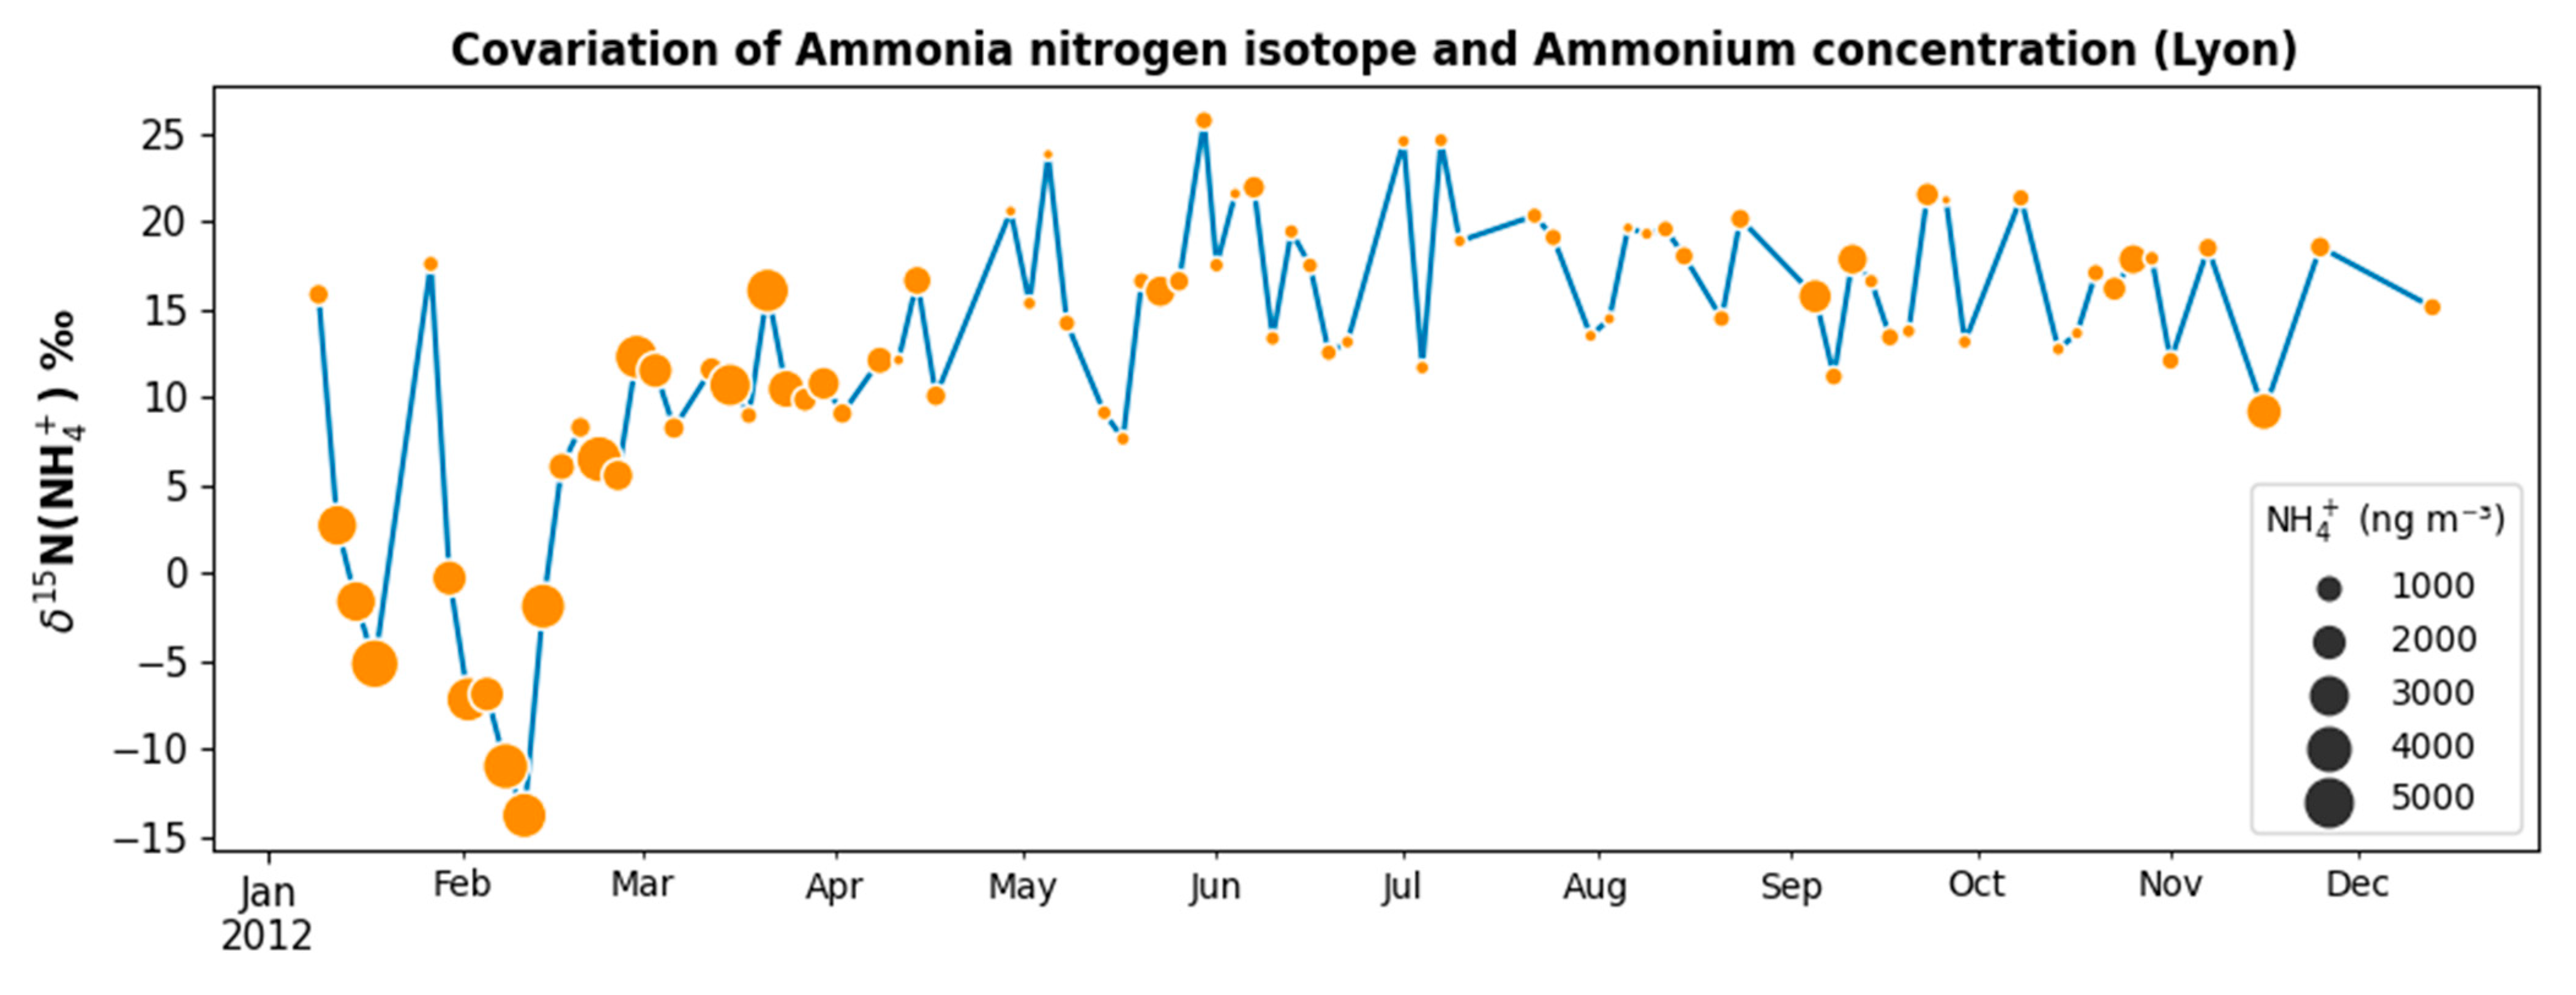
10. Ammonium Nitrate
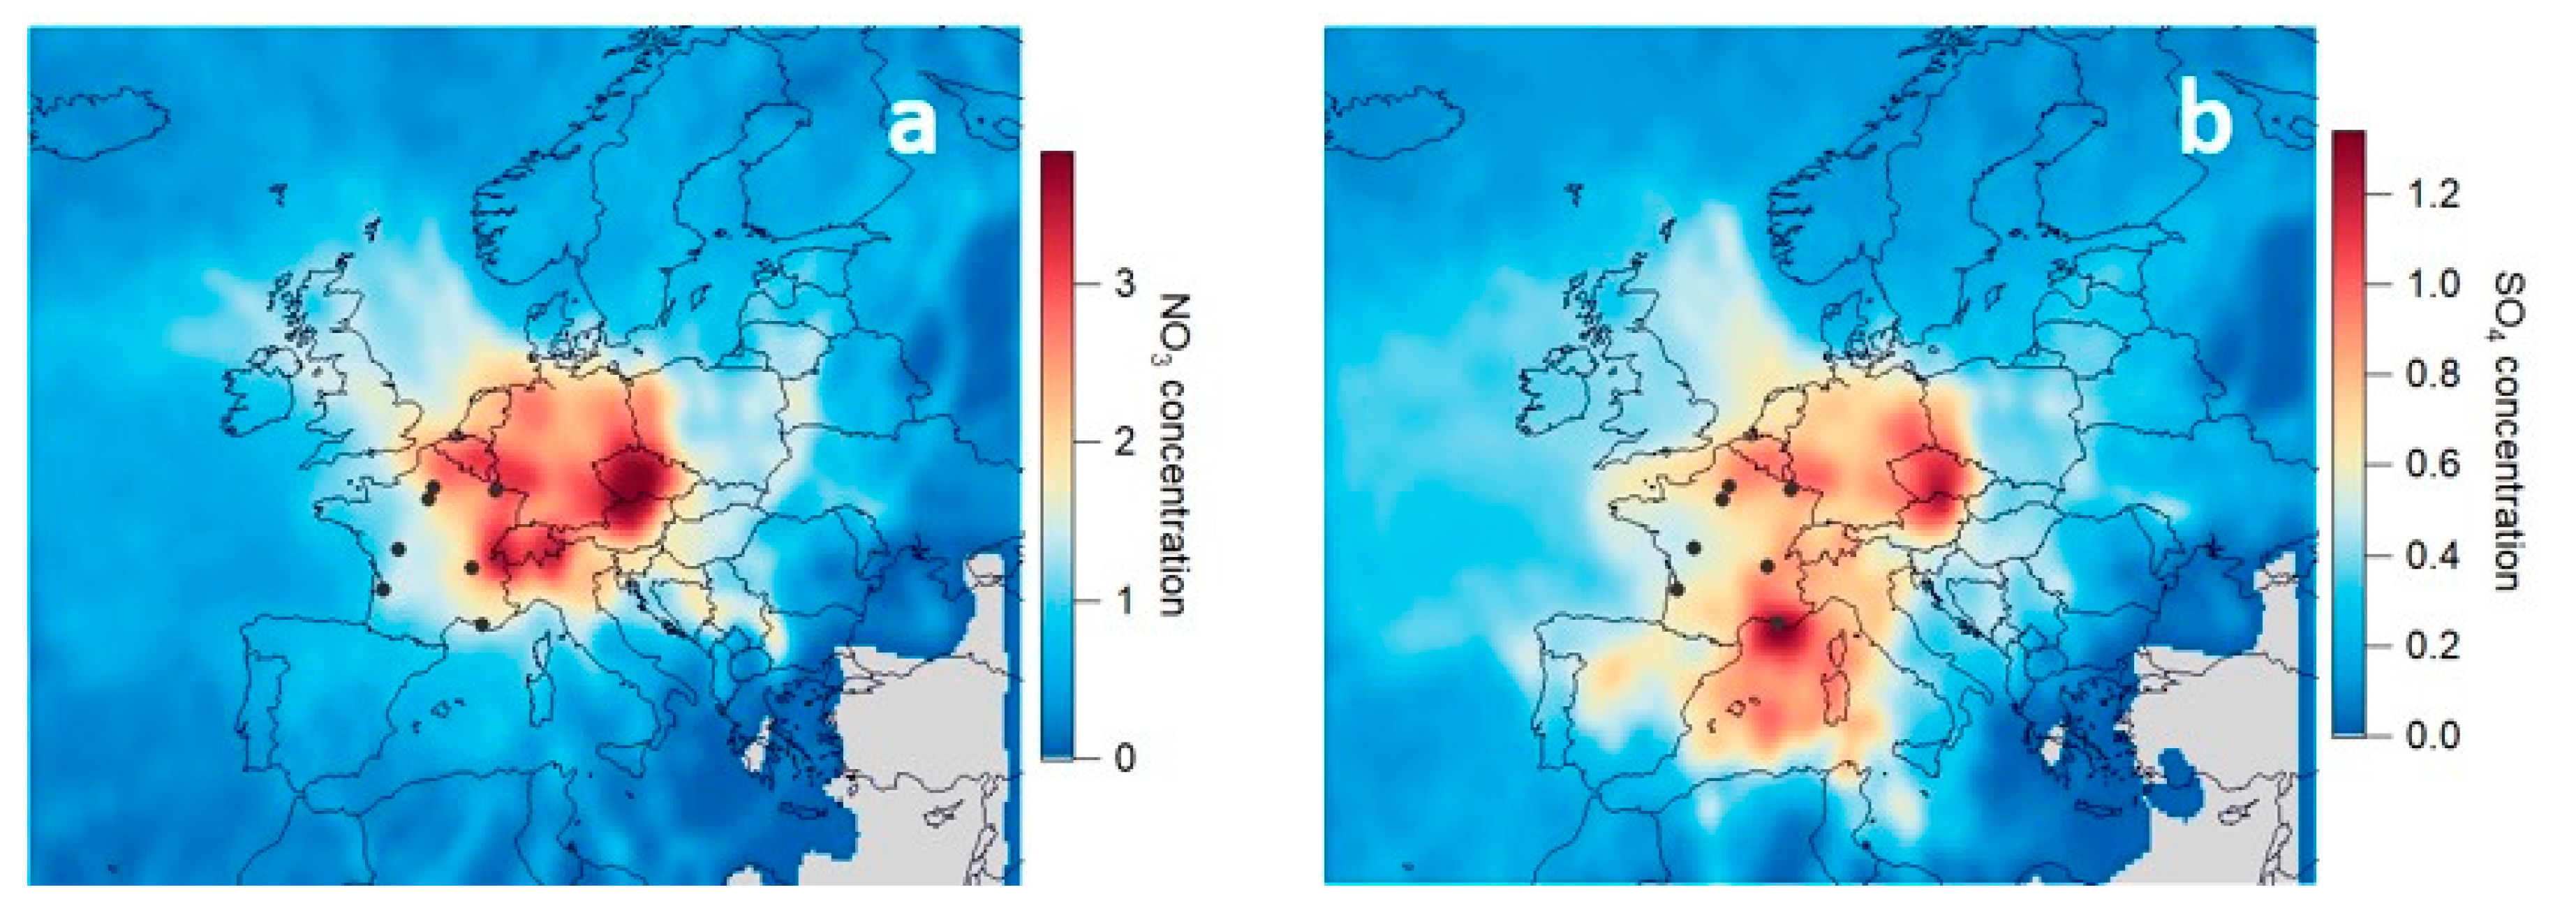
11. Ammonium Sulfate
12. Secondary Organic Aerosols (SOA)
13. Conclusions and Perspectives
Author Contributions
Funding
Data Availability Statement
Acknowledgments
Conflicts of Interest
Appendix A

| Urban Area | Station Name | Operator | Site Type | Airbase ID | Filter Sampling Dates and Mode | ACSM | AE33 |
|---|---|---|---|---|---|---|---|
| Lille | Roubaix-Serre | Atmo HdF | Traffic | FR11034 | 2013–2017: Quasi–continuous | ||
| Lille | Leeds | Atmo HdF | Traffic | FR11007 | 2016–p | ||
| Lille | Fives | Atmo HdF | Urban bckgd | FR11025 | 2015–p | ||
| Lille | Villeneuve d’Asq | IMT LD | Urban bckgd | (ACTRIS) | 2016–p | 2016–p | |
| Lens | Services | Atmo HdF | Urban bckgd | FR28002 | 2008–2011: Quasi–continuous | ||
| Lens | Stade | Atmo HdF | Urban bckgd | FR28131 | 2012–2017: Quasi–continuous | ||
| Creil | Faïencerie | Atmo HdF | Urban bckgd | FR18043 | 2013: Campaign | 2015–p | 2015–p |
| Creil | Nogent sur Oise | Atmo HdF | Peri-urban | FR18019 | 2013–2017: Quasi–continuous | ||
| Rouen | Petit-Quevilly | Atmo Normandie | Urban bckgd | FR25048 | 2008–p: Quasi–continuous | 2013–p | |
| Paris | Gennevilliers | Airparif | Urban bckgd | FR04002 | 2016–17: Campaign | 2015–19 | 2015–p |
| Paris | Paris 13 | Airparif | Urban bckgd | FR04037 | 2015–p | ||
| Paris | Les Halles | Airparif | Urban bckgd | FR04055 | 2019–p | 2019–p | |
| Paris | Bvd Haussmann | Airparif | Traffic | FR04131 | 2015–p | ||
| Paris | Autoroute A1 | Airparif | Traffic | FR04058 | 2015–19 | ||
| Paris | Periph. Auteuil | Airparif | Traffic | FR04053 | 2009–2013: Campaigns | ||
| Paris | Periph. Est | Airparif | Traffic | FR04329 | 2019–p | 2015–p | |
| Paris (region) | SIRTA | LSCE & Ineris | Peri-urban | ACTRIS | 2014–present: Campaigns | 2011–p | 2013–p |
| Orléans | La Source | Lig’air | Urban bckgd | FR34029 | 2016–present: Campaigns, MARGA | 20 | |
| Reims | Jean d’Aulan | Atmo GE | Urban bckgd | FR14012 | 2010–2016: Quasi–continuous | 2020–21 | 2015–p |
| Reims | Doumer | Atmo GE | Traffic | FR14011 | 2016–p | ||
| - | Revin | Atmo GE | Rural bckgd | FR14008 | 2010–present: Quasi–continuous | ||
| Metz | Borny | Atmo GE | Urban bckgd | FR01012 | 2015–2016: Campaign | 2015–p | 2014–p |
| Strasbourg | Clemenceau | Atmo GE | Traffic | FR16034 | 2011–present: Quasi–continuous | 2019–20 | 2019–p |
| Strasbourg | Danube | Atmo GE | Urban bckgd | FR42010 | 2018–p | 2018–p | |
| Mulhouse | Mulhouse Nord | Atmo GE | Urban bckgd | FR16057 | 2008–2012: Quasi–continuous | ||
| - | OPE | ANDRA | Remote | (EMEP) | 2011–p: Campaigns | 2018–p | |
| Belfort-Montbéliard (8 sites) | Atmo BFC | various | 2011–13: (Intensive) Campaigns | 2018–p | |||
| Dijon | Pejoces | Atmo BFC | Traffic | FR26005 | 2018–present: Campaigns | 2019–p | |
| Rennes | Pays-Bas | Air Breizh | Urban bckgd | FR17019 | 2020–p | 2019–p | |
| Nantes | Cim. Bouteillerie | Air PL | Urban bckgd | FR23188 | 2015–present: Quasi–continuous | 2015–p | |
| Poitiers | Augouard | Atmo NA | Urban bckgd | FR09404 | 2015–present: Quasi–continuous | 2015–p | 2015–p |
| Limoges | Berland | Atmo NA | Urban bckgd | FR87085 | 2018–present: Quasi–continuous | 2018–p | |
| Bordeaux | Talence | Atmo NA | Urban bckgd | FR31002 | 2008–present: Quasi–continuous | 2015–p | 2014–p |
| Clermont-Fd | Montferrand | Atmo AuRA | Urban bckgd | FR07004 | 2015–p | ||
| Lyon | Lyon Centre | Atmo AuRA | Urban bckgd | FR20062 | 2008–present: Quasi–continuous | 2015–p | 2014–p |
| Lyon | Jean Jaures | Atmo AuRA | Traffic | FR20070 | 2018–p | ||
| Grenoble | Les Frênes | Atmo AuRA | Urban bckgd | FR15043 | 2008–present: Quasi–continuous | 2014–p | |
| Grenoble | Rondeau | Atmo AuRA | Traffic | FR15039 | 2013: Intensive campaign | ||
| Grenoble | Caserne de Bonne | Atmo AuRA | Urban bckgd | FR15049 | 2017–p | ||
| Chamonix * | Atmo AuRA | Urban bckgd | FR33120 | 2013–15: Campaign | 2013–p | ||
| Passy * | Atmo AuRA | Urban bckgd | FR33220 | 2013–15: Campaign | 2013–p | ||
| Marnaz * | Atmo AuRA | Urban bckgd | FR33320 | 2013-15: (Intensive) Campaign | 2013–p | ||
| Toulouse/Tarbes | Atmo Occitanie | Urban bckgd | FR12030/27 | 2013: Campaign | |||
| Nice | Arson | Atmo Sud | Urban bckgd | FR24036 | 2014–2016: Quasi–continuous | 2014–p | |
| Aix-en-Pvce | Ecole d’Art | Atmo Sud | Urban bckgd | FR03029 | 2015–2016: Quasi–continuous | ||
| Marseille | Longchamps | Atmo Sud | Urban bckgd | FR03043 | 2014–2016: Quasi–continuous | 2017–p | 2014–p |
| Marseille | Marignane | Atmo Sud | Urban bckgd | FR02043 | 2019–p | ||
| Port-de-Bouc | Lecque | Atmo Sud | Urban bckgd | FR02008 | 2014–2016: Quasi–continuous | 2015–p | |
| - | Venaco | Qualit’air Corse | Rural bckgd | FR41024 | 2013–2017: Campaigns | ||
| Saint Pierre (Reunion island) | ORA | Urban bckgd | FR38011/12 | 2011–2012: Campaign | |||
| Fort de France | Bishop | Madininair | Urban bckgd | FR39007 | 2010–2014: Campaigns | ||
| Martinique Island | Madininair | various | 2018: Intensive campaign | ||||
| Guadeloupe Island | Gwad’air | various | 2017–present: Campaigns | ||||
| Cayenne (French Guyana) | Atmo Guyane | Urban bckgd | FR40004 | 2016–2017: Campaign | |||
Appendix B


References
- Beelen, R.; Raaschou-Nielsen, O.; Stafoggia, M.; Andersen, Z.J.; Weinmayr, G.; Hoffmann, B.; Wolf, K.; Samoli, E.; Fischer, P.; Nieuwenhuijsen, M.; et al. Effects of long-term exposure to air pollution on natural-cause mortality: An analysis of 22 European cohorts within the multicentre ESCAPE project. Lancet 2014, 383, 785–795. [Google Scholar] [CrossRef]
- Cohen, A.J.; Brauer, M.; Burnett, R.; Anderson, H.R.; Frostad, J.; Estep, K.; Balakrishnan, K.; Brunekreef, B.; Dandona, L.; Dandona, R.; et al. Estimates and 25-year trends of the global burden of disease attributable to ambient air pollution: An analysis of data from the Global Burden of Diseases Study 2015. Lancet 2017, 389, 1907–1918. [Google Scholar] [CrossRef]
- Daellenbach, K.R.; Uzu, G.; Jiang, J.; Cassagnes, L.-E.; Leni, Z.; Vlachou, A.; Stefenelli, G.; Canonaco, F.; Weber, S.; Segers, A.; et al. Sources of particulate-matter air pollution and its oxidative potential in Europe. Nature 2020, 587, 414–419. [Google Scholar] [CrossRef] [PubMed]
- Favez, O.; Cachier, H.; Chabas, A.; Ausset, P.; Lefevre, R. Crossed optical and chemical evaluations of modern glass soiling in various European urban environments. Atmos. Environ. 2006, 40, 7192–7204. [Google Scholar] [CrossRef]
- Holland, M.; European Environment Agency. Costs of Air Pollution from European Industrial Facilities 2008-2012: An Updated Assessment; Publications Office: Luxembourg, 2014; ISBN 978-92-9213-495-2. [Google Scholar]
- Stocker, T.F.; Intergovernmental Panel on Climate Change (Eds.) Climate Change 2013: The Physical Science Basis. Part of the Working Group I Contribution to the Fifth Assessment Report of the Intergovernmental Panel on Climate Change; Intergovernmental Panel on Climate Change: New York, NY, USA, 2013; ISBN 978-92-9169-138-8. [Google Scholar]
- Ministère de la Transition Ecologique, Service des Données et Etudes Statistiques. Bilan de la Qualité de L’air Extérieur en France en. 2019. Available online: https://www.statistiques.developpement-durable.gouv.fr/bilan-de-la-qualite-de-lair-exterieur-en-france-en-2019-0 (accessed on 2 February 2021).
- Putaud, J.-P.; Raes, F.; Van Dingenen, R.; Brüggemann, E.; Facchini, M.-C.; Decesari, S.; Fuzzi, S.; Gehrig, R.; Hüglin, C.; Laj, P.; et al. A European aerosol phenomenology—2: Chemical characteristics of particulate matter at kerbside, urban, rural and background sites in Europe. Atmos. Environ. 2004, 38, 2579–2595. [Google Scholar] [CrossRef]
- Alastuey, A.; Querol, X.; Aas, W.; Lucarelli, F.; Pérez, N.; Moreno, T.; Cavalli, F.; Areskoug, H.; Balan, V.; Catrambone, M.; et al. Geochemistry of PM10 over Europe during the EMEP intensive measurement periods in summer 2012 and winter 2013. Atmos. Chem. Phys. 2016, 16, 6107–6129. [Google Scholar] [CrossRef]
- Pandolfi, M.; Mooibroek, D.; Hopke, P.; van Pinxteren, D.; Querol, X.; Herrmann, H.; Alastuey, A.; Favez, O.; Hüglin, C.; Perdrix, E.; et al. Long-range and local air pollution: What can we learn from chemical speciation of particulate matter at paired sites? Atmos. Chem. Phys. 2020, 20, 409–429. [Google Scholar] [CrossRef]
- Pandolfi, M.; Alados-Arboledas, L.; Alastuey, A.; Andrade, M.; Angelov, C.; Artiñano, B.; Backman, J.; Baltensperger, U.; Bonasoni, P.; Bukowiecki, N.; et al. A European aerosol phenomenology—6: Scattering properties of atmospheric aerosol particles from 28 ACTRIS sites. Atmos. Chem. Phys. 2018, 18, 7877–7911. [Google Scholar] [CrossRef]
- Laj, P.; Bigi, A.; Rose, C.; Andrews, E.; Lund Myhre, C.; Collaud Coen, M.; Lin, Y.; Wiedensohler, A.; Schulz, M.; Ogren, J.A.; et al. A global analysis of climate-relevant aerosol properties retrieved from the network of Global Atmosphere Watch (GAW) near-surface observatories. Atmos. Meas. Technol. 2020, 13, 4353–4392. [Google Scholar] [CrossRef]
- LCSQA. Programme CARA: Bilan des Travaux de la Première Année (2008–2009). Available online: https://www.lcsqa.org/fr/node/1586/printable/pdf (accessed on 2 February 2021).
- Chevrier, F. Chauffage au Bois et Qualité de L’air en Vallée de l’Arve: Définition d’un Système de Surveillance et Impact d’une Politique de Rénovation du Parc des Appareils Anciens, Grenoble Alpes. Available online: https://www.semanticscholar.org/paper/Chauffage-au-bois-et-qualit%C3%A9-de-l%E2%80%99air-en-Vall%C3%A9e-de-Chevrier/704b4e34836d6a478b25fe5f55253145b18639fc (accessed on 2 February 2021).
- Bessagnet, B.; Menut, L.; Lapere, R.; Couvidat, F.; Jaffrezo, J.-L.; Mailler, S.; Favez, O.; Pennel, R.; Siour, G. High Resolution Chemistry Transport Modeling with the On-Line CHIMERE-WRF Model over the French Alps—Analysis of a Feedback of Surface Particulate Matter Concentrations on Mountain Meteorology. Atmosphere 2020, 11, 565. [Google Scholar] [CrossRef]
- Golly, B.; Waked, A.; Weber, S.; Samake, A.; Jacob, V.; Conil, S.; Rangognio, J.; Chrétien, E.; Vagnot, M.-P.; Robic, P.-Y.; et al. Organic markers and OC source apportionment for seasonal variations of PM2.5 at 5 rural sites in France. Atmos. Environ. 2019, 198, 142–157. [Google Scholar] [CrossRef]
- Farah, A.; Villani, P.; Rose, C.; Conil, S.; Langrene, L.; Laj, P.; Sellegri, K. Characterization of Aerosol Physical and Optical Properties at the Observatoire Pérenne de l’Environnement (OPE) Site. Atmosphere 2020, 11, 172. [Google Scholar] [CrossRef]
- Srivastava, D.; Tomaz, S.; Favez, O.; Lanzafame, G.M.; Golly, B.; Besombes, J.-L.; Alleman, L.Y.; Jaffrezo, J.-L.; Jacob, V.; Perraudin, E.; et al. Speciation of organic fraction does matter for source apportionment. Part 1: A one-year campaign in Grenoble (France). Sci. Total Environ. 2018, 624, 1598–1611. [Google Scholar] [CrossRef] [PubMed]
- Cavalli, F.; Viana, M.; Yttri, K.E.; Genberg, J.; Putaud, J.-P. Toward a standardised thermal-optical protocol for measuring atmospheric organic and elemental carbon: The EUSAAR protocol. Atmos. Meas. Tech. 2010, 3, 79–89. [Google Scholar] [CrossRef]
- Borlaza, L.J.S.; Weber, S.; Uzu, G.; Jacob, V.; Cañete, T.; Favez, O.; Micallef, S.; Trébuchon, C.; Slama, R.; Jaffrezo, J.-L. Disparities in Particulate Matter (PM10) Origins and Oxidative Potential at a City-Scale (Grenoble, France)—Part I: Source Apportionment at Three Neighbouring Sites. Available online: https://acp.copernicus.org/preprints/acp-2020-1144/acp-2020-1144.pdf (accessed on 2 February 2021).
- Srivastava, D.; Favez, O.; Bonnaire, N.; Lucarelli, F.; Haeffelin, M.; Perraudin, E.; Gros, V.; Villenave, E.; Albinet, A. Speciation of organic fractions does matter for aerosol source apportionment. Part 2: Intensive short-term campaign in the Paris area (France). Sci. Total Environ. 2018, 634, 267–278. [Google Scholar] [CrossRef] [PubMed]
- Samaké, A.; Jaffrezo, J.-L.; Favez, O.; Weber, S.; Jacob, V.; Albinet, A.; Riffault, V.; Perdrix, E.; Waked, A.; Golly, B.; et al. Polyols and glucose particulate species as tracers of primary biogenic organic aerosols at 28 French sites. Atmos. Chem. Phys. 2019, 19, 3357–3374. [Google Scholar] [CrossRef]
- Albinet, A.; Nalin, F.; Tomaz, S.; Beaumont, J.; Lestremau, F. A simple QuEChERS-like extraction approach for molecular chemical characterization of organic aerosols: Application to nitrated and oxygenated PAH derivatives (NPAH and OPAH) quantified by GC–NICIMS. Anal. Bioanal. Chem. 2014, 406, 3131–3148. [Google Scholar] [CrossRef]
- Panteliadis, P.; Hafkenscheid, T.; Cary, B.; Diapouli, E.; Fischer, A.; Favez, O.; Quincey, P.; Viana, M.; Hitzenberger, R.; Vecchi, R.; et al. ECOC comparison exercise with identical thermal protocols after temperature offset correction—Instrument diagnostics by in-depth evaluation of operational parameters. Atmos. Meas. Technol. 2015, 8, 779–792. [Google Scholar] [CrossRef]
- Calas, A.; Uzu, G.; Besombes, J.-L.; Martins, J.M.F.; Redaelli, M.; Weber, S.; Charron, A.; Albinet, A.; Chevrier, F.; Brulfert, G.; et al. Seasonal Variations and Chemical Predictors of Oxidative Potential (OP) of Particulate Matter (PM), for Seven Urban French Sites. Atmosphere 2019, 10, 698. [Google Scholar] [CrossRef]
- Samaké, A.; Bonin, A.; Jaffrezo, J.-L.; Taberlet, P.; Weber, S.; Uzu, G.; Jacob, V.; Conil, S.; Martins, J.M.F. High levels of primary biogenic organic aerosols are driven by only a few plant-associated microbial taxa. Atmos. Chem. Phys. 2020, 20, 5609–5628. [Google Scholar] [CrossRef]
- Colette, A.; Favez, O.; Meleux, F.; Chiappini, L.; Haeffelin, M.; Morille, Y.; Malherbe, L.; Papin, A.; Bessagnet, B.; Menut, L.; et al. Assessing in near real time the impact of the April 2010 Eyjafjallajökull ash plume on air quality. Atmos. Environ. 2011, 45, 1217–1221. [Google Scholar] [CrossRef]
- Petit, J.-E.; Favez, O.; Sciare, J.; Crenn, V.; Sarda-Estève, R.; Bonnaire, N.; Močnik, G.; Dupont, J.-C.; Haeffelin, M.; Leoz-Garziandia, E. Two years of near real-time chemical composition of submicron aerosols in the region of Paris using an Aerosol Chemical Speciation Monitor (ACSM) and a multi-wavelength Aethalometer. Atmos. Chem. Phys. 2015, 15, 2985–3005. [Google Scholar] [CrossRef]
- Petit, J.-E.; Amodeo, T.; Meleux, F.; Bessagnet, B.; Menut, L.; Grenier, D.; Pellan, Y.; Ockler, A.; Rocq, B.; Gros, V.; et al. Characterising an intense PM pollution episode in March 2015 in France from multi-site approach and near real time data. Atmos. Environ. 2017, 155, 68–84. [Google Scholar] [CrossRef]
- Drinovec, L.; Močnik, G.; Zotter, P.; Prévôt, A.S.H.; Ruckstuhl, C.; Coz, E.; Rupakheti, M.; Sciare, J.; Müller, T.; Wiedensohler, A.; et al. The “dual-spot”; Aethalometer: An improved measurement of aerosol black carbon with real-time loading compensation. Atmos. Meas. Technol. 2015, 8, 1965–1979. [Google Scholar] [CrossRef]
- Drinovec, L.; Gregorič, A.; Zotter, P.; Wolf, R.; Bruns, E.A.; Prévôt, A.S.H.; Petit, J.-E.; Favez, O.; Sciare, J.; Arnold, I.J.; et al. The filter-loading effect by ambient aerosols in filter absorption photometers depends on the coating of the sampled particles. Atmos. Meas. Technol. 2017, 10, 1043–1059. [Google Scholar] [CrossRef]
- Sandradewi, J.; Prévôt, A.S.H.; Szidat, S.; Perron, N.; Alfarra, M.R.; Lanz, V.A.; Weingartner, E.; Baltensperger, U. Using Aerosol Light Absorption Measurements for the Quantitative Determination of Wood Burning and Traffic Emission Contributions to Particulate Matter. Environ. Sci. Technol. 2008, 42, 3316–3323. [Google Scholar] [CrossRef]
- Ng, N.L.; Herndon, S.C.; Trimborn, A.; Canagaratna, M.R.; Croteau, P.L.; Onasch, T.B.; Sueper, D.; Worsnop, D.R.; Zhang, Q.; Sun, Y.L.; et al. An Aerosol Chemical Speciation Monitor (ACSM) for Routine Monitoring of the Composition and Mass Concentrations of Ambient Aerosol. Aerosol Sci. Technol. 2011, 45, 780–794. [Google Scholar] [CrossRef]
- Freney, E.; Zhang, Y.; Croteau, P.; Amodeo, T.; Williams, L.; Truong, F.; Petit, J.-E.; Sciare, J.; Sarda-Esteve, R.; Bonnaire, N.; et al. The second ACTRIS inter-comparison (2016) for Aerosol Chemical Speciation Monitors (ACSM): Calibration protocols and instrument performance evaluations. Aerosol Sci. Technol. 2019, 53, 830–842. [Google Scholar] [CrossRef]
- Guinot, B.; Cachier, H.; Oikonomou, K. Geochemical perspectives from a new aerosol chemical mass closure. Atmos. Chem. Phys. 2007, 7, 1657–1670. [Google Scholar] [CrossRef]
- Waked, A.; Favez, O.; Alleman, L.Y.; Piot, C.; Petit, J.-E.; Delaunay, T.; Verlinden, E.; Golly, B.; Besombes, J.-L.; Jaffrezo, J.-L.; et al. Source apportionment of PM10 in a north-western Europe regional urban background site (Lens, France) using positive matrix factorization and including primary biogenic emissions. Atmos. Chem. Phys. 2014, 14, 3325–3346. [Google Scholar] [CrossRef]
- Paatero, P.; Tapper, U. Positive matrix factorization: A non-negative factor model with optimal utilization of error estimates of data values. Environmetrics 1994, 5, 111–126. [Google Scholar] [CrossRef]
- Karagulian, F.; Belis, C.A.; Dora, C.F.C.; Prüss-Ustün, A.M.; Bonjour, S.; Adair-Rohani, H.; Amann, M. Contributions to cities’ ambient particulate matter (PM): A systematic review of local source contributions at global level. Atmos. Environ. 2015, 120, 475–483. [Google Scholar] [CrossRef]
- Srivastava, D.; Favez, O.; Perraudin, E.; Villenave, E.; Albinet, A. Comparison of Measurement-Based Methodologies to Apportion Secondary Organic Carbon (SOC) in PM2.5: A Review of Recent Studies. Atmosphere 2018, 9, 452. [Google Scholar] [CrossRef]
- Hopke, P.K.; Dai, Q.; Li, L.; Feng, Y. Global review of recent source apportionments for airborne particulate matter. Sci. Total Environ. 2020, 740, 140091. [Google Scholar] [CrossRef] [PubMed]
- Petit, J.-E.; Pallarès, C.; Favez, O.; Alleman, L.Y.; Bonnaire, N.; Rivière, E. Sources and Geographical Origins of PM10 in Metz (France) Using Oxalate as a Marker of Secondary Organic Aerosols by Positive Matrix Factorization Analysis. Atmosphere 2019, 10, 370. [Google Scholar] [CrossRef]
- Weber, S.; Salameh, D.; Albinet, A.; Alleman, L.Y.; Waked, A.; Besombes, J.-L.; Jacob, V.; Guillaud, G.; Meshbah, B.; Rocq, B.; et al. Comparison of PM10 Sources Profiles at 15 French Sites Using a Harmonized Constrained Positive Matrix Factorization Approach. Atmosphere 2019, 10, 310. [Google Scholar] [CrossRef]
- Belis, C.A.; Pernigotti, D.; Pirovano, G.; Favez, O.; Jaffrezo, J.L.; Kuenen, J.; Denier van Der Gon, H.; Reizer, M.; Riffault, V.; Alleman, L.Y.; et al. Evaluation of receptor and chemical transport models for PM10 source apportionment. Atmos. Environ. X 2020, 5, 100053. [Google Scholar] [CrossRef]
- European Commission; Joint Research Centre. European Guide on Air Pollution Source Apportionment with Receptor Models: Revised Version 2019. Available online: https://ec.europa.eu/jrc/en/publication/european-guide-air-pollution-source-apportionment-receptor-models (accessed on 2 February 2021).
- Canonaco, F.; Crippa, M.; Slowik, J.G.; Baltensperger, U.; Prévôt, A.S.H. SoFi, an IGOR-based interface for the efficient use of the generalized multilinear engine (ME-2) for the source apportionment: ME-2 application to aerosol mass spectrometer data. Atmos. Meas. Tech. 2013, 6, 3649–3661. [Google Scholar] [CrossRef]
- Zhang, Y.; Favez, O.; Petit, J.-E.; Canonaco, F.; Truong, F.; Bonnaire, N.; Crenn, V.; Amodeo, T.; Prévôt, A.S.H.; Sciare, J.; et al. Six-year source apportionment of submicron organic aerosols from near-continuous highly time-resolved measurements at SIRTA (Paris area, France). Atmos. Chem. Phys. 2019, 19, 14755–14776. [Google Scholar] [CrossRef]
- Canonaco, F.; Tobler, A.; Chen, G.; Sosedova, Y.; Slowik, J.G.; Bozzetti, C.; Daellenbach, K.R.; ElHaddad, I.; Crippa, M.; Huang, R.-J.; et al. A New Method for Long-Term Source Apportionment with Time-Dependent Factor Profiles and Uncertainty Assessment Using SOFI Pro: Application to One Year of Organic Aerosol Data. Available online: https://amt.copernicus.org/preprints/amt-2020-204/ (accessed on 2 February 2021).
- Petit, J.-E.; Favez, O.; Sciare, J.; Canonaco, F.; Croteau, P.; Močnik, G.; Jayne, J.; Worsnop, D.; Leoz-Garziandia, E. Submicron aerosol source apportionment of wintertime pollution in Paris, France by double positive matrix factorization (PMFxPMF) using an aerosol chemical speciation monitor (ACSM) and a multi-wavelength Aethalometer. Atmos. Chem. Phys. 2014, 14, 13773–13787. [Google Scholar] [CrossRef]
- Dall’Osto, M.; Paglione, M.; Decesari, S.; Facchini, M.C.; O’Dowd, C.; Plass-Duellmer, C.; Harrison, R.M. On the Origin of AMS “Cooking Organic Aerosol” at a Rural Site. Environ. Sci. Technol. 2015, 49, 13964–13972. [Google Scholar] [CrossRef] [PubMed]
- Favez, O.; Cachier, H.; Sciare, J.; Sarda-Estève, R.; Martinon, L. Evidence for a significant contribution of wood burning aerosols to PM2.5 during the winter season in Paris, France. Atmos. Environ. 2009, 43, 3640–3644. [Google Scholar] [CrossRef]
- Favez, O.; El Haddad, I.; Piot, C.; Boréave, A.; Abidi, E.; Marchand, N.; Jaffrezo, J.-L.; Besombes, J.-L.; Personnaz, M.-B.; Sciare, J.; et al. Inter-comparison of source apportionment models for the estimation of wood burning aerosols during wintertime in an Alpine city (Grenoble, France). Atmos. Chem. Phys. 2010, 10, 5295–5314. [Google Scholar] [CrossRef]
- El Haddad, I.; Marchand, N.; Dron, J.; Temime-Roussel, B.; Quivet, E.; Wortham, H.; Jaffrezo, J.L.; Baduel, C.; Voisin, D.; Besombes, J.L.; et al. Comprehensive primary particulate organic characterization of vehicular exhaust emissions in France. Atmos. Environ. 2009, 43, 6190–6198. [Google Scholar] [CrossRef]
- Aiken, A.C.; DeCarlo, P.F.; Kroll, J.H.; Worsnop, D.R.; Huffman, J.A.; Docherty, K.S.; Ulbrich, I.M.; Mohr, C.; Kimmel, J.R.; Sueper, D.; et al. O/C and OM/OC Ratios of Primary, Secondary, and Ambient Organic Aerosols with High-Resolution Time-of-Flight Aerosol Mass Spectrometry. Environ. Sci. Technol. 2008, 42, 4478–4485. [Google Scholar] [CrossRef]
- LCSQA. Impact de la Combustion de Biomasse sur les Concentrations de PM10 (Programme CARA—Hiver 2014–2015). Available online: https://www.lcsqa.org/fr/rapport/2015/ineris/impact-combustion-biomasse-concentrations-pm10-programme-cara-hiver-2014-2015 (accessed on 2 February 2021).
- LCSQA. Estimation des Concentrations de PM liées à la Combustion de Biomasse à Partir des Mesures D’absorption par le Brown Carbon. Available online: https://www.lcsqa.org/fr/rapport/estimation-des-concentrations-de-pm-liees-la-combustion-de-biomasse-partir-des-mesures (accessed on 2 February 2021).
- Zhang, Y.; Albinet, A.; Petit, J.-E.; Jacob, V.; Chevrier, F.; Gille, G.; Pontet, S.; Chrétien, E.; Dominik-Sègue, M.; Levigoureux, G.; et al. Substantial brown carbon emissions from wintertime residential wood burning over France. Sci. Total Environ. 2020, 743, 140752. [Google Scholar] [CrossRef]
- Chiappini, L.; Verlhac, S.; Aujay, R.; Maenhaut, W.; Putaud, J.P.; Sciare, J.; Jaffrezo, J.L.; Liousse, C.; Galy-Lacaux, C.; Alleman, L.Y.; et al. Clues for a standardised thermal-optical protocol for the assessment of organic and elemental carbon within ambient air particulate matter. Atmos. Meas. Technol. 2014, 7, 1649–1661. [Google Scholar] [CrossRef]
- Simoneit, B.R.T.; Schauer, J.J.; Nolte, C.G.; Oros, D.R.; Elias, V.O.; Fraser, M.P.; Rogge, W.F.; Cass, G.R. Levoglucosan, a tracer for cellulose in biomass burning and atmospheric particles. Atmos. Environ. 1999, 33, 173–182. [Google Scholar] [CrossRef]
- Puxbaum, H.; Caseiro, A.; Sánchez-Ochoa, A.; Kasper-Giebl, A.; Claeys, M.; Gelencsér, A.; Legrand, M.; Preunkert, S.; Pio, C. Levoglucosan levels at background sites in Europe for assessing the impact of biomass combustion on the European aerosol background. J. Geophys. Res. 2007, 112, D23S05. [Google Scholar] [CrossRef]
- LCSQA. Interlaboratory Comparison Organized for the European Laboratories Involved in the Analysis of Levoglucosan and Its Isomers. Available online: https://commons.datacite.org/doi.org/10.13140/rg.2.2.16262.47684 (accessed on 2 February 2021).
- Louchouarn, P.; Kuo, L.-J.; Wade, T.L.; Schantz, M. Determination of levoglucosan and its isomers in size fractions of aerosol standard reference materials. Atmos. Environ. 2009, 43, 5630–5636. [Google Scholar] [CrossRef]
- Crenn, V.; Sciare, J.; Croteau, P.L.; Verlhac, S.; Fröhlich, R.; Belis, C.A.; Aas, W.; Äijälä, M.; Alastuey, A.; Artiñano, B.; et al. ACTRIS ACSM intercomparison—Part 1: Reproducibility of concentration and fragment results from 13 individual Quadrupole Aerosol Chemical Speciation Monitors (Q-ACSM) and consistency with co-located instruments. Atmos. Meas. Technol. 2015, 8, 5063–5087. [Google Scholar] [CrossRef]
- LCSQA-AIRAQ-LGGE. Synthèse des Travaux 2013 du Programme CARA—Annexe A: Caractérisation des Particules sur L’agglomération Bordelaise. Available online: https://www.lcsqa.org/system/files/drc-13-136071-14096a-lcsqa_2013_metrologie_pm_cara_synthese.pdf (accessed on 2 February 2021).
- Aymoz, G.; Jaffrezo, J.-L.; Jacob, V.; Colomb, A.; George, C. Evolution of organic and inorganic components of aerosol during a Saharan dust episode observed in the French Alps. Atmos. Chem. Phys. 2004, 4, 2499–2512. [Google Scholar] [CrossRef]
- Bessagnet, B.; Menut, L.; Aymoz, G.; Chepfer, H.; Vautard, R. Modeling dust emissions and transport within Europe: The Ukraine March 2007 event. J. Geophys. Res. 2008, 113, D15202. [Google Scholar] [CrossRef]
- Amato, F.; Favez, O.; Pandolfi, M.; Alastuey, A.; Querol, X.; Moukhtar, S.; Bruge, B.; Verlhac, S.; Orza, J.A.G.; Bonnaire, N.; et al. Traffic induced particle resuspension in Paris: Emission factors and source contributions. Atmos. Environ. 2016, 129, 114–124. [Google Scholar] [CrossRef]
- Dall’Osto, M.; Harrison, R.M.; Coe, H.; Williams, P.I.; Allan, J.D. Real time chemical characterization of local and regional nitrate aerosols. Atmos. Chem. Phys. 2009, 9, 3709–3720. [Google Scholar] [CrossRef]
- NILU. Evaluation of EMEP Trends Processed with Pyaerocom. Available online: https://actris.nilu.no/content/?pageid=594ab06f0f324a32aa39e1c68d3250b6 (accessed on 2 February 2021).
- Dupont, J.-C.; Haeffelin, M.; Badosa, J.; Elias, T.; Favez, O.; Petit, J.E.; Meleux, F.; Sciare, J.; Crenn, V.; Bonne, J.L. Role of the boundary layer dynamics effects on an extreme air pollution event in Paris. Atmos. Environ. 2016, 141, 571–579. [Google Scholar] [CrossRef]
- LCSQA. Programmes de Recherche Expérimentaux pour L’étude des Sources de PM en Air Ambiant. Available online: https://www.lcsqa.org/fr/rapport/2016/ineris/programmes-recherche-experimentaux-etude-sources-pm-air-ambiant (accessed on 2 February 2021).
- Pandolfi, M.; Alastuey, A.; Pérez, N.; Reche, C.; Castro, I.; Shatalov, V.; Querol, X. Trends analysis of PM source contributions and chemical tracers in NE Spainduring 2004–2014: A multi-exponential approach. Atmos. Chem. Phys. 2016, 16, 11787–11805. [Google Scholar] [CrossRef]
- LCSQA. Surveillance des Hydrocarbures AromatiquesPolycycliques (HAP). Available online: https://be.anses.fr/sites/default/files/BEP-mg-BE18-art3.pdf (accessed on 2 February 2021).
- Aymoz, G.; Jaffrezo, J.L.; Chapuis, D.; Cozic, J.; Maenhaut, W. Seasonal variation of PM10 main constituents in two valleys of the French Alps. I: EC/OC fractions. Atmos. Chem. Phys. 2007, 7, 661–675. [Google Scholar] [CrossRef]
- LCSQA. Traitement Harmonisé de Jeux de Données Multi-Sites Pour L’étude de Sources de PM par Positive Matrix Factorization (PMF). Available online: https://www.lcsqa.org/en/node/1939/printable/pdf (accessed on 2 February 2021).
- Salameh, D.; Pey, J.; Bozzetti, C.; El Haddad, I.; Detournay, A.; Sylvestre, A.; Canonaco, F.; Armengaud, A.; Piga, D.; Robin, D.; et al. Sources of PM2.5 at an urban-industrial Mediterranean city, Marseille (France): Application of the ME-2 solver to inorganic and organic markers. Atmos. Res. 2018, 214, 263–274. [Google Scholar] [CrossRef]
- Roig Rodelas, R.; Chakraborty, A.; Perdrix, E.; Tison, E.; Riffault, V. Real-time assessment of wintertime organic aerosol characteristics and sources at a suburban site in northern France. Atmos. Environ. 2019, 203, 48–61. [Google Scholar] [CrossRef]
- Gilardoni, S.; Massoli, P.; Paglione, M.; Giulianelli, L.; Carbone, C.; Rinaldi, M.; Decesari, S.; Sandrini, S.; Costabile, F.; Gobbi, G.P.; et al. Direct observation of aqueous secondary organic aerosol from biomass-burning emissions. Proc. Natl. Acad. Sci. USA 2016, 113, 10013–10018. [Google Scholar] [CrossRef] [PubMed]
- Brege, M.; Paglione, M.; Gilardoni, S.; Decesari, S.; Facchini, M.C.; Mazzoleni, L.R. Molecular insights on aging and aqueous-phase processing from ambient biomass burning emissions-influenced Po Valley fog and aerosol. Atmos. Chem. Phys. 2018, 18, 13197–13214. [Google Scholar] [CrossRef]
- Reyes-Villegas, E.; Priestley, M.; Ting, Y.-C.; Haslett, S.; Bannan, T.; Le Breton, M.; Williams, P.I.; Bacak, A.; Flynn, M.J.; Coe, H.; et al. Simultaneous aerosol mass spectrometry and chemical ionisation mass spectrometry measurements during a biomass burning event in the UK: Insights into nitrate chemistry. Atmos. Chem. Phys. 2018, 18, 4093–4111. [Google Scholar] [CrossRef]
- Young, D.E.; Allan, J.D.; Williams, P.I.; Green, D.C.; Harrison, R.M.; Yin, J.; Flynn, M.J.; Gallagher, M.W.; Coe, H. Investigating a two-component model of solid fuel organic aerosol in London: Processes, PM1 contributions, and seasonality. Atmos. Chem. Phys. 2015, 15, 2429–2443. [Google Scholar] [CrossRef]
- Xu, L.; Williams, L.R.; Young, D.E.; Allan, J.D.; Coe, H.; Massoli, P.; Fortner, E.; Chhabra, P.; Herndon, S.; Brooks, W.A.; et al. Wintertime aerosol chemical composition, volatility, and spatial variability in the greater London area. Atmos. Chem. Phys. 2016, 16, 1139–1160. [Google Scholar] [CrossRef]
- Srivastava, D.; Favez, O.; Petit, J.-E.; Zhang, Y.; Sofowote, U.M.; Hopke, P.K.; Bonnaire, N.; Perraudin, E.; Gros, V.; Villenave, E.; et al. Speciation of organic fractions does matter for aerosol source apportionment. Part 3: Combining off-line and on-line measurements. Sci. Total Environ. 2019, 690, 944–955. [Google Scholar] [CrossRef]
- Charron, A.; Polo-Rehn, L.; Besombes, J.-L.; Golly, B.; Buisson, C.; Chanut, H.; Marchand, N.; Guillaud, G.; Jaffrezo, J.-L. Identification and quantification of particulate tracers of exhaust and non-exhaust vehicle emissions. Atmos. Chem. Phys. 2019, 19, 5187–5207. [Google Scholar] [CrossRef]
- LCSQA. Caractérisation Chimique et Étude de Sources des Particules en Martinique en 2018. Available online: https://www.lcsqa.org/fr/rapport/caracterisation-chimique-et-etude-de-sources-des-particules-en-martinique-en-2018 (accessed on 2 February 2021).
- Aranke, O.; Algenaid, W.; Awe, S.; Joshi, S. Coatings for Automotive Gray Cast Iron Brake Discs: A Review. Coatings 2019, 9, 552. [Google Scholar] [CrossRef]
- Gonzalez, R.O.; Strekopytov, S.; Amato, F.; Querol, X.; Reche, C.; Weiss, D. New Insights from Zinc and Copper Isotopic Compositions into the Sources of Atmospheric Particulate Matter from Two Major European Cities. Environ. Sci. Technol. 2016, 50, 9816–9824. [Google Scholar] [CrossRef]
- Chatain, M.; Alvarez, R.; Ustache, A.; Rivière, E.; Favez, O.; Pallares, C. Simultaneous Roadside and Urban Background Measurements of Submicron Aerosol Number Concentration and Size Distribution (in the Range 20–800 nm), along with Chemical Composition in Strasbourg, France. Atmosphere 2021, 12, 71. [Google Scholar] [CrossRef]
- Sarda-Estève, R.; Baisnée, D.; Guinot, B.; Sodeau, J.; O’Connor, D.; Belmonte, J.; Besancenot, J.-P.; Petit, J.-E.; Thibaudon, M.; Oliver, G.; et al. Variability and Geographical Origin of Five Years Airborne Fungal Spore Concentrations Measured at Saclay, France from 2014 to 2018. Remote Sens. 2019, 11, 1671. [Google Scholar] [CrossRef]
- Sarda-Estève, R.; Baisnée, D.; Guinot, B.; Mainelis, G.; Sodeau, J.; O’Connor, D.; Besancenot, J.P.; Thibaudon, M.; Monteiro, S.; Petit, J.-E.; et al. Atmospheric Biodetection Part I: Study of Airborne Bacterial Concentrations from January 2018 to May 2020 at Saclay, France. IJERPH 2020, 17, 6292. [Google Scholar] [CrossRef] [PubMed]
- Samaké, A.; Jaffrezo, J.-L.; Favez, O.; Weber, S.; Jacob, V.; Canete, T.; Albinet, A.; Charron, A.; Riffault, V.; Perdrix, E.; et al. Arabitol, mannitol, and glucose as tracers of primary biogenic organic aerosol: The influence of environmental factors on ambient air concentrations and spatial distribution over France. Atmos. Chem. Phys. 2019, 19, 11013–11030. [Google Scholar] [CrossRef]
- Samaké, A.; Martins, J.M.F.; Bonin, A.; Uzu, G.; Taberlet, P.; Conil, S.; Favez, O.; Thomasson, A.; Chazeau, B. Variability of the atmospheric PM10 microbiome in three climatic regions of France. Front. Microbiol. 2020, 11, 576750. [Google Scholar] [CrossRef] [PubMed]
- Bhugwant, C.; Bessafi, M.; Favez, O.; Chiappini, L.; Sieja, B.; Leoz-Garziandia, E. High Contribution of Sea Salt Aerosols on Atmospheric Particles Measured at an Urban Tropical Location in Reunion Island. JEP 2013, 4, 828–842. [Google Scholar] [CrossRef][Green Version]
- Taylor, D.A. Dust in the wind. Environ. Health Perspect. 2002, 110, A80–A87. [Google Scholar] [CrossRef] [PubMed]
- Prospero, J.M. The atmospheric transport of particles to the ocean. In Particle Flux in the Ocean; John Wiley & Sons Ltd.: Chichester, UK; New York, NY, USA, 1996; pp. 19–52. [Google Scholar]
- Prospero, J.M.; Mayol-Bracero, O.L. Understanding the Transport and Impact of African Dust on the Caribbean Basin. Bull. Am. Meteor. Soc. 2013, 94, 1329–1337. [Google Scholar] [CrossRef]
- Perez, L.; Tobias, A.; Querol, X.; Künzli, N.; Pey, J.; Alastuey, A.; Viana, M.; Valero, N.; González-Cabré, M.; Sunyer, J. Coarse Particles From Saharan Dust and Daily Mortality. Epidemiology 2008, 19, 800–807. [Google Scholar] [CrossRef]
- Viel, J.-F.; Mallet, Y.; Raghoumandan, C.; Quénel, P.; Kadhel, P.; Rouget, F.; Multigner, L. Impact of Saharan dust episodes on preterm births in Guadeloupe (French West Indies). Occup. Environ. Med. 2019, 76, 336–340. [Google Scholar] [CrossRef]
- LCSQA. Programme CARA—Bilan des Travaux. 2010. Available online: https://www.lcsqa.org/fr/node/1671/printable/pdf (accessed on 2 February 2021).
- Quenel, P.; Vadel, J.; Garbin, C.; Durand, S.; Favez, O.; Albinet, A.; Raghoumandan, C.; Guyomard-Rabenirina, S.; Alleman, L.Y.; Mercier, F.L. PM10 chemical profile exposure to the French West Indies Guadeloupean population during Saharan dust episodes. Atmosphere. under review.
- Michelot, N.; Endlicher, W.; Carrega, P.; Martin, N.; Favez, O.; Langner, M. Impact of a Saharan dust outbreak on PM10 ground levels in Southeastern France. Climatologie 2016. [Google Scholar] [CrossRef]
- Bourgeois, I.; Savarino, J.; Caillon, N.; Angot, H.; Barbero, A.; Delbart, F.; Voisin, D.; Clément, J.-C. Tracing the Fate of Atmospheric Nitrate in a Subalpine Watershed Using Δ 17 O. Environ. Sci. Technol. 2018, 52, 5561–5570. [Google Scholar] [CrossRef] [PubMed]
- David Felix, J.; Elliott, E.M.; Gish, T.J.; McConnell, L.L.; Shaw, S.L. Characterizing the isotopic composition of atmospheric ammonia emission sources using passive samplers and a combined oxidation-bacterial denitrifier approach: Improved method for isotope characterization of ammonia in air. Rapid Commun. Mass Spectrom. 2013, 27, 2239–2246. [Google Scholar] [CrossRef] [PubMed]
- Zhang, L.; Altabet, M.A.; Wu, T.; Hadas, O. Sensitive Measurement of NH4+ 15N/14N (d15NH4+) at Natural Abundance Levels in Fresh and Saltwaters. Anal. Chem. 2007, 79, 5297–5303. [Google Scholar] [CrossRef] [PubMed]
- David Felix, J.; Elliott, E.M.; Gish, T.; Maghirang, R.; Cambal, L.; Clougherty, J. Examining the transport of ammonia emissions across landscapes using nitrogen isotope ratios. Atmos. Environ. 2014, 95, 563–570. [Google Scholar] [CrossRef]
- Fortems-Cheiney, A.; Dufour, G.; Hamaoui-Laguel, L.; Foret, G.; Siour, G.; Van Damme, M.; Meleux, F.; Coheur, P.-F.; Clerbaux, C.; Clarisse, L.; et al. Unaccounted variability in NH3 agricultural sources detected by IASI contributing to European spring haze episode. Geophys. Res. Lett. 2016, 43, 5475–5482. [Google Scholar] [CrossRef]
- LCSQA. Programme CARA: Bilan des Travaux 2014–2015. Available online: https://www.lcsqa.org/fr/rapport/programme-cara-bilan-des-travaux-2018-2019 (accessed on 2 February 2021).
- Wang, M.; Kong, W.; Marten, R.; He, X.-C.; Chen, D.; Pfeifer, J.; Heitto, A.; Kontkanen, J.; Dada, L.; Kürten, A.; et al. Rapid growth of new atmospheric particles by nitric acid and ammonia condensation. Nature 2020, 581, 184–189. [Google Scholar] [CrossRef]
- Petetin, H.; Sciare, J.; Bressi, M.; Gros, V.; Rosso, A.; Sanchez, O.; Sarda-Estève, R.; Petit, J.-E.; Beekmann, M. Assessing the ammonium nitrate formation regime in the Paris megacity andits representation in the CHIMERE model. Atmos. Chem. Phys. 2016, 16, 10419–10440. [Google Scholar] [CrossRef]
- Petit, J.-E.; Favez, O.; Albinet, A.; Canonaco, F. A user-friendly tool for comprehensive evaluation of the geographical origins of atmospheric pollution: Wind and trajectory analyses. Environ. Model. Softw. 2017, 88, 183–187. [Google Scholar] [CrossRef]
- Boichu, M.; Favez, O.; Riffault, V.; Petit, J.-E.; Zhang, Y.; Brogniez, C.; Sciare, J.; Chiapello, I.; Clarisse, L.; Zhang, S.; et al. Large-scale particulate air pollution and chemical fingerprint of volcanic sulfate aerosols from the 2014–2015 Holuhraun flood lava eruption of Bárðarbunga volcano (Iceland). Atmos. Chem. Phys. 2019, 19, 14253–14287. [Google Scholar] [CrossRef]
- Stein, A.F.; Draxler, R.R.; Rolph, G.D.; Stunder, B.J.B.; Cohen, M.D.; Ngan, F. NOAA’s HYSPLIT Atmospheric Transport and Dispersion Modeling System. Bull. Am. Meteorol. Soc. 2015, 96, 2059–2077. [Google Scholar] [CrossRef]
- Pay, M.T.; Jiménez-Guerrero, P.; Baldasano, J.M. Assessing sensitivity regimes of secondary inorganic aerosol formation in Europe with the CALIOPE-EU modeling system. Atmos. Environ. 2012, 51, 146–164. [Google Scholar] [CrossRef]
- Chazeau, B.; Temime-Roussel, B.; Gille, G.; Mesbah, B.; D’Anna, B.; Wortham, H.; Marchand, N. Measurement Report: Long-Term Real-Time Characterisation of Thesubmicronic Aerosol and Its Atmospheric Dynamic in a Mediterraneancoastal City: Tracking the Polluted Events at the Marseille-Longchampsupersite. Aerosols/Field Measurements/Troposphere/Chemistry (Chemical Composition and Reactions). Available online: https://acp.copernicus.org/preprints/acp-2020-1015/ (accessed on 2 February 2021).
- El Haddad, I.; D’Anna, B.; Temime-Roussel, B.; Nicolas, M.; Boreave, A.; Favez, O.; Voisin, D.; Sciare, J.; George, C.; Jaffrezo, J.-L.; et al. Towards a better understanding of the origins, chemical composition and aging of oxygenated organic aerosols: Case study of a Mediterranean industrialized environment, Marseille. Atmos. Chem. Phys. 2013, 13, 7875–7894. [Google Scholar] [CrossRef]
- Kleindienst, T.E.; Jaoui, M.; Lewandowski, M.; Offenberg, J.H.; Lewis, C.W.; Bhave, P.V.; Edney, E.O. Estimates of the contributions of biogenic and anthropogenic hydrocarbons to secondary organic aerosol at a southeastern US location. Atmos. Environ. 2007, 41, 8288–8300. [Google Scholar] [CrossRef]
- Albinet, A.; Lanzafame, G.M.; Srivastava, D.; Bonnaire, N.; Nalin, F.; Wise, S.A. Analysis and determination of secondary organic aerosol (SOA) tracers (markers) in particulate matter standard reference material (SRM 1649b, urban dust). Anal. Bioanal. Chem. 2019, 411, 5975–5983. [Google Scholar] [CrossRef]
- Lanzafame, G.M.; Srivastava, D.; Favez, O.; Bandowe, B.A.M.; Shahpoury, P.; Lammel, G.; Bonnaire, N.; Alleman, L.Y.; Couvidat, F.; Bessagnet, B.; et al. One-year measurements of secondary organic aerosol (SOA) markers in the Paris region (France): Concentrations, gas/particle partitioning and SOA source apportionment. Sci. Total Environ. 2021, 757, 143921. [Google Scholar] [CrossRef] [PubMed]
- Srivastava, D.; Daellenbach, K.R.; Zhang, Y.; Bonnaire, N.; Chazeau, B.; Perraudin, E.; Gros, V.; Lucarelli, F.; Villenave, E.; Prévôt, A.S.H.; et al. Comparison of five methodologies to apportion organic aerosol sources during a PM pollution event. Sci. Total Environ. 2021, 757, 143168. [Google Scholar] [CrossRef]
- Zhang, Q.; Jimenez, J.L.; Canagaratna, M.R.; Allan, J.D.; Coe, H.; Ulbrich, I.; Alfarra, M.R.; Takami, A.; Middlebrook, A.M.; Sun, Y.L.; et al. Ubiquity and dominance of oxygenated species in organic aerosols in anthropogenically-influenced Northern Hemisphere midlatitudes. Geophys. Res. Lett. 2007, 34. [Google Scholar] [CrossRef]
- Crippa, M.; Canonaco, F.; Slowik, J.G.; El Haddad, I.; DeCarlo, P.F.; Mohr, C.; Heringa, M.F.; Chirico, R.; Marchand, N.; Temime-Roussel, B.; et al. Primary and secondary organic aerosol origin by combined gas-particle phase source apportionment. Atmos. Chem. Phys. 2013, 13, 8411–8426. [Google Scholar] [CrossRef]
- Daellenbach, K.R.; El-Haddad, I.; Karvonen, L.; Vlachou, A.; Corbin, J.C.; Slowik, J.G.; Heringa, M.F.; Bruns, E.A.; Luedin, S.M.; Jaffrezo, J.-L.; et al. Insights into organic-aerosol sources via a novel laser-desorption/ionization mass spectrometry technique applied to one year of PM10 samples from nine sites in central Europe. Atmos. Chem. Phys. 2018, 18, 2155–2174. [Google Scholar] [CrossRef]
- Tremper, A.H.; Font, A.; Priestman, M.; Hamad, S.H.; Chung, T.-C.; Pribadi, A.; Brown, R.J.C.; Goddard, S.L.; Grassineau, N.; Petterson, K.; et al. Field and laboratory evaluation of a high time resolution x-ray fluorescence instrument for determining the elemental composition of ambient aerosols. Atmos. Meas. Technol. 2018, 11, 3541–3557. [Google Scholar] [CrossRef]


Publisher’s Note: MDPI stays neutral with regard to jurisdictional claims in published maps and institutional affiliations. |
© 2021 by the authors. Licensee MDPI, Basel, Switzerland. This article is an open access article distributed under the terms and conditions of the Creative Commons Attribution (CC BY) license (http://creativecommons.org/licenses/by/4.0/).
Share and Cite
Favez, O.; Weber, S.; Petit, J.-E.; Alleman, L.Y.; Albinet, A.; Riffault, V.; Chazeau, B.; Amodeo, T.; Salameh, D.; Zhang, Y.; et al. Overview of the French Operational Network for In Situ Observation of PM Chemical Composition and Sources in Urban Environments (CARA Program). Atmosphere 2021, 12, 207. https://doi.org/10.3390/atmos12020207
Favez O, Weber S, Petit J-E, Alleman LY, Albinet A, Riffault V, Chazeau B, Amodeo T, Salameh D, Zhang Y, et al. Overview of the French Operational Network for In Situ Observation of PM Chemical Composition and Sources in Urban Environments (CARA Program). Atmosphere. 2021; 12(2):207. https://doi.org/10.3390/atmos12020207
Chicago/Turabian StyleFavez, Olivier, Samuël Weber, Jean-Eudes Petit, Laurent Y. Alleman, Alexandre Albinet, Véronique Riffault, Benjamin Chazeau, Tanguy Amodeo, Dalia Salameh, Yunjiang Zhang, and et al. 2021. "Overview of the French Operational Network for In Situ Observation of PM Chemical Composition and Sources in Urban Environments (CARA Program)" Atmosphere 12, no. 2: 207. https://doi.org/10.3390/atmos12020207
APA StyleFavez, O., Weber, S., Petit, J.-E., Alleman, L. Y., Albinet, A., Riffault, V., Chazeau, B., Amodeo, T., Salameh, D., Zhang, Y., Srivastava, D., Samaké, A., Aujay-Plouzeau, R., Papin, A., Bonnaire, N., Boullanger, C., Chatain, M., Chevrier, F., Detournay, A., ... Leoz-Garziandia, E. (2021). Overview of the French Operational Network for In Situ Observation of PM Chemical Composition and Sources in Urban Environments (CARA Program). Atmosphere, 12(2), 207. https://doi.org/10.3390/atmos12020207