Article

Ammonia and PM2.5 Air Pollution in Paris during the 2020 COVID Lockdown

1
LATMOS/IPSL, Sorbonne Université, UVSQ, CNRS, 75252 Paris CEDEX 05, France
2
Laboratoire des Sciences du Climat et de l’Environnement, UMR1572, IPSL/CEA/CNRS/UVSQ, L’Orme des Merisiers, CEA Saclay, 91191 Gif sur Yvette CEDEX, France
3
Department of Physics, University of Toronto, Toronto, ON M5S 1A7, Canada
4
Spectroscopy, Quantum Chemistry and Atmospheric Remote Sensing (SQUARES), Université libre de Bruxelles (ULB), CP160/09 Brussels, Belgium
5
Institut National de l’Environnement Industriel et des Risques, Parc Technologique ALATA, 60550 Verneuil en Halatte, France
*
Author to whom correspondence should be addressed.
Atmosphere 2021, 12(2), 160; https://doi.org/10.3390/atmos12020160
Submission received: 3 December 2020 / Revised: 14 January 2021 / Accepted: 22 January 2021 / Published: 27 January 2021
(This article belongs to the Special Issue Air Pollution and Environment in France)

Abstract

:
During the COVID-19 pandemic, the lockdown reduced anthropogenic emissions of NO2 in Paris. NO2 concentrations recorded in 2020 were the lowest they have been in the past 5 years. Despite these low-NO2 levels, Paris experienced PM2.5 pollution episodes, which were investigated here based on multi-species and multi-platform measurements. Ammonia (NH3) measurements over Paris, derived from a mini-DOAS (differential optical absorption spectroscopy) instrument and the Infrared Atmospheric Sounding Interferometer (IASI) satellite, revealed simultaneous enhancements during the spring PM2.5 pollution episodes. Using the IASI maps and the FLEXPART model, we show that long-range transport had a statistically significant influence on the degradation of air quality in Paris. In addition, concentrations of ammonium (NH4+) and PM2.5 were strongly correlated for all episodes observed in springtime 2020, suggesting that transport of NH3 drove a large component of the PM2.5 pollution over Paris. We found that NH3 was not the limiting factor for the formation of ammonium nitrate (NH4NO3), and we suggest that the conversion of ammonia to ammonium may have been the essential driver.

1. Introduction

Lockdowns imposed to decelerate the spread of the 2020 COVID-19 pandemic have led to substantial reductions of anthropogenic air pollutant emissions. Unprecedented temporal reduction of carbon dioxide (CO2) emissions has been recorded at the global scale [1]. Satellite observations have enabled monitoring the decrease in concentrations of several other gaseous species (https://iasi-ft.eu/covid-19/), such as nitrogen dioxide (NO2) that is mainly emitted by combustion activities (e.g., traffic, power plants, industries) over China, Western Europe, and the United States [2]. Emission abatements also influenced surface measurements of NO2 worldwide, in particular in urban environments, such as in Barcelona (Spain, [3]), several cities in China [4], India [5,6], and Morocco [7].
In addition to primary pollutants, air quality can be affected by complex interactions between diverse air pollutants, transformation processes, and meteorological conditions. The decrease in NOx concentrations, for instance, caused an increase in surface ozone (O3) concentrations in polluted areas on nearly all continents [8], such as over the north of China [4], India [5], Barcelona (Spain, [9]), Rio de Janeiro (Brazil, [10]), and France [11]. Concentrations of fine particulate matter (with an aerodynamic diameter less than 2.5 µm: PM2.5) at ground level has decreased in polluted northern China (from 106° E–125° E and 29° N–41° N, [4]), in India [5], as well as in other major cities around the world [12], whereas severe PM2.5 pollution episodes have been observed over eastern China [13] and Beijing [14].
PM2.5 is especially harmful for human health [15] and climate [16]. PM2.5 has diverse sources in the Paris region: about 60% of its local budget is considered to be emitted locally, mainly from residential wood burning during winter, vehicle exhaust, and non-exhaust traffic emissions throughout the year [17,18], while the remaining fraction is attributed to transport from other French and European regions [19,20,21]. The Paris megacity experiences recurrent PM2.5 pollution episodes during springtime, and the key role of ammonia (NH3) has already been highlighted and analyzed in previous studies [22,23,24,25,26]. NH3 is mainly emitted by the agricultural sector in the region surrounding Paris and can be transported to the city to form secondary aerosols when specific conditions (meteorological and precursor concentrations) are encountered [25]. NH3 is a precursor of ammonium sulfate and nitrate ((NH4)2SO4, NH4NO3) aerosols, which are formed when atmospheric NH3 reacts with sulfuric acid (H2SO4) and nitric acid (HNO3) [27]. In urban areas, HNO3 is formed primarily from the oxidation of NOx (NOx = sum of nitric oxide (NO) and nitrogen dioxide (NO2)), mostly emitted by traffic [28]. The thermodynamic relationships governing the partitioning between the gas and aerosol phases depend on the quantities of NH3 and acid precursors (i.e., SO2 and NOx) and on the meteorological conditions (temperature, relative humidity) [29,30].
In this context, cost-effective means of reducing PM2.5 levels targeting NH3 and/or NOx and SO2 emissions have been analyzed globally [31,32,33], over Europe [34,35], the United States [36,37,38], and China [39], for instance. While it has been suggested that high concentrations of NH3 are crucial for aerosol formation [40], recent studies have demonstrated that NH3 reductions would have mitigation effects only when acidity of the aerosols is low [41,42]. This implies that the fundamental role of NH3 in regulating aerosol formation is complex and still ambiguous.
Satellite instruments are able to monitor NH3 from space at global scale [43,44,45,46,47], but the lack of continuous NH3 measurements over Paris leads to difficulties for reproducing NH3 temporal variability [48,49] and secondary inorganic aerosol formation [23] in atmospheric chemical transport models (CTMs). Representative and long-term monitoring of NH3 in urban areas, such as Paris, is therefore needed to determine its role in particulate atmospheric pollution and better advise policy makers. To measure NH3 continuously over Paris, a mini-DOAS (differential optical absorption spectroscopy) [50] was recently installed in the city center as part of the Qualair instrumental facility [51]. In this study, local NH3 measurements from this mini-DOAS were coupled with satellite observations of NH3 derived from the Infrared Atmospheric Sounding Interferometer (IASI) instruments [52] and with aerosol speciation to better comprehend the Parisian particulate matter air pollution that occurred in spring 2020, when very low atmospheric NO2 levels were recorded.

2. Materials and Methods

2.1. NH3 Observations

2.1.1. Mini-DOAS

The mini-DOAS instrument is based on the open-path differential optical absorption spectroscopy (DOAS) technique, which has been optimized to monitor ambient NH3 concentrations [50,53]. It measures the NH3 absorption band in the UV between 200 and 230 nm (every 5 min) in Paris. The mini-DOAS consists of two parts: the spectrometer/emitter and the retro-reflector, which are installed 19.8 m apart from each other, both located at 122 m above ground level on the roof of Sorbonne University (at 850 m from Paris city center, see Supplementary Materials S1). By collecting the reflected light back onto a detector, the integrated concentration of NH3 along the optical path can be determined. By dividing the integrated concentration by the length of the absorption path, the average NH3 concentration (in µg/m3) is obtained over the optical path [54]. The mini-DOAS system was evaluated during dedicated field campaigns, which demonstrated its reliability for measuring NH3 concentrations over an urban area [55] and NH3 vertical profiles [56] as well as its adequacy for long-term monitoring of NH3 in an air quality network [57].
The mini-DOAS used in this study was installed at the Qualair facility in December 2019 and has operated since then. This new dataset presented the only current continuous (day and night) NH3 measurements at high temporal frequency in Paris. Over the period of study (January–June 2020), the mini-DOAS recorded mean hourly NH3 concentrations up to 22.6 µg/m3 with a mean concentration of 2 µg/m3. An error analysis allowed estimating an average noise error on the hourly measurements of 1.6% and a detection limit of 0.5 µg/m3 [50].

2.1.2. IASI

The Infrared Atmospheric Sounding Interferometer (IASI) is a spectrometer launched on board the MetOp polar orbiting satellites A, B, and C in October 2006, September 2012, and November 2018, respectively. It is operated by EUMETSAT (European Organisation for the Exploitation of Meteorological Satellites) to measure the thermal infrared radiation of the Earth in the spectral range from 645 to 2760 cm−1 with a spectral resolution of 0.5 cm−1 (apodized). The three IASI instruments (onboard MetOp A, B, and C) have a nadir-viewing geometry and a field of view composed of 2 × 2 pixels of 12 km diameter each at nadir [52]. Measurements are performed at 09:30 and 21:30 local mean solar time for the descending and ascending orbits, respectively.
The IASI NH3 total column concentrations used in this study were derived by means of the Artificial Neural Network for IASI algorithm [58,59]. Morning observations from the version 3 of the near-real time dataset were used (ANNI-NH3-v3, see [60]). The number of available NH3 observations fluctuated with the state of the atmosphere being remotely sensed (e.g., thermal contrast and cloud cover).
In this work, the IASI satellite observations were used to study the transport of NH3 over Paris to identify the source regions of NH3 during the pollution episodes and to evaluate the local NH3 concentrations derived from the mini-DOAS. Therefore, we considered all measurements from IASI on board MetOp A, B, and C jointly to maximize the number of observations within a 50-km radius circle centered in Paris city center (Figure S1 in Supplementary Materials).

2.2. Particulate Matter and NO2 In Situ Measurements

2.2.1. PM2.5 and NO2 Concentrations

Hourly PM2.5 and NO2 concentrations were measured using automated measurement systems [61] and chemiluminescence analyzers [62], respectively. Data were obtained via the open access database provided by Airparif, the association responsible for air quality monitoring in the Paris region (https://www.airparif.asso.fr/en/telechargement/telechargement-polluant). Over the studied period (and the investigated pollution events), PM2.5 and NO2 averaged concentrations were 12 (28) and 29 (35) µg/m3, respectively. The spatial variability of hourly concentrations, calculated as the standard deviation (SD) of the datasets available for 13 stations (Figure S1), led to an average value of 4 (7) and 22 (17) µg/m3, respectively. Considering such limited variabilities, mean PM2.5 and NO2 concentrations representative of regional conditions are estimated here as the average of measurements at all of these stations.

2.2.2. Chemical Speciation of Submicron Aerosols

The major submicron chemical components (with an aerodynamic diameter less than 1 µm: PM1) have been continuously characterized from 2012 onward at the SIRTA facility located about 20 km southwest of Paris city center ([63]; see Figure S1) and integrated in the European ACTRIS research infrastructure. Measurements are based on online mass spectrometry with the Aerosol Chemical Speciation Monitor (ACSM, [64]). The ACSM provides concentrations of Organic Matter (OM), nitrate, sulfate, ammonium, and chloride collected at 30-min time intervals. Details of its onsite deployment and quality control and quality assurance procedures can be found elsewhere [18,65,66]. Measurements of these chemical species at SIRTA are assessed as representative of air quality conditions in the Paris region [65,67]. Hourly PM2.5 and PM1 concentrations measured at SIRTA were strongly correlated with the average of measurements at all the Airparif stations with R = 0.94 and R = 0.92 (p-value < 0.05), respectively, for the period of this study (see Figure S2).

2.3. The Lagrangian Particle Dispersion Model FLEXPART

The Flexible Particle (FLEXPART) model [68,69] has been used to compute airmasses’ back-trajectories in order to investigate the geographical sources of pollution transported over Paris. FLEXPART is a Lagrangian tracer dispersion model, which compares well with other widely used models such as HYSPLIT (Hybrid Single Particle Lagrangian Integrated Trajectory) or STILT (Stochastic Time-Inverted Lagrangian Transport), for instance [70,71]. To determine the emission sensitivity response functions to various regions (i.e., influence of a particular geographical region to the measurements made in Paris), meteorological data from the National Centers for Environmental Prediction (NCEP) Climate Forecast System (CFS v.2) 6-h product [72] were used. The model runs involved releasing an ensemble of 160,000 tracer particles in a 0.5° × 0.5° grid box centered around the Paris city-center at altitudes ranging from 200 to 300 m.

3. Results

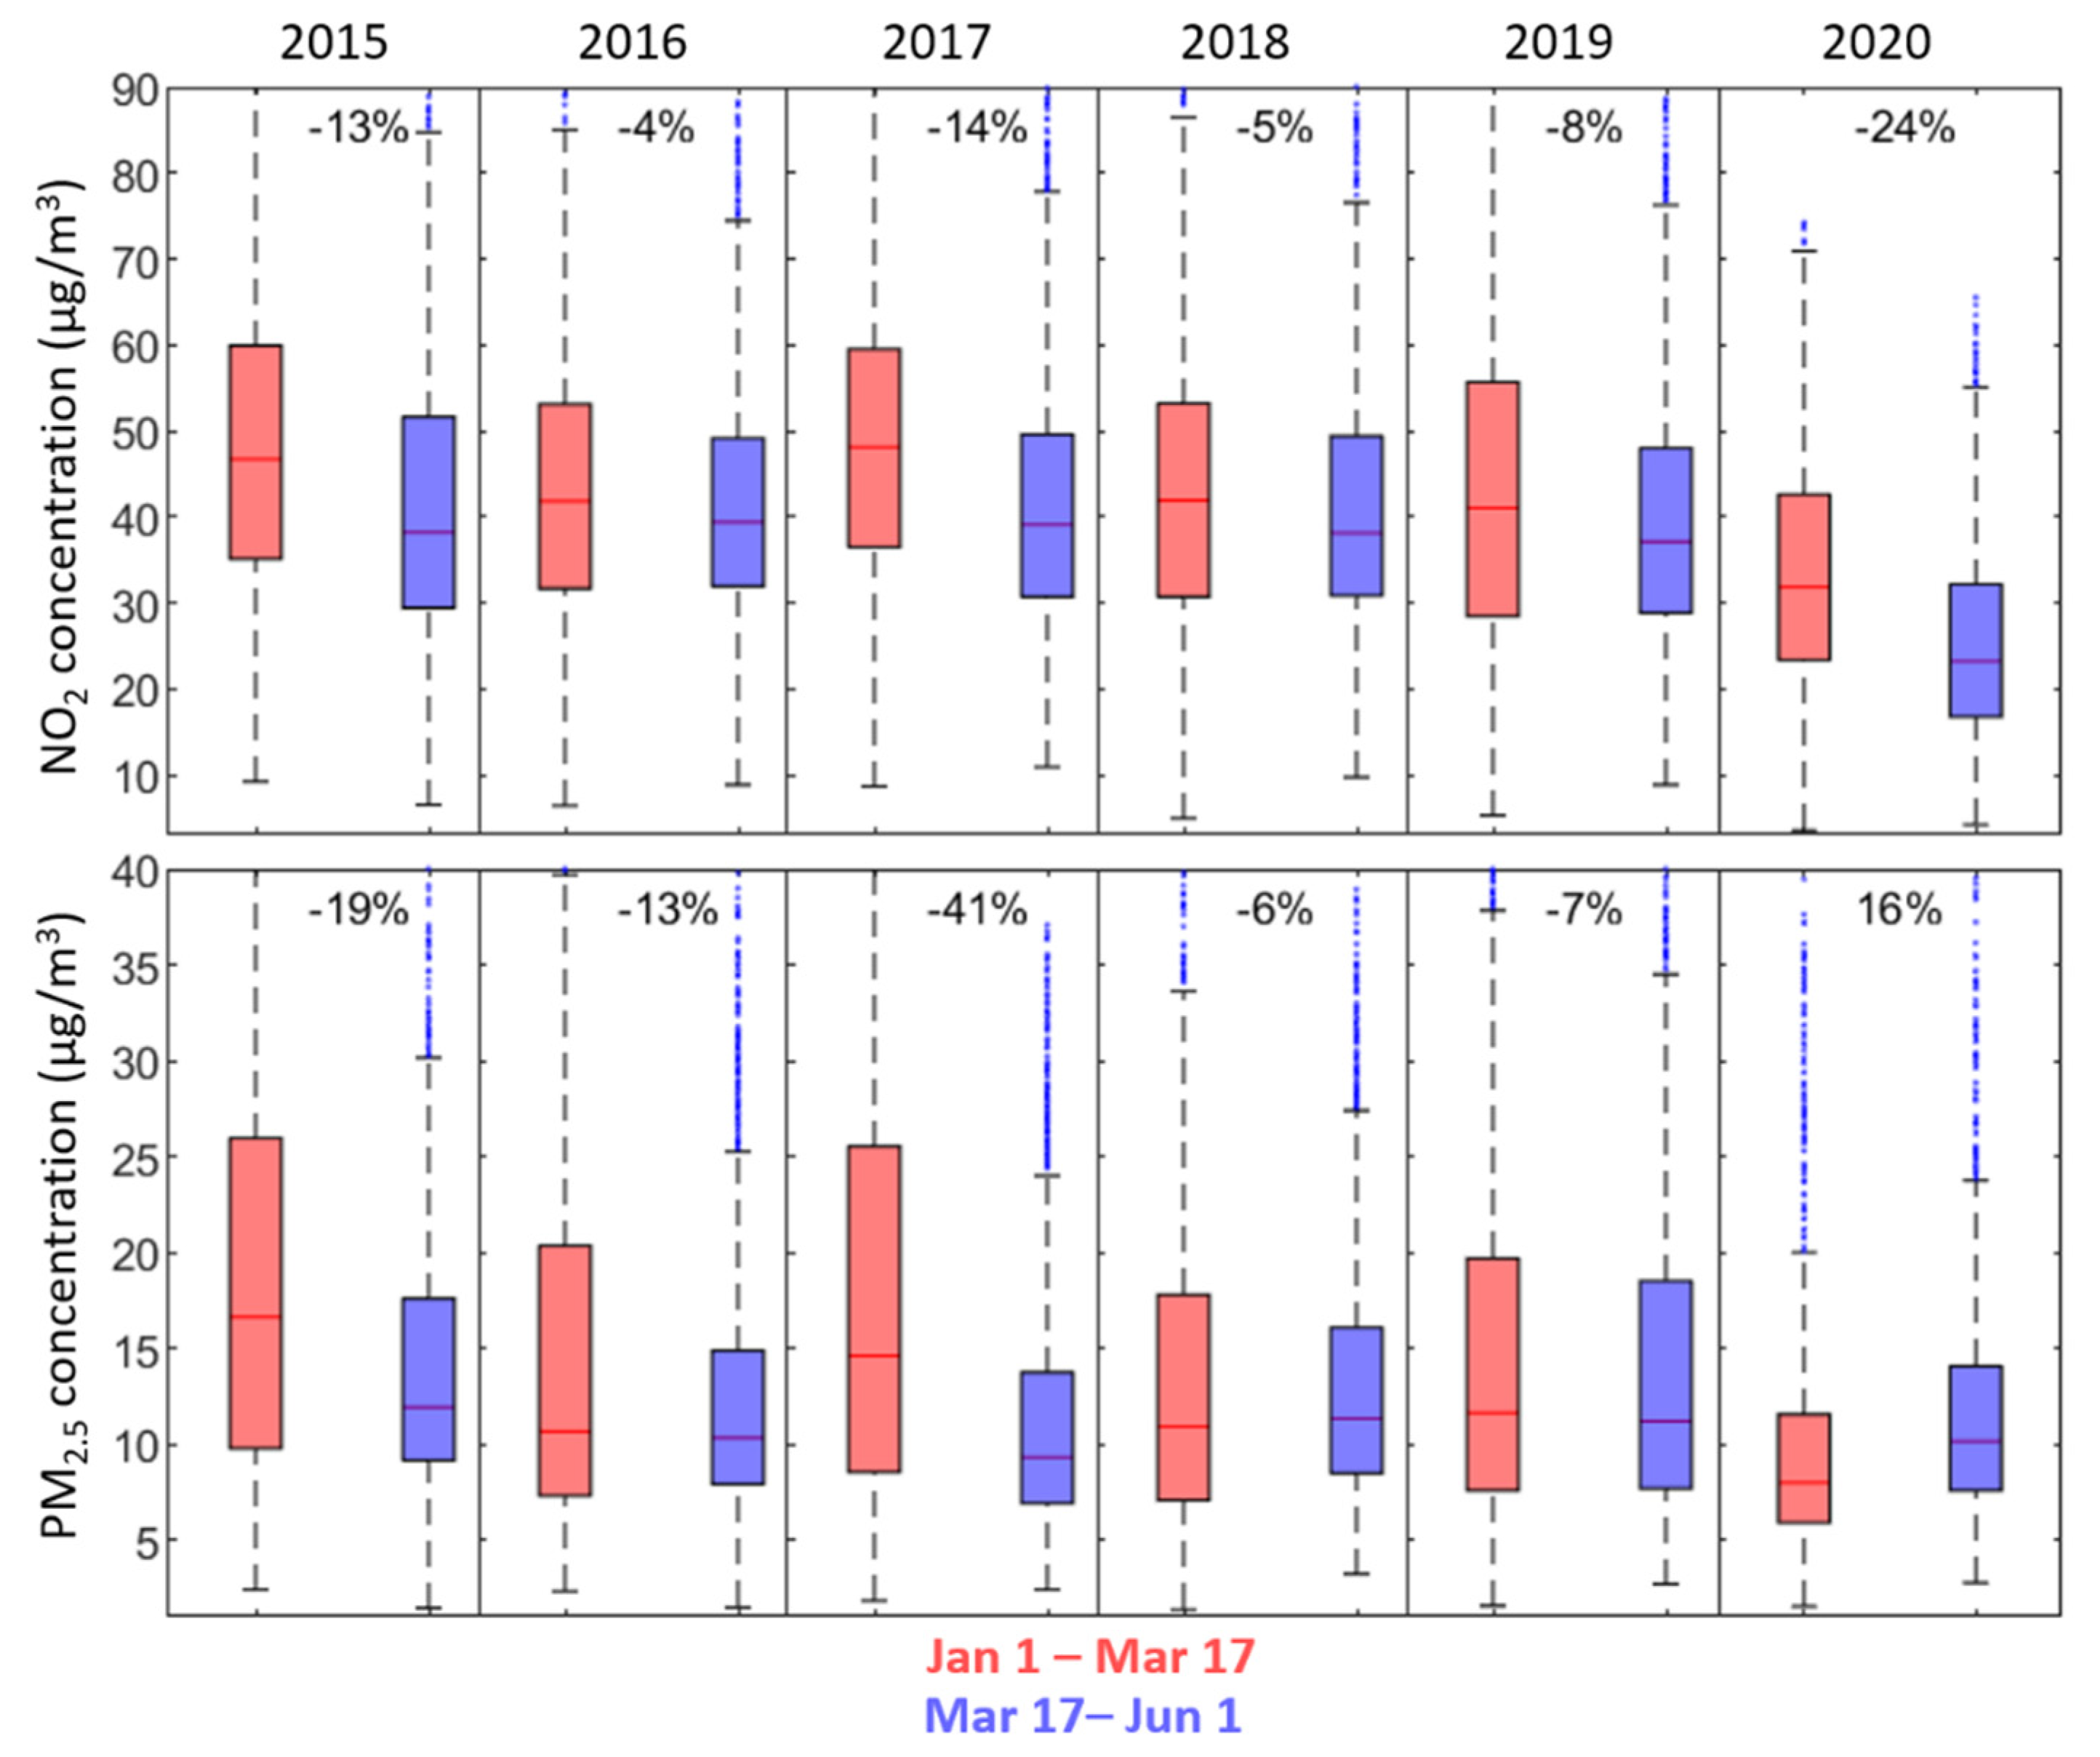
3.1. NO2 and PM2.5 Concentrations during the 2020 Lockdown

The lockdown imposed in France from 17 March 2020 resulted in a significant reduction of emission of air pollutants. Over Paris, the usual 15.5 million daily motorized transport trips were highly limited, halving the daily NO2 emissions for the first 3 weeks after lockdown [73]. Consequently, concentrations of NO2 diminished by 24% (averaged over 17 March–1 June, compared to 1 January–17 March 2020, see top right panel of Figure 1). This value was lower than that for emission reductions (24% compared to 50%) because of complexity of the atmospheric chemical system [74] and also because of the drier meteorological conditions, i.e., unusual precipitation rate in March and April (Figure S3), which favored accumulation of pollutants in the atmosphere. Before lockdown, NO2 and PM2.5 concentrations were also much lower than usual (−28 and −39%, respectively) due to enhanced dispersion conditions associated with a high occurrence of oceanic air masses, along with precipitation and high wind speed (Figure S3). Nevertheless, NO2 concentrations recorded during the 2020 lockdown were at their lowest than in the last 5 years.
On the other end, concentrations of PM2.5 appeared to have been barely affected by the lockdown and, contrasting with previous years at the same time periods, a 16% increase was observed after the start of lockdown (averaged over 17 March–1 June compared to 1 January–17 March 2020, see bottom right panel of Figure 1). The high interannual variability of PM2.5 concentrations for the first five months of the year (box plot’s length in lower panels of Figure 1) seemed to indicate no significant patterns (reduction or increase) compared to the mean of the five previous years. Meteorological conditions highly influence PM variability in Paris [75].

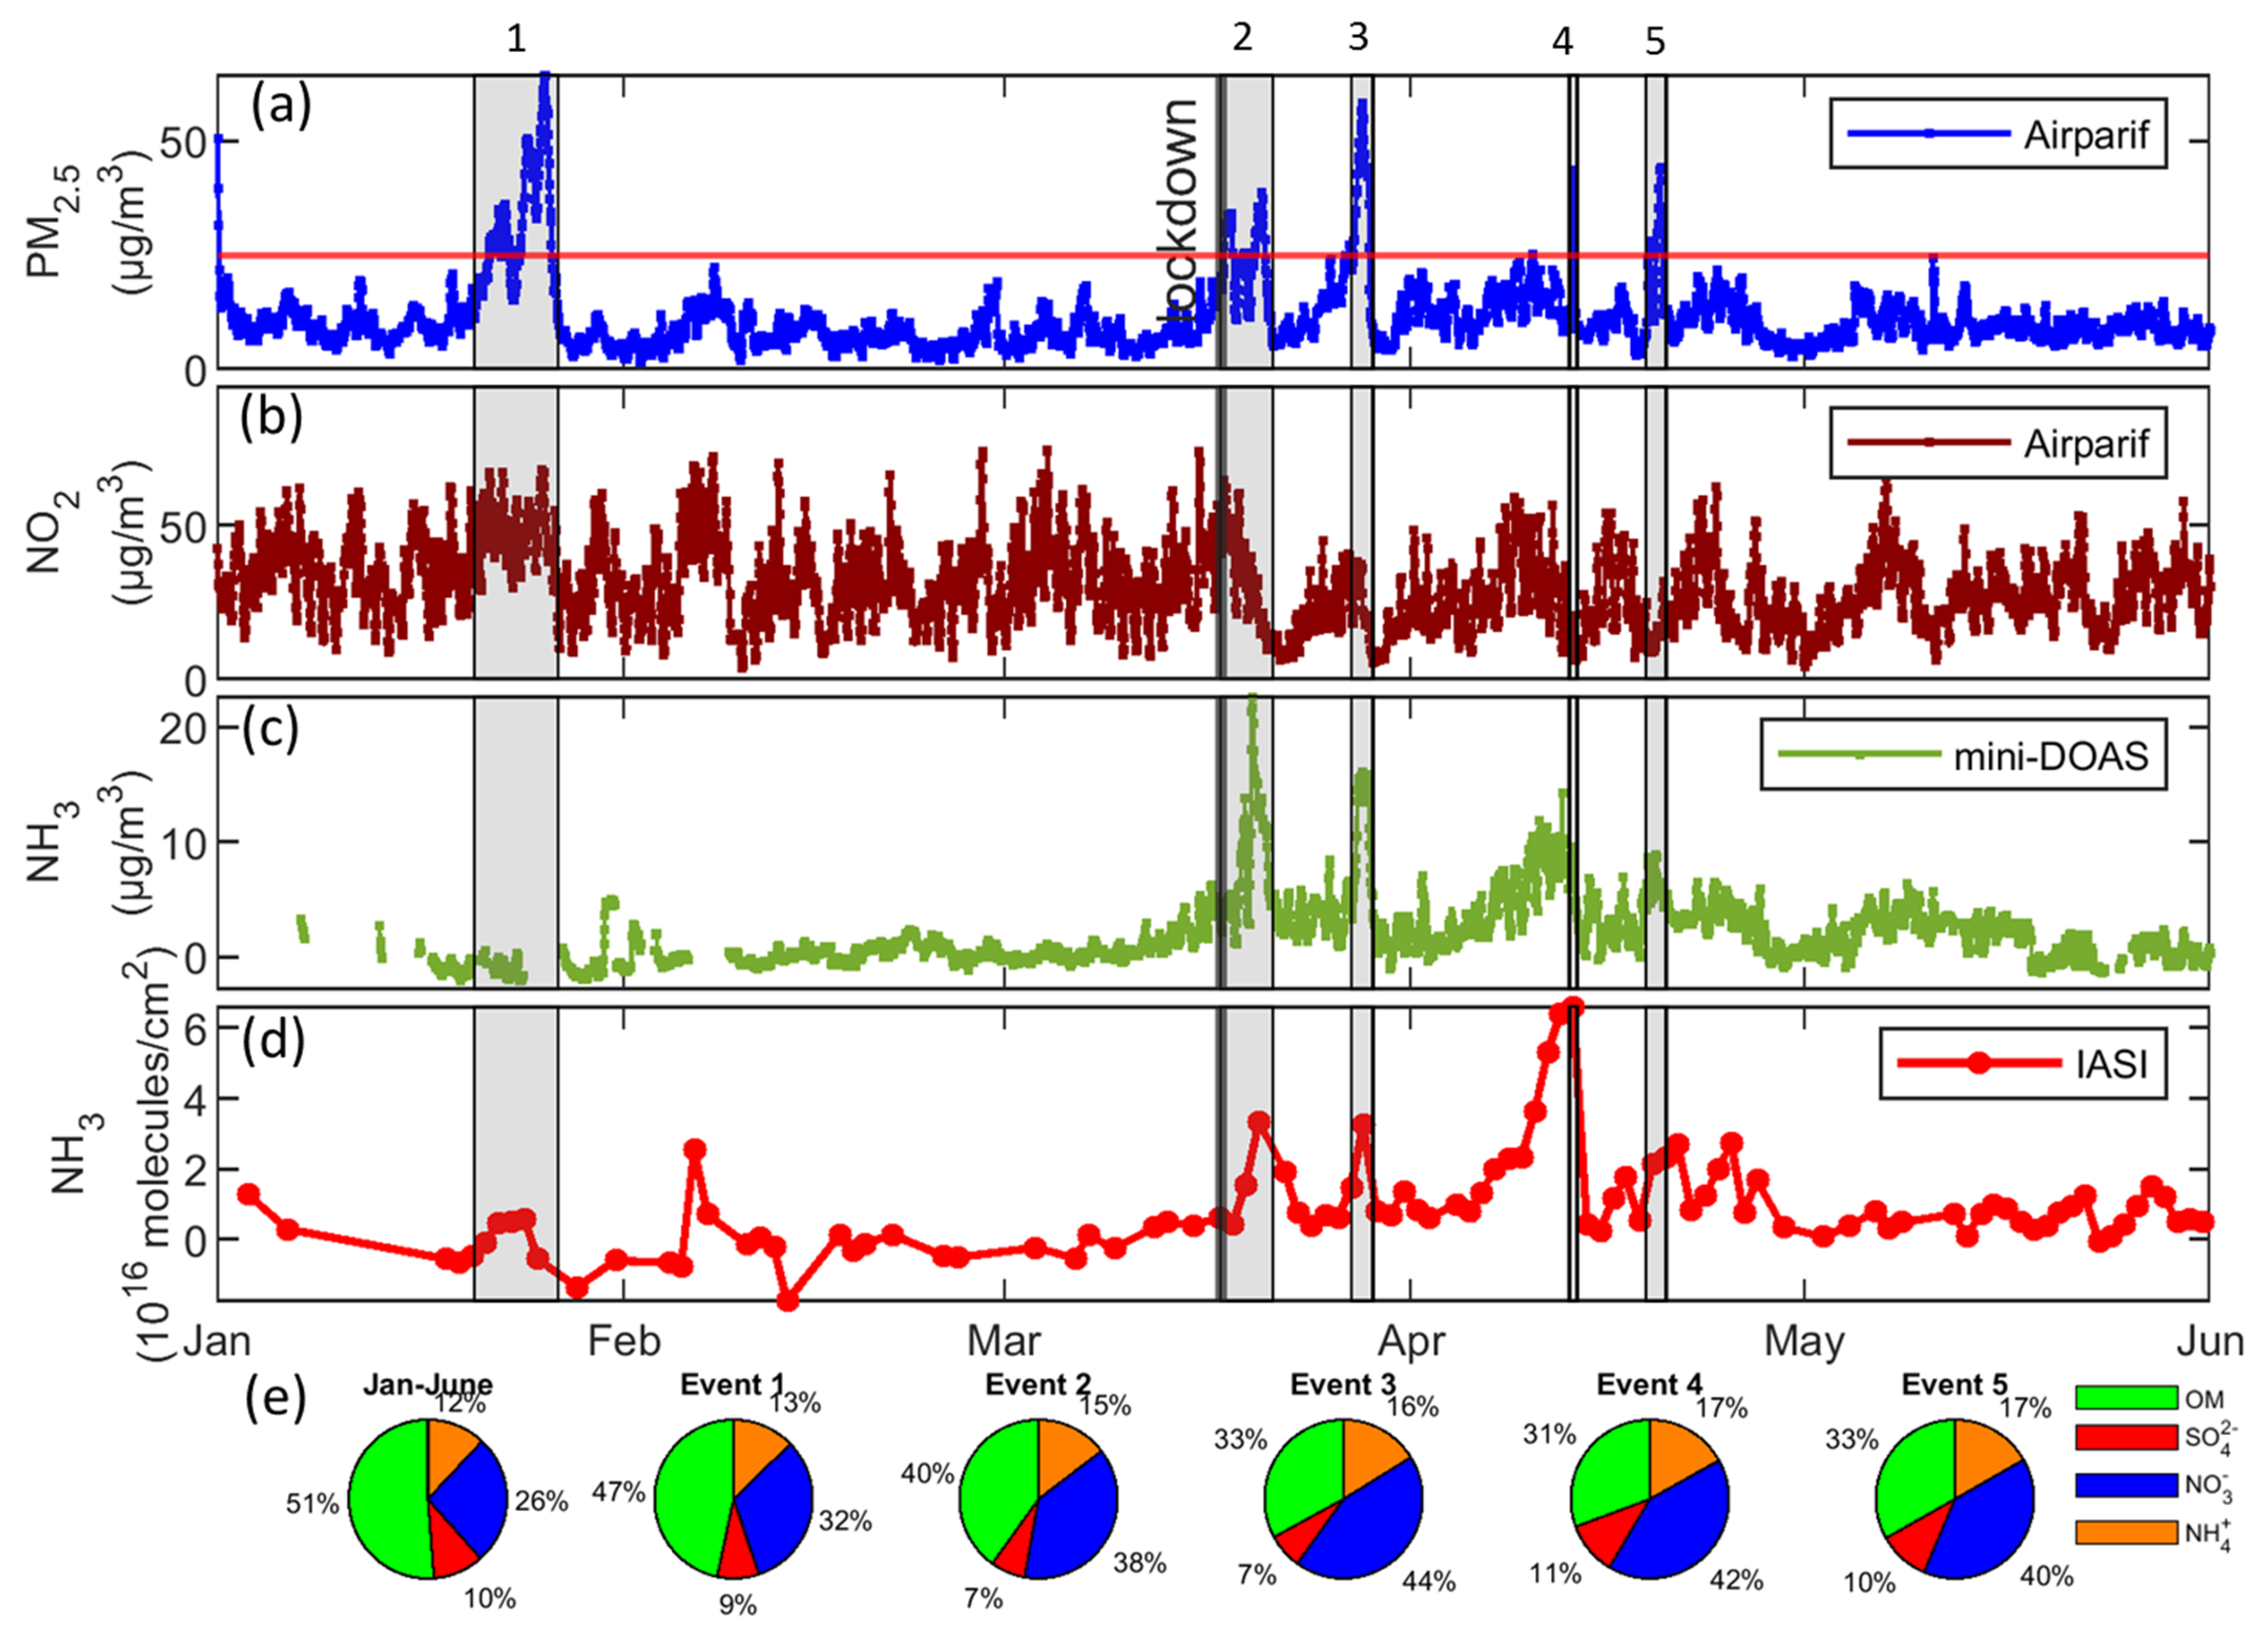
3.2. Identification of PM2.5 Pollution Episodes

Despite the exceptional lockdown situation that significantly reduced NO2 concentrations, the Paris megacity experienced several fine particulate pollution episodes in 2020. Here we chose to use a threshold of 25 µg/m3 on hourly concentrations to identify and investigate all five PM2.5 pollution episodes occurring in Paris. We note that four of the five episodes were observed during the lockdown period. Table 1 summarizes the dates of these episodes, along with the associated mean and 1-σ (standard deviation) of PM2.5 and NH3 concentrations measured in Paris by Airparif and at the Qualair facility, respectively. Averaged PM2.5 and NH3 concentrations over the period of study (Jan–June 2020) were 12 µg/m3 and 2 µg/m3. Pollution episodes differed in duration: 165 h, 96 h, 41 h, 13 h, and 37 h for event 1, 2, 3, 4, and 5, respectively, and composition: event 1 with high PM2.5 (31 µg/m3) but low NH3 concentrations (below detection limit: 0.5 µg/m3) whereas event 3 exhibited both high PM2.5 (36 µg/m3) and NH3 (11 µg/m3) concentrations.
NH3 concentrations derived from both the mini-DOAS and IASI, as well as the speciation of aerosols, are shown in Figure 2 (for Jan–Jun 2020) and Figure S4 (pollution episodes).
Simultaneous increases of PM2.5 and NH3 hourly concentrations were observed during most of pollution episodes (Figure 2). The aerosol composition differed, however, between episodes, with varying dominating contribution of organic matter (OM), sulfate (SO42−), nitrate (NO3), or ammonium (NH4+). The IASI total columns averaged within a 50-km circle radius centered on the Paris city center were also higher during the pollution episodes. In addition, the mini-DOAS NH3 measurements were in strong agreement with IASI data, with Pearson’s correlation coefficient R = 0.75 (p-value < 1 × 10⁻¹⁶) over 85 days of coincident observations (see Figure S5), illustrating the high quality of the new mini-DOAS dataset and its representativeness of the Paris area.

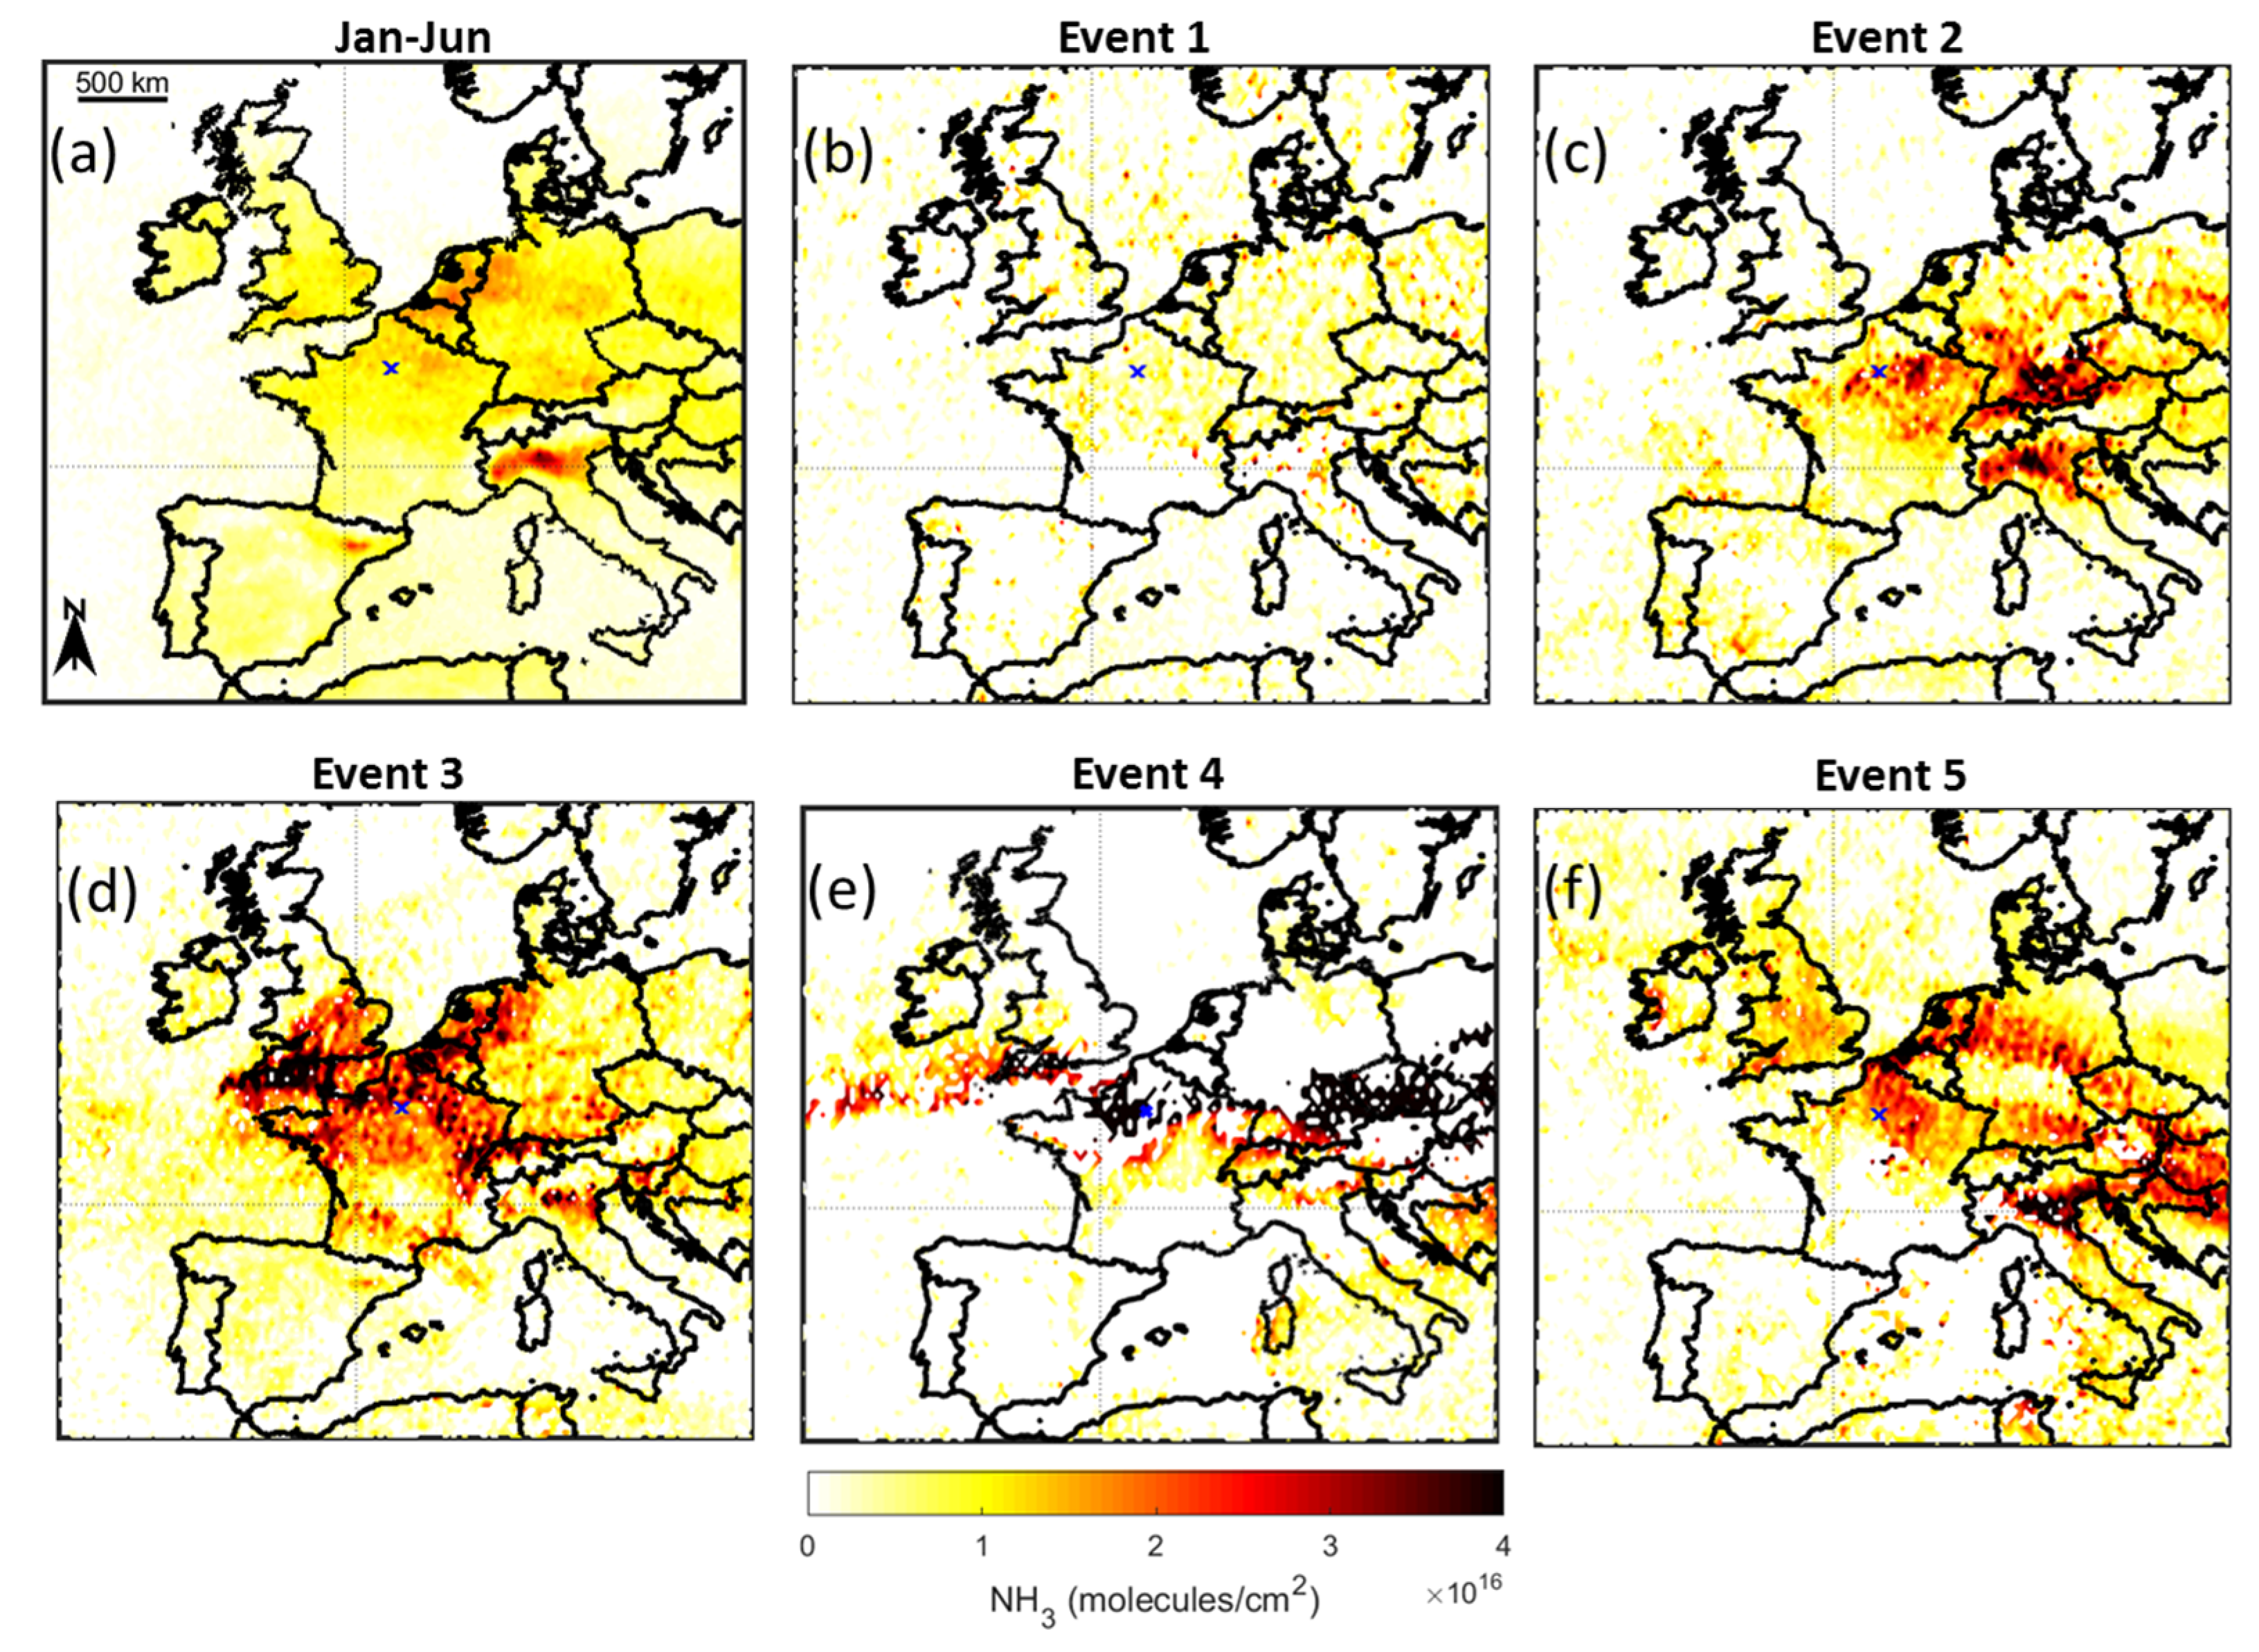
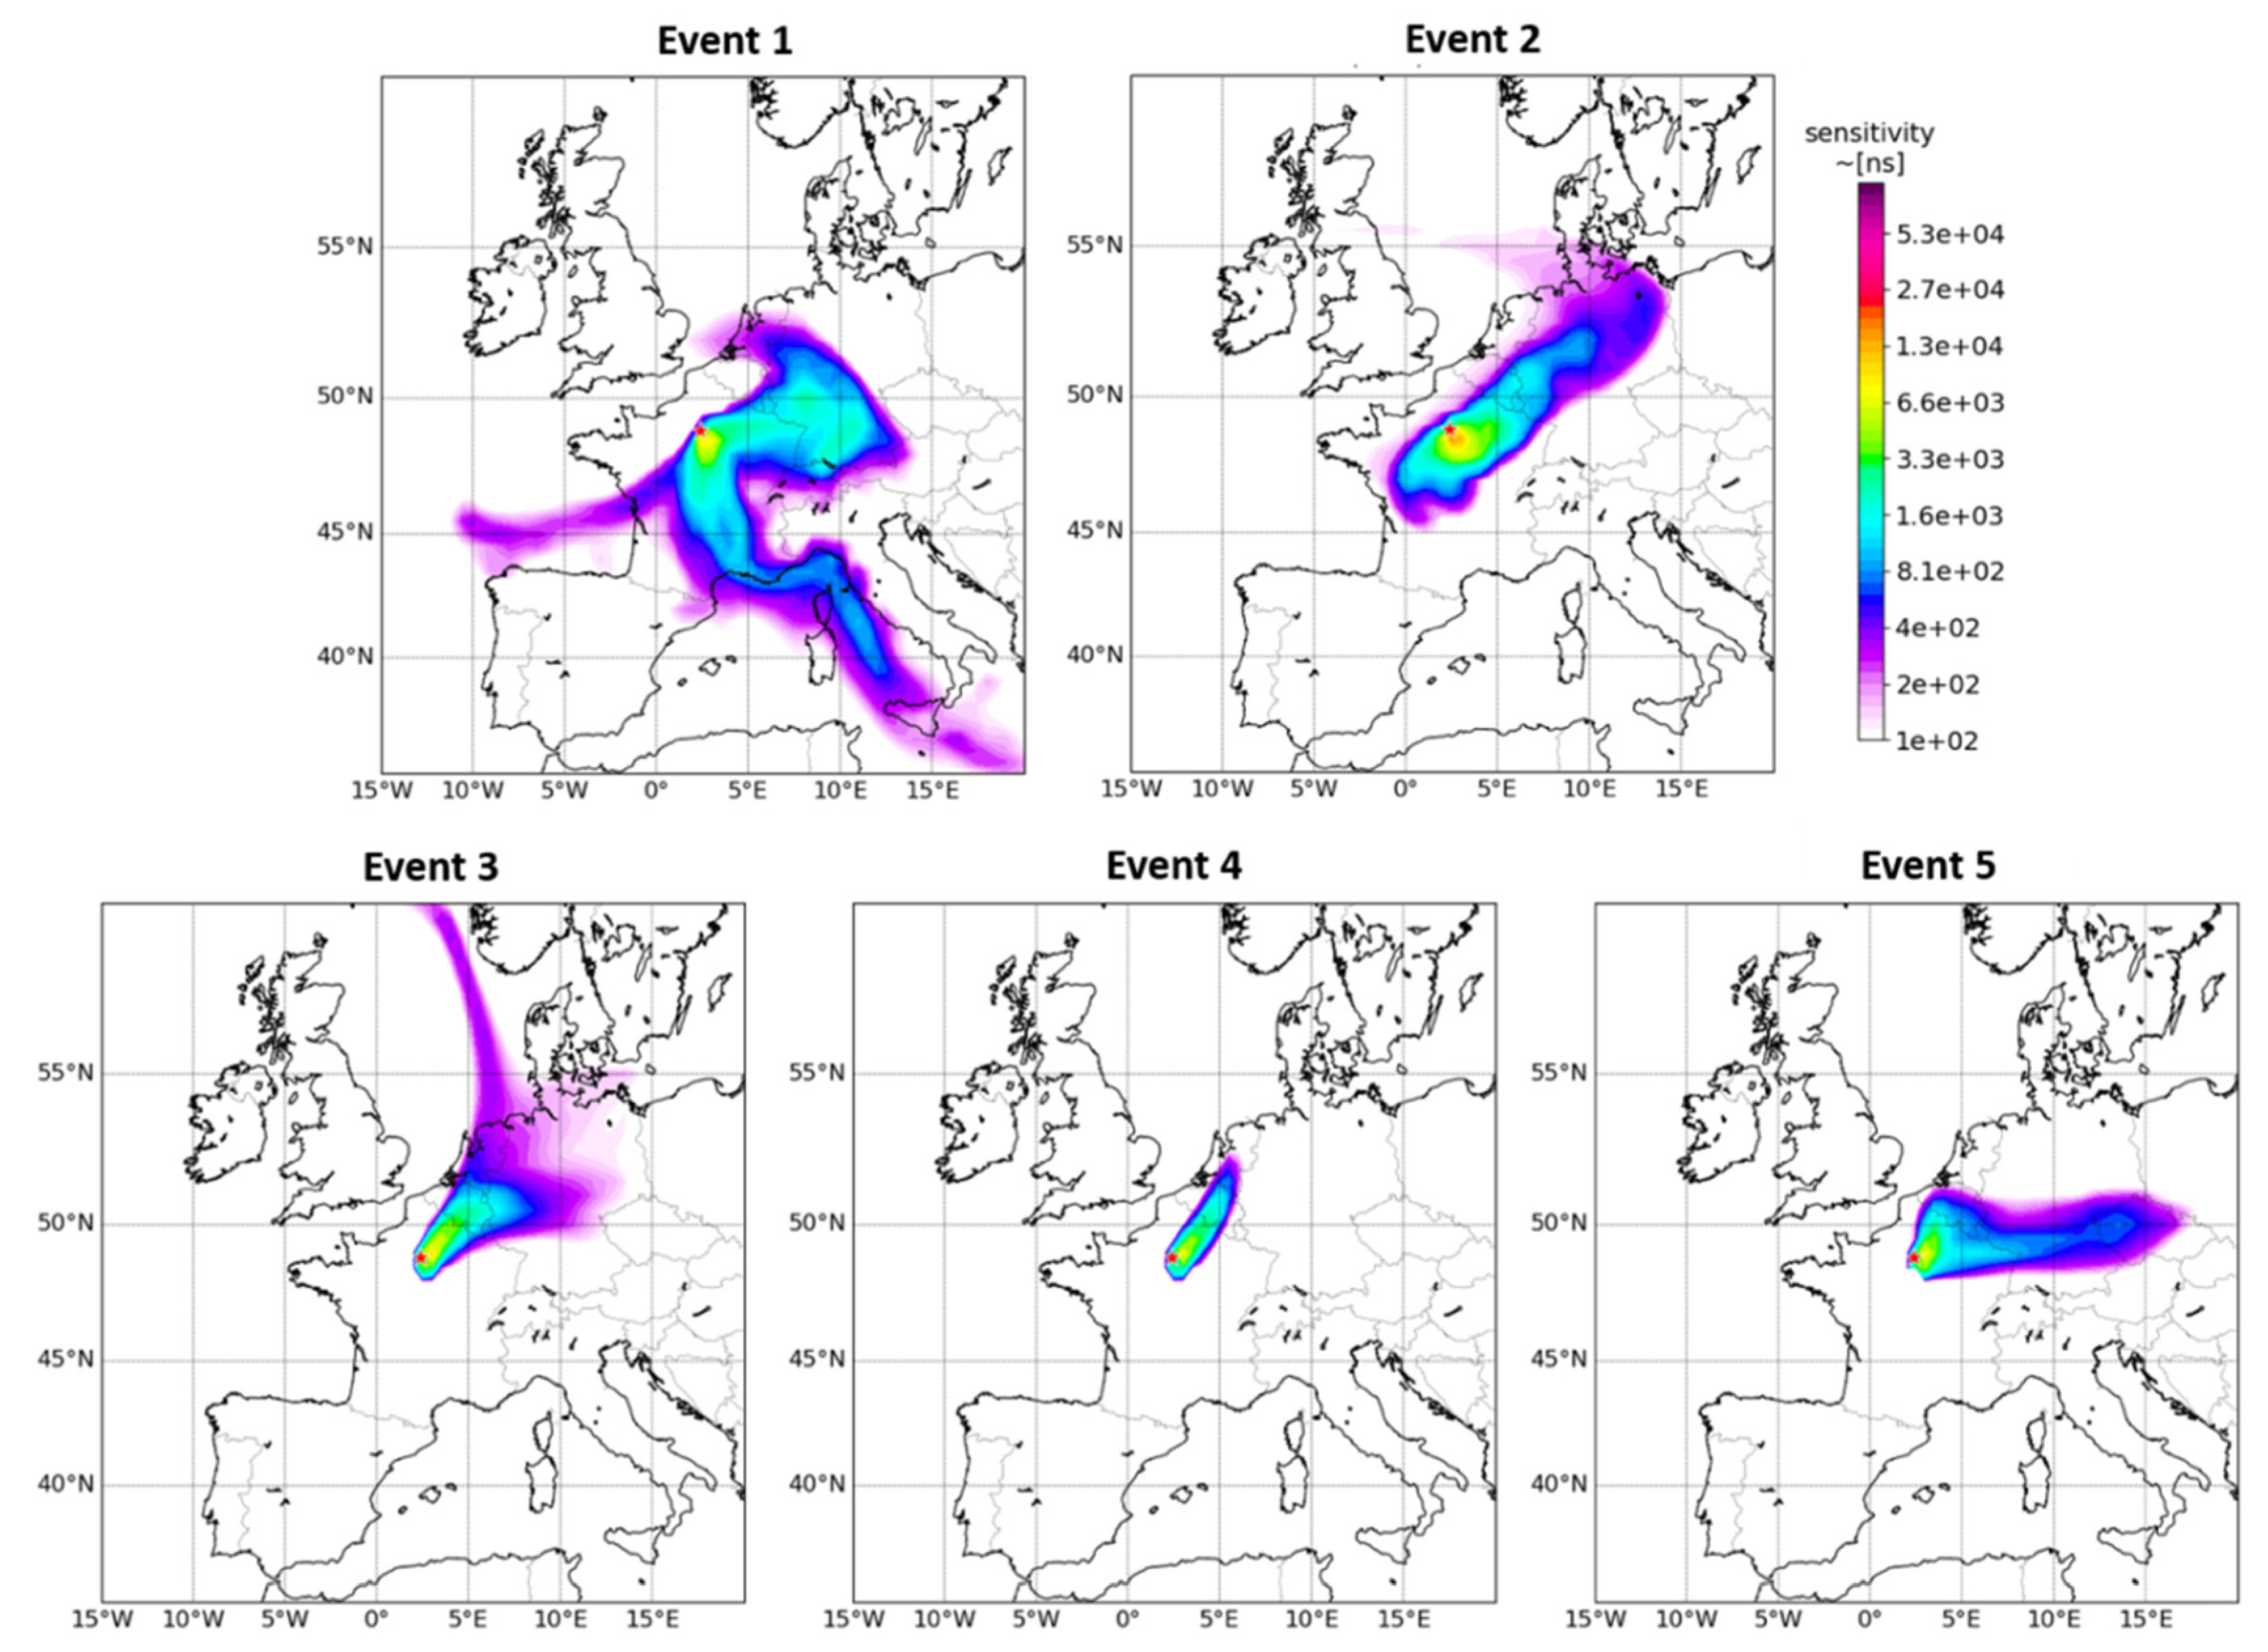
3.3. Sources and Transport of NH3 during Pollution Episodes

Complex equilibrium between contributions of long-range transport, local emission and dispersion, and chemical transformations in the atmosphere control the air quality in megacities [76] such as Greater Paris. To attribute the transport input to pollution episodes detected over Paris in winter and spring 2020, the FLEXPART Lagrangian particle dispersion model was used. Figure 3 shows the sensitivity (i.e., influence) to various regions for air parcels reaching the Paris region during the five pollution episodes.
The NH3 source regions that could have affected the air quality over Paris during pollution episodes were identified with the IASI NH3 maps (see Figure 3). NH3 hotspots averaged over the whole period of study (Figure 3a) were very similar to those detected using the 10-year average of IASI observations [25]. These included the French Champagne-Ardennes region as well as the Netherlands and the north of Belgium and also Piedmont and Lombardy areas in the northern Italy.
Concerning event 1, no significant NH3 enhancement was observed from the IASI and mini-DOAS observations (Figure 2). During this event, the pollution was transported from three directions (east, south, and west) according to the FLEXPART map (Figure 4).
For episodes 2, 3, 4 and 5, FLEXPART maps show that the pollution plumes were transported from the northeast with a higher sensitivity (red and yellow colors, Figure 4) to the nearby surrounding region on the east-southeast of Paris, over which major NH3 enhancements were observed by IASI. High NH3 concentrations for episodes 2 and 5 were located over Central Europe, mainly over Germany and the northeast of France (Figure 3c,f). In contrast, high NH3 concentrations were located over France, the Netherlands, and south of United Kingdom during event 3 (Figure 3d). During event 4, which lasted only thirteen hours over Paris, high NH3 concentrations were located across Europe (east–west) and over the Atlantic Ocean (Figure 3e), and fast transport of the NH3 plume from the east-northeast was supported by the transport of air parcels seen in the FLEXPART map.
Overall, the highest sensitivity from FLEXPART corresponded to NH3 hotspots derived from the IASI maps for each pollution event except event 1 (Figure 3 and Figure 4). This analysis confirms the predominant transboundary transport of pollutants from the east and northeast of France over Paris, which was already indicated by previous studies [20,77]. This highlights the substantial influence of long-range transport on fine particulate matter pollution over Paris.

3.4. Correlations between Hourly PM2.5, NH3, and PM1 Major Components

To better understand the origin of the particles and their composition over Paris during the period studied, the Spearman’s rank correlation coefficients between hourly surface concentration of particulate matter (PM2.5), ammonia (NH3), and PM1 major components (OM: organic matter, SO42−: sulfate, NO3: nitrate, and NH4+: ammonium) were calculated for the period of study (January–June 2020) and for the five pollution episodes (Table 2).
The identified PM2.5 pollution episodes occurring over Paris seem to have different origins (transport/chemistry). Indeed, during event 3, the Spearman’s rank correlation coefficients were higher than 0.71 for all the species (PM2.5, NH3, and PM1 major components) concentrations, which suggests the build-up of pollution downwind of Paris induced by permissible meteorological conditions, e.g., lack of wind/rain that prevent the venting/raining out of pollutants (see Figure S3). The different origins of the PM2.5 pollution episodes were also related to differences in the chemical composition of particles. During event 1, PM2.5 and OM concentrations, which was mainly emitted within Paris by wood burning, were strongly correlated (rs = 0.90) suggesting a more typical winter event driven by local emission of pollutants. For the other episodes, the highest correlation was not found with OM but between PM2.5 and NO3 or NH4+ concentrations. Moreover, OM dominated the PM1 composition over the whole time period and during event 1, whereas NO3 and NH4+ accounted for more than one-half of PM1 composition during the four spring pollution episodes (see Figure 2d). Thus, the sources, including transformation processes of particulate pollution, were different, which confirms the findings obtained from observations made between mid-2011 and mid-2013 in Paris [65].
Although NH3 and PM2.5 concentrations were moderately well correlated over the whole time period (R = 0.61), important variability existed within the correlation values (see Figure S6). The correlations between concentrations of NH3 and PM2.5 were not expected to be close to unity since NH3 can react in the atmosphere, especially over cities when the availability of acidic species (mainly sulfuric and nitric acid) is sufficient to form ammonium salts. Nevertheless, because the atmospheric lifetimes of NH3 and ammonium salts are on the order of one to a few days [78], high correlation between NH3 and PM2.5 concentrations can be found when a portion of NH3 has condensed onto acids downwind of a city and been transported in a plume containing both NH3 and ammonium salts.
NH4+ concentrations were strongly correlated with PM2.5 concentrations for all episodes occurring in spring (rs > 0.84 compared to rs = 0.68 during non-events period) when NH3 concentrations were high (episodes 2, 3, 4 and 5, Table 1). This suggests that NH4+ drove a large part of PM2.5 pollution over Paris in spring.
In addition, NO3 and NH4+ concentrations presented similar correlation values with PM2.5 concentrations and were almost perfectly correlated with each other (rs ≥ 0.98 and 0.89 during pollution events and non-events period, respectively), to a larger extent than between SO42− and NH4+, confirming the important abundance of ammonium nitrate (NO3NH4) over Paris [20,65,77].
Finally, the contributions of SNA (Sulfate: SO42−, Nitrate: NO3, and Ammonium: NH4+) in Paris were correlated with PM2.5 concentrations over the period of study (rs = 0.71–0.78) and for episodes 2, 3, 4 and 5, with rs ranging from 0.59 to 0.97, showing the importance of the inorganic secondary aerosol, especially in spring pollution episodes. SNA are key species that can make up more than 50% of PM2.5 mass loadings [79,80,81].
These findings confirm the persistent role of ammonia and ammonium nitrate in particulate pollution episodes over Paris in springtime [23,25]. The response of SNA to ammonia concentrations is detailed in the Section 4.

4. Discussion

In this section, we discuss the formation processes of SNA in Paris during COVID−19 lockdown despite the low NO2 loadings. Previous studies have reported the need for better understanding of the processes involved in driving ammonium nitrate formation over Paris [65,82]. Despite the usual high NOx emissions in the Parisian city, the local formation of ammonium nitrate has been found to be minor overall [23], although it can be significant for specific episodes [24]. Here we aim to evaluate the potential formation of SNA under the exceptional lockdown situation that significantly reduced concentrations of ammonium nitrate precursors (e.g., NOx = NO2 + NO). Indeed, it has been shown that based on observations in California, a reduction of NOx levels can affect the acidic content of the atmosphere and change the ammonium nitrate chemistry [83].
In the troposphere, NH3 neutralizes acidic sulfate before reacting with nitric acid to condense onto aerosols as ammonium nitrate [84]. Thus, NH3f, the free total ammonia concentrations, defined as NH3f = NH3 + NH4+ − 2 × SO42− [85], is an indicator of the excess NH3 available to form ammonium nitrate (NH4NO3) if all SO42− has been neutralized (ratio NH4+/SO42− higher than 2); in other words, if NH3f is positive and NH4+/SO42− higher than 2, NH3 concentrations are sufficient to form NH4NO3. Over the time period of study, molar ratios of concentrations of NH4+ to SO42− showed considerable variability with a mean of 2.09 ± 230.90 (Figure S7, upper panel). During spring pollution episodes, this ratio was significantly higher (7.96 ± 0.04), indicating a complete neutralization of SO42− by NH4+. Over the time period January–March 2020, the mean hourly NH3f was 0.15 ± 0.21 µg/m3 (Figure S7, lower panel). During event 1, NH3f was close to zero (0.08 ± 0.04 µmole/m3), whereas for all the other episodes the NH3f were significantly positive (event 2: 0.61 ± 0.34 µmole/m3; event 3: 0.88 ± 0.38 µmole/m3; event 4: 0.53 ± 0.23 µmole/m3; event 5: 0.51 ± 0.14 µmole/m3). This indicates that NH4NO3 could not be formed through NH3 reaction in the January pollution episode, whereas NH3 was not the limiting species for NH4NO3 formation during spring pollution episodes. These observation-based results verify the findings based on numerical simulations that aerosol formation is not immediately limited by the availability of ammonia over Europe [33], at least in spring.
In addition, complete neutralization of SO42− by NH4+ was observed in Paris from January to June since the ratio of molar concentrations of 2xSO42− with NH4+ was relatively correlated (r2 = 0.68) and significantly lower than 1.0 (0.19). During spring pollution events (black marker edges in Figure 5), the ratio of molar concentrations of 2xSO42− with NH4+ was even lower (0.14), suggesting that NH4+ was mainly condensed in the (NH4)2SO4 in the aerosols. Moreover, the regression yielded a strong linear correlation between 2xSO42− + NO3 with NH4+ (r2 = 0.99 and a slope of 0.94 for the time period of study and 0.95 during pollution events), with the sum of 2xSO42−+NO3 sometimes exceeding the NH4+ concentrations, implying that NH4+ might have been present in forms other than NH4NO3 over Paris.
To further investigate the relationship between atmospheric SNA formation and NH3 concentrations during the pollution episodes occurring in spring over Paris (episodes 2, 3, 4 and 5), the conversion rate of NH3 to NH4+, which is described by the ratio of concentrations of NH4+ to reduced inorganic nitrogen NHx (=[NH3] + [NH4+], where [NH3] and [NH4+] are concentrations of NH3 and NH4+), and its complement, which expresses the ammonia gas fraction (AGF = [NH3]/[NHx]), were used [42,55]. A value of AGF higher than 0.5 means that the total ammonia NHx is dominated by gaseous NH3 rather than by the aerosol load [86]. In our study, the AGF derived from hourly measurements were highly variable with a mean of 1.01 ± 7.25, whereas during spring pollution episodes the mean AGF value was 0.71 ± 0.12, suggesting that NH3 remained predominantly in the gas phase rather than the particle phase during spring particulate episodes in 2020 over Paris.
On the other hand, the relationships between the conversion rate of ammonia to ammonium, SNA, and NH3 concentrations were nonlinear since higher NH3 concentrations (red dots, Figure S8) can correspond to very low SNA concentrations. Thus, this suggests that high concentrations of precursors (NH3) do not necessarily result in high secondary aerosols (SNA) formation, which is supported by the AGF values within spring pollution episodes. Therefore, we conclude that the conversion rate of ammonia to ammonium, rather than ambient NH3 concentrations, played an important role in the SNA formation in Paris during spring pollution events in 2020.
The conversion rate of ammonia to ammonium has been reported to be strongly affected mainly by meteorological conditions (temperature and humidity) and concentrations of primary acid gas (total nitrate NO3 (HNO3 + NO3) and total sulfate (SO2 + SO4)) [79,87,88]. Low temperature and high relative humidity conditions are shown by thermodynamic equilibrium models such as ISORROPIA II [89] and observations in several cities (Beijing [90]; Shanghai [55]; Paris [25,91] to facilitate multi-phase reactions for aerosol formation in urban areas.
A recent study has attributed urban PM2.5 pollution during COVID-19 lockdown to enhanced efficiency of nitrate aerosol formation promoted by high relative humidity despite low atmospheric NO2 levels in China [14]. However, Chang et al. (2020) argued that regional long-range transport, rather than meteorological conditions, mainly drove the enhanced nitrate formation in Shanghai during the 2020 lockdown. In Paris, relative humidity levels in 2020 were similar to, if not lower than, normal conditions, with a change of −8 ± 24% in 2020 compared to the 2015–2019 average (see Figure S9). Our results therefore tend to corroborate more the explanation of Chang et al. (2020) and indicate that relative humidity did not enhance ammonium nitrate formation over Paris in 2020.
The high SNA concentrations in spring could also be due to the nonlinear production chemistry and titration of tropospheric ozone. Indeed, the anomalously elevated ozone levels found in urban areas of France as a consequence of reduced NOx concentrations during lockdown [11] could have enhanced atmospheric oxidizing capacity (by the OH radical) and further facilitated SNA formation in Paris in 2020.

5. Conclusions

The COVID-19 lockdown measures reduced anthropogenic emissions and affected atmospheric composition in the urban area of Paris. Consequently, NO2 concentrations recorded in the first half of 2020 were the lowest they have been in the last 5 years. Despite a change of NO2 concentrations by −24% (averaged over 17 March–1 June compared to 1 January–17 March 2020), fine particles (PM2.5) concentrations increased by about 16% over the same period. Five PM2.5 pollution events, identified here when PM2.5 concentrations were higher than 25 µg/m3, over the Paris region, occurring in January, March, and April 2020, were investigated in this study.
Analysis of NH3 and PM2.5 concentrations as well as PM1 chemical composition were performed to better understand the origin of these episodes. Multi-platform NH3 observations were derived from a new in situ (mini-DOAS) instrument located in Paris city center and from the IASI satellite instrument.
Atmospheric composition of the five pollution episodes was different, with a large contribution from organic matter in winter, in contrast to nitrate and ammonium in spring.
During lockdown, simultaneous enhancements of PM2.5, NH3, and SNA surface concentrations were monitored. Hence, we confirm the role of NH3 and inorganic secondary aerosols in spring particulate episodes in Paris.
The NH3 hotspots revealed by IASI outside of the city were found to be consistent with the highest sensitivity regions obtained with the FLEXPART model. This suggests the contribution from regional sources rather than local pollution from Paris.
Moreover, we have shown that sulfate was completely associated with ammonium and that NH3 was not the limiting species for the formation of ammonium nitrate in 2020 over Paris. We have further demonstrated that the conversion rate of ammonia to ammonium, which mainly depends on atmospheric temperature and humidity, might be the main driver, rather than NH3 concentrations, for SNA formation over Paris.
Finally, our results clearly illustrate the need for a better assessment of the origins of springtime PM2.5 pollution episodes in the Paris region, which could eventually be considered by policy makers with relevance to mitigation strategies. Future investigations will focus on the impact of the exceptionally low NO2 levels in 2020 on the relationships between NH3, NH4+, and SNA over Paris using state-of-the-art and optimized CTMs.

Supplementary Materials

The following are available online at https://www.mdpi.com/2073-4433/12/2/160/s1, Figure S1: The domain of study around Paris (white cross) showing locations of the PM2.5 and NO2 observations from the Airparif stations (red pins), PM composition observations at SIRTA (yellow pin), as well as NH3 observations derived from the mini-DOAS instrument (blue pin) and from the IASI satellite instrument (inside the red circle). Map provided by Google Earth V7.3.2.5776, US Dept. of State Geographer, copyright Google, 2020, Image Landsat/Copernicus, Data SIO, NOAA, US Navy, NGA, and GEBCO. Figure S2: Correlation plots between hourly PM2.5 concentrations derived from the mean of the 13 Airparif stations and PM2.5 (red, left panel) and PM1 (blue, right panel) concentrations measured at SIRTA. PM2.5 and PM1 concentrations measured at SIRTA were strongly correlated with the average of measurements at all the Airparif stations with R = 0.94 and R = 0.92 (p-value < 0.05). Figure S3: Timeseries of daily meteorological parameters over Paris from January to June 2020 and for the five investigated periods in shaded grey: boundary layer height (in meter; dark cyan, upper panel), temperature at 2 m (in Kelvin; red, upper middle panel), total precipitation (in meter; black, lower middle panel), and wind speeds and directions (blue and orange in lower panel) derived from the European Centre for Medium-Range Weather Forecasts (ECMWF) ERA-5 (C3S, 2021). Figure S4: Timeseries of NH3, PM2.5 and major submicron chemical species concentrations over Paris during the five periods investigated. Figure S5: IASI and mini-DOAS NH3 comparison. Figure S6: Correlation plot (using Spearman’s rank correlation coefficient) between hourly PM2.5 and NH3 concentrations over Paris during the period of study (January–June 2020 in grey), color-coded according to the five periods investigated. NH3 concentrations derived from the mini-DOAS below detection limits were discarded. Figure S7: Hourly (blue) and daily (black) NH4+ to SO42− molar concentrations ratio (upper panel), and hourly (green) and daily (black) free total ammonia concentrations (µmole/m3) defined as NH3f = NH3 + NH4+ − 2 × SO42− (lower panel) as function of time. Figure S8: Relationship between the conversion rate of ammonia to ammonium (NH4+/NHx) and SNA (sulfate, nitrate, and ammonium (μmole/m3)) during pollution episodes occurring in spring 2020. Figure S9: Daily concentrations of Relative Humidity (RH) (%) measured in Paris from January to June of 2020 (solid lines) and average from 2015 to 2019 (dashed lines). Light blue area represents the 1-σ standard deviation around the 5-year average. The vertical line corresponds to the start of the lockdown period in France.

Author Contributions

Formulated the research goals and aims, developed the methodology, conducted the research, and wrote the initial draft, C.V.; produced and provided data used in this study, C.V., J.-E.P., S.Y. and M.V.D.; helped analyzing the datasets, C.D. and E.G.-P.; reviewed and edited the manuscript, J.-E.P., S.Y., M.V.D., V.G., O.F., L.C., P.-F.C. and C.C.; provided financial support leading to this publication, C.C., P.-F.C., and K.S. All authors have read and agreed to the published version of the manuscript.

Funding

In situ aerosol measurements at the SIRTA facility have benefited from the support of the French research infrastructure ACTRIS-FR, as well as national observation service CLAP.

Institutional Review Board Statement

Not applicable.

Informed Consent Statement

Not applicable.

Data Availability Statement

Data for PM2.5 and NO2 concentrations over Paris are available at the database of Airparif (https://www.airparif.asso.fr/en/telechargement/telechargement-polluant). The IASI Level-1C data and Level-2 NH3 data are provided by the Aeris data infrastructure (http://iasi.aeris-data.fr/NH3/).

Acknowledgments

IASI is a joint mission of Eumetsat and the Centre National d’Etudes Spatiales (CNES, France). The IASI Level-1C data are distributed in near real time by Eumetsat through the EumetCast system distribution. The FLEXPART Lagrangian dispersion model is available at https://www.flexpart.eu/wiki/FpDownloads. The Pflexible Python module (available at https://bitbucket.org/jfburkhart/pflexible) developed by John F. Burkhart was modified to generate the sensitivity plots from the FLEXPART outputs. The authors would like to thank Arjan Hensen, Daan Swart, and their teams at TNO for their constructive advice on the mini-DOAS instrument and CNES and AC-SAF for their financial support. This project has received funding from the European Research Council (ERC) under the European Union’s Horizon 2020 and innovation programme (grant agreement No 742909, IASI-FT advanced ERC grant). Part of the research at the ULB has been supported by the IASI Flow Prodex arrangement (ESA-BELSPO). Lieven Clarisse and Martin Van Damme are respectively a research associate and a postdoctoral researcher supported by the F.R.S.-FNRS. In situ aerosol measurements at the SIRTA facility are part of the European Aerosol, Clouds and Trace gases Research InfraStructure (ACTRIS) and has benefited from the support of the research infrastructure ACTRIS-FR, registered on the Roadmap of the French Ministry of Research.

Conflicts of Interest

The authors declare that they have no conflict of interest.

References

  1. Le Quéré, C.; Jackson, R.B.; Jones, M.W.; Smith, A.J.P.; Abernethy, S.; Andrew, R.M.; De-Gol, A.J.; Willis, D.R.; Shan, Y.; Canadell, J.G.; et al. Temporary reduction in daily global CO2 emissions during the COVID-19 forced confinement. Nat. Clim. Chang. 2020, 10, 647–653. [Google Scholar] [CrossRef]
  2. Bauwens, M.; Compernolle, S.; Stavrakou, T.; Müller, J.-F.; van Gent, J.; Eskes, H.; Levelt, P.F.; van der A, R.; Veefkind, J.P.; Vlietinck, J.; et al. Impact of Coronavirus Outbreak on NO2 Pollution Assessed Using TROPOMI and OMI Observations. Geophys. Res. Lett. 2020, 47, e2020GL087978. [Google Scholar] [CrossRef] [PubMed]
  3. Baldasano, J.M. COVID-19 lockdown effects on air quality by NO2 in the cities of Barcelona and Madrid (Spain). Sci. Total Environ. 2020, 741, 140353. [Google Scholar] [CrossRef] [PubMed]
  4. Shi, X.; Brasseur, G.P. The Response in Air Quality to the Reduction of Chinese Economic Activities During the COVID-19 Outbreak. Geophys. Res. Lett. 2020, 47, e2020GL088070. [Google Scholar] [CrossRef] [PubMed]
  5. Sharma, S.; Zhang, M.; Anshika; Gao, J.; Zhang, H.; Kota, S.H. Effect of restricted emissions during COVID-19 on air quality in India. Sci. Total Environ. 2020, 728, 138878. [Google Scholar] [CrossRef]
  6. Mahato, S.; Pal, S.; Ghosh, K.G. Effect of lockdown amid COVID-19 pandemic on air quality of the megacity Delhi, India. Sci. Total Environ. 2020, 730, 139086. [Google Scholar] [CrossRef]
  7. Otmani, A.; Benchrif, A.; Tahri, M.; Bounakhla, M.; Chakir, E.M.; El Bouch, M.; Krombi, M. Impact of Covid-19 lockdown on PM10, SO2 and NO2 concentrations in Salé City (Morocco). Sci. Total Environ. 2020, 735, 139541. [Google Scholar] [CrossRef]
  8. Sicard, P.; De Marco, A.; Agathokleous, E.; Feng, Z.; Xu, X.; Paoletti, E.; Rodriguez, J.J.D.; Calatayud, V. Amplified ozone pollution in cities during the COVID-19 lockdown. Sci. Total Environ. 2020, 735, 139542. [Google Scholar] [CrossRef]
  9. Tobías, A.; Carnerero, C.; Reche, C.; Massagué, J.; Via, M.; Minguillón, M.C.; Alastuey, A.; Querol, X. Changes in air quality during the lockdown in Barcelona (Spain) one month into the SARS-CoV-2 epidemic. Sci. Total Environ. 2020, 726, 138540. [Google Scholar] [CrossRef]
  10. Siciliano, B.; Dantas, G.; da Silva, C.M.; Arbilla, G. Increased ozone levels during the COVID-19 lockdown: Analysis for the city of Rio de Janeiro, Brazil. Sci. Total Environ. 2020, 737, 139765. [Google Scholar] [CrossRef]
  11. Menut, L.; Bessagnet, B.; Siour, G.; Mailler, S.; Pennel, R.; Cholakian, A. Impact of lockdown measures to combat Covid-19 on air quality over western Europe. Sci. Total Environ. 2020, 741, 140426. [Google Scholar] [CrossRef] [PubMed]
  12. Chauhan, A.; Singh, R.P. Decline in PM2.5 concentrations over major cities around the world associated with COVID-19. Environ. Res. 2020, 187, 109634. [Google Scholar] [CrossRef] [PubMed]
  13. Chang, Y.; Huang, R.-J.; Ge, X.; Huang, X.; Hu, J.; Duan, Y.; Zou, Z.; Liu, X.; Lehmann, M.F. Puzzling Haze Events in China During the Coronavirus (COVID-19) Shutdown. Geophys. Res. Lett. 2020, 47, e2020GL088533. [Google Scholar] [CrossRef] [PubMed]
  14. Le, T.; Wang, Y.; Liu, L.; Yang, J.; Yung, Y.L.; Li, G.; Seinfeld, J.H. Unexpected air pollution with marked emission reductions during the COVID-19 outbreak in China. Science 2020, 369, 702–706. [Google Scholar] [CrossRef]
  15. Pope, C.A.; Ezzati, M.; Dockery, D.W. Fine-Particulate Air Pollution and Life Expectancy in the United States. N. Engl. J. Med. 2009, 360, 376–386. [Google Scholar] [CrossRef] [PubMed] [Green Version]
  16. Myhre, G.; Samset, B.H.; Schulz, M.; Balkanski, Y.; Bauer, S.; Berntsen, T.K.; Bian, H.; Bellouin, N.; Chin, M.; Diehl, T.; et al. Radiative forcing of the direct aerosol effect from AeroCom Phase II simulations. Atmos. Chem. Phys. 2013, 13, 1853–1877. [Google Scholar] [CrossRef] [Green Version]
  17. Amato, F.; Favez, O.; Pandolfi, M.; Alastuey, A.; Querol, X.; Moukhtar, S.; Bruge, B.; Verlhac, S.; Orza, J.A.G.; Bonnaire, N.; et al. Traffic induced particle resuspension in Paris: Emission factors and source contributions. Atmos. Environ. 2016, 129, 114–124. [Google Scholar] [CrossRef]
  18. Zhang, Y.; Favez, O.; Petit, J.-E.; Canonaco, F.; Truong, F.; Bonnaire, N.; Crenn, V.; Amodeo, T.; Prévôt, A.S.H.; Sciare, J.; et al. Six-year source apportionment of submicron organic aerosols from near-continuous highly time-resolved measurements at SIRTA (Paris area, France). Atmos. Chem. Phys. 2019, 19, 14755–14776. [Google Scholar] [CrossRef] [Green Version]
  19. Ghersi, V.; Rosso, A.; Moukhtar, S.; Lameloise, P.; Sciare, J.; Bressi, M.; Nicolas, J.; Ferron, A.; Bonnaire, N. A comprehensive source apportionment study of fine aerosols (PM2.5) in the region of Paris, France. Pollut. Atmosphérique Numéro Spécial 2010, 12, 63–72. [Google Scholar]
  20. Bressi, M.; Sciare, J.; Ghersi, V.; Mihalopoulos, N.; Petit, J.-E.; Nicolas, J.B.; Moukhtar, S.; Rosso, A.; Féron, A.; Bonnaire, N.; et al. Sources and geographical origins of fine aerosols in Paris (France). Atmos. Chem. Phys. 2014, 14, 8813–8839. [Google Scholar] [CrossRef] [Green Version]
  21. Beekmann, M.; Prévôt, A.S.H.; Drewnick, F.; Sciare, J.; Pandis, S.N.; van der Gon, H.A.C.; Crippa, M.; Freutel, F.; Poulain, L.; Ghersi, V.; et al. In situ, satellite measurement and model evidence on the dominant regional contribution to fine particulate matter levels in the Paris megacity. Atmos. Chem. Phys. 2015, 15, 9577–9591. [Google Scholar] [CrossRef] [Green Version]
  22. Zhang, Q.J.; Beekmann, M.; Drewnick, F.; Freutel, F.; Schneider, J.; Crippa, M.; Prevot, A.S.H.; Baltensperger, U.; Poulain, L.; Wiedensohler, A.; et al. Formation of organic aerosol in the Paris region during the MEGAPOLI summer campaign: Evaluation of the volatility-basis-set approach within the CHIMERE model. Atmos. Chem. Phys. 2013, 13, 5767–5790. [Google Scholar] [CrossRef] [Green Version]
  23. Petetin, H.; Sciare, J.; Bressi, M.; Gros, V.; Rosso, A.; Sanchez, O.; Sarda-Estève, R.; Petit, J.-E.; Beekmann, M. Assessing the ammonium nitrate formation regime in the Paris megacity and its representation in the CHIMERE model. Atmos. Chem. Phys. 2016, 16, 10419–10440. [Google Scholar] [CrossRef] [Green Version]
  24. Petit, J.-E.; Amodeo, T.; Meleux, F.; Bessagnet, B.; Menut, L.; Grenier, D.; Pellan, Y.; Ockler, A.; Rocq, B.; Gros, V.; et al. Characterising an intense PM pollution episode in March 2015 in France from multi-site approach and near real time data: Climatology, variabilities, geographical origins and model evaluation. Atmos. Environ. 2017, 155, 68–84. [Google Scholar] [CrossRef]
  25. Viatte, C.; Wang, T.; Van Damme, M.; Dammers, E.; Meleux, F.; Clarisse, L.; Shephard, M.W.; Whitburn, S.; Coheur, P.F.; Cady-Pereira, K.E.; et al. Atmospheric ammonia variability and link with particulate matter formation: A case study over the Paris area. Atmos. Chem. Phys. 2020, 20, 577–596. [Google Scholar] [CrossRef] [Green Version]
  26. Tournadre, B.; Chelin, P.; Ray, M.; Cuesta, J.; Kutzner, R.D.; Landsheere, X.; Fortems-Cheiney, A.; Flaud, J.-M.; Hase, F.; Blumenstock, T.; et al. Atmospheric ammonia (NH3) over the Paris megacity: 9~years of total column observations from ground-based infrared remote sensing. Atmos. Meas. Tech. 2020, 13, 3923–3937. [Google Scholar] [CrossRef]
  27. Hauglustaine, D.A.; Balkanski, Y.; Schulz, M. A global model simulation of present and future nitrate aerosols and their direct radiative forcing of climate. Atmos. Chem. Phys. 2014, 14, 11031–11063. [Google Scholar] [CrossRef] [Green Version]
  28. Hertel, O.; Goodsite, M.E. Urban Air Pollution Climate Throughout the World. In Air Quality in Urban Environments; Hester, R.E., Harrison, R.M., Eds.; RSC Publishing: Cambrigde, UK, 2009; pp. 1–22. [Google Scholar]
  29. Fuzzi, S.; Baltensperger, U.; Carslaw, K.; Decesari, S.; van der Gon, H.; Facchini, M.C.; Fowler, D.; Koren, I.; Langford, B.; Lohmann, U.; et al. Particulate matter, air quality and climate: Lessons learned and future needs. Atmos. Chem. Phys. 2015, 15, 8217–8299. [Google Scholar] [CrossRef] [Green Version]
  30. Sun, J.; Liu, L.; Xu, L.; Wang, Y.; Wu, Z.; Hu, M.; Shi, Z.; Li, Y.; Zhang, X.; Chen, J.; et al. Key Role of Nitrate in Phase Transitions of Urban Particles: Implications of Important Reactive Surfaces for Secondary Aerosol Formation. J. Geophys. Res. Atmos. 2018, 123, 1234–1243. [Google Scholar] [CrossRef]
  31. Lee, C.J.; Martin, R.V.; Henze, D.K.; Brauer, M.; Cohen, A.; van Donkelaar, A. Response of Global Particulate-Matter-Related Mortality to Changes in Local Precursor Emissions. Environ. Sci. Technol. 2015, 49, 4335–4344. [Google Scholar] [CrossRef] [Green Version]
  32. Backes, A.M.; Aulinger, A.; Bieser, J.; Matthias, V.; Quante, M. Ammonia emissions in Europe, part II: How ammonia emission abatement strategies affect secondary aerosols. Atmos. Environ. 2016, 126, 153–161. [Google Scholar] [CrossRef] [Green Version]
  33. Pozzer, A.; Tsimpidi, A.P.; Karydis, V.A.; de Meij, A.; Lelieveld, J. Impact of agricultural emission reductions on fine-particulate matter and public health. Atmos. Chem. Phys. 2017, 17, 12813–12826. [Google Scholar] [CrossRef] [Green Version]
  34. Bessagnet, B.; Beauchamp, M.; Guerreiro, C.; de Leeuw, F.; Tsyro, S.; Colette, A.; Meleux, F.; Rouïl, L.; Ruyssenaars, P.; Sauter, F.; et al. Can further mitigation of ammonia emissions reduce exceedances of particulate matter air quality standards? Environ. Sci. Policy 2014, 44, 149–163. [Google Scholar] [CrossRef]
  35. Giannakis, E.; Kushta, J.; Bruggeman, A.; Lelieveld, J. Costs and benefits of agricultural ammonia emission abatement options for compliance with European air quality regulations. Environ. Sci. Eur. 2019, 31, 93. [Google Scholar] [CrossRef] [Green Version]
  36. Tsimpidi, A.P.; Karydis, V.A.; Pandis, S.N. Response of Inorganic Fine Particulate Matter to Emission Changes of Sulfur Dioxide and Ammonia: The Eastern United States as a Case Study. J. Air Waste Manag. Assoc. 2007, 57, 1489–1498. [Google Scholar] [CrossRef]
  37. Aneja, V.P.; Schlesinger, W.H.; Erisman, J.W. Effects of Agriculture upon the Air Quality and Climate: Research, Policy, and Regulations. Environ. Sci. Technol. 2009, 43, 4234–4240. [Google Scholar] [CrossRef] [Green Version]
  38. Paulot, F.; Jacob, D.J. Hidden Cost of U.S. Agricultural Exports: Particulate Matter from Ammonia Emissions. Environ. Sci. Technol. 2014, 48, 903–908. [Google Scholar] [CrossRef]
  39. Lachatre, M.; Fortems-Cheiney, A.; Foret, G.; Siour, G.; Dufour, G.; Clarisse, L.; Clerbaux, C.; Coheur, P.-F.; Van Damme, M.; Beekmann, M. The unintended consequence of SO2 and NO2 regulations over China: Increase of ammonia levels and impact on PM2.5 concentrations. Atmos. Chem. Phys. 2019, 19, 6701–6716. [Google Scholar] [CrossRef] [Green Version]
  40. Chen, D.; Liu, Z.; Fast, J.; Ban, J. Simulations of sulfate–nitrate–ammonium (SNA) aerosols during the extreme haze events over northern China in October 2014. Atmos. Chem. Phys. 2016, 16, 10707–10724. [Google Scholar] [CrossRef] [Green Version]
  41. Guo, H.; Otjes, R.; Schlag, P.; Kiendler-Scharr, A.; Nenes, A.; Weber, R.J. Effectiveness of ammonia reduction on control of fine particle nitrate. Atmos. Chem. Phys. 2018, 18, 12241–12256. [Google Scholar] [CrossRef] [Green Version]
  42. Xu, J.; Chen, J.; Zhao, N.; Wang, G.; Yu, G.; Li, H.; Huo, J.; Lin, Y.; Fu, Q.; Guo, H.; et al. Importance of gas-particle partitioning of ammonia in haze formation in the rural agricultural environment. Atmos. Chem. Phys. 2020, 20, 7259–7269. [Google Scholar] [CrossRef]
  43. Clarisse, L.; Clerbaux, C.; Dentener, F.; Hurtmans, D.; Coheur, P.-F. Global ammonia distribution derived from infrared satellite observations. Nat. Geosci. 2009, 2, 479–483. [Google Scholar] [CrossRef]
  44. Van Damme, M.; Clarisse, L.; Heald, C.L.; Hurtmans, D.; Ngadi, Y.; Clerbaux, C.; Dolman, A.J.; Erisman, J.W.; Coheur, P.F. Global distributions, time series and error characterization of atmospheric ammonia NH3 from IASI satellite observations. Atmos. Chem. Phys. 2014, 14, 2905–2922. [Google Scholar] [CrossRef] [Green Version]
  45. Warner, J.X.; Dickerson, R.R.; Wei, Z.; Strow, L.L.; Wang, Y.; Liang, Q. Increased atmospheric ammonia over the world’s major agricultural areas detected from space. Geophys. Res. Lett. 2017, 44, 2875–2884. [Google Scholar] [CrossRef] [PubMed]
  46. Van Damme, M.; Clarisse, L.; Whitburn, S.; Hadji-Lazaro, J.; Hurtmans, D.; Clerbaux, C.; Coheur, P.-F. Industrial and agricultural ammonia point sources exposed. Nature 2018, 564, 99–103. [Google Scholar] [CrossRef]
  47. Dammers, E.; McLinden, C.A.; Griffin, D.; Shephard, M.W.; Van Der Graaf, S.; Lutsch, E.; Schaap, M.; Gainairu-Matz, Y.; Fioletov, V.; Van Damme, M.; et al. NH3 emissions from large point sources derived from CrIS and IASI satellite observations. Atmos. Chem. Phys. 2019, 19, 12261–12293. [Google Scholar] [CrossRef] [Green Version]
  48. Fortems-Cheiney, A.; Dufour, G.; Hamaoui-Laguel, L.; Foret, G.; Siour, G.; Van Damme, M.; Meleux, F.; Coheur, P.-F.; Clerbaux, C.; Clarisse, L.; et al. Unaccounted variability in NH3 agricultural sources detected by IASI contributing to European spring haze episode. Geophys. Res. Lett. 2016, 43, 5475–5482. [Google Scholar] [CrossRef] [Green Version]
  49. Fortems-Cheiney, A.; Dufour, G.; Dufossé, K.; Couvidat, F.; Gilliot, J.-M.; Siour, G.; Beekmann, M.; Foret, G.; Meleux, F.; Clarisse, L.; et al. Do alternative inventories converge on the spatiotemporal representation of spring ammonia emissions in France? Atmos. Chem. Phys. 2020, 20, 13481–13495. [Google Scholar] [CrossRef]
  50. Volten, H.; Bergwerff, J.B.; Haaima, M.; Lolkema, D.E.; Berkhout, A.J.C.; van der Hoff, G.R.; Potma, C.J.M.; Wichink Kruit, R.J.; van Pul, W.A.J.; Swart, D.P.J. Two instruments based on differential optical absorption spectroscopy (DOAS) to measure accurate ammonia concentrations in the atmosphere. Atmos. Meas. Tech. 2012, 5, 413–427. [Google Scholar] [CrossRef] [Green Version]
  51. QUALAIR Facility. Available online: https://wptest.ipsl.fr/en/research/resources-tools-and-platforms/qualair/ (accessed on 25 January 2021).
  52. Clerbaux, C.; Boynard, A.; Clarisse, L.; George, M.; Hadji-Lazaro, J.; Herbin, H.; Hurtmans, D.; Pommier, M.; Razavi, A.; Turquety, S.; et al. Monitoring of atmospheric composition using the thermal infrared IASI/MetOp sounder. Atmos. Chem. Phys. 2009, 9, 6041–6054. [Google Scholar] [CrossRef] [Green Version]
  53. Sintermann, J.; Dietrich, K.; Häni, C.; Bell, M.; Jocher, M.; Neftel, A. A miniDOAS instrument optimised for ammonia field measurements. Atmos. Meas. Tech. 2016, 9, 2721–2734. [Google Scholar] [CrossRef] [Green Version]
  54. Platt, U.; Stutz, J. Differential Optical Absorption Spectroscopy-Principles and Applications; Springer: Berlin/Heidelberg, Germany, 2008; pp. 135–144. [Google Scholar] [CrossRef] [Green Version]
  55. Wang, S.; Nan, J.; Shi, C.; Fu, Q.; Gao, S.; Wang, D.; Cui, H.; Saiz-Lopez, A.; Zhou, B. Atmospheric ammonia and its impacts on regional air quality over the megacity of Shanghai, China. Sci. Rep. 2015, 5, 15842. [Google Scholar] [CrossRef] [PubMed] [Green Version]
  56. Dammers, E.; Schaap, M.; Haaima, M.; Palm, M.; Wichink Kruit, R.J.; Volten, H.; Hensen, A.; Swart, D.; Erisman, J.W. Measuring atmospheric ammonia with remote sensing campaign: Part 1—Characterisation of vertical ammonia concentration profile in the centre of The Netherlands. Atmos. Environ. 2017, 169, 97–112. [Google Scholar] [CrossRef]
  57. Berkhout, A.J.C.; Swart, D.P.J.; Volten, H.; Gast, L.F.L.; Haaima, M.; Verboom, H.; Stefess, G.; Hafkenscheid, T.; Hoogerbrugge, R. Replacing the AMOR with the miniDOAS in the ammonia monitoring network in the Netherlands. Atmos. Meas. Tech. 2017, 10, 4099–4120. [Google Scholar] [CrossRef] [Green Version]
  58. Van Damme, M.; Whitburn, S.; Clarisse, L.; Clerbaux, C.; Hurtmans, D.; Coheur, P.-F. Version 2 of the IASI NH3 neural network retrieval algorithm: Near-real-time and reanalysed datasets. Atmos. Meas. Tech. 2017, 10, 4905–4914. [Google Scholar] [CrossRef] [Green Version]
  59. Franco, B.; Clarisse, L.; Stavrakou, T.; Müller, J.-F.; Van Damme, M.; Whitburn, S.; Hadji-Lazaro, J.; Hurtmans, D.; Taraborrelli, D.; Clerbaux, C.; et al. A General Framework for Global Retrievals of Trace Gases From IASI: Application to Methanol, Formic Acid, and PAN. J. Geophys. Res. Atmos. 2018, 123, 13913–13984. [Google Scholar] [CrossRef] [Green Version]
  60. Van Damme, M.; Clarisse, L.; Franco, B.; Sutton, M.A.; Erisman, J.W.; Kruit, R.W.; van Zanten, M.; Whitburn, S.; Hadji-Lazaro, J.; Hurtmans, D.; et al. Global, regional and national trends of atmospheric ammonia derived from a decadal (2008–2018) satellite record. Environ. Res. Lett. 2020. [Google Scholar] [CrossRef]
  61. Airparif, Ambient Air—Automated Measuring Systems for the Measurement of the Concentration of Particulate Matter (PM10; PM2.5). 2017. Available online: https://standards.iteh.ai/catalog/standards/cen/21722c9a-74b9-4f47-901c-40ecec95dcfe/en-16450-2017 (accessed on 25 January 2021).
  62. Airparif, Ambient Air—Standard Method for the Measurement of the Concentration of Nitrogen Dioxide and Nitrogen Monoxide by Chemiluminescence. 2012. Available online: https://standards.iteh.ai/catalog/standards/cen/46e97f97-9007-4b4c-8040-3ce5b0187ed5/en-14211-2012 (accessed on 25 January 2021).
  63. Haeffelin, M.; Barthès, L.; Bock, O.; Boitel, C.; Bony, S.; Bouniol, D.; Chepfer, H.; Chiriaco, M.; Cuesta, J.; Delanoë, J.; et al. SIRTA, a ground-based atmospheric observatory for cloud and aerosol research. Ann. Geophys. 2005, 23, 253–275. [Google Scholar] [CrossRef] [Green Version]
  64. Ng, N.L.; Herndon, S.C.; Trimborn, A.; Canagaratna, M.R.; Croteau, P.L.; Onasch, T.B.; Sueper, D.; Worsnop, D.R.; Zhang, Q.; Sun, Y.L.; et al. An Aerosol Chemical Speciation Monitor (ACSM) for Routine Monitoring of the Composition and Mass Concentrations of Ambient Aerosol. Aerosol Sci. Technol. 2011, 45, 780–794. [Google Scholar] [CrossRef]
  65. Petit, J.-E.; Favez, O.; Sciare, J.; Crenn, V.; Sarda-Estève, R.; Bonnaire, N.; Močnik, G.; Dupont, J.-C.; Haeffelin, M.; Leoz-Garziandia, E. Two years of near real-time chemical composition of submicron aerosols in the region of Paris using an Aerosol Chemical Speciation Monitor (ACSM) and a multi-wavelength Aethalometer. Atmos. Chem. Phys. 2015, 15, 2985–3005. [Google Scholar] [CrossRef] [Green Version]
  66. Freney, E.; Zhang, Y.; Croteau, P.; Amodeo, T.; Williams, L.; Truong, F.; Petit, J.-E.; Sciare, J.; Sarda-Esteve, R.; Bonnaire, N.; et al. The second ACTRIS inter-comparison (2016) for Aerosol Chemical Speciation Monitors (ACSM): Calibration protocols and instrument performance evaluations. Aerosol Sci. Technol. 2019, 53, 830–842. [Google Scholar] [CrossRef]
  67. Crippa, M.; El Haddad, I.; Slowik, J.G.; DeCarlo, P.F.; Mohr, C.; Heringa, M.F.; Chirico, R.; Marchand, N.; Sciare, J.; Baltensperger, U.; et al. Identification of marine and continental aerosol sources in Paris using high resolution aerosol mass spectrometry. J. Geophys. Res. Atmos. 2013, 118, 1950–1963. [Google Scholar] [CrossRef] [Green Version]
  68. Stohl, A.; Forster, C.; Frank, A.; Seibert, P.; Wotawa, G. Technical note: The Lagrangian particle dispersion model FLEXPART version 6.2. Atmos. Chem. Phys. 2005, 5, 2461–2474. [Google Scholar] [CrossRef] [Green Version]
  69. Pisso, I.; Sollum, E.; Grythe, H.; Kristiansen, N.I.; Cassiani, M.; Eckhardt, S.; Arnold, D.; Morton, D.; Thompson, R.L.; Groot Zwaaftink, C.D.; et al. The Lagrangian particle dispersion model FLEXPART version 10.4. Geosci. Model Dev. 2019, 12, 4955–4997. [Google Scholar] [CrossRef] [Green Version]
  70. Hegarty, J.; Draxler, R.R.; Stein, A.F.; Brioude, J.; Mountain, M.; Eluszkiewicz, J.; Nehrkorn, T.; Ngan, F.; Andrews, A. Evaluation of Lagrangian Particle Dispersion Models with Measurements from Controlled Tracer Releases. J. Appl. Meteorol. Climatol. 2013, 52, 2623–2637. [Google Scholar] [CrossRef]
  71. Karion, A.; Lauvaux, T.; Lopez Coto, I.; Sweeney, C.; Mueller, K.; Gourdji, S.; Angevine, W.; Barkley, Z.; Deng, A.; Andrews, A.; et al. Intercomparison of atmospheric trace gas dispersion models: Barnett Shale case study. Atmos. Chem. Phys. 2019, 19, 2561–2576. [Google Scholar] [CrossRef] [Green Version]
  72. Saha, S.; Moorthi, S.; Wu, X.; Wang, J.; Nadiga, S.; Tripp, P.; Behringer, D.; Hou, Y.-T.; Chuang, H.; Iredell, M.; et al. NCEP Climate Forecast System Version 2 (CFSv2) 6-hourly Products. Res. Data Arch. 2011. [Google Scholar] [CrossRef]
  73. Airparif. 2020. Available online: https://www.airparif.asso.fr/_pdf/publications/communique_presse_evaluation-impact-confinement-sur-air_21042020.pdf (accessed on 13 November 2020).
  74. Kroll, J.H.; Heald, C.L.; Cappa, C.D.; Farmer, D.K.; Fry, J.L.; Murphy, J.G.; Steiner, A.L. The complex chemical effects of COVID-19 shutdowns on air quality. Nat. Chem. 2020, 12, 777–779. [Google Scholar] [CrossRef]
  75. Stirnberg, R.; Cermak, J.; Kotthaus, S.; Haeffelin, M.; Andersen, H.; Fuchs, J.; Kim, M.; Petit, J.-E.; Favez, O. Meteorology-driven variability of air pollution (PM1) revealed with explainable machine learning. Atmos. Chem. Phys. Discuss. 2020, 2020, 1–35. [Google Scholar] [CrossRef]
  76. Molina, L.T. Introductory lecture: Air quality in megacities. Faraday Discuss 2021. [Google Scholar] [CrossRef]
  77. Sciare, J.; d’Argouges, O.; Zhang, Q.J.; Sarda-Estève, R.; Gaimoz, C.; Gros, V.; Beekmann, M.; Sanchez, O. Comparison between simulated and observed chemical composition of fine aerosols in Paris (France) during springtime: Contribution of regional versus continental emissions. Atmos. Chem. Phys. 2010, 10, 11987–12004. [Google Scholar] [CrossRef] [Green Version]
  78. Galloway, J.N.; Aber, J.D.; Erisman, J.W.; Seitzinger, S.P.; Howarth, R.W.; Cowling, E.B.; Cosby, B.J. The Nitrogen Cascade. Bioscience 2003, 53, 341–356. [Google Scholar] [CrossRef]
  79. Behera, S.N.; Betha, R.; Balasubramanian, R. Insights into Chemical Coupling among Acidic Gases, Ammonia and Secondary Inorganic Aerosols. Aerosol Air Qual. Res. 2013, 13, 1282–1296. [Google Scholar] [CrossRef]
  80. Schiferl, L.D.; Heald, C.L.; Nowak, J.B.; Holloway, J.S.; Neuman, J.A.; Bahreini, R.; Pollack, I.B.; Ryerson, T.B.; Wiedinmyer, C.; Murphy, J.G. An investigation of ammonia and inorganic particulate matter in California during the CalNex campaign. J. Geophys. Res. Atmos. 2014, 119, 1883–1902. [Google Scholar] [CrossRef]
  81. Plautz, J. Piercing the haze. Science 2018, 361, 1060–1063. [Google Scholar] [CrossRef] [PubMed]
  82. Zhu, L.; Henze, D.K.; Cady-Pereira, K.E.; Shephard, M.W.; Luo, M.; Pinder, R.W.; Bash, J.O.; Jeong, G.-R. Constraining U.S. ammonia emissions using TES remote sensing observations and the GEOS-Chem adjoint model. J. Geophys. Res. Atmos. 2013, 118, 3355–3368. [Google Scholar] [CrossRef]
  83. Pusede, S.E.; Duffey, K.C.; Shusterman, A.A.; Saleh, A.; Laughner, J.L.; Wooldridge, P.J.; Zhang, Q.; Parworth, C.L.; Kim, H.; Capps, S.L.; et al. On the effectiveness of nitrogen oxide reductions as a control over ammonium nitrate aerosol. Atmos. Chem. Phys. 2016, 16, 2575–2596. [Google Scholar] [CrossRef] [Green Version]
  84. Seinfeld, J.H.; Pandis, S.N. Atmospheric Chemistry and Physics: From Air Pollution to Climate Change; Wiley: New York, NY, USA, 2012; p. 1232. [Google Scholar]
  85. Ansari, A.S.; Pandis, S.N. An Analysis of Four Models Predicting the Partitioning of Semivolatile Inorganic Aerosol Components. Aerosol Sci. Technol. 1999, 31, 129–153. [Google Scholar] [CrossRef]
  86. Meng, Z.; Xu, X.; Lin, W.; Ge, B.; Xie, Y.; Song, B.; Jia, S.; Zhang, R.; Peng, W.; Wang, Y.; et al. Role of ambient ammonia in particulate ammonium formation at a rural site in the North China Plain. Atmos. Chem. Phys. 2018, 18, 167–184. [Google Scholar] [CrossRef] [Green Version]
  87. Baek, B.H.; Aneja, V.P.; Tong, Q. Chemical coupling between ammonia, acid gases, and fine particles. Environ. Pollut. 2004, 129, 89–98. [Google Scholar] [CrossRef]
  88. Sharma, M.; Kishore, S.; Tripathi, S.N.; Behera, S.N. Role of atmospheric ammonia in the formation of inorganic secondary particulate matter: A study at Kanpur, India. J. Atmos. Chem. 2007, 58, 1–17. [Google Scholar] [CrossRef]
  89. Fountoukis, C.; Nenes, A. ISORROPIA II: A computationally efficient thermodynamic equilibrium model for K+–Ca2+–Mg2+–NH4+–Na+–SO42−–NO3–Cl–H2O aerosols. Atmos. Chem. Phys. 2007, 7, 4639–4659. [Google Scholar] [CrossRef] [Green Version]
  90. Tie, X.; Huang, R.J.; Cao, J.; Zhang, Q.; Cheng, Y.; Su, H.; Chang, D.; Pöschl, U.; Hoffmann, T.; Dusek, U.; et al. Severe Pollution in China Amplified by Atmospheric Moisture. Sci. Rep. 2017, 7, 15760. [Google Scholar] [CrossRef]
  91. Randriamiarisoa, H.; Chazette, P.; Couvert, P.; Sanak, J.; Mégie, G. Relative humidity impact on aerosol parameters in a Paris suburban area. Atmos. Chem. Phys. 2006, 6, 1389–1407. [Google Scholar] [CrossRef] [Green Version]
Figure 1. Statistical distribution of NO2 (upper panels) and PM2.5 (lower panels) concentrations (μg/m3) measured by Airparif over Paris for the 1 January to 17 March (17 March to 1 June) time period in red (blue) from 2015 to 2020 (left to right panels). The medians and the quartiles are represented by center lines and borders of the boxes, respectively. The outliers are indicated in blue points. Numbers are the percentage of concentrations change between 17 March–1 June and 1 January–17 March time periods.
Atmosphere 12 00160 g001
Figure 2. Time series of hourly PM2.5 and NO2 concentrations (µg/m3) derived from the Airparif network (a,b), hourly NH3 concentrations (µg/m3) derived from the mini-DOAS (c), daily Infrared Atmospheric Sounding Interferometer (IASI) NH3 total column (molecules/cm2) measured in a 50 km radius circle from Paris city center (d), and mean relative contributions of major PM1 chemical species (OM: organic matter, SO42−: sulfate, NO3: nitrate, and NH4+: ammonium) measured at SIRTA from January to June 2020, and for the 5 investigated periods (e).
Atmosphere 12 00160 g002
Figure 3. IASI NH3 total column (molecules/cm2) average distributions over Paris (blue cross) for (a) January to June 2020, and (bf) the five periods investigated.
Atmosphere 12 00160 g003
Figure 4. FLEXPART emission sensitivity response functions to air parcels reaching the Paris region (red dot) during the five pollution events.
Atmosphere 12 00160 g004
Figure 5. Molar concentrations of 2xSO42− + NO3 (triangles) and 2xSO42− (squares) versus NH4+, color coded by NH3 molar concentrations measured in Paris from January to June 2020. Concentrations measured during the five pollution events are represented with black marker edges.
Atmosphere 12 00160 g005
Table 1. Periods identified as particulate pollution episodes over Paris in the frame of the present study, along with associated mean and 1-σ standard deviation of PM2.5, NH3, and major PM1 chemical species (OM: organic matter, SO42−: sulfate, NO3: nitrate, and NH4+: ammonium) concentrations (µg/m3).
Event #DatePM2.5NH3 OM SO42− NO3 NH4+
120 January 15:00–27 January 00:0031.19 ± 13.34below < 0.511.93 ± 4.662.18 ± 0.998.18 ± 4.213.26 ± 1.54
217 March 12:00–21 March 12:0022.55 ± 8.388.22 ± 5.197.42 ± 3.131.32 ± 0.787.07 ± 3.652.71 ± 1.35
327 March 10:00–29 March 03:0036.03 ± 15.6111.13 ± 4.6510.04 ± 4.772.17 ± 0.6713.33 ± 7.254.93 ± 2.45
413 April 3:00–13 April 16:0020.89 ± 12.037.08 ± 1.506.05 ± 2.622.13 ± 1.218.23 ± 9.673.34 ± 3.25
518 April 23:00–20 April 12:0021.76 ± 10.306.06 ± 1.337.13 ± 1.402.25 ± 1.108.52 ± 5.033.60 ± 1.98
Table 2. Spearman’s rank correlation coefficients (rs) between particulate matter (PM2.5), ammonia (NH3), and particulate species (OM: organic matter, SO42−: sulfate, NO3: nitrate, and NH4+: ammonium) for the period of study (January–June 2020, and the five pollution events). rs > 0.85 are in bold. NH3 concentrations derived from the mini-DOAS (differential optical absorption spectroscopy) below detection limits were discarded.
January–JunePM2.5NH3OMSO42−NO3NH4+
PM2.51.00
NH30.611.00
OM0.820.701.00
SO42−0.710.580.791.00
NO30.780.600.790.761.00
NH4+0.750.630.780.870.921.00
Event 1
PM2.51.00
NH3n/a1.00
OM0.90n/a1.00
SO42−0.56n/a0.551.00
NO30.73n/a0.650.831.00
NH4+0.67n/a0.600.880.981.00
Event 2
PM2.51.00
NH30.481.00
OM0.690.511.00
SO42−0.590.690.401.00
NO30.870.470.500.611.00
NH4+0.840.480.430.670.981.00
Event 3
PM2.51.00
NH30.881.00
OM0.800.751.00
SO42−0.710.660.871.00
NO30.960.850.890.831.00
NH4+0.940.820.910.880.991.00
Event 4
PM2.51.00
NH30.691.00
OM0.760.711.00
SO42−0.950.750.801.00
NO30.970.740.730.951.00
NH4+0.970.710.720.950.981.00
Event 5
PM2.51.00
NH30.331.00
OM0.590.401.00
SO42−0.850.520.821.00
NO30.860.500.580.851.00
NH4+0.860.510.600.860.991.00
Publisher’s Note: MDPI stays neutral with regard to jurisdictional claims in published maps and institutional affiliations.

