Article

Nitrous Oxide Emission Fluxes in Coffee Plantations during Fertilization: A Case Study in Costa Rica

by
Macarena San Martin Ruiz
*,
Martin Reiser
and
Martin Kranert
Institute for Sanitary Engineering, Water Quality and Solid Waste Management, University of Stuttgart, 70569 Stuttgart, Germany
*
Author to whom correspondence should be addressed.
Atmosphere 2021, 12(12), 1656; https://doi.org/10.3390/atmos12121656
Submission received: 6 October 2021 / Revised: 7 December 2021 / Accepted: 7 December 2021 / Published: 9 December 2021
(This article belongs to the Special Issue Agricultural Greenhouse Gas Emissions)

Abstract

:
The main source of N2O emissions is agriculture, and coffee monocultures have become an important part of these emissions. The demand for coffee has increased in the last five decades. Thus, its production in agricultural fields and the excess of fertilizers have increased. This study quantified N2O emissions from different dose applications and types of nitrogen fertilizer in a region of major coffee production in Costa Rica. A specific methodology to measure N2O fluxes from coffee plants was developed using Fourier-transform infrared spectroscopy (FTIR). Measurements were performed in a botanical garden in Germany and plots in Costa Rica, analyzing the behavior of a fertilizer in two varieties of coffee (Catuai and Geisha), and in a field experiment, testing two types of fertilizers (chemical (F1) and physical mixture (F2)) and compost (SA). As a result, the additions of synthetic fertilizer increased the N2O fluxes. F2 showed higher emissions than F1 by up to 90% in the field experiment, and an increase in general emissions occurred after a rain event in the coffee plantation. The weak levels of N2O emissions were caused by a rainfall deficit, maintaining low water content in the soil. Robust research is suggested for the inventories.

1. Introduction

One of the biggest anthropogenic greenhouse gas (GHG) sources and sinks for nitrous oxide (N2O) contributing to climate change, is agriculture [1,2]. N2O is 265 times better at trapping heat than carbon dioxide, which means that even small emissions of N2O affect the climate [3]. Fertilizers are sources that enhance plant growth, and they can be natural or synthetic, providing key macronutrients such as nitrogen (N) that are important for leaf growth [4,5]. Studies indicate that N2O emission could be correlated with synthetic nitrogen fertilizer (SNF) application rates in linear or nonlinear relationships in agroecosystems [6,7]. Studies imply that indirect sources come from nitrogen leaching and runoff from agricultural soils, [8]. Volatilization and deposition of ammonia from fertilizers is applied to crops [9]. Direct source is SNF, which once applied, is used by the bacteria living in the soil to produce the necessary energy required to live and grow [10]. Due to the excess supply of fertilizers, the production of N2O, in agricultural fields provokes intermediate emissions [11]. When the fertilizer is combined with favorable soil conditions for denitrification, large amounts of N2O can be produced and emitted to the atmosphere [12].
The main sources of N2O production are nitrification and denitrification, and both can occur simultaneously [13]. The production is linked directly to the composition of soils and environmental conditions such as carbon sources, redox potential, nitrate (NO3), oxygen (O2), nitrite (NO2), sulfur (S2), and pH [14]. During nitrification, ammonium is converted to nitrite [15]. Denitrification occurs when nitrites are reduced to N2O and inert N2 under anaerobic condicionts [7,10]. Several microorganisms and conditions act within the process, which are linked directly with the compostition of the soils [16]. The variety of the soils delineates the behaviours and periods of the processes mentioned for the production of N2O, but it is important to measure the N content to diagnose the sources of the emissions. Then, the N2O can be produced during the next stages, shown in Figure 1 [16,17,18].
The main N2O emissions hotspots in Costa Rica come from fertilizer production. The direct and indirect soil N2O emissions come from organic fertilizer (such as coffee pulp) [19]. According to the Coffee Institute of Costa Rica (ICAFE), technology for coffee production has become intensive instead of extensive within the last 20 years, generating more productivity for the units harvested. The techniques include using fertilizers to bring nutrients to a healthy level, causing an increase in emissions during coffee production, leading to impacts such as global warming at the farm level [20,21]. Therefore, this study aimed, at first, to develop a measurement strategy for N2O emissions in a botanical garden in Germany, in order to apply this methodology to a coffee plantation. Subsequently, we performed an evaluation of the N2O emission fluxes from the soil from a coffee plantation in the Central Valley of Costa Rica. After that, field experiments were conducted in Costa Rica, comparing emissions from two varieties of coffee plants, and a field experiment trial, using SNF and compost application. Finally, the quantification of N2O emission fluxes and their impact on the carbon footprint of the fertilizers for the sector in Costa Rica was achieved.

2. Materials and Methods

2.1. Site Description and Fertilization

The measurements were established in Tarrazú canton, in the Los Santos zone, which is located about 70 km south of the Costa Rican Capital, San Jose, between 9°39′25.41″ N and 84°01′32.08″ W. The experiment was conducted during the coffee production season of 2018–2021 at an altitude of 1200–1900 m.a.s.l., during the dry season [22]. The total area of coffee plantations along the mountain range is more than 90,000 hectares and between 600–1600 m.a.s.l. [23], and the age of the coffee plants ranges between 15–20 years old. In the Los Santos zone, the annual average wind speed ranged between 0.5 km/h–2.4 km/h; the annual average temperature was between 19–24 °C. The annual average precipitation for the summer season was between 0–100 mm/month and for the rainy season was between 250–418 mm/month, and the annual average of relative humidity was between 79–85% [24]. The soil of this zone in Costa Rica is acidic by nature (around pH 5.0), which also tends to increase due to acidifying nitrogen such as ammonium nitrate and urea [25]. Specifically in this zone, the soils can be classified in the order of Ultisols (red clay soils), suborder of Humults, large group Palehumults, and subgroup Aquic Palehumults [26,27]. The weather is biseasonal and defined by how much rain falls during a particular period. Therefore, the year can be split into two periods in that zone, with a dry season (December–April) and a rainy season (May–November), with an average temperature between 26 °C and 32 °C for the dry season and 17.5 °C and 20 °C for the rainy season [28]. For this study, soil analysis was conducted in the area where the gas sampling was performed. Table 1 shows the main parameters analyzed. The soil samples were taken from five random subsamples among the plots. Subsequently, the five subsamples were mixed using a quartering technique. The samples were delivered to the laboratory for analysis and the results were given as mean values from the report analysis, obtaining the results shown in Table 1. The procedure was designed for pH and electrical conductivity (EC) in water 10:25; phosphorus (P), and potassium (K) with Olsen-modified pH 8.5 (NaHCO3 0.5 N, EDTA 0.01M, Superfloc 127) 1:10. Acidity was determined by titration with NaOH (P) by colorimetry with a flow injection analyzer (FIA), and the rest of the elements by atomic absorption spectrophotometry (AAS). Total %C and %N were determined with the C/N autoanalyzer by dry combustion. CEC (effective cation exchange capacity) was calculated as the sum of the acidity + Ca + Mg + K. The AS (percentage of acidity saturation) was calculated as (acidity/CICE) × 100.
Traditionally, the fertilization of coffee plantations combines the application of multi-nutrient fertilizers (NPK+, Mg+2 and B+3) known as “complete formulas.” Nitrogen is the main component, whose application is carried out at the end of the rainy period receiving the name of “extra nitrogen”, controlled by the agronomists and the farmers of the coffee plantations. In the study area, ammonium nitrate was predominant, ranging from 53% of N fertilizers, and in the country, the majority (94%) is distributed between ammonium nitrate with 56% and dolomitic ammonium nitrate with 38% [29]. Three fertilization events were carried out during the annual cycle of the crop. The normal fertilization process in the zone was performed in May, August, and October.
At the farms in Costa Rica, there are currently four types of doses of nitrogen fertilizer that have been applied in the coffee crops [29]. The number of doses applied and the fertilization period listed below in Table 2. The fertilization is made under a band application, and it was performed according to the normal cultivation season of fertilizer application. ICAFE recommends, in addition to chemical and physical mixtures of fertilization, the application of organic fertilizer at a dose of 2 kg/plant. Once the coffee plant has reached two years old and starts its production cycle, it is recommended for all regions in the country. Complete formulas should not contain less than 15% N.

2.2. Experimental Design and Sampling

The experimental design was created in a nursery and Moorish greenhouse in a botanical garden (zoological–botanical garden Wilhelma, 48°48′14.84″ N and 9°12′29.1″ E) in Stuttgart, Germany, to obtain a methodology for N2O measurements to apply to coffee plantations in Costa Rica, and the first ranges of N2O concentration over the surface of the soil of coffee plants (Figure 2A,B). The average sizes of the coffee plants in the nursery greenhouse were approximately ~15 cm in the first 1–3 months (small size) and ~60 to 70 cm in 4 to 6 months (medium sized) in pots. The adults plants were located in the Moorish greenhouse planted in the soil. Therefore, there was no competition between adults and young plants or any physical contrains since the plants were divived by the young plants in the nursery greenhouse and the adults in the Moorish greenhouse. The fast growth is caused by the fertilizer shown in Table 2, that is enriched with N, K, and P. The reason for this is to reach a significant quantity of sunlight. However, there was no belowground competition between different plants or resources because every coffee plant has its own pot and receives specific irrigation with fertilizer in each one in the nursery greenhouse for the small and medium-sized plants.
The N2O fluxes were determined by an open, dynamic hood measurement method. Here, the ambient air was sucked with a constant flow through the hood. The difference in gas concentration of N2O in the ambient air (background concentration) and the off-gas stream from the hood (equilibrium concentration) were continuously measured using a portable gas analyzer (Fourier-transform infrared (FTIR)). Before the open hood is placed, no difference exists between the hood off-gas and the atmosphere. After placing the hood, an air exchange begins, which reaches equilibrium when the amount of N2O flowing out of the hood equals the flux of N2O emitted from the ground. From this point on, the N2O concentration difference between the hood and the environment and the flow rate divided by the soil area covered by the chamber equals the soil emission rate.The N2O concentrations were taken using methods in [30,31,32,33,34,35]. The chamber was made of a polyvinylchloride (PVC) material with a cylindrical shape, enhancing a better mixing of the enclosed air, fitted with a vent to avoid pressure changes during the measurements.
This device identifes up to 50 gas compounds from samples that are under different environmental conditions, and possesses a detection limit of <3 times spectral baseline noise [36]. Based on Beer’s law, the maximum value in the peak of the curve is directly proportional to the concentration of any compound [36]. The main principle of FTIR is to identify the radiation absorbed in molecules with its characteristic frequency (wavelengths). Furthermore, each molecule has its own combination, making it possible to identify any component as a fingerprint (molecule distribution) for almost any kind of gas [36]. The N2O concentrations were obtained per minute directly through the FTIR during one hour of measurements, and one chamber was placed for each measurement in a coffee plant. As mentioned above, the concentration in the chamber depends on concentrations and flow rates of the incoming and outgoing airflows (between the soil air space, the chamber, and the ambient air). Therefore, emission rates were determined and calculated until the concentration reached an equilibrium in the chamber.
After that, the first measurements in Costa Rica took place, quantifying the amount of N2O fluxes depending on the fertilization period of each measurement. Then, the punctual measurements were made at different periods during day time (between 7:00–15:00) over the years, to understand the behavior of the N2O fluxes depending on the season and the amount of fertilizer normally applied in the coffee plantation.
Parallel to this, daily monitoring and measurements were performed for 30 days in a plot in Costa Rica to obtain a semicontinuous flux when the fertilizer was added. Finally, the fertilizer was applied manually to the base of the coffee plant (band fertilization), following the process at the coffee farms (Table 2). In this case, two types of fertilizer were added in two different coffee plants, 2 kg of compost in one plant coming from the coffee byproducts and green waste from the harvest 2019–2020, and all the measurements were made in duplicate [32]. Finally, all of these measurements were compared with a control where no fertilizer nor compost was added, with the same conditions as the rest of the coffee plantation except with the fertilizer being added during the fertilization period of the plantation, mentioned in Table 2.
Nitrous oxide sampling to determine nitrous oxide emissions began with the first fertilization event and continued with punctual measurements throughout the crop year. Two widely used coffee varieties in the Los Santo zone were considered during sampling in Costa Rica, Geisha (Panamanian Geisha) and Catuai. Therefore, it was considered relevant to find a relationship or similarities between the coffee variety, the amount of fertilizer applied, and the fertilization period of each variety. The principle of the measurement this technique used in this study for N2O quantification was based on covering an area of soil with a closed, sealed chamber, allowing gas exchange between the soil and the atmosphere [37]. The gas concentration is expected to increase inside the chamber due to Fick’s first law, which explains that gas flow is dependent on the concentration gradient and the diffusivity of the soil [15].
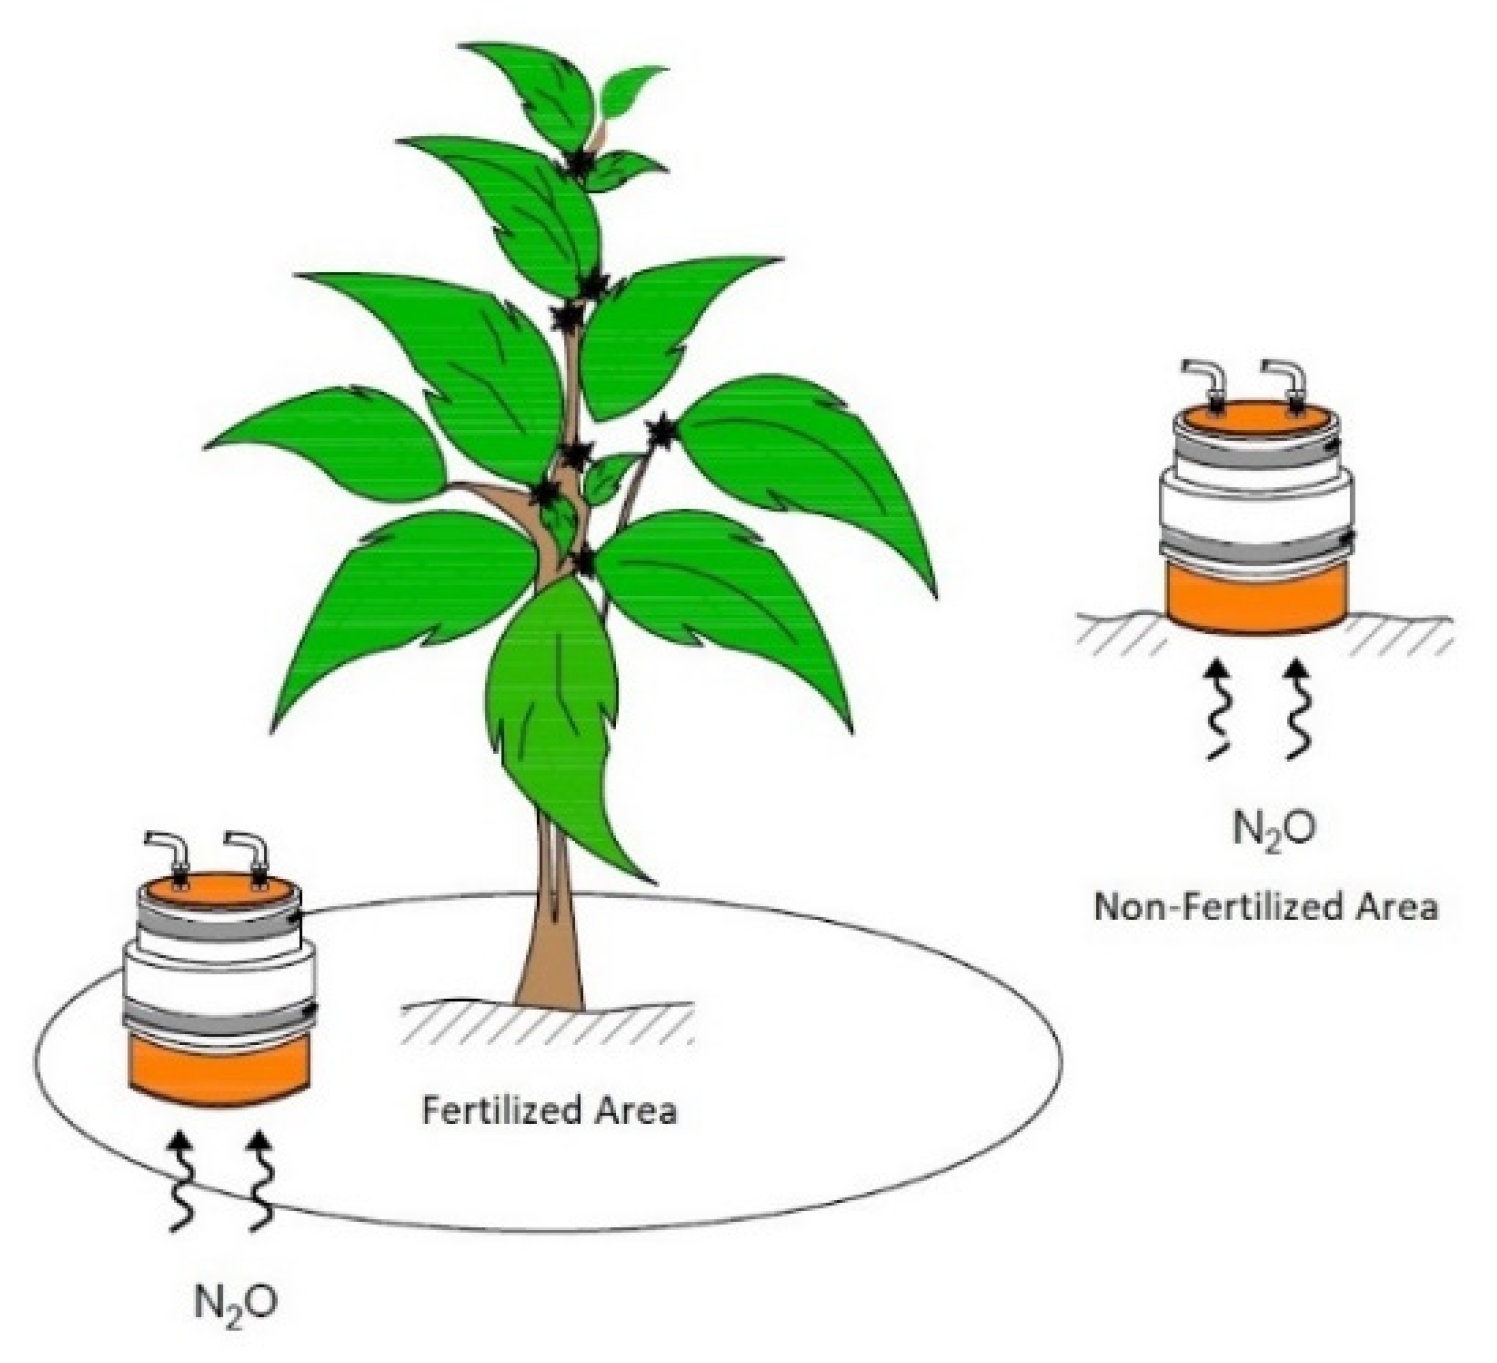
For the gas sampling, plants were selected randomly by moving in a zigzag direction to obtain random selection within the plot and choosing coffee plants of a similar age, according to the information provided by the farmers and the height. The chamber for the gas collection was placed not more than a 15 cm distance from the plant stem. The distance of the chamber was mainly for the fertilization line that is performed over that distance from the plant. Figure 3 shows how the selection was considered, since the fertilizer was applied to the plant’s surroundings (not further than the diameter of the coffee plant leaves). All direct emissions of N2O from SNF were calculated according to the equations suggested by the Food and Agriculture Organization (FAO) [38]. Direct emissions of N2O from SNF:
D i r e c t   e m i s s i o n N 2 O = N   44 28   E F 1   unit :   [ kg N 2 O / year ]
where: N = Nutrient consumption of N-fertilizers [kg-N/year], added to the coffee plant per year, 44/28 = conversion value of emissions from kg-N2O-N to kg-N2O-gas; EF1 = 0.01; emission factor for N2O emissions from N inputs, kg N2O-N/kg N.
Direct emissions of CO2eq:
D i r e c t   e m i s s i o n C O 2 = D i r e c t   e m i s s i o n N 2 O   G W P   unit :   [ kg N 2 O / year ]
where: GWP = 310 (100 to 110 years lifetime global warming potential).
Statistical analysis via a one-way analysis of variance (ANOVA) test was carried out to investigate the relationships between emissions rates and the types of fertilizer in a period. In addition, the Tukey HSD test (α = 0.05) was used to assess significant differences between the treatments.

3. Results and Discussion

Overall emissions of N2O are presented as (i) punctual emission N2O fluxes during a set period in a botanical garden in Germany, with the standard fertilization, dose, and frequency, without any alteration in the fertilization process; (ii) punctual emission N2O fluxes measured on a coffee plantation in Costa Rica from 2019 to 2021, without any alteration in the fertilization process taking place at a different time of year: (iii) field trial experiment in Costa Rica in a plot of a coffee plantation, where two types of SNF were tested and compared with a soil amendment and a control; (iv) direct emissions (CO2eq) from SNF additions.
Regarding the soil analysis, ultisols represent 21% of the Costa Rican territory; they are formed with high ambient temperature, with precipitation exceeding evapotranspiration, and having as the main feature the formation of an argillic horizon with low base content and accumulation of alluvial clay [39]. In response, these types of properties and this type of volcanic region with ultisol soils are often appropriate for coffee cultivation due to the naturally high soil fertility and constant fertilization [40]. In ultisol soils, there are usually medium-to-low organic matter contents. Likewise, CEC can be very dependent on the organic fraction. Depending on the type and amount of clay, the CEC of the mineral fraction is usually low [41]. Low differences in soil properties were seen between A (soil control area), B (soil control area without pesticides), and C (soil with 40% fewer N-based fertilizers and compost application) plots. Both soils had low pH and moderate values of exchangeable Ca, Mg, and K. pH plays an important factor in N2O emissions, especially when the pH is acidic [42]. Soil pH plays a role in controlling the nitrification and denitrification rates, mainly during the N2O production influencing the microflora and N-transforming bacteria [43]. For instance, under alkaline conditions, the end products of the nitrification process were N2 and low N2O production [44].
Soil moisture is the main parameter for emissions, enhancing the microbial activity in the soil [45]. In addition, studies have reported increased N2O emissions after applying N fertilizer, especially with high soil moisture [18]. Therefore, expected higher N2O emission rates were found in wet seasons or during soil moisturization. Some researchers state that agricultural soils produce N2O during the growing season due to the mineralization process of organic matter [46].
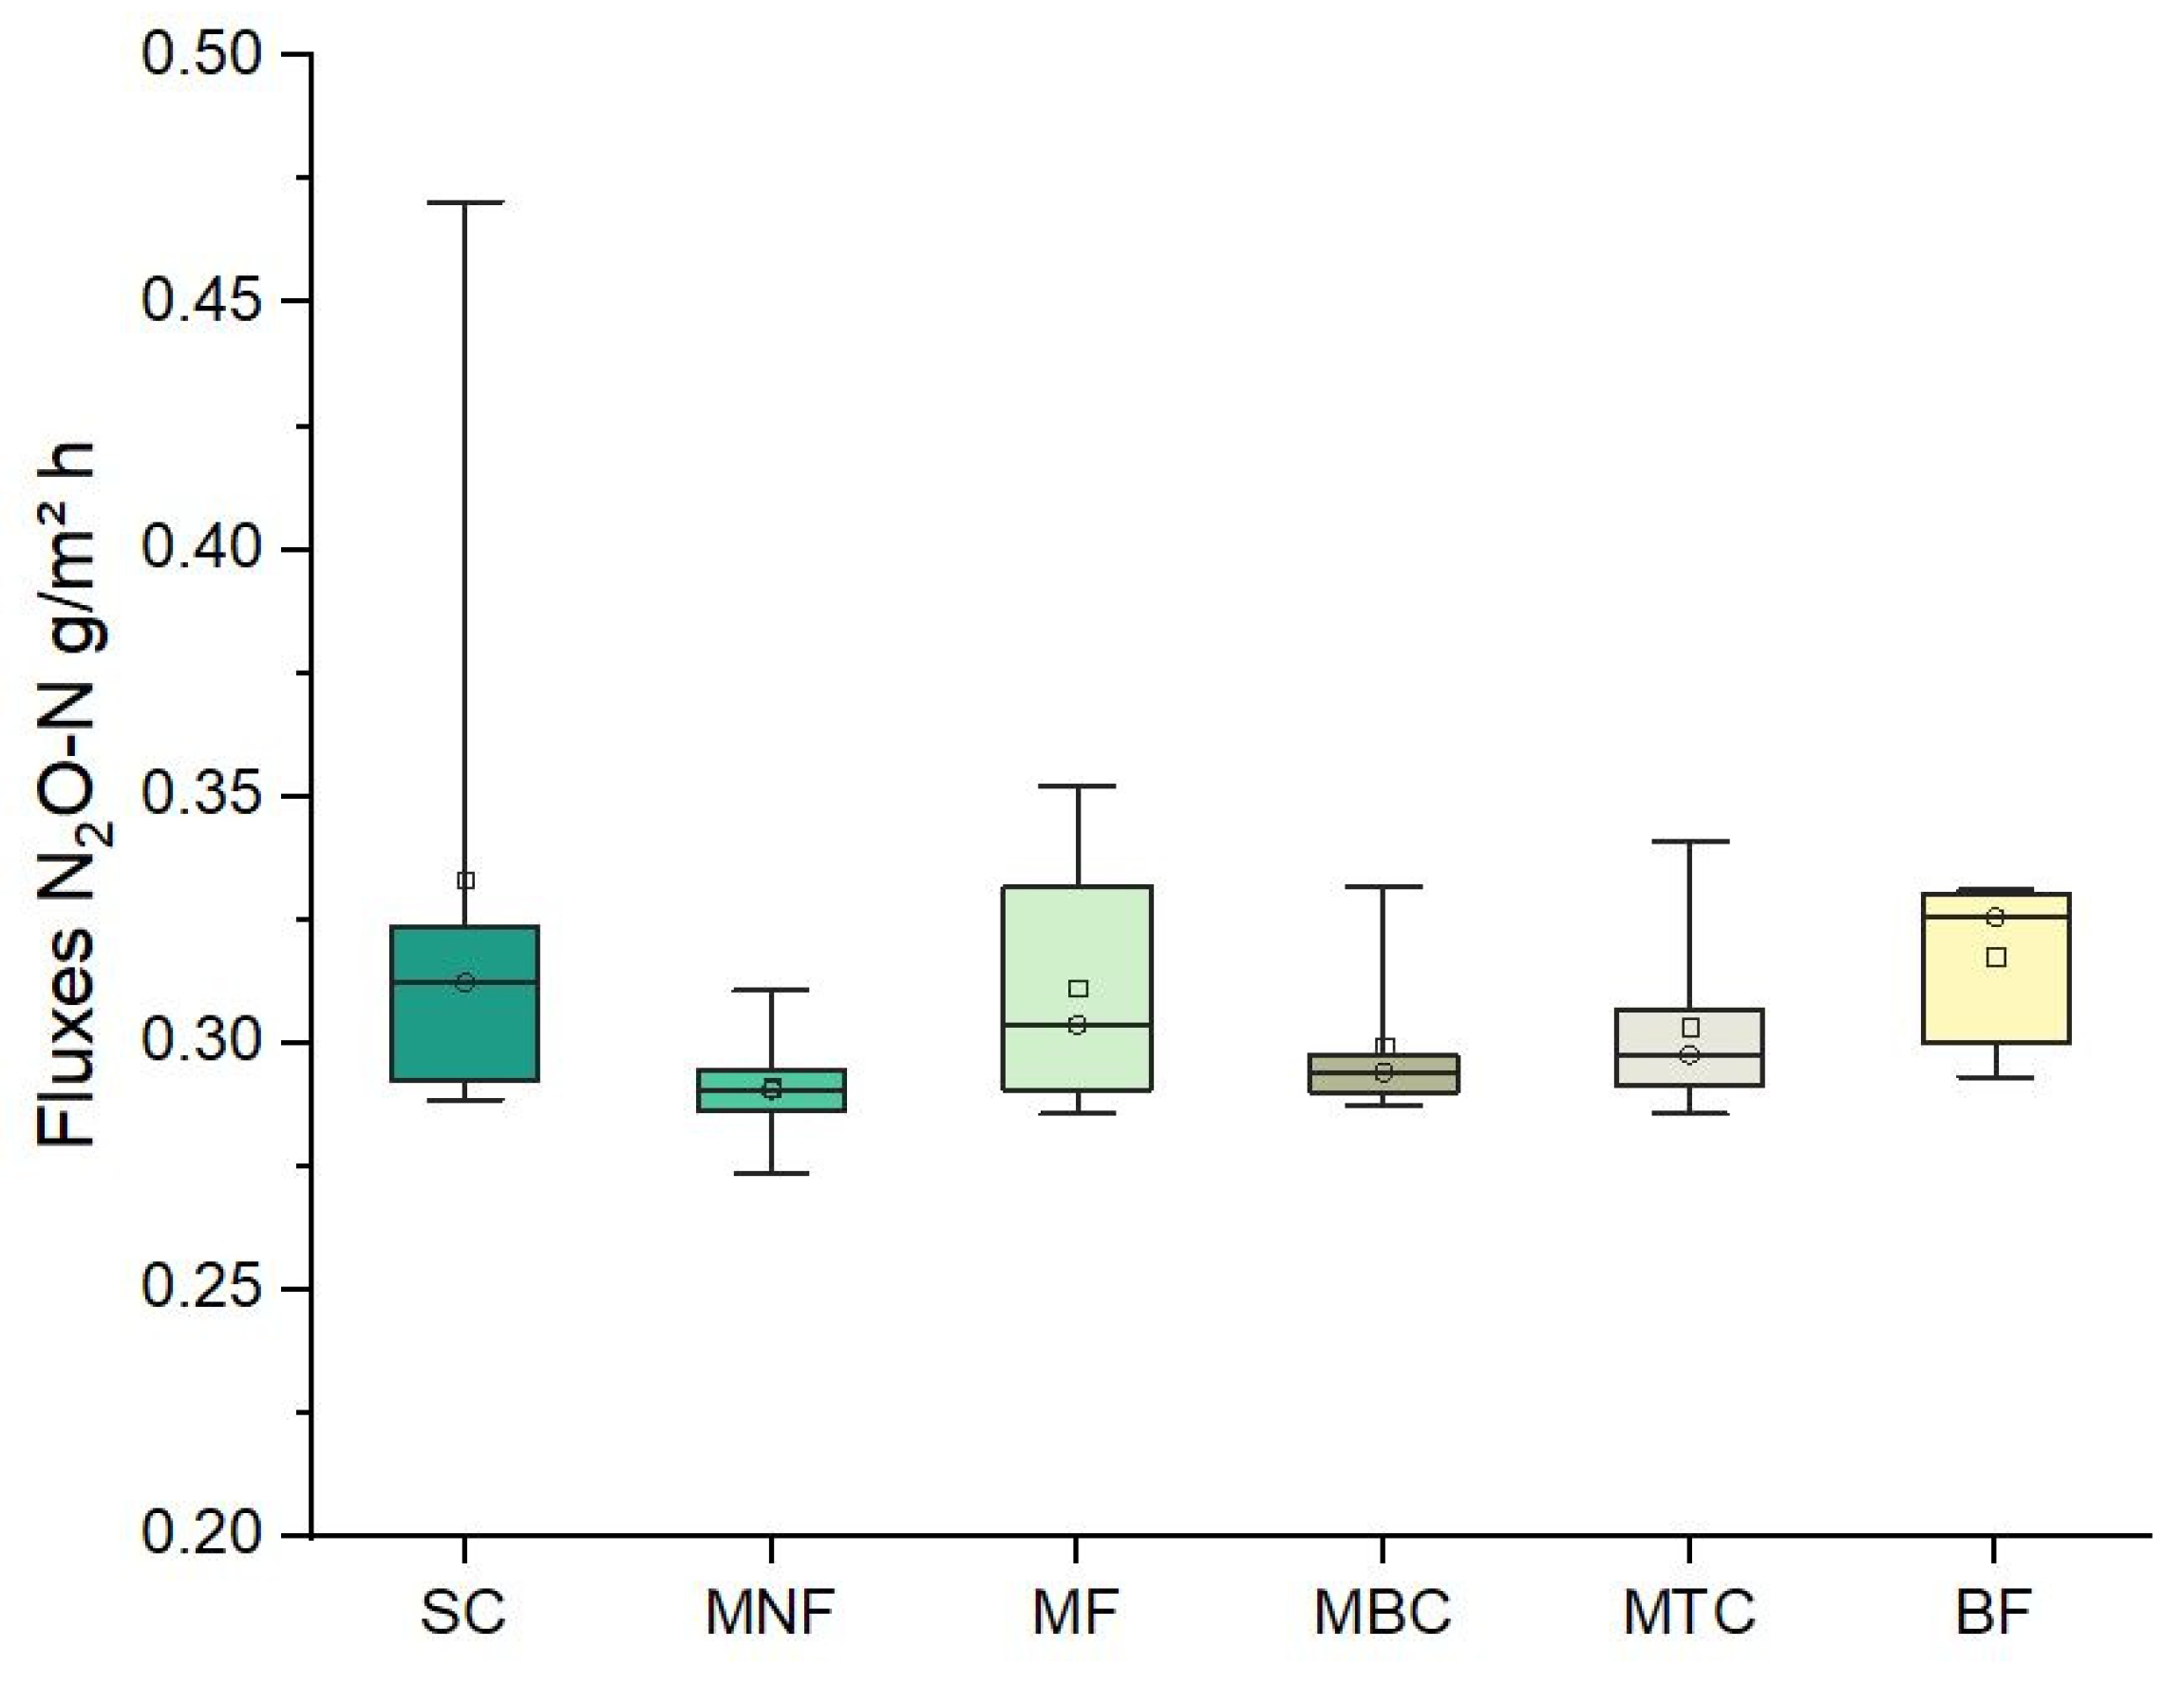
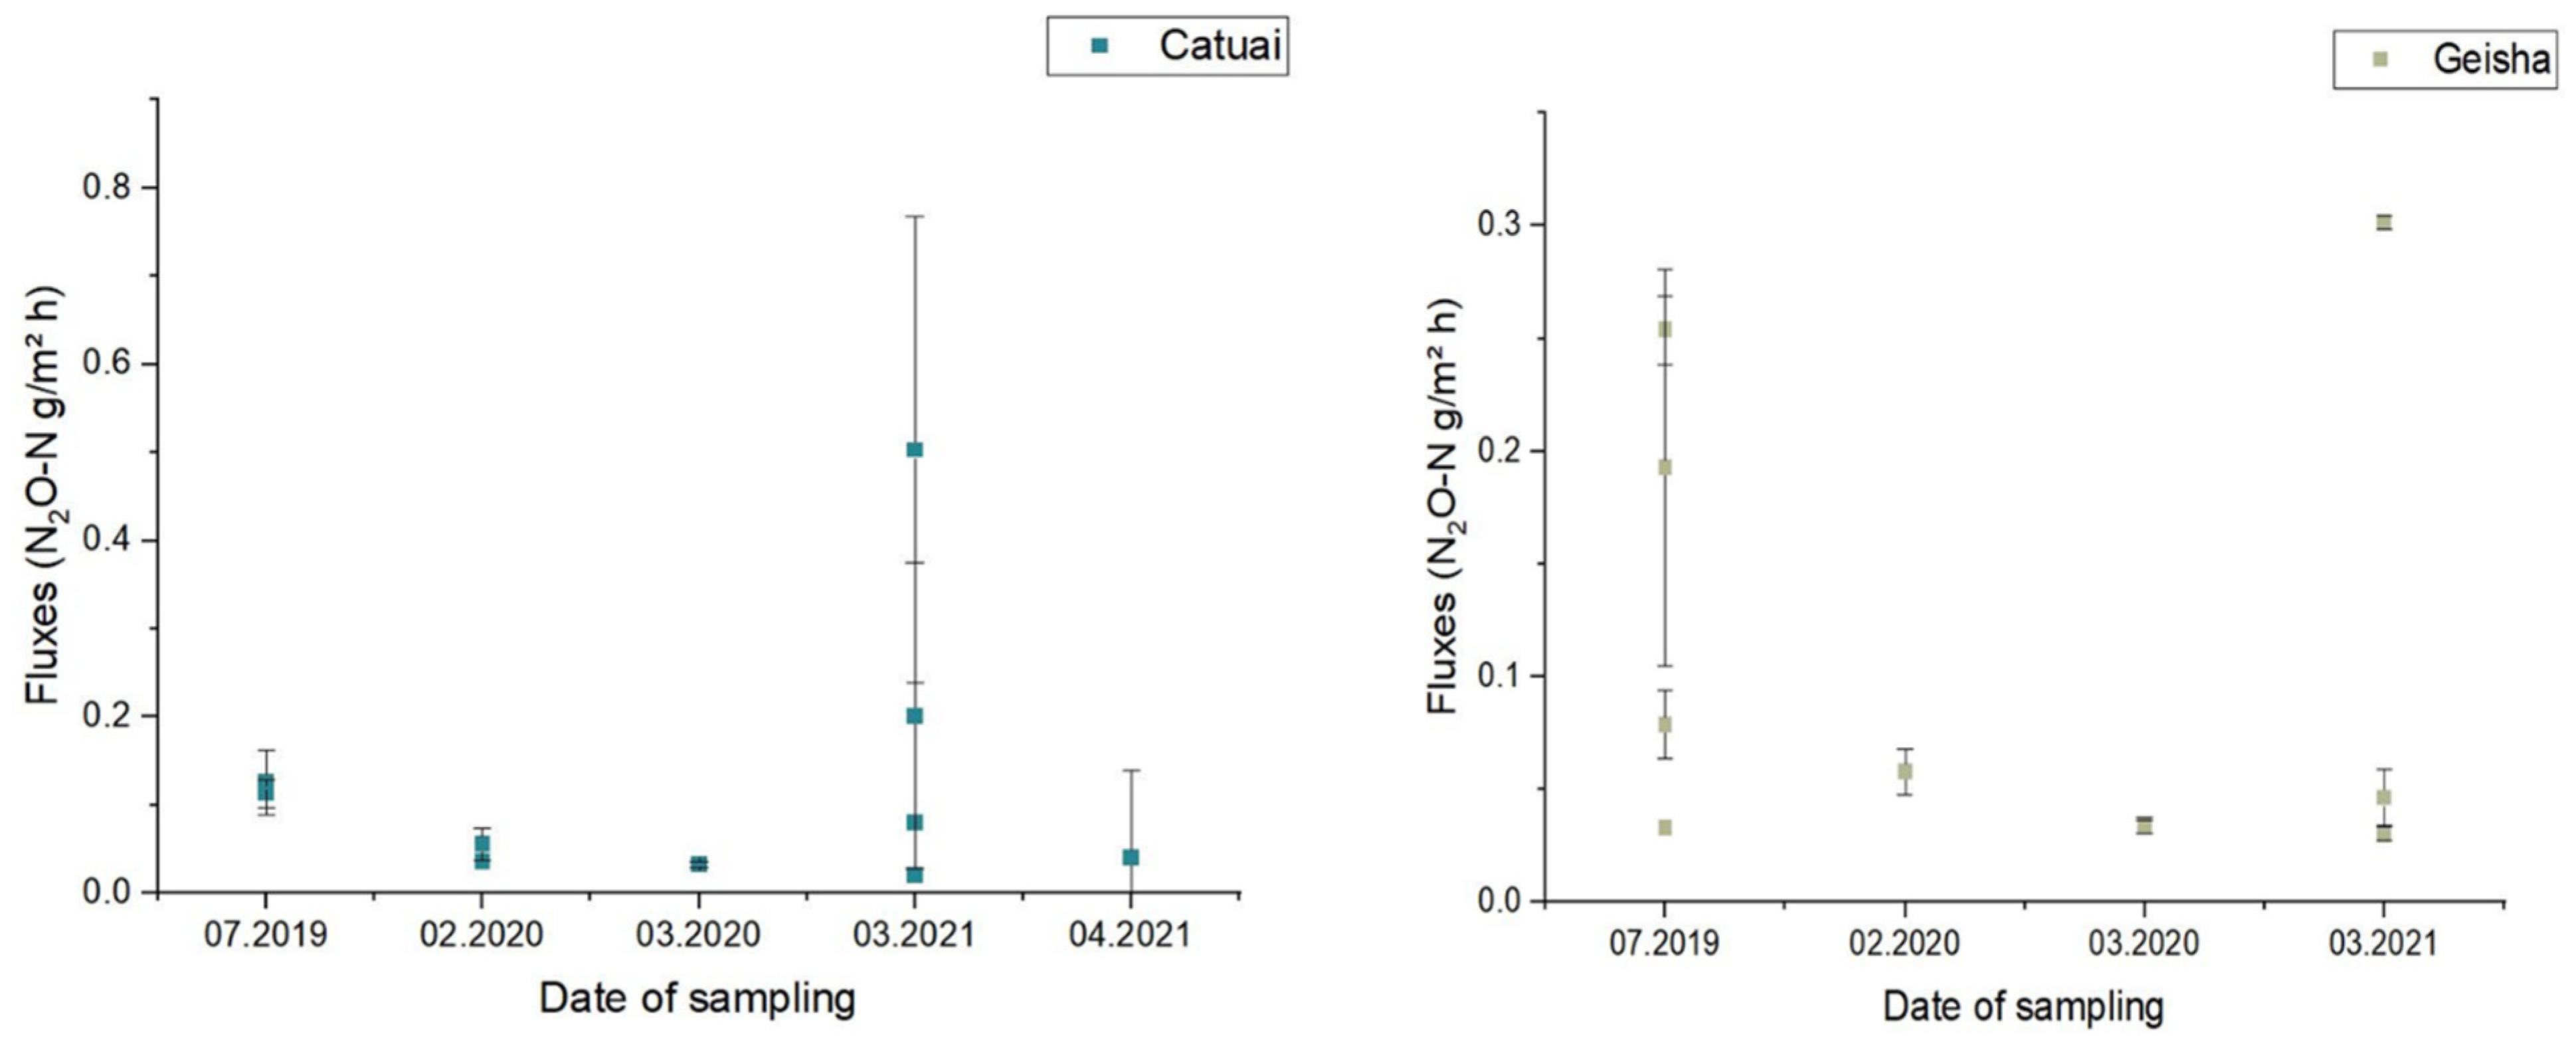
Regarding the statistical analysis, significance probabilities of p ≤ 0.35 for the botanical garden experiments, p ≤ 1.8 × 10−05 for comparing the varieties of coffee Catuai and Geisha, and p ≤ 4.83 × 10−04 were used for all mean values for the fertilization trial results. Pairwise comparisons of the means using Tukey’s HSD revealed nonsignificant differences between the conditions for the botanical garden (Figure 4). Contrary, for the Figure 5, Tukey’s HSD revealed significant differences between four conditions (Geisha in 2019 and Catuai in 2021, Geisha in 2020 and Catuai in 2021, Catuai in 2019, and Catuai in 2021, and Catuai in 2019 and Catuai in 2021). The results shown in Figure 6 indicate a significant difference among F1 and F2, F2 and TC, F2 and SA means, at a 5% level of significance (Type I error, alpha).
For identifying the behavior of the nitrous oxide emissions on coffee plants, the first measurements were taken in the nursery greenhouse and Moorish greenhouse on 12 different spots before a fertilization event, in a continuous period of 60 min, with the portable device calibrated with ambient air. Figure 4 shows the variations in [g/m2*h] of the 12 spots of the measurements taken in July 2019. There was continuous irrigation applied weekly during the current year, with a mixture of water and fertilizer to help the growth of the coffee plants and other species. In the nursery and the Moorish greenhouse, the plants are maintained under controlled conditions. The dosage is exemplified in Table 2 under the percentage of fertilizer used in the nursery greenhouse in the botanical garden for the fertilization. The irrigation is performed once per day with around 100 mL of water per pot, and the temperature ranges between 20–25 °C daily to maintain the moisture and simulate tropical weather. The emission rates were calculated to obtain specific N2O emission fluxes from coffee plants under controlled conditions (irrigation, humidity, temperature and, fertilization), meaning an artificial ambient condition that simulates tropical conditions (high humidity) typical of the coffee monoculture regions. This value calculates the theoretical N2O emission from a whole hectare, the emissions rates from a common density of coffee plants in monocultures (5000 to 6000 plants/ha), and the CO2 equivalent from the examples mentioned, knowing the theoretical impact on the environment as GWP gases.
Nitrogen fertilizer dose is the variable with the greatest impact on the magnitude of N2O emissions in coffee crops [47]. Therefore, it is important to establish the response of the emission in terms of the nitrogen dose used. Figure 4 shows small differences between each of the measurements, where the highest values were found in the small and medium plants compared to the values of the adult plants. This tendency is due to the small and medium plants receiving continuous irrigation, and their fertilizer and emission are concentrated in a smaller area (because they are in pots), whereas the adults were planted in soil in the Moorish greenhouse. In contrast, the adult plant is planted in the soil and receives less irrigation than the rest in the greenhouse.
Figure 5 shows the results of N2O–N fluxes in the two varieties of coffee measured. The highest emissions reported in 2019 were after one month of fertilizer application in July 2019, with N2O–N fluxes between 0.1–0.25 g/m2 h. The lowest measurement was in 2020, with values below 0.1 g/m2 h for both varieties experiencing no rain during those months. On the other hand, in 2021, the Los Santos zone experienced an atypical rainy period in March. Hence, the emissions were higher in that year than in 2020, reporting the highest emissions between 0.3–0.5 g/m2 h of N2O–N fluxes. Other studies show similar behaviors, where high N2O emissions have been found at high soil water content, depending on water-free pore space in the soil and water availability [48].
N2O–N fluxes after applying nitrogen fertilizer were unstable during the first days after fertilizer application, and were of a greater magnitude when physical mixture fertilizer was applied. Similar behavior has been observed in previous research [49], where emissions are estimated to decline with time after fertilizer application, reaching a baseline level independent of the amount applied. Regarding the compost addition as a soil amendment, it was found to have the lowest emissions during the experiment. Generally, in soil amendments, most of the nutrients are in an unavailable, organically bound form. Therefore, there is an uncertainty in the quantity of available N since the organic N is not directly available [50].
Nevertheless, the advantage of using organic soil amendments is that the release of plant-available nutrients from composts can be considerable over time. Furthermore, the frequency of fertilization can be reduced in the long term since nitrogen is stored in soil altogether in the organic form [51]. Studies imply that in soil amendments, soil organic carbon increased by 90% compared to soil amendments with chemical fertilizers, increasing the physical fertility of the soil and enhancing available K, P nutrients, and especially organic carbon, with positive effects on soil biota [52,53].
The geography in the Los Santos zone and the high latitude coffee production is due to the coffee being grown in a mountain area. If this practice could be replicated in another area, where, for example, fresh manure could be available for addition into the soil as a soil amendment, composted manure would have several advantages. For example, finished compost used in the fields is able to reduce the number of weed seeds that are able to grow, and it is low in pathogens and parasites [34]. Compost stabilizes the organic matter, and even if has a slow release of nutrients, it is recommended in some studies since it detrimentally decreases the emissions of N2O, as is shown in Figure 6 [54,55]. Concerning the pattern of the emission of N2O mentioned before, it is not linear, and shows that when the amount of nitrogen fertilizer applied to the coffee crop is increased at levels higher than the crop requirements, the emission of nitrous oxide also increases. The excess of nitrogen and its interaction with different conditions, such as soil moisture content, enhance the generation and subsequent release of N2O [56].
According to the National Meteorological Institute in Costa Rica (IMN), the Intergovernmental Panel on Climate Change (IPCC) standards, where 1% of the total N applied annually is advised for calculating the N2O emissions, should be taken into account [57]. For instance, in the coffee mill, the level of SNF consumption during 2019/2020 harvest was 953 kg/ha, with a contribution of 205 kg/N ha−1 y−1 [58], and for organic coffee pulp was 248 N kg ha−1 y−1 [19]. Therefore, direct N2O emissions from the coffee plants in the botanical garden were estimated as 5.013–10.1 Kg CO2 eq yr−1 and for the coffee plantations as between 487–990 Kg CO2-eq yr−1. If we compare these results, they do not differ from other studies, where they show, in general, total GHG emissions for Arabica coffee processing of 1.804 t CO2-eq yr−1 [59]. It has been estimated that a coffee plantation possesses 1.02 kg of CO2e/kg of green coffee [23].
Finally, the approach of the present study concerns an environmental assessment of the applied nitrogen fertilizer and its relationship with climate change. The long-term application of nitrogen fertilizer affects the nitrogen cycle and the microbiota in the soil. Therefore, the overuse of chemical fertilizer can harm soil quality and microbiota. Furthermore, the long-term application of chemical fertilizers can significantly reduce soil pH, which is closely associated with decreased bacterial diversity and significant changes in bacterial community composition, where compost could prevent this event due to the SNF [60].

4. Conclusions

This study attempted to estimate the N2O–N emission fluxes in a coffee mill in Costa Rica, by the measuring of punctual fertilization events during the coffee fertilization cycle and the effect of two types of fertilizers used in coffee plantations. The methodology developed in the botanical garden for the first measurements and the setup under controlled conditions were achieved and reflected in the field experiments in Costa Rica.
It was determined that the highest N2O emission events were found shortly after the fertilizer application, with a significant decrease from the third week after application. A negative relationship was found in terms of the amount of N2O emission flux and rainfall, where the fluxes increased after a rain event. It was determined that there is N2O emission even without nitrogen fertilizer application, although less than the other treatments. An increase in nitrous oxide emissions was also detected concerning the type of fertilizer applied. Physical mixture fertilizer showed higher emissions than chemical fertilizer. A recommendation would be to consider the year when the fertilizer is applied, to avoid the sudden burst of nitrous oxide when the rainy season in Costa Rica occurs. Compost (SA) showed low N2O emission in comparison with the synthetic fertilizers. Further research is suggested to observe the emissions of SA in the long term, to assure emission reduction in the plots by the usage of organic soil amendments. In addition, fertilizers could reduce the N-leaching losses and the contribution of N2O emissions in the long term, considering slow-release nitrogen or nitrification inhibitors. It is suggested to carry out this type of evaluation for periods longer than one year. Besides, continuous and simultaneous measurements for at least three different coffee plants per day could offer more robust data. Nitrous oxide emissions can be obtained in future assessments under the changing influence of climatic variables during the day, which usually differ between years and seasons.
Thus, we recommend to use these equations to estimate nitrous oxide emissions from fertilization in coffee cultivation in Costa Rica with a higher degree of confidence. In addition, it is advisable to investigate the effects of farming practices and management focused on the efficiency and use of nitrogen in coffee plantations, in order to gather more data and to understand the long-term effects and their relationships.

Author Contributions

Conceptualization: M.S.M.R., M.R.; methodology: M.R., M.S.M.R. and M.K.; validation: M.R., M.K. and M.S.M.R.; formal analysis: M.S.M.R., M.R.; investigation: M.S.M.R.; M.R. and M.K.; data curation: M.S.M.R., M.R.; writing—original draft preparation: M.S.M.R., M.R.; supervision: M.R., M.K., M.S.M.R.; project administration: M.R., M.K. All authors have read and agreed to the published version of the manuscript.

Funding

This work has been financed by the Coffee Mill Coopetarrazú R.L. in Costa Rica.

Institutional Review Board Statement

Not applicable.

Informed Consent Statement

Not applicable.

Acknowledgments

We gladly thank the personnel of Coopetarrazú R.L. and the Wilhelma-Zoo and botanical garden for giving us the space to perform the experiments in their commodities, and furthermore for providing the information necessary for the experiments and methodology. Moreover, we gladly thank Daniela Castro Herrera for reviewing the statistical analysis and calculations, the personnel laboratory assistances, students, and colleagues of the Institute for Sanitary Engineering, Water Quality and Solid Waste Management (ISWA) at the University of Stuttgart.

Conflicts of Interest

The authors declare no conflict of interest.

References

  1. Kelliher, F.M.; Reisinger, A.R.; Martin, R.J.; Harvey, M.J.; Price, S.J.; Sherlock, R.R. Measuring nitrous oxide emission rate from grazed pasture using Fourier-transform infrared spectroscopy in the noctumal boundary layer. Agric. For. Meteorol. 2002, 111, 29–38. [Google Scholar] [CrossRef]
  2. EPA. Overview of Greenhouse Gases. 2012. Available online: https://www.epa.gov/ghgemissions/overview-greenhouse-gases (accessed on 3 August 2018).
  3. Intergovernmental Panel on Climate Change. Summary for Policymakers. In Climate Change 2013—The Physical Science Basis: Working Group I Contribution to the Fifth Assessment Report of the Intergovernmental Panel on Climate Change; Cambridge University Press: Cambridge, UK, 2014; pp. 1–30. [Google Scholar] [CrossRef]
  4. IPNI. Agronomic Fact Sheets on Crop Nutrients: Nitrogen. 2005. Available online: https://www.ipni.net/publication/nutrifacts-na.nsf/0/E6EA88FF25BC684985257F07006E1B5D/$FILE/NutriFacts-NA-18.pdf (accessed on 23 October 2021).
  5. Hue, N.V.; Silva, J.A. Organic Soil Amendments for Sustainable Agriculture: Organic Sources of Nitrogen, Phosphorus, and Potassium. In Plant Nutrition in Hawaiss’s Soil for Tropical and Subtropical Agriculture; University of Hawaii: Honolulu, HI, USA, 2000; pp. 133–144. [Google Scholar]
  6. Feng, J.; Li, F.; Deng, A.; Feng, X.; Fang, F.; Zhang, W. Integrated assessment of the impact of enhanced-efficiency nitrogen fertilizer on N2O emission and crop yield. Agric. Ecosyst. Environ. 2016, 231, 218–228. [Google Scholar] [CrossRef]
  7. Bouwman, A.F. Direct emission of nitrous oxide from agricultural soils. Nutr. Cycl. Agroecosyst. 1996, 46, 53–70. [Google Scholar] [CrossRef]
  8. Nevison, C. Indirect N2O Emissions from Agriculture. In Good Practice Guidance and Uncertainty Management in National Greenhouse Gas Inventories (IPCC Guidelines); IGES: Geneva, Switzerland, 1998; pp. 381–397. [Google Scholar]
  9. Gillenwater, M.; Saarinen, K.; Ajavon, A.N. Precursors and Indirect. In IPCC 2006, 2006 IPCC Guidelines for National Greenhouse Gas Inventories, Prepared by the National Greenhouse Gas Inventories Programme; Eggleston, H.S., Buendia, L., Miwa, K., Ngara, T., Tanabe, K., Eds.; Institute for Global Environmental Strategies (IGES): Hayama, Japan, 2006. [Google Scholar]
  10. Smith, K.; Bouwman, L.; Braatz, B. N2O: Direct Emissions From Agricultural Soils. In Good Practice Guidance and Uncertainty Management in National Greenhouse Gas Inventories; Intergovernmental Panel on Climate Change: Kanagawa, Japan, 1999; pp. 361–380. [Google Scholar]
  11. Ehhalt, D.; Prather, M. Atmospheric Chemistry and Greenhouse Gases. In Climate Change 2001: The Scientific Basis 3rd Assesment Report of the Intergovernmental Panel on Climate Change; Pacific Northwest National Lab. (PNNL): Richland, WA, USA, 2001; pp. 239–287. Available online: http://scholar.google.com/scholar?hl=en&btnG=Search&q=intitle:Agriculture.+In+Climate+Change+2007:+Mitigation.+Contribution+of+Working+Group+III+to+the+Fourth+Assessment+Report+of+the+Intergovernmental+Panel+on+Climate+Change+[B.#0 (accessed on 29 September 2021).
  12. Wang, F.; Chen, S.; Zhang, K.Q.; Shen, S.Z.; Zhu-Barker, X. Impact of nitrogen fertilizer source on nitrous oxide (N2O) emissions from three different agricultural soils during freezing conditions. Toxicol. Environ. Chem. 2016, 98, 551–560. [Google Scholar] [CrossRef]
  13. Hergoualc’h, K.; Skiba, U.; Harmand, J.M.; Oliver, R. Processes responsible for the nitrous oxide emission from a Costa Rican Andosol under a coffee agroforestry plantation. Biol. Fertil. Soils 2007, 43, 787–795. [Google Scholar] [CrossRef]
  14. Stevens, R.J.; Laughlin, R.J. Measurement of nitrous oxide and di-nitrogen emissions from agricultural soils. Nutr. Cycl. Agroecosyst. 1998, 52, 131–139. [Google Scholar] [CrossRef]
  15. Rochette, P.; Eriksen-Hamel, N.S. Chamber Measurements of Soil Nitrous Oxide Flux: Are Absolute Values Reliable? Soil Sci. Soc. Am. J. 2008, 72, 331–342. [Google Scholar] [CrossRef]
  16. Cai, Z.; Laughlin, R.J.; Stevens, R.J. Nitrous oxide and dinitrogen emissions from soil under different water regimes and straw amendment. Chemosphere 2001, 42, 113–121. [Google Scholar] [CrossRef]
  17. Chalk, P.M.; Smith, C.J. Chemodenitrification. In Gaseous Loss of Nitrogen from Plant-Soil Systems; Springer: Dordrecht, The Netherlands, 1983; pp. 65–89. [Google Scholar] [CrossRef]
  18. Wang, C.; Amon, B.; Schulz, K.; Mehdi, B. Factors That Influence Nitrous Oxide Emissions from Agricultural Soils as Well as Their Representation in Simulation Models: A Review. Agronomy 2021, 11, 770. [Google Scholar] [CrossRef]
  19. Noponen, M.R.A.; Edwards-Jones, G.; Haggar, J.P.; Soto, G.; Attarzadeh, N.; Healey, J.R. Greenhouse gas emissions in coffee grown with differing input levels under conventional and organic management. Agric. Ecosyst. Environ. 2012, 151, 6–15. [Google Scholar] [CrossRef] [Green Version]
  20. Food And Agriculture Organization of the United Nations (FAO). Land Use Statistics and Indicators Statistics. Global, Regional and Country Trends; FAOSTAT Analytical Brief Series No 28; FAO: Rome, Italy, 2019. [Google Scholar]
  21. Goulding, K.; Jarvis, S.; Whitmore, A. Optimizing nutrient management for farm systems. Philos. Trans. R. Soc. B Biol. Sci. 2008, 363, 667–680. [Google Scholar] [CrossRef] [Green Version]
  22. Moldvaer, A. Coffee Obsession, 1st ed.; Dorling Kindersley Limited: London, UK, 2014. [Google Scholar]
  23. Nieters, A.; Grabs, J.; Jimenez, G.; Alpizar, W. NAMA Café Costa Rica: A Tool for Low Carbon Development. NAMA Facility Technical Support Unit on behalf of German Federal Ministry for the Environment, Nature Conservation, Building and Nuclear Safety (BMUB)/UK Department for Energy and Climate Change (DECC). Available online: http://www.namacafe.org/sites/default/files/files/NAMA_Facility_factsheet_Costa%20Rica.pdf (accessed on 7 December 2021).
  24. Insituto del Café de Costa Rica. Clima del Café–ICAFE. 2020. Available online: http://www.icafe.cr/sector-cafetalero/clima/?zona=LS (accessed on 3 October 2021).
  25. Vignola, R.; Watler, W.; Coto, K.P.; Céspedes, A.V. Ficha Técnica Cultivo de Café: Prácticas Efectivas Para la Reducción de Impactos por Eventos Climáticos en el Cultivo de Café en Costa Rica. Costa Rica. 2018. Available online: http://www.mag.go.cr/bibliotecavirtual/reduccion-impacto-por-eventos-climaticos/Informe-final-cafe.pdf (accessed on 16 September 2021).
  26. Chinchilla, M.; Mata, R.; Alvarado, A. Caracterización y Clasificación de Algunos Ultisoles de la Región de Los Santos, Talamanca, Costa Rica. Available online: https://revistas.ucr.ac.cr/index.php/agrocost/article/view/6687 (accessed on 7 December 2021).
  27. Bornemisza, E.; Segura, A.; Bertrand, B.; Rapidel, B. Café-América Centra! In Capitul03 Los Suelos Cafetaleros de América Central y su Fertilización; Desafíos de la Caficultura en Centroamérica; No. IICA-E11 12; IICA: San José, Costa Rica; PROMECAFE CIRAD: París, France, 1999; ISBN 92-9039-391-2. [Google Scholar]
  28. Viguera, B.; Alpízar, F.; Harvey, C.A.; Martínez-Rodríguez, M.R.; Saborío-Rodríguez, M. Climate change perceptions and adaptive responses of small-scale coffee farmers in Costa Rica|Percepciones de cambio climático y respuestas adaptativas de caficultores costarricenses de pequeña escala. Agron. Mesoam. 2019, 30, 333–351. [Google Scholar] [CrossRef] [Green Version]
  29. ICAFE. Informe Sobre La Actividad Cafetalera De Costa Rica, Heredia, Costa Rica. 2017. Available online: http://www.icafe.cr/wp-content/uploads/informacion_mercado/informes_actividad/anteriores/2017.pdf (accessed on 1 September 2021).
  30. VDI: Verein Deutscher Ingenieure. VDI 3475 Part 1: Emission Control Biological Waste Treatment Facilities Composting and Anaerobic Digestion Plant Capacities more than Approx. 6.000 Mg/a.; Beuth Verlag GmbH: Berlin, Germany, 2003. [Google Scholar]
  31. VDI: Verein Deutscher Ingenieure. VDI 3880: Olfactometry Static Sampling. Beuth Publishing Düsseldorf. 2011. Available online: www.vdi-richtlinien.de (accessed on 7 November 2021).
  32. Ruiz, M.S.M.; Reiser, M.; Kranert, M. Composting and Methane Emissions of Coffee By-Products. Atmosphere 2021, 12, 1153. [Google Scholar] [CrossRef]
  33. Pavelka, M.; Acosta, M.; Kiese, R.; Altimir, N.; Brümmer, C.; Crill, P.; Darenova, E.; Fuß, R.; Gielen, B.; Graf, A.; et al. Standardisation of chamber technique for CO2, N2O and CH4 fluxes measurements from terrestrial ecosystems. Int. Agrophys. 2018, 32, 569–587. [Google Scholar] [CrossRef]
  34. Blackshaw, R.E. Nitrogen Fertilizer, Manure, and Compost Effects on Weed Growth and Competition with Spring Wheat. Agron. J. 2005, 97, 1612–1621. [Google Scholar] [CrossRef] [Green Version]
  35. Cowan, N.J.; Famulari, D.; Levy, P.E.; Anderson, M.; Bell, M.J.; Rees, R.M.; Reay, D.S.; Skiba, U.M. An improved method for measuring soil N2O fluxes using a quantum cascade laser with a dynamic chamber. Eur. J. Soil Sci. 2014, 65, 643–652. [Google Scholar] [CrossRef] [Green Version]
  36. Gasmet. FTIR-Portable Multigas Analyzer. Available online: https://www.gasmet.com/products/category/portable-gas-analyzers/gt5000-terra/ (accessed on 30 September 2021).
  37. Pihlatie, M.; Christiansen, J.; Aaltonen, H.; Korhonen, J.; Nordbo, A.; Rasilo, T.; Benanti, G.; Giebels, M.; Helmy, M.; Sheehy, J.; et al. Comparison of static chambers to measure CH4 emissions from soils. Agric. For. Meteorol. 2013, 171–172, 124–136. [Google Scholar] [CrossRef] [Green Version]
  38. Food and Agriculture Organization of the United Nations. Estimating Greenhouse Gas Emissions in Agriculture. A Manual to Address Data Requirements for Developing Countries; Food and Agricultural Organization: Rome, Italy, 2015. [Google Scholar]
  39. Chinchilla, M.; Mata, R.; Alvarado, A. Caracterización Y Clasificación De Algunos Ultisoles. Agron. Costarric. 2011, 35, 59–81. [Google Scholar] [CrossRef]
  40. Mata, R.A.; Ramírez, J.E. Estudio de Caracterización de Suelos y su Relación con el Manejo del Cultivo de Café en la Provincia de Heredia; No. 633.7332 M425; Instituto del Café de Costa Rica: San José, Costa Rica, 1999. [Google Scholar]
  41. Cubero, D.; Vieira, M.J. Conferencia 70. In Abonos Orgánicos y Fertilizantes Químicos...¿Son Compatibles con la Agricultura? 1999, pp. 61–62. Available online: http://www.mag.go.cr/congreso_agronomico_xi/a50-6907-III_061.pdf (accessed on 24 September 2021).
  42. ŠImek, M.; Cooper, J.E. The influence of soil pH on denitrification: Progress towards the understanding of this interaction over the last 50 years. Eur. J. Soil Sci. 2002, 53, 345–354. [Google Scholar] [CrossRef]
  43. Shaaban, M.; Wu, Y.; Khalid, M.S.; Peng, Q.-A.; Xu, X.; Wu, L.; Younas, A.; Bashir, S.; Mo, Y.; Lin, S.; et al. Reduction in soil N2O emissions by pH manipulation and enhanced nosZ gene transcription under different water regimes. Environ. Pollut. 2018, 235, 625–631. [Google Scholar] [CrossRef] [PubMed]
  44. Wrage, N.; Velthof, G.L.; van Beusichem, M.L.; Oenema, O. Role of nitrifier denitrification in the production of nitrous oxide. Soil Biol. Biochem. 2001, 33, 1723–1732. [Google Scholar] [CrossRef]
  45. Oertel, C.; Matschullat, J.; Zurba, K.; Zimmermann, F.; Erasmi, S. Greenhouse gas emissions from soils—A review. Geochemistry 2016, 76, 327–352. [Google Scholar] [CrossRef] [Green Version]
  46. Buchkina, N.P.; Rizhiya, E.Y.; Pavlik, S.v.; Balashov, E.V. Soil Physical Properties and Nitrous Oxide Emission from Agricultural Soils. Adv. Agrophys. Res. 2013, 193–220. [Google Scholar] [CrossRef] [Green Version]
  47. Oktarita, S.; Hergoualc’H, K.; Anwar, S.; Verchot, L.v. Substantial N2O emissions from peat decomposition and N fertilization in an oil palm plantation exacerbated by hotspots. Environ. Res. Lett. 2017, 12, 104007. [Google Scholar] [CrossRef]
  48. Arias-Navarro, C.; Diaz-Pines, E.; Klatt, S.; Brandt, P.; Rufino, M.C.; Butterbach-Bahl, K.; Verchot, L.V. Spatial variability of soil N2O and CO2 fluxes in different topographic positions in a tropical montane forest in Kenya. J. Geophys. Res. Biogeosci. 2017, 122, 514–527. [Google Scholar] [CrossRef]
  49. Eichner, M.J. Nitrous Oxide Emissions from Fertilized Soils: Summary of Available Data. J. Environ. Qual. 1990, 19, 272–280. [Google Scholar] [CrossRef]
  50. Harrison, R.B. Composting and Formation of Humic Substances; Jørgensen, S.E., Fath, B.D., Eds.; Academic Press: Oxford, UK, 2008; pp. 713–719. ISBN 9780080454054. [Google Scholar] [CrossRef]
  51. Gilbert, J.; Ricci-Jurgensen, M.; Ramola, A. Benefits of Compost and Anaerobic Digestate When Applied to Soil. Report 2. 2020, pp. 68–70. Available online: https://www.iswa.org/knowledge-base/benefits-of-compost-and-anaerobic-digestate-when-applied-to-soil/?v=1ee0bf89c5d1 (accessed on 10 September 2021).
  52. Diacono, M.; Montemurro, F. Long-term effects of organic amendments on soil fertility. A review. Agron. Sustain. Dev. 2010, 30, 401–422. [Google Scholar] [CrossRef] [Green Version]
  53. Ros, M.; Klammer, S.; Knapp, B.; Aichberger, K.; Insam, H. Long-term effects of compost amendment of soil on functional and structural diversity and microbial activity. Soil Use Manag. 2006, 22, 209–218. [Google Scholar] [CrossRef]
  54. Larney, F.J.; Hao, X. A review of composting as a management alternative for beef cattle feedlot manure in southern Alberta, Canada. Bioresour. Technol. 2007, 98, 3221–3227. [Google Scholar] [CrossRef] [PubMed]
  55. Li, P.; Lang, M.; Li, C.; Hao, X. Nitrous oxide and carbon dioxide emissions from soils amended with compost and manure from cattle fed diets containing wheat dried distillers’ grains with solubles. Can. J. Soil Sci. 2016, 97, 522–531. [Google Scholar] [CrossRef] [Green Version]
  56. Hoben, J.P.; Gehl, R.J.; Millar, N.; Grace, P.R.; Robertson, G.P. Nonlinear nitrous oxide (N2O) response to nitrogen fertilizer in on-farm corn crops of the US Midwest. Glob. Chang. Biol. 2010, 17, 1140–1152. [Google Scholar] [CrossRef]
  57. Montenegro, J.; Herrera, J. Emisión del óxido nitroso (N2O) en el sistema de producción café sin sombra en Costa Rica. Tóp. Metereol. Oceanogr. IMN 2013, 12, 22–34. [Google Scholar] [CrossRef] [Green Version]
  58. Martinez Rayo, J.L. Manual Técnico: Para el Manejo de la Fertilizacion de Suelos Cafetaleros. 2012. Available online: https://jorgemartinezrayo.files.wordpress.com/2013/07/manual-de-fertilidad-de-suelos.pdf (accessed on 7 December 2021).
  59. Harsono, S.S.; Wibowo, R.K.K.; Supriyanto, E. Energy Balance and Green House Gas Emisson on Smallholder Java Coffee Production at Slopes Ijen Raung Plateau of Indonesia. J. Ecol. Eng. 2021, 22, 271–283. [Google Scholar] [CrossRef]
  60. Wu, L.; Jiang, Y.; Zhao, F.; He, X.; Liu, H.; Yu, K. Increased organic fertilizer application and reduced chemical fertilizer application affect the soil properties and bacterial communities of grape rhizosphere soil. Sci. Rep. 2020, 10, 9568. [Google Scholar] [CrossRef] [PubMed]
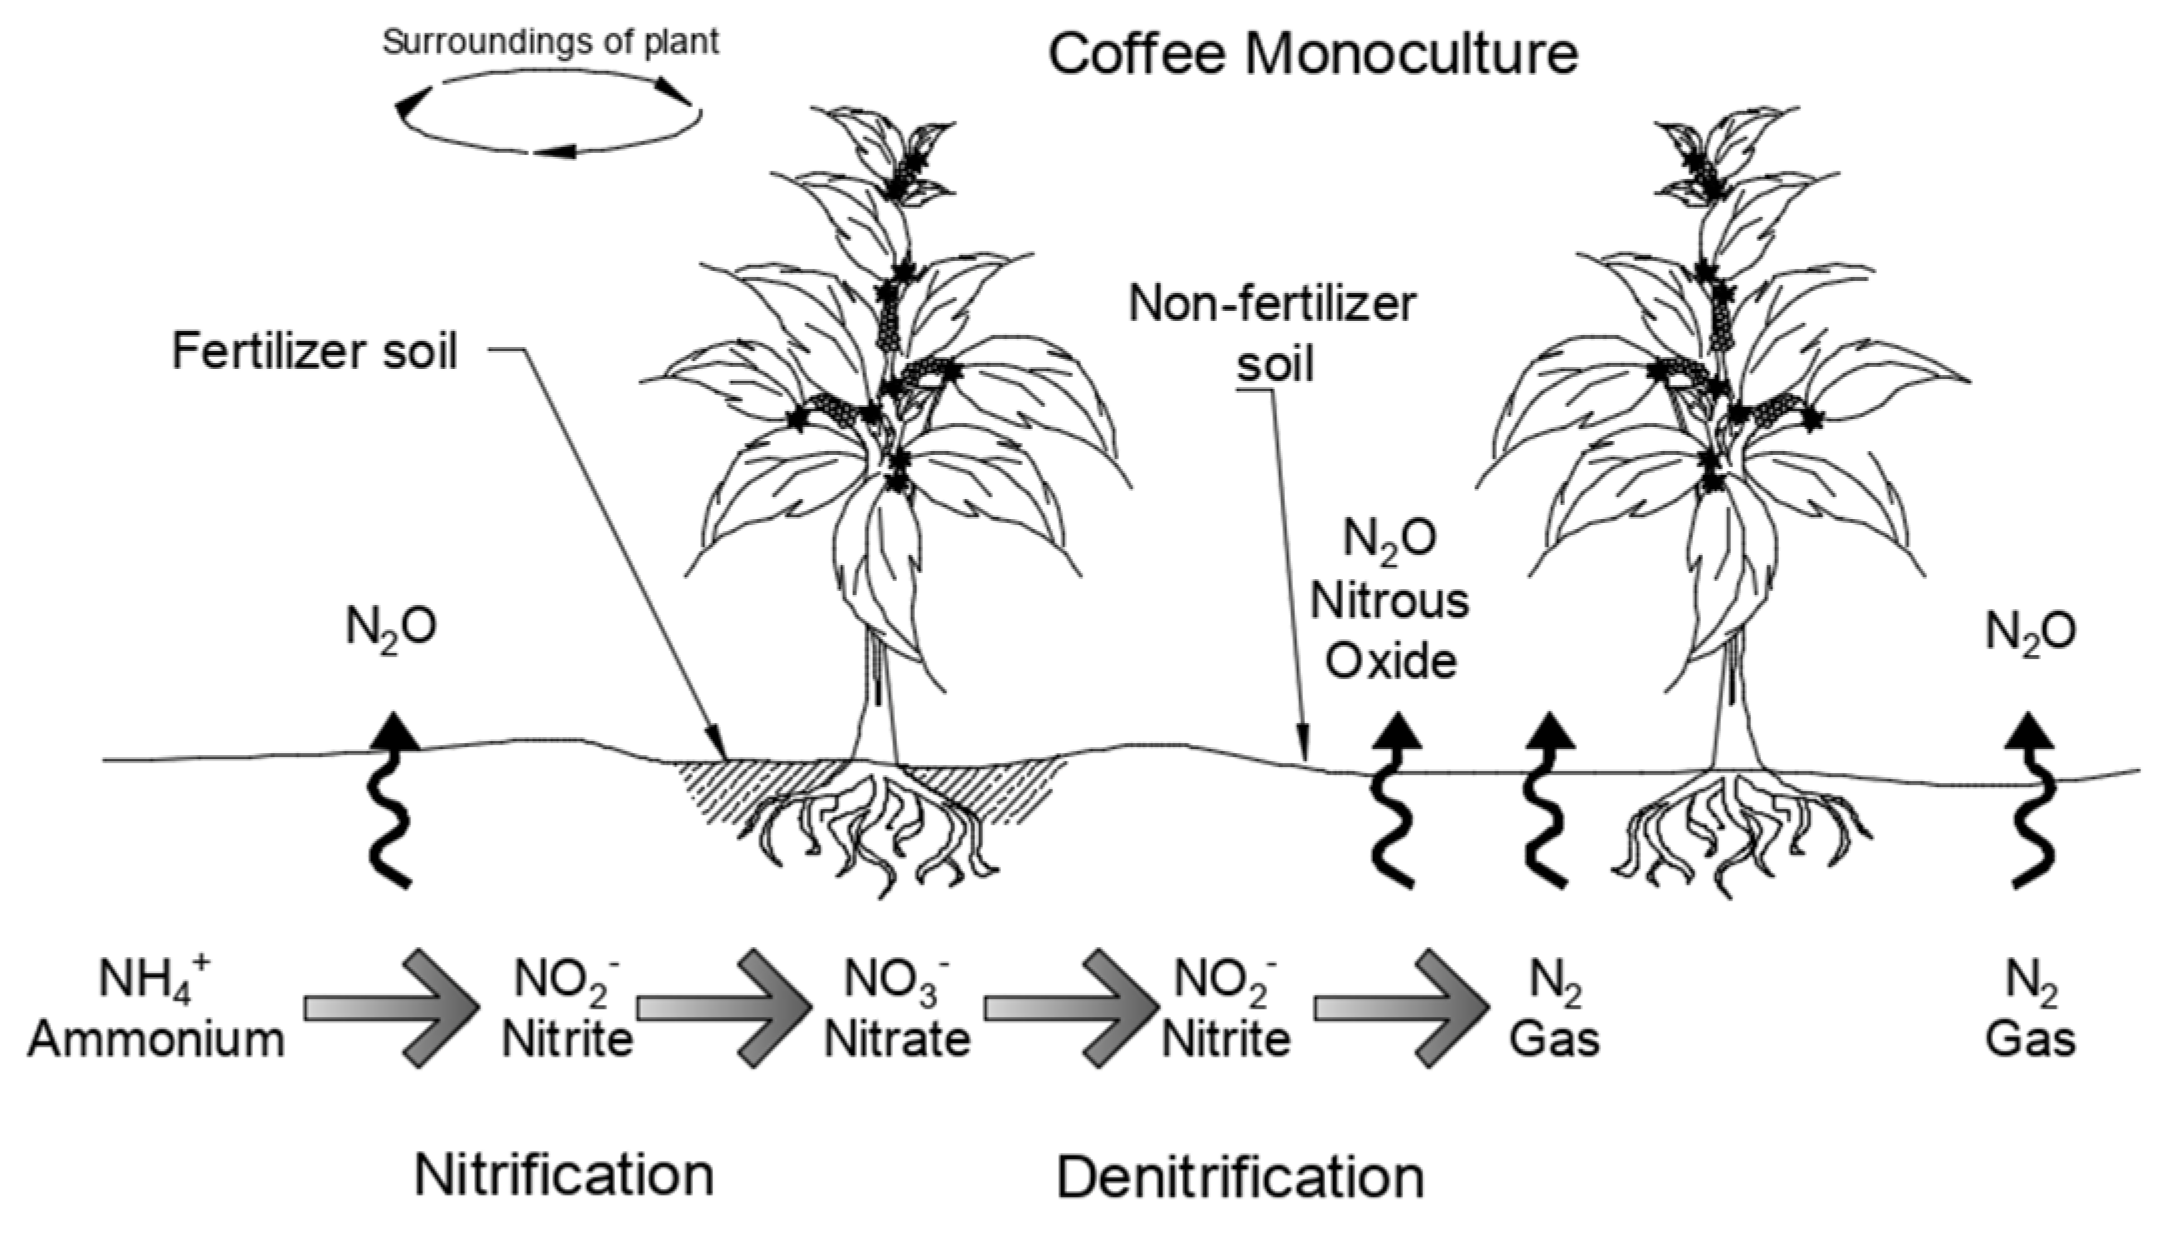
Figure 1. Nitrogen transformation within the soil profile and N2O emissions in a coffee monoculture.
Atmosphere 12 01656 g001
Figure 2. (A): Experimental setup in the botanical garden for small–medium-sized plants. (B): Measurements in coffee plantations and botanical garden for adult plants using an open dynamic chamber.
Atmosphere 12 01656 g002
Figure 3. Chamber setup for the field experiments in the fertilized area.
Atmosphere 12 01656 g003
Figure 4. Boxchart summary of nitrous oxide fluxes in the botanical garden. SC: Small-sized coffee plant; MNF: small-sized coffee plant without fertilizer; MF: small-sized coffee plant with fertilizer; MBC: medium-sized plant (bottom); MTC: medium-sized coffee plant (top); BF adult-sized coffee plant with fertilizer; error bars represent the standard error of the values (n = 6).
Atmosphere 12 01656 g004
Figure 5. Nitrous oxide emissions in Geisha and Catuai. Values are the means. Error bars represent the standard error of the mean (n = 2).
Atmosphere 12 01656 g005
Figure 6. Nitrous oxide emission fluxes in a field experiment. SA: Coffee byproducts compost (soil amendment); F1: fertilizer 1; F2: fertilizer 2; TC: control. Values are the means. Error bars represent the standard error of the mean (n = 2). Barplot for one factor in R for all the treatments with the mean values and the standard error of the means.
Atmosphere 12 01656 g006
Table 1. Soil analysis for coffee plantations.
ParametersUnitsA*B**C***
pHH2O5.54.95.0
Aciditycmol(+)/L0.141.380.50
Ca8.134.966.79
Mg3.041.332.75
K2.270.561.85
CEC13.588.2311.89
AS%1174
Pmg/L1214
Zn7.43.26.3
Cu8128
Fe312312242
Mn193985
ECmS/cm0.40.20.4
C%3.632.612.93
N0.350.230.27
C/NRatio10.411.310.9
A*: soil control area; B**: soil control area without pesticides; C***: soil with 40% fewer N-based fertilizers and compost application.
Table 2. Fertilization, doses, and types of fertilizers considered.
Fertilization Period Costa Rica 2019–2020
22 June 201928 August 201927 October 201931 May 202020 August 2020
Formula/Amount per plant
17 (N)-6 (P2O5)-18 (K2O)-5 (MgO)-0.2(B)-0.1(Z)-1.6(S)17(N)-6(P2O5)-18(K2O)-5 (MgO)-0.2(B)-0,1(Z)-1.6(S)20(N)-8(MgO)-11(Ca)18 (N)-5-(P2O5)18 (K2O)-0.2(B)-7.3(S)17 (N)-6(P2O5)-18 (K2O)-5(Mg)-0.2(B)-0.1(Z)-1.6(S)
Amount added: 90 g/plant
Percentage of Fertilizer Used in Nursery Greenhouse in the Botanical Garden
ComponentWeek 5 July 2019vol in %Week 9 July 2019vol in %Volume Mixture for Small-Sized Plant (mL)Volume Mixture for Medium-Sized Plant (mL)
Nitrogen (N)2015100200
Potassium (K2O)2020
Phosphorus (P2O5)2025
Fertilizer Assay—04.2021 in Costa Rica
Chemical Fertilizer (F1)Physical Mixture Fertilizer (F2)Soil Amendment (SA)—Compost Coffee Byproducts
17 (N)-6(P2O5)-18 (K2O)-5(Mg)-0.2(B)-0.1(Z)-1.6(S)18(N)-5(P2O5)-15(K2O)-7.3(S)-6(MgO)-0.2(B)1.37(N)-0.46(P2O5)-3.19(K2O)-0.35(MgO)
Amount added: 90 g/plantAmount added: 2 kg/plant
Publisher’s Note: MDPI stays neutral with regard to jurisdictional claims in published maps and institutional affiliations.