Article

Effective Mainstreaming of Agricultural Emissions into Climate Action Agenda: The Case of Institutions and Smallholder Dairy Production Systems, Western Kenya

by
Tom Volenzo Elijah
1,*,
Rachel Makungo
1 and
Georges-Ivo Ekosse
2
1
Department of Earth Sciences, Faculty of Science, Engineering and Agriculture, University of Venda, Private Bag x5050, Thohoyandou 0950, South Africa
2
Directorate of Research and Innovation, University of Venda, Private Bag x5050, Thohoyandou 0950, South Africa
*
Author to whom correspondence should be addressed.
Atmosphere 2021, 12(11), 1507; https://doi.org/10.3390/atmos12111507
Submission received: 23 September 2021 / Revised: 27 October 2021 / Accepted: 28 October 2021 / Published: 16 November 2021
(This article belongs to the Special Issue Agricultural Greenhouse Gas Emissions)

Abstract

:
Small-scale farming production systems are integral drivers of global sustainability challenges and the climate crisis as well as a solution space for the transition to climate compatible development. However, mainstreaming agricultural emissions into a climate action agenda through integrative approaches, such as Climate Smart Agriculture (CSA), largely reinforces adaptation–mitigation dualism and pays inadequate attention to institutions’ linkage on the generation of externalities, such as Greenhouse Gas (GHG) emissions. This may undermine the effectiveness of local–global climate risk management initiatives. Literature data and a survey of small-scale farmers’ dairy feeding strategies were used in the simulation of GHG emissions. The effect of price risks on ecoefficiencies or the amount of GHG emissions per unit of produced milk is framed as a proxy for institutional feedbacks on GHG emissions and effect at scale. This case study on small-scale dairy farmers in western Kenya illustrates the effect of local-level and sectoral-level institutional constraints, such as market risks on decision making, on GHG emissions and the effectiveness of climate action. The findings suggest that price risks are significant in incentivising the adoption of CSA technologies. Since institutional interactions influence the choice of individual farmer management actions in adaptation planning, they significantly contribute to GHG spillover at scale. This can be visualised in terms of the nexus between low or non-existent dairy feeding strategies, low herd productivity, and net higher methane emissions per unit of produced milk in a dairy value chain. The use of the Sustainable Food Value Chain (SFVC) analytical lens could mediate the identification of binding constraints, foster organisational and policy coherence, as well as broker the effective mainstreaming of agricultural emissions into local–global climate change risk management initiatives. Market risks thus provide a systematic and holistic lens for assessing alternative carbon transitions, climate financing, adaptation–mitigation dualism, and the related risk of maladaptation, all of which are integral in the planning and implementation of effective climate action initiatives.

1. Introduction

Greenhouse gas (GHG) emissions create common pool problems that transcend geographical boundaries and political and economic agents [1]. As passive flows, GHGs impact the occurrence and magnitude of extreme disaster events, i.e., droughts and floods [2,3]. This undermines the realisation of sustainable development objectives across nations [4], as well as amplifies the vulnerability of individuals and communities to already existing and new disaster risks [5]. The increased risks and vulnerability are reflected in the increased cost of mitigating climate-related disasters, such as droughts [6,7], as well increased need for adaptation among already vulnerable people [8]. However, economic instruments, such as carbon taxes [9], have largely failed to achieve target reductions in GHG emissions [10,11]. This suggests the need for innovative alternative transitions [11,12], as well as effective multilevel environmental governance systems [1]. Some of the transformative approaches towards effectiveness include addressing adaptation–mitigation dualism [8]. Implicitly, effective transitions largely revolve around risk perception and incentives [12].
As part of a cooperative effort to mitigate global warming and adjust to climate change, countries document their plans to reduce emissions and/or sequester carbon as Nationally Determined Contributions (NDCs). This follows the 2015 United Nations Framework Convention on Climate Change (UNFCCC) climate agreement, herein referred to as the Paris Climate Agreement (PAAC). In accordance with the PAAC, NDCs communicate progress made, as well as resource gaps needed to meet the set ambitions [6]. NDCs signal the global resolve to adjust to emerging climate change-related risks while taking advantage of embedded opportunities, building better and addressing underlying socio-economic drivers that predispose humanity to disaster risks [6,13,14]. Such a strategy is predicated on voluntary collective action to halve current emission levels by 2050 and stabilise global climate [6]. Intuitively, the achievement of carbon neutral trajectories by 2050 [6] is underpinned by collective action and frameworks that identify as well as address interlinked Social-ecological System (SES) challenges [9,15].
Among other measures, this encompasses changes in processes, practices, structures, and institutions at an individual, organisational, and technological level [8,9]. Technological innovations, institutional and behavioural changes, and responsive social systems influence effectiveness in carbon capture and storage initiatives [16]. This highlights the importance of local contexts and aspirations in sustainability initiatives [15,17,18,19]. Local contexts increasingly provide opportunities for learning, innovation, and transformation.
Broadening climate action areas has great potential for immediate scaling mitigation and the closing of GHG emission gaps [5,20,21,22]. Promoting climate friendly policies at a community level is especially critical in reducing emission gaps [23]. Land use sectors [7,9], and food systems in particular, have been identified as critical in carbon transitions and capturing feedbacks [24]. In particular, Agriculture, Forestry, and Land Use (AFOLU), which accounts for at least 23% of global emissions [7,25,26], has emerged as a pivotal sector for intervention. AFOLU is thus expected to play a critical role in NDCs, as well as the multiple Sustainable Development Goals [27,28]. Though the cumulative contribution of small-holder farmers on GHG emissions is potentially significant, it is not prioritised in carbon transition initiatives.
A risk chain can be visualised in terms of shocks, internal and external drivers, their management, and outcomes [29]. This is relevant to understanding the linkage of management practices, GHG emissions, and the design of effective mitigation practices [24]. The logic has direct bearing on maladaptive practices in Agriculture, Forestry, and Land Use (AFOLU), which directly account for about 23% of the annual global emissions. Since maladaptive practices in AFOLU could exacerbate GHG effect [7], they emerge as a critical sector in climate action. Maladaptation increases the predisposition of ecosystems, economic activities, and social groups to secondary risks [30].
Decision making plays a significant role in global initiatives such as GHG emissions mitigation initiatives [7,9,31]. It is particularly critical in land use-based adaptation planning in developing countries where small-scale production agriculture is the main economic and livelihood activity [32]. The potential impact of small-scale farmer production systems on global resource use, environmental services, food security, and environmental externalities is particularly significant in sustainability initiatives [30].
Institutional dimensions, such as financing and market power, are critical in the upscaling of eco-efficient agricultural value chains and the mainstreaming of agricultural emissions into a global climate action agenda [33]. This underscores the need to capture institutional and economic processes and incentive systems for the management of externalities [34]. The role of institutions in the integration of adaptation and mitigation pathways, in particular, requires nuanced attention [35]. A focus on institutional interactions, such as price risks, is posited to play a transformative role in global initiatives, such as the green fund and climate adaptation fund. However, nuanced analysis of institutional interactions on shifting vulnerabilities and the amplification of GHG effect has not been a focus of most policy and research discourses.
Agricultural systems have the potential to narrow GHG emission gaps, play a significant role in NDCs, as well as address adaptation–mitigation dualism [26]. Exploiting this potential is invariably through CSA technologies. CSA approaches enhance synergies between productivity, resilience, and mitigation objectives [36]. Formal and informal institutional arrangements are known to mediate most of the GHG mitigation policy objectives [32]. Paucity of knowledge on the interaction between local level decision making and adaptation governance at global level [8] however exist. For instance, though some studies have analysed the role of risk in adoption of adaptation technologies e.g., [37], there is paucity of knowledge on how risk mediate social costs such as GHG emissions during adaptation.
Effective local responses [6,7,21], as well as global GHG emission mitigation strategies [38,39], encompass increased policy attention on local-level constraints that hinder the integration of international decisions into local climate change mitigation. They also include a focus on the role of incentives and innovative climate financing to scale up innovations [5,30]. Addressing the risk of maladaptation [5,30,40] is equally an urgent research and policy problem area [30].
Maladaptation occurs when adaptation action/ investment increases vulnerability of systems, sectors, or social groups to other risks. The bearing of risks by individuals and communities who are not party to their production, referred to as shifting vulnerabilities [30] is particularly given low attention. The article assesses and adopt the interplay between price risks and methane emissions in dairy cattle feeding as an innovative lens for effective local-global climate action initiatives. An illustration is made through a case study from western Kenya. The analytical lens could inform policy, research, and practice on the integration of shifting vulnerabilities and optimization of adaptation-mitigation synergies.
The novelty of this study lies in its ability to integrate the interplay of socio-economic and environmental dimensions in climate governance. This is one of the existing gaps in the narrowly focused carbon transition discourses. Further, it addresses intertwined market and production risk. Integrating the intertwined risk lenses is integral to the operationalisation of broader adaptation planning frameworks [40]. In essence, the analytical framework suggested herein has the potential to enhance the design and implementation of alternative carbon transitions and inclusive climate financing interventions for resource-constrained small-scale farmers, as well as advance the mainstreaming of agricultural emissions into global GHG mitigation initiatives. In exploring this relationship, we sought to answer the following questions:
  • Is local decision making at microlevel in smallholder farmer agricultural production critical to the effectiveness of existing local–global GHG mitigation strategies?
  • Do price risks have an influence on environmental footprints, such as methane emissions?
Following the introduction, Section 2 provides the background to the study. Section 3 gives the data collection and analysis methods, while Section 4 provides the results. Section 5 discusses the findings and concluding remarks.

2. Background of the Study

2.1. Adaptation–Mitigation Dualism

Though external and internal drivers are responsible for the adoption and diffusion of adaptation and mitigation polices [18,19], there is a lack of a commonly agreed core goal [41,42]. This tends to wrongly frame adaptation as a local initiative [19], hence low consideration for spillovers, such as GHG emissions [43,44]. Until recently, policy framing has considered adaptation as a local disaster reduction response. Accordingly, most climate financing focuses on mitigation at the expense of adaptation [45]. This underscores the need to address the simplistic dualism between adaptation and mitigation [8]. Several reasons support this position. Foremost is the risk of maladaptation [30,40] and increased evidence of spillover effect from adaptation across geographical jurisdictions [46]. This is underpinned by a growing concern that adaptation–mitigation dualism undermines resilience objectives [8,47].
Given that climate change amplifies the exposure and sensitivity of humans and ecosystems to harm, it increases the importance of adaptation action [8,47]. Importantly, climate crisis disproportionately impacts resource-constrained vulnerable segments, such as small-scale farmers [8]. This observation is critical in developing nations where the dominant small-scale farming production systems have the potential to deliver about 21–40% of the direct emissions mitigation targets [32]. This partly explains the increasing focus by developing nations on adaptation–mitigation co-benefits to meet their NDC ambitions [28]. Specifically, the lagged relationship between GHG emissions and current and future impacts being evident calls for timely attention on adaptation [8].
Local–extra level institutions are critical in climate action initiatives in general and adaptation planning [18,19]. In most cases, extra local institutions influence carbon transition visions or lock-ins [48]. Lock-ins in turn inform and justify the technological, institutional, policy, and behavioural choices [49,50]. The effect of lock-ins is thus multifaceted. Firstly, they could undermine innovation and bias policy choice efforts on generic yet locally irrelevant alternatives. Secondly, institutional lock-ins by default may overlook critical transition pathways that provide opportunity for widespread upscaling of GHG mitigation. Finally, institutional lock-ins may constrain individual capacity to adopt management choices that positively impact effectiveness in climate action. The understanding of institutional–human behaviour interplay [49] is thus critical in overcoming lock-ins and fostering alternative innovative decarbonisation trajectories [50].

2.2. Risk, Institutions, Micro-Level Decision Making, and Environmental Externalities

Institutions are formal and informal mechanisms that mediate the behaviour of various agents in an economic system [51]. Institutions influence access to resources and markets, shape (dis)incentives, as well act as channels for external interventions within which individual and collective action can be realised [18]. Institutional interplay is thus critical in the planning and implementation of effective climate interventions [52], more so the integration and scaling up of CSA pillars [53,54], as well as policy coherence [2]. According to [2], institutions either incentivise or constrain the primary agents, such as small-scale farmers and the production of environmental goods and services.
Policy coherence refers to the extent to which a suite of selected policy options and incentives converge to impact effectiveness [55]. Implicitly, policy coherence mediates the optimisation of synergies and co-benefits in climate action [45]. Since adaptation is a decision making process [56], there is need to appreciate the influence of incentive system on farmer decision making and its impact on environmental spill overs [57]. Key among this is the effect of institutional fabric on risk [34]. Market prices (risks) are among the most critical determinants in climate compatible technologies uptake [58,59,60]. Risk be critical in livestock production on the account that they are major drivers of environmental footprints [61].
Risk describes economic, legislative, climatic, and social dynamics that lower profits or increase expenses [62,63]. Accordingly, exploring the linkage between institutions, risk and GHG emissions is critical in search for alternative carbon transitions. In agriculture, the interaction between market risks and environmental spillovers is more often framed in terms of income and consumption smoothening strategies [64]. In livestock production for instance, resource poor farmers tend to stock hardy breeds that dependent on locally available forages other than marketed concentrates [65]. Evidently, resource constraints have the potential to limit farmer adaptive capacity to adopt alternative technologies that mitigate pool problem, such as CH4. In ruminant livestock, the relationship is evidenced by low uptake of technologies that reduce emissions [66].

2.3. Agricultural Emissions: The Case of the Livestock Subsector

Food systems are the largest drivers of global environmental change [7]. In particular, the role of livestock in livelihoods, income and nutrition objectives [67], as well as its centrality in adaptation for communities under changing climate [68] increase its relevance in food transformation. As a key driver of environmental footprints [69], livestock produce most of the GHG emissions in AFOLU [68,69]. Ruminant livestock in particular account for about 44% of human activity related GHG emissions [70,71]. Most of the GHG emissions from livestock come as methane (CH4), a highly potent global warming GHG [72]. Accordingly, ruminant livestock provide opportunities for rapid reduction in CH4 emissions [20,72]. They are also critical analytical lens for innovative scaling of local contexts into adaptation and mitigation planning [73]. Ruminant cattle in general, and the dairy sector value chain lends itself to scaling, replication, analytical and conceptual innovation.

2.4. The Case of Resource-Constrained Farmers, Western Kenya

AFOLU related sectors are associated with about 70% of GHG emissions in Kenya. About 90% of these emissions is attributed to livestock [74]. The GHG emissions are expected to rise from 73 million tons of carbon dioxide equivalent (Mt CO2-eq) in 2010 to 143 MtCO2-eq in 2030. At less than 0.01% of global emissions, Kenya’s share in global emission generations is negligible [75]. Nonetheless, Kenya intends to increase the share of emissions from agriculture by about 5% by 2030. About 1.3 Mt CO2-eq of the 100 Mt CO2-eq is projected to be generated from the agricultural sector.
The significance of the livestock subsector in Kenya is underscored by the dominance of small-scale farmers, who account for about 73% of all marketed milk [76]. Agricultural systems and the livestock subsector are thus critical in the pursuit of Kenya’s NDC ambitions [75]. Kenya’s NDCs largely focus on low-carbon policies to pursue national and agricultural development objectives [77]. Though such policies are consistent with external coherence and integration principles, they lack a comprehensive cross-sectoral strategy and overarching goal in managing environmental externalities. This is compounded by a lack of expertise for planning specific risk assessment at a local level [74].
Implicitly, most policies are characterised by inadequate understanding of the interplay between risk lenses in land use and the potential outcomes at local and extra-local levels [78]. For example, though innovative instruments, i.e., PES, have the potential to reduce GHG emissions [59], most of such projects and programs on climate change adaptation and mitigation are donor-driven with a tendency for duplication [79]. Duplication tends to undermine coherence and effectiveness [80].
The dairy subsector in Kenya is inefficient and characterised by high production and price risks. Such risks are amplified by climate change risks [81], as well as institutional constraints. For instance, the official milk marketing value chain is controlled by five of the 23 milk processors. The five processors represent about 80% of the milk value chain [82]. The oligopolistic market structure tends to compound market and price risks as evidenced through collusion tendencies (farmgate prices do not shift upwards during drought cycles, while during the rainfall season the prices often fall), which is in juxtaposition with the law of supply and demand. Apparently, extreme climatic events significantly increase price risks, hence the vulnerability of the poor smallholder farmers to financial risks [81]. The institutional reach in the smallholder dairy sector in Western Kenya is particularly low. For instance, none of the 23 processors and only a few of the 47 cooling plants are found in the Western Kenya counties of Kakamega and Bungoma [82].
Though vertical integration could address credit, input, and processing capacity constraints [65], policy interventions in the dairy subsector have been biased towards physical infrastructural development [83], i.e., construction of small scale milk collection and cooling plants. To a large extent, such interventions have failed to address price risks in the long run. The evident lack of policy coherence drives methane emission risks [81]. It also amplifies ecological threats to land, soil, water, and biodiversity [83].

2.5. Effectiveness Lens in Adaptation and Mitigation

Globally, policy response to climate change crisis has mainly been through adaptation and mitigation strategies [45]. Accordingly, effectiveness has emerged as critical to adaptation and mitigation planning [84]. Though effectiveness could be qualified on the basis of spatial and temporal metrics, externalities, as well the extent of synergy achieved between individual and collective action, it generally refers to the ability to achieve expressed objectives [85]. In policy analysis, effectiveness invariably connote the extent to which any given policy instrument and availed resources contribute to attainment of a specific policy goal [86].
The analytical lens on the effectiveness of policy effort focuses both on intended and unintended effects or implementation deficit as well as policy coherence or the extent to which vertical and horizontal integration is attained [87]. Intuitively, effectiveness examines the extent of interplay between local interests and institutions in resolving the fundamental drivers of the problem [5,30]. The definition of adaptation and mitigation implicitly provides the metrics for assessing the effectiveness of respective climate policy objectives. While mitigation focuses on technological, institutional, and behavioural actions that curtail the magnitude of GHG emissions, adaptation refers to preparedness and responses to consequences of climate change that take advantage of opportunities therein [88].
Externalities such as GHGs represent social costs that are allocated across time and geographical boundaries, hence shared responsibility for their mitigation [89]. This underscores the common but differentiated principles in global climate policy [13]. Implicitly, spillover systems and GHG emissions provide lenses for the assessment of effectiveness in socio-ecological system interplays at local scale and the implementation of development initiatives that do not compromise the needs of future generations [1,2,3,7].

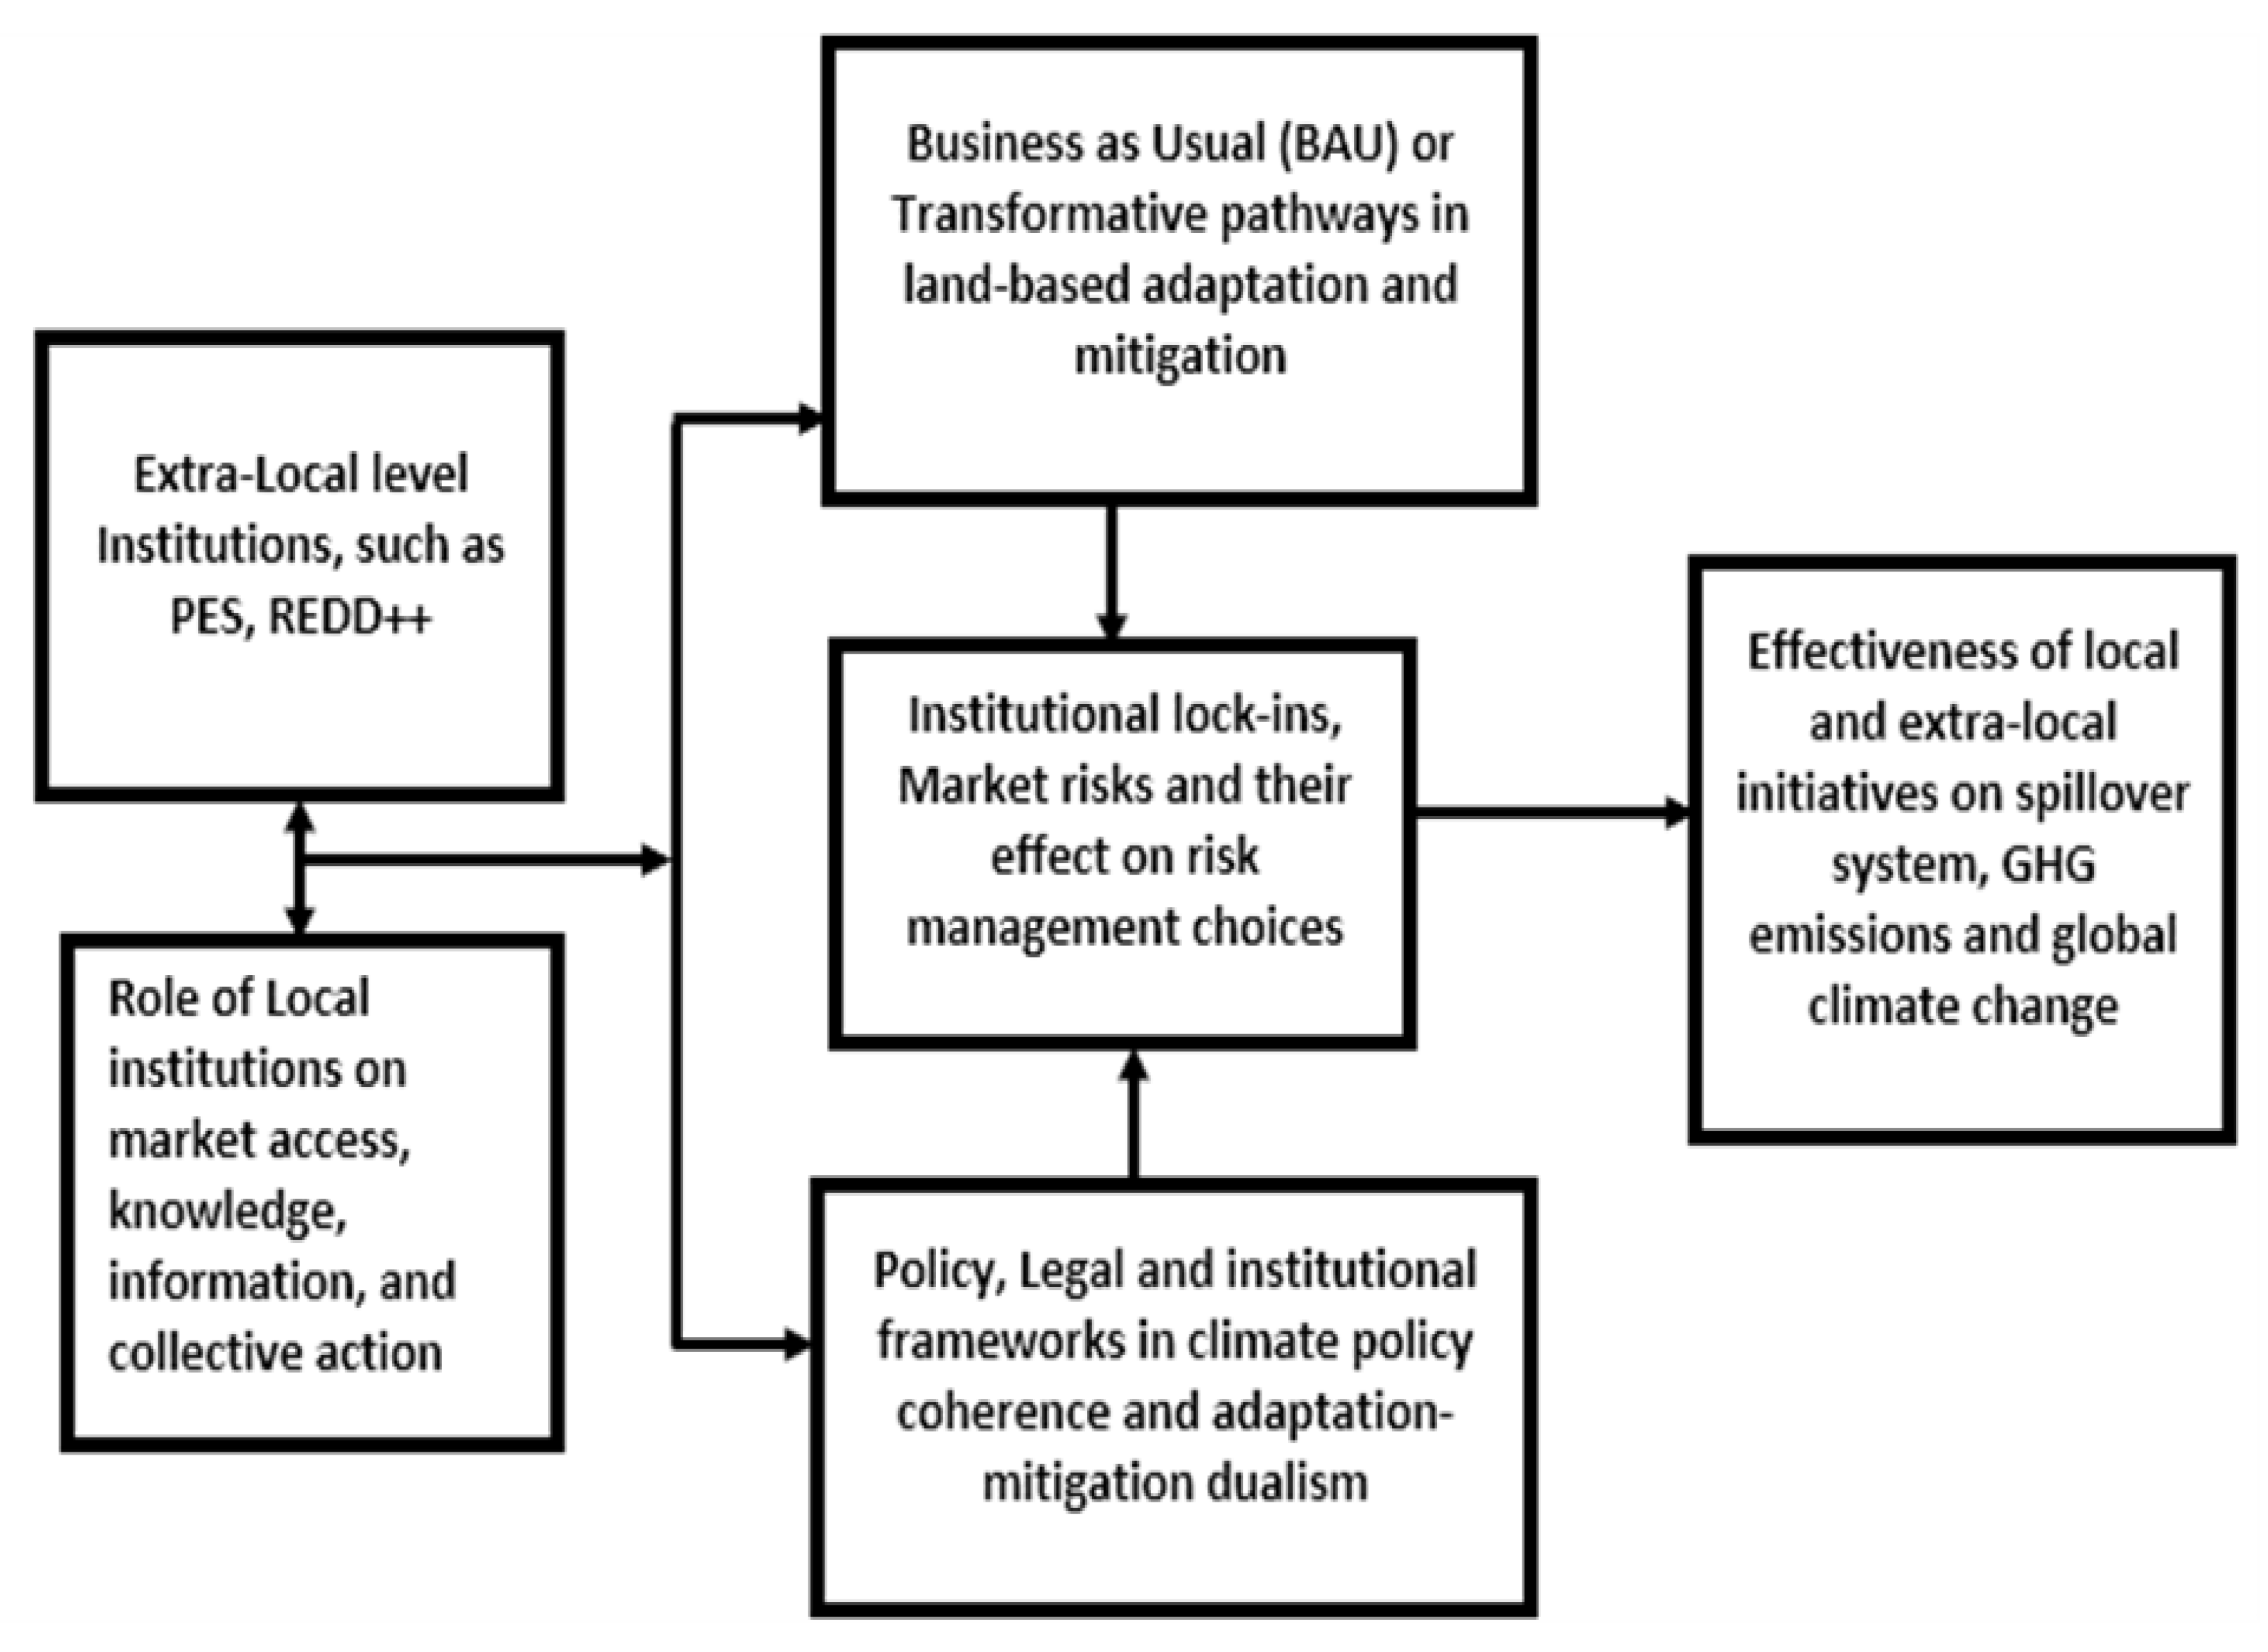
2.6. Towards an Innovative Analytical Framework for Effective Local–Global Climate Action

Individual action provides the impetus for effective collective action and efficient steering of global commons, such as GHG mitigation [90]. Motivating individual action on mitigation and adaptation could thus be challenging for several reasons. First, mitigation qualifies as a public good, an attribute that undermines voluntary action among individuals [91]. The challenge is prevalent where weak incentives, price risks, and poor markets prevail [92]. The challenges seem to be anchored on game theory. According to game theory [93], the choices of a rational utility maximising individual conflict with collective-level objectives. Apparently, individuals tend to prioritise short-term objectives such as profit over long-term public good objectives, such as the internalisation of GHGs [2].
Fit is reflected in the extent to which policy captures and addresses scope issues, such as externalities, as well as time-related preferred discount rates [94]. Incentivising individual action is thus significant in climate action and green growth initiatives [8]. Incentives are particularly critical in the pursuit of development trajectories that curtail environmental footprints and the decarbonisation of economies [3,9].
A value chain comprises a full set of activities, value links, and feedbacks required to bring a service or a product, such as milk, from the production point as well as associated activities such as aggregation, processing, and distribution to the final consumer [33,95]. Such value chain feedbacks are visualised from the perspective of actors’ input–output and institutional interdependencies [15,33,96]. Notably, horizontal and vertical linkages in a value chain influence information flow, standards, and market power [33], with a potential negative impact on voluntary action that internalises GHG emissions. In an oligopolistic market structure, for instance, price fixing, and collusion feedbacks could adversely impact sustainability objectives.
Literature suggest that the value chain development principles can be applied to identify social, economic and sustainability implementation gaps in CSA approaches [36]. To increase the probability of successful implementation and optimise integration of environmental, social and sustainability policy goals, Sustainable Food Value Chain (SFVC) suggest a focus on the most constraining factors such as price risks [33]. SFVC lends itself as tool for identifying the root causes of performance gaps, as well as envisioning how value chain actors at scale can synergistically address the binding constraint [33]. The framework can be adapted to wide socio economic and sustainability challenges. Herein effective policy is presented as a framework that integrates the interplay between individual action, production, and market constraints, as well as potential outcomes at scale (Figure 1) Local and extra local actors are critical drivers in climate action planning [18,97]. In synthesis of existing literature (Figure 1), risk is framed as an integral attribute indecision making. Risk influences adoption of CSA technologies and/or maladaptation. In this way, risk disposition of an individual farmer is critical to effective climate action as it impacts the magnitude of GHG emissions and their diffusion across geographical, political, and economic spheres, as well as the adverse impact on ecosystems and third parties. Institutional lock-ins are also critical drivers in the choice of management choices and carbon transitions. This is in turn influenced by policy, legal and institutional frameworks. Effectiveness is thus framed as the extent to which institutional frameworks, local and extra local actors’ impact collective action and drive synergies between adaptation and mitigation. The influence is seen from the extent to which the local and extra local actors, as well the institutional framework (legal, policy) is transformative in addressing adaptation-mitigation dualism.

3. Methodology

3.1. Study Area

This study was conducted in Bungoma and Kakamega counties. These two counties in western Kenya are located between longitude 34°35′ E and latitude 0° and 0°15′ N [98]. Table 1 provides the socio-economic background relevant to this study. Crop agriculture and livestock are the main livelihood activities among small-scale farmers who dominate the area [76,98]. Kakamega county covers an area of 3051 km2 with a population of 1,660,651. This translates to a population density of 544.3/km2. Bungoma county covers an area of 3024 Sq. km with a population of 1,670,570, translating to 552 persons/Sq·km.
Rainfall levels, agricultural potential, and productivity in terms of livestock type, crop varieties, and actual/potential yield levels vary across administrative jurisdictions of the counties [98]. Generally, the two counties have experienced warming and intensive dry spells. Agriculture employs 80% of the population and is critical to livelihoods in the two counties. This is significant because poverty levels in the two countries are above 50% [76]. Poverty is one of the critical drivers of vulnerability to climate change risks and maladaptive practices in the dairy subsector.

3.2. Field Data and Literature Review

Mixed methods approach consisting of agent survey and methane emission simulation from various dairy cattle feeding strategies was employed in the study. A cross sectional survey design was used to collect information through a multistage sampling technique (Table 2). The sampling frame consisted of a list of farmers from target sub counties provided by personnel in the department of Agriculture. In Stage 1, Agroecological Zonation (AEZ) was used as proxy for rainfall amount and dairy feeding strategy adoption. During the second stage, population density was taken as proxy for land size and adoption of integrated production systems. Participating farmer households were then selected through lottery system. The semi structured questionnaire was administered between March and May 2019. The questionnaire focused on dairy feeding options and institutional factors influencing dairy feeding strategies.
The information from household surveys was triangulated through Key Informant Interviews (KIs) and Focus Group Discussions (FDGs). Extensive literature on climate policy was undertaken from grey literature, i.e., books, as well as peer-reviewed publications. Focus Group Discussions (FGDs) were also undertaken to elicit information on factors influencing the choice of dairy feeding strategies.

3.3. Empirical Models

3.3.1. Gross Margin Analysis

Gross margins of various adaptation measures in terms of dairy cattle feeding strategies were calculated according to Equation (1). Input costs and output prices were obtained from farmers, feed stockists, and milk marketers.
∏ = R. Q − VC = R. Q − E1X1 − E2S2 − …EnSn
where:
  • ∏ = Gross revenue;
  • R = Price of the raw milk at farmgate;
  • Q = Quantity of raw milk sold in Litres (L);
  • VC = Total Variable cost of inputs in milk production;
  • Si = Amount of concentrate (legume fodder) in the feed ration;
  • Ei = cost of ith concentrate (legume fodder) in the feed ration.

3.3.2. Methane Emission Simulation

Equation (2) provides the adopted simulation model. The model follows methanogenesis process described by [99]). Simulation was preferred because it is timeous, saves resources and allows for integration and utilisation of already existing literature data base [100,101]. Comparisons of various Ms and supplementation regimes were made against conventional strategies, namely Napier (Pennisetum species) and Boma rhodes (Chloris gayana).
Simulated models give a range of scenarios that can be tracked in both directions to visualise scenarios and project impacts in any socio-ecological system setting [102]. The non-linear monomolecular models were preferred apriori due to their flexibility across ration types and feeding levels. According to [99], non-linear monomolecular models are robust enough to accommodate data sets that do not provide detailed feed values. Furthermore, non-linear models account better for observations at the extreme CH4 output and feed intake ratios. Feed value data in the simulation was obtained from [99,103,104,105].
Methane (Mj/day) = 1.06 (S.E 2.41) + 10.27 (S.E 3.59) dietary forage proportion + 0.87 (S.E 0.074) DMI
where:
  • DMI = Dry matter intake.
  • S.E = Standard error.

Assumptions in the Simulation

The complex nutritional interactions and enteric fermentation processes and physiological variations with age, environment, and lactation performance of dairy cattle called for several assumptions and simplifications. The main assumptions and methodological choices made in the simulation are:
  • Animal breed/type does not significantly influence methane emission levels.
  • Optimum PH value of 6.3–7.4 is assumed due to its effects on absorptive processes, fibre degradation, and microbial recycling within the rumen.
  • Fermentation within the rumen and hind gut are similar.
  • No errors in analysis of feed stuffs whose values were used in methane simulation.
  • No inherent variation in nutrient composition between samples of the same feed stuff (i.e., composition does not vary with soil types and weather and the time of cutting).
  • No substitution effect of legumes for stover in maize stover–legume-based rations.

3.3.3. Estimation of Ecoefficiency

In agriculture, GHG mitigation policy has shifted from absolute emissions to emissions per unit of product [72]. The policy is reflected through eco-certification initiatives in carbon markets that provide incentives and influence farmer decision making on their uptake [106]. The ecoefficiency approach biases innovation towards GHG emission mitigation to impact sustainability objectives [32]. Ecoefficiency is an integrated index for assessing the economic and environmental feasibilities [106]. Equation (3) is used to calculate ecoefficiencies according to Masuda [107]. The ecoefficiencies were based on Intergovernmental Panel on climate change (IPCC) default emission factors for livestock management [108]. The default global warming potential of 1 for CO2 and 34 for CH4 [88] were assumed.
Eco efficiency = N e t   F a r m   I n c o m e G l o b a l   W a r m i n g   P o t e n t i a l
The decision to supplement and the levels of supplementation thereof reflect the interaction between institutions, management options and risk attitude. The break-even price for dairy farmers during the survey was Kes 25 (100 Kes = 1$). The break-even price provided guidance on the evaluation of market risk on ecoefficiency. The mean price for the lower band (Kes 20 and 15) and the upper band (Kes 30 and 45) provided the baseline scenarios. In fitting the data, 18 L/cow was adjudged as carbon neutral point. Three level of dairy productivity viz; the lower production point as 0–9 L; medium level of 9–18 L and the upper point of 18–27 L and 27–36 L.

4. Results

4.1. Dairy Feeding Adaptation Strategies

FGDs and key informant and farmer interviews revealed that Ms and deferred harvesting of Napier grass (Pennisetum pauperum) are the most preferred dairy cattle feeding risk management strategies. The risk management strategy was practiced by about 70% of the respondents (Table 3). Less than 15% and 3% of the farmers used hay and silage, respectively. Further, silage making as an adaptation opportunity, especially during peak and above normal rainfall periods, is poorly adopted. About 85% of the sampled households attributed this to a lack of technical knowhow and information. As a result, surplus fodder available during above normal/peak rainfall periods is wasted. The use of hay legumes was practiced by less than 1% of the farmers, who cited limited land sizes and a lack of technical information.
Low milk producing dairy cattle breeds were evident in 65% of households in the Kakamega and 75% in the Bungoma respectively. The observation explains the low uptake of feed conservation strategies among farmers. The results from methane simulation suggest that delayed harvesting and utilisation of napier increases methane emission risk by up to 30% (Table 3). Agroforestry encompasses the joint production of trees and/or legumes with livestock in the same agricultural production unit [109]. Though fodder legumes and agro-forestry systems have potential to mitigate CH4 emissions, about 5% of the sampled households had adopted the system. Further, at least 85% of the respondents used Ms feeding strategies without any form of supplementation. As a result, most of the sampled households using Ms reported about 30% of the milk production potential from their dairy herds during droughts.
Table 4 provides the simulated CH4 emission levels from different dairy feeding strategies in the study area. Ms had a mean of 0. 813 CO2-eq against 0. 608 CO2-eq for Napier and 0.611 CO2-eq for legume fodder and grain supplemented strategies. Though the highest CH4 mitigation effect in the dairy feeding strategies from external inputs such as CSC are evident, the effect on CH4 is not significantly different (p ≤ 0.05) from farm grown legume fodder such as Luceana and Sesbania. In effect, farm produced legume fodder including dairy-agroforestry integrated systems could be as effective in the mitigation of CH4 emissions from ruminants. However, the adoption of legume fodders is extremely low at about 1% of the surveyed households (Table 3). About 84% of the farmers attributed the low uptake of agroforestry to competition between food crops and fodder production objectives, as well as the high market risks. Vertically integrated cooperatives could provide a window of opportunity to address the market risks.

4.2. Weather Variability and Price Risks in Dairy Feeding Strategies

Table 5 provides variance of prices for various feeding strategies. The price variance for locally available dairy feed resources is significantly lower relative to external resources, such as cotton seed cake (p ≤ 0.05). The highest price variance was observed in dairy feeding strategies that have highest positive impact on CH4 mitigation while the lowest variance is in the local resource such as Ms (which also have the highest methane emission potential). This could explain popularity of Ms as a risk management strategy among the sampled households. It can be inferred that price risks play a significant role in maladaptive practices and predictors of shifting vulnerabilities. The effect of output price on gross margins(profit) at different supplementation levels is provided in Supplementary File S1 (SP1). Increased supplementation using external inputs increases leads to negative gross margins in most of the informal marketing channels. This is an indicator of financial risks.
Weather variability and supplementation are thus intertwined and impact market risks in dairy farming. The mean production price for Ms is Kes 3.2 against 17.9 for external input supplemented strategy. The variance in price is significant across all the feeding strategies. The highest variance is noted in external input supplemented strategies. This contrasts with very low variance hence low market and price risks in the locally available feed resources.

4.3. Ecoefficiency

Externalities provide a case study where scope mismatches, sustainability, coherence, integration, and sectoral focus in climate adaptation policy could converge. Table 6 provides the effect of various dairy feeding strategies on ecoefficiency. Coping strategies represented by maize stover (Ms) at 113.43 ± 6.79 give the lowest ecoefficiency, while feeding strategies that utilise external resources, but which are highly vulnerable to price shocks at 693.37 ± 276.78, produce the highest ecoefficiencies. Similarly, resource integration, i.e., dairy–legume fodder, has a significant effect on ecoefficiencies (p = 0.05) for the analysed feeding strategies. From the findings, external inputs, such as cotton seed cake (Csc), play a significant role in dairy productivity and the management of GHG emission footprints, yet are less adopted among farmers. The low adoption of external inputs is attributed to high financial risks. Implicitly, price risks should be the focus, especially in the design of market instruments and adaptation financing targeting agricultural production systems.

5. Discussion

There is overwhelming evidence that GHG emissions are responsible for global warming risks; hence, they are a driver of the increased vulnerability of humanity and ecosystems to suffer harm [28,88]. The mainstreaming of agricultural emissions into the global climate agenda has thus emerged as one of the alternative carbon transition pathways [7,26]. Equally, there is an increasing need to address the dualistic framing of adaptation and mitigation [8]. Approaches such as CSA are significant in this direction, as well as enhancing adaptation–mitigation synergies and mitigation co-benefits [28,35]. CSA operationalises the triple bottom line objectives on adaptation, mitigation, and sustainability. In essence, CSA frameworks could decrease vulnerability to climate-related risks, improve capacity to respond to shocks, as well as lower emission intensities [98]. Agriculture is one of the sectors with potential for an immediate and large-scale reduction in emissions [23]. Since emission intensities are indicators of mitigation in agriculture [90], they are adopted as a strategic vision in the mainstreaming of agricultural emissions into the climate action agenda [81]. Agriculture has thus emerged as one of the sectors with potential for an immediate and large-scale reduction in emissions [23].
CSA presupposes the integration of climate change into sustainable agriculture planning and implementation at a local scale [110]. Though consensus on the need for sustainable practices and technologies, such as agroforestry and crop livestock integration, abounds as CSA approaches [81,111], several limitations remain unresolved. CSA, as well as existing analytical lenses such as telecoupling, tends to discount the importance of GHG spillover systems [1]. For instance, under CSA approaches, investment in adaptation is generally not linked to concomitant resilience goals, such as the mitigation of GHG emissions [81]. Further, a focus on specific elements, such as productivity, may fail to capture critical socio-economic and ecological linkages and feedbacks therein [15]. In turn, this could undermine policy effort, as well as meaningful transformation in a food system [112].
Though the Paris Agreement climate targets assume a strong implementation mechanism and the revitalisation of global partnership advocated for under the Sustainable Development Goals [13], to cascade GHG emission reduction targets regionally, nationally, and eventually locally, such a vision could be undermined by free riding and weak incentives for individual action [92]. A focus on the interplay between local interests, institutional frameworks, and fundamental drivers of the problem is thus fundamental [5,30]. Institutional lock-ins are particularly significant as they tend to undermine inclusive and effective carbon transition pathways. The failure to focus on the underlying cause of vulnerabilities further undermines resilience building [40]. For instance, though most developing nations, such as Kenya, have increased the contribution of agriculture emissions in their NDC ambitions, the proportion of agricultural emissions in the submitted ambitions fails to reflect the magnitude of agriculture sectors’ role in GHG emissions and mitigation.
Trajectories of vulnerability over time reflect an interplay of institutional context and individual decision making, as well as risk perception [113]. Implicitly there is need to focus on policy and market conditions that (dis)incentivise and influence the choices made by economic agents and how this impact the flow of GHGs in a spillover system [2]. In turn, it impacts cost-effectiveness in planning [45]. The findings underscore the need for holistic frameworks. Integration is especially critical in the maximisation of GHG mitigation benefits from AFOLU sectors [88,114]. This study thus contributes on filling knowledge gaps, notably the role of small-scale farmer practices in environmental governance [34].
Though, evaluation of risk in agricultural production is widespread, there is paucity of published literature on its role in GHG emissions. Attempts to use resilience lens to mediate convergence between adaptation and mitigation, however, fail to address underlying root causes of vulnerability [8,40]. Resilience approaches fail to account for resource constraint- risk nexus in vulnerability dynamics [8,47]. The linkage of resource constraints, maladaptation and increased methane emissions in the study area underscores the centrality of market risks. The findings underscore [46], observation that adaptation action could potentially to spill beyond geographical and economic boundaries.
Crop-livestock integration is one of the strategies for internalizing environmental externalities. For instance, some studies suggest agroforestry could provide several environmental co-benefits [67]. Integrated livestock-agroforestry management practices which encompass the combination of trees and/or legumes with livestock have the potential to mitigate GHG, capture and store carbon from the atmosphere. However, uptake of integrated systems is dependent on the ability of institutions to meaningful tackle existing bottlenecks (or institution fit), such as market access and price risk [65]. In the study, market risks tend to undermine supplementation as well the uptake of legume fodders. The negligible supplementation interventions in Ms dairy cattle feeding among poor farmers suggest that market risks and financing interventions are critical in agriculturally based carbon transitions.
Though Western Kenya is an idiosyncratic typology in global climate policy agenda, it provides invaluable insights on common environmental and sustainability challenges across scale and how they impact effectiveness of GHG mitigation initiatives. Further it illustrates the linkages of market risks on GHG emissions and/or aggravation of shifting vulnerabilities among resource constrained farmers. In essence the institutional-GHG- market risk nexus suggested herein demonstrates the multifaceted challenges in adaptation and mitigation discourses. It further underscores the centrality of contextual factors as suggested by [19], the indivisibility, as well as the need for concurrent use of socio-economic and environmental triple bottom line principles in carbon transitions.
The strength of this study lies in the integration of the triple sustainability bottom-line and market risks to visualise GHG emission levels that informs transformative discourses on climate change. use of literature data to estimate emission risks, may result into biased emission extremes (either low or high). Quantification of real-world emission levels would go a long way in overcoming the limitation. Agent-based scenario modelling holds considerable promise towards quantification of actual methane emission risks.

6. Conclusions

Effective tackling of global climate crisis largely depends on positioning agriculture and food systems as alternative carbon transition patways, climate financing, as well as enhancing adaptation-mitigation synergies. Concomittant to food system transformation is the need for integration of GHG emissions into climate action agenda. The article has framed the increasing GHG effect, as a collective challenge. Small-scale farming production systems are expected to provide urgently needed solution space for transition to alternative carbon transitions and the transformation process. Implicitly, adoption of CSA technologies by a critical mass of small-scale farmers could significantly reduce GHG emission gaps herein framed as effectiveness. Livestock subsector is considered as priority agricultural subsector due to its significant role in adaptation, livelihoods and GHG emissions. The first objective in the study thus investigated whether local decision making on dairy feeding strategies has effect on GHG emissions at scale. Uptake of dairy feeding technologies is visaualised through adoption theory [115]. In tandem with Koundouri et al. [63], risk including market risks were posited to and were found to play a critical role in the adoption of the dairy feeding technologies. According to simulation results on emethane emissions, dairy-agroforestry integration staretegies were as effective as externally sourced inputs in reducing GHG emissions by upto 30%. However, uptake of agroforestry/legume foddder alternatives among scale farmers in the study area is extremely low. The high market risks accounted for low adoption of agroforestry/fodder legume technologies. Evidently adoption of CSA technologies as a decision making process impact GHG emission levels and effectiveness of local-global initiatives. The use of Ms without and/or suboptimal supplementation, used herein further illustrates the risk of maladaptation. Maladaptation, as well as low adoption of alternative carbon pathways not only undermine local-global initiatives on GHG mitigation, but also deepens GHG emissions and future global warming risks. An association between adoption of CSA (i.e., dairy feed supplementation and dairy-agroforestry integration) and market risks thus established reveal the association between micro-level decision making, risk, GHG emission, as well as suggest global interconnectivity. Maladaptive responses in the case study further highlight the growing need to debunk framing of adaptation as a local issue [19,46], as well the urgency to address maladaptive practices in small-holder farmer production systems [116].
Some studies [117] suggest the need to deliberately direct adaptation finance towards resource constrained farm households. The study has highlighted the effect of resource constraints on uptake of CSA technologies. In particular, it underscores market risks as binding constraints in the supplementation of dairy cattle feeding strategies. The study recommends use of SFVC as an analytical lens to visualise the institutional gaps in carbon transitions, facilitate institutional coherence and re-engineer institutions towards innovation, specifically the inclusion and integration of small-scale farmers into climate finance initiatives. Together the suggested framework addresses transformation gaps in resilience building as suggested by [8,40]. This could foster adoption of CSA technologies by a critical mass of small-scale farmers and positively impact effectiveness of carbon neutral transitions. The finding provides an innovative analytical lens for effective adaptation planning and the positioning of food systems as alternative carbon transition pathways. In conclusion, cogent climate action policies at scale need to focus on decision making-price risk- resource constraint nexus and feedbacks.

Supplementary Materials

The following are available online at https://www.mdpi.com/article/10.3390/atmos12111507/s1. File S1: Effect of output price variations on risk management at different levels of basal diets on Gross Margin.

Author Contributions

T.V.E. was the originator of the research idea and conceptualisation, T.V.E. and R.M.; methodology, T.V.E.; software, T.V.E.; validation, formal analysis, T.V.E. and R.M.; investigation, T.V.E.; resources, R.M. and G.-I.E.; data curation, T.V.E.; original draft preparation, T.V.E.; review and editing, G.-I.E. and R.M.; supervision, G.-I.E. All authors have read and agreed to the published version of the manuscript.

Funding

This research received no external funding.

Institutional Review Board Statement

Not applicable.

Informed Consent Statement

Not applicable.

Data Availability Statement

The study did not report any new data.

Conflicts of Interest

The authors declare no conflict of interest.

References

  1. Liu, J.; Dou, Y.; Batistella, M.; Challies, E.; Connor, T.; Friis, C.; Millington, J.D.; Parish, E.; Romulo, C.L.; Silva, R.F.B.; et al. Spillover systems in a telecoupled Anthropocene: Typology, methods, and governance for global sustainability. Curr. Opin. Environ. Sustain. 2018, 33, 58–69. [Google Scholar] [CrossRef] [Green Version]
  2. Parish, E.S.; Herzberger, A.J.; Phifer, C.C.; Dale, V.H. Transatlantic wood pellet trade demonstrates telecoupled benefits. Ecol. Soc. 2018, 23. [Google Scholar] [CrossRef]
  3. Xiong, H.; Millington, J.; Xu, W. Trade in the telecoupling framework: Evidence from the metals industry. Ecol. Soc. 2018, 23. [Google Scholar] [CrossRef]
  4. Juhola, S.; Glaas, E.; Linner, B.-O.; Neset, T.-S. Redefining maladaptation. Environ. Sci. Policy 2016, 55, 135–140. [Google Scholar] [CrossRef] [Green Version]
  5. Burch, S.; Gupta, A.; Inoue, C.; Kalfagianni, A.; Persson, Å.; Gerlak, A.K.; Ishii, A.; Patterson, J.; Pickering, J.; Scobie, M.; et al. New directions in earth system governance research. Earth Syst. Gov. 2019, 1, 100006. [Google Scholar] [CrossRef]
  6. UNFCCC (United Nations Framework Convention on Climate Change). Working Group on the Paris Agreement: Additional Tool under Item 3 of the Agenda on Nationally Dtermined Commitments (NDCs); UNFCCC: Bangkok, Thailand, 2018. [Google Scholar]
  7. Intergovernmental Panel on Climate Change. Climate Change and Land: An IPCC Special Report on Climate Change, Desertification and Land Degradation, Sustainable Land Management, Food Security and Greenhouse Gas Fluxes in Terrrestrial Ecosystems; Roberts, D., Ferrat, M., Connors, S., Haughey, E., Malley, J., Eds.; IPCC: Geneva, Switzerland, 2019; Available online: www.Ipcc.ch (accessed on 10 November 2020).
  8. Newell, P.; Srivastava, S.; Naess, L.O.; Torres, C.; Gerardo, A.; Price, R. Towards transformative climate justice: An emerging research agenda. Wiley Interdiscip. Rev. Clim. Chang. 2021, 12, e733. [Google Scholar] [CrossRef]
  9. Otto, I.M.; Donges, J.F.; Cremades, R.; Bhowmik, A.; Hewitt, R.J. Social tipping dynamics for stabilizing Earth’ s climate by 2050. Proc. Natl. Acad. Sci. USA 2020, 117, 2354–2365. [Google Scholar] [CrossRef] [Green Version]
  10. Jackson, R.B.; Le Quéré, C.; Andrew, R.M.; Canadell, J.G.; Korsbakken, J.I.; Liu, Z.; Peter, G.P.; Zheng, B. Global energy growth is outpacing decarbonization Global energy growth is outpacing decarbonization. Environ. Res. Lett. 2018, 13, 120401. [Google Scholar] [CrossRef]
  11. Tvinnereim, E.; Mehling, M. Carbon pricing and deep decarbonisation. Energy Policy 2018, 121, 185–189. [Google Scholar] [CrossRef]
  12. Smith, E.K.; Mayer, A. A social trap for the climate? Collective action, trust and climate change risk perception in 35 countries. Glob. Environ. Chang. 2018, 49, 140–153. [Google Scholar] [CrossRef]
  13. United Nations Framework Convention on Climate Change. Report of the Conference of the Parties on Its Twenty-First Session held in Paris from 30 November to 13 December 2015; UNFCCC: Geneva, Switzerland, 2016; Volume 1192. [Google Scholar]
  14. Food and Agriculture Organization. Assessing the Role of Agriculture and Land Use in Nationally Determined Contributions: Amethodology; NDCs No. 76; FAO: Rome, Italy, 2019; Available online: https://www.fao.org%2Fpublications%2Fcard%2Fen%2Fc%2FCA5543EN%2F&usg=AOvVaw2cvePdQ8o0Cn0DItyWnYZp (accessed on 2 January 2020).
  15. Epstein, G.; Pittman, J.; Alexander, S.M.; Berdej, S.; Dyck, T.; Kreitmair, U.; Rathwell, K.J.; Villamayor-Tomas, S.; Vogt, J.; Armitage, D. Institutional fit and the sustainability of social–ecological systems. Curr. Opin. Environ. Sustain. 2015, 14, 34–40. [Google Scholar] [CrossRef]
  16. Steffen, W.; Rockström, J.; Richardson, K.; Lenton, T.; Folke, C.; Liverman, D. Trajectories of the Earth System in the Anthropocene. Proc. Natl. Acad. Sci. USA 2018, 115, 8252–8259. [Google Scholar] [CrossRef] [Green Version]
  17. Rasmussen, L.V. Re-Defining Sahelian ‘Adaptive Agriculture’ when Implemented Locally: Beyond Techno-fix Solutions. World Dev. 2018, 108, 274–282. [Google Scholar] [CrossRef]
  18. Rasmussen, J.F.; Friis-Hansen, E.; Funder, M. Collaboration between meso-level institutions and communities to facilitate climate change adaptation in Ghana. Clim. Dev. 2019, 11, 355–364. [Google Scholar] [CrossRef]
  19. Dapilah, F.; Østergaard, J.; Lebek, N.K.; D’haen, S.L. He who pays the Piper calls the tune: Understanding collaborative governance and climate change adaptation in Northern Ghana. Clim. Risk Manag. 2021, 32, 100306. [Google Scholar] [CrossRef]
  20. Intergovernmental Panel on Climate Change. Global Warming of 1.5oc. An IPCC Special Report on the Impacts of Global Warming of 1.5oc above Pre-Industrial Levels and Related Global Greenhouse Gas Emission Pathways in the Context of Strengthening Global Response to the Threat of Climate Change, Sus; IPCC: Geneva, Switzerland, 2018; Available online: https://www.ipcc.ch%2Fsr15%2Fchapter%2Fspm%2F&usg=AOvVaw1TuvxicJVk7WTEcCx4qL5f (accessed on 5 March 2020).
  21. United Nations Environment Programme. Emissions Gap Report 2019; Edo, A., Hertwich, E., Heeren, N., Eds.; UNEP: Nairobi, Kenya, 2019; Available online: http://www.unenvironment.org/emissionsgap (accessed on 5 May 2021).
  22. Höhne, N.; Elzen, M.D.; Rogelj, J.; Metz, B.; Fransen, T.; Kuramochi, T.; Olhoff, A.; Alcamo, J.; Winkler, H.; Fu, S.; et al. Emissions: World has four times the work or one third of the time. Nat. Clim. Chang. 2020, 579, 25–28. [Google Scholar] [CrossRef] [Green Version]
  23. Bonner, A.C.; Biglan, A. Rebooting Behavioral Science to Reduce Greenhouse Gas Emissions. Behav. Soc. Issues 2021. [Google Scholar] [CrossRef]
  24. Aguilera, E.; Reyes-palomo, C.; Díaz-gaona, C.; Sanz-cobena, A.; Smith, P.; García-laureano, R.; Rodríguez-est, V. Greenhouse gas emissions from Mediterranean agriculture: Evidence of unbalanced research efforts and knowledge gaps. Glob. Environ. Chang. 2021, 69. [Google Scholar] [CrossRef]
  25. Food and Agriculture Organization. FAO’S Work on Climate Change; FAO: Rome, Italy, 2016; Available online: www.fao.org/publications (accessed on 12 October 2019).
  26. Food and Agriculture Organization. The Agriculture Sectors in the Intended Nationally Determined Contributions: Analysis; Environment and Natural Resources No. 62; FAO: Rome, Italy, 2016; Available online: www.fao.org%2Fpolicy-support%2Ftools-and-publications%2Fresources-details%2Fen%2Fc%2F427079%2F&usg=AOvVaw29qAGaW18EA2TvIbWtvHYM (accessed on 12 October 2019).
  27. Antwi-agyei, P.; Dougill, A.J.; Agyekum, T.P.; Lindsay, C.S. Alignment between nationally determined contributions and the sustainable development goals for West Africa sustainable development goals for West Africa. Clim. Policy 2018, 18, 1296–1312. [Google Scholar] [CrossRef]
  28. United Nations Framework Convention on Climate Change. Nationally Determined Contributions under the Paris Agreement: Synthesis Report; UNFCCC: Geneva, Switzerland, 2021; Volume 2674, Available online: https://unfccc.int/sites/default/files/resource/cma2021_08_adv_1.pdf (accessed on 8 September 2021).
  29. World Bank. Risk and Opportunity: Managing Risk for Development; World Bank: Washington, DC, USA, 2014; Available online: www.worldbank.org (accessed on 9 May 2019).
  30. Barreteau, O.; Anderies, J.; Guerbois, C.; Quinn, T.; Therville, C.; Mathevet, R. Transfers of vulnerability through adaptation plan implementation: An analysis based on networks of feedback control loops. Ecol. Soc. 2020, 25, 3–19. [Google Scholar] [CrossRef]
  31. Reed, J.; Barlow, J.; Carmenta, R.; van Vianen, J.; Sunderland, T. Engaging multiple stakeholders to reconcile climate, conservation and development objectives in tropical landscapes. Biol. Conserv. 2019, 238, 108229. [Google Scholar] [CrossRef]
  32. Loboguerrero, A.M.; Campbell, B.M.; Cooper, P.J.M.; Hansen, J.W.; Rosenstock, T.; Wollenberg, E. Food and Earth Systems: Priorities for Climate Change Adaptation and Mitigation for Agriculture and Food Systems. Sustainability 2019, 11, 1372. [Google Scholar] [CrossRef] [Green Version]
  33. Food and Agriculture Organisation of the United Nations. Developing sustainable Food Value Chains Guiding Principles Developing Sustainable Food Value Chains: Guiding Principles; Rural Infrastructure and AgroIndustries Division; Neven, D., Ed.; FAO: Rome, Italy, 2014. [Google Scholar]
  34. Xu, E.G.B.; Leung, K.M.Y.; Morton, B.; Lee, J.H.W. An integrated environmental risk assessment and management framework for enhancing the sustainability of marine protected areas: The Cape d’ Aguilar Marine Reserve case study in Hong Kong. Sci. Total. Environ. 2015, 505, 269–281. [Google Scholar] [CrossRef] [PubMed]
  35. Kim, H.; Grafakos, S. Which are the factors influencing the integration of mitigation and adaptation in climate change plans in Latin American cities? Environ. Res. Lett. 2019, 14, 105008. [Google Scholar] [CrossRef]
  36. Food and Agriculture Organisation of the United Nations. Climate Smart Agriculture Sourcebook; FAO: Rome, Italy, 2013; Available online: http://www.fao.org/docrep/018/i3325e/i3325e04.pdf (accessed on 8 September 2017).
  37. Tessema, Y.; Joerin, J.; Patt, A. Crop switching as an adaptation strategy to climate change: The case of Semien Shewa Zone of Ethiopia. Int. J. Clim. Chang. Strateg. Manag. 2019, 11, 358–371. [Google Scholar] [CrossRef] [Green Version]
  38. Rey, A.N.R.; Pizarro, J.C.; Anderson, C.B.; Huettmann, F. Even at the uttermost ends of the Earth: How seabirds telecouple the Beagle Channel with regional and global processes that affect environmental conservation and social-ecological sustainability. Ecol. Soc. 2017, 22. [Google Scholar] [CrossRef]
  39. Jiménez, A.; Garry, A.; Albert, D.P.; Grace, V.N.; Andrea, Y.W. Local lens for SDG implementation: Lessons from bottom-up approaches in Africa. Sustain. Sci. 2020, 15, 729–743. [Google Scholar] [CrossRef] [Green Version]
  40. Eriksen, S.; Schipper, E.F.; Scoville-simonds, M.; Vincent, K.; Nicolai, H.; Brooks, N.; Harding, B.; Khatri, D.; Lenaerts, L.; Liverman, D. Adaptation interventions and their effect on vulnerability in developing countries: Help, hindrance or irrelevance? World Dev. 2021, 141, 105383. [Google Scholar] [CrossRef]
  41. Massey, E.; Biesbroek, R.; Huitema, D.; Jordan, A. A climate policy innovation: The adoption and diffusion of adaptaion policies across Europe. Global Environ. Chang. 2014, 29, 434–443. [Google Scholar] [CrossRef]
  42. Huitema, D.; Adger, W.; Berkout, F.; Massey, E.; Mamanian, D.; Munaretto, S.; Plummer, R.; Termeer, C.C.J.A.M. The governance of adaptation: Choices, reasons, and effects.Introduction to Special Feature. Ecol. Soc. 2016, 21, 37–53. [Google Scholar] [CrossRef] [Green Version]
  43. Liu, J.; Yang, W. Integrated assessments of payments for ecosystem services programs. Proc. Natl. Acad. Sci. USA 2013, 110, 16297–16298. [Google Scholar] [CrossRef] [Green Version]
  44. Seidler, R.; Dietrich, K.; Schweizer, S.; Bawa, K.S.; Chopde, S.; Zaman, F.; Sharma, A.; Bhattacharya, S.; Devkota, L.P.; Khaling, S. Progress on integrating climate change adaptation and disaster risk reduction for sustainable development pathways in South Asia: Evidence from six research projects. Int. J. Disaster Risk Reduct. 2018, 31, 92–101. [Google Scholar] [CrossRef]
  45. Di Gregorio, M.; Ridho, D.; Paavola, J.; Maya, I.; Fatorelli, L.; Pramova, E.; Locatelli, B.; Brockhaus, M.; Kusumadewi, S.D. Climate policy integration in the land use sector: Mitigation, adaptation and sustainable development linkages. Environ. Sci. Policy 2017, 67, 35–43. [Google Scholar] [CrossRef] [Green Version]
  46. Talebian, S.; Carlsen, K.; Johnson, O.; Volkholz, J.; Kwamboka, E. Assessing future cross-border climate impacts using shared socioeconomic pathways. Clim. Risk Manag. 2021, 32. [Google Scholar] [CrossRef]
  47. Ziervogel, G.; Pelling, M.; Cartwright, A.; Chu, E.; Deshpande, T.; Harris, L.; Hyams, K.; Kaunda, J.; Klaus, B.; Michael, K.; et al. Inserting rights and justice into urban resilience: A focus on everyday risk. Environ. Urban 2017, 29, 123–138. [Google Scholar] [CrossRef] [Green Version]
  48. Sovacoola, B.K.; Del Rio, F.D.; Griffiths, S. Contextualizing the Covid-19 pandemic for a carbon-constrained world: Insights for sustainability transitions, energy justice, and research methodology. Energy Res. Soc. Sci. 2020, 68, 101701. [Google Scholar] [CrossRef] [PubMed]
  49. Seto, K.C.; Davis, S.J.; Mitchell, R.B.; Stokes, E.C.; Unruh, G.; Urge-Vorsatz, D. Carbon Lock-In: Types, Causes, and Policy Implications. Annu. Rev. Environ. Resour. 2016, 41, 425–452. [Google Scholar] [CrossRef] [Green Version]
  50. Buschmann, P.; Oels, A. The overlooked role of discourse in breaking carbon lock-in: The case of the German energy transition. Wiley Interdiscip. Rev. Clim. Chang. 2019, 10, e574. [Google Scholar] [CrossRef] [Green Version]
  51. North, D.C. Institutions, Institutional Change, and Economic Performance. J. Econ. Perspect. 1991, 5, 97–112. [Google Scholar] [CrossRef]
  52. Ishtiaque, A.; Eakin, H.; Vij, S.; Chhetri, N.; Rahman, F.; Huq, S. Multilevel governance in climate change adaptation in Bangladesh: Structure, processes, and power dynamics. Reg. Environ. Chang. 2021, 21, 1–15. [Google Scholar] [CrossRef]
  53. Pelling, M.; O’Brien, K.; Matyas, D. Adaptation and transformation. Clim. Chang. 2015, 133, 113–127. [Google Scholar] [CrossRef] [Green Version]
  54. Totin, E.; Segnon, A.C.; Schut, M.; Affognon, H. Institutional Perspectives of Climate-Smart Agriculture: A Systematic Literature Review. Sustainability 2018, 10, 1990. [Google Scholar] [CrossRef] [Green Version]
  55. Schebesta, H.; Candel, J.L. Game-changing potential of the EU’s Farm to Fork Strategy. Nat. Food 2020, 1, 586–588. [Google Scholar] [CrossRef]
  56. Robert, M.; Thomas, A.; Bergez, J.-E. Processes of adaptation in farm decision-making models: A review. Agron. Sustain. Dev. 2016, 36, 64. [Google Scholar] [CrossRef] [Green Version]
  57. Ostrom, E. A diagnostic approach for going beyond panaceas. Proc. Natl. Acad. Sci. USA 2007, 104, 15181–15187. [Google Scholar] [CrossRef] [PubMed] [Green Version]
  58. Gustavo, S.; Loboguerrero, M.A.; Corner-dolloff, C.; Lizarazo, M.; Nowak, A.; Martínez-barón, D.; Andrieu, N. Costs and bene fi ts of climate-smart agriculture: The case of the Dry Corridor in Guatemala. Agric. Syst. 2017, 151, 163–173. [Google Scholar]
  59. Shimon, O.P.; Ogutu, C.A.; Mburu, J.; Nyikal, R.A. Effect of Global-GAP Policy on Climate Change Perceptions of Smallholder French Beans Farmers in Central and Eastern Regions, Kenya. Climate 2017, 5, 27. [Google Scholar] [CrossRef] [Green Version]
  60. Wekesa, B.; Ayuya, O.; Lagat, J. Effect of climate-smart agricultural practices on household food security in smallholder production systems: Micro-level evidence from Kenya. Agric. Food Secur. 2018, 7, 80. [Google Scholar] [CrossRef] [Green Version]
  61. Godde, C.M.; Garnett, T.; Thornton, P.K.; Ash, A.; Herrero, M. Grazing systems expansion and intensi fi cation: Drivers, dynamics, and trade-offs. Glob. Food Secur. 2018, 16, 93–105. [Google Scholar] [CrossRef]
  62. Ullah, R.; Shivakoti, G.P.; Zulfiqar, F.; Kamran, M.A. Farm risks and uncertainties: Sources, impacts and management. Outlook Agric. 2016, 45, 199–205. [Google Scholar] [CrossRef]
  63. Koundouri, P.; Nauges, C.; Tzouvelekas, V. Technology Adoption under Production Uncertainty: Theory and Application to Irrigation Technology. Am. J. Agric. Econ. 2019, 88, 657–670. Available online: https://www.jstor.org/stable/3697756 (accessed on 3 February 2021). [CrossRef] [Green Version]
  64. You, J. Risk under-investment in agricultural assets and dynamic asset poverty in rural China. China Econ. Rev. 2014, 29, 27–45. [Google Scholar] [CrossRef]
  65. Williams, T.; Hiernaux, P.; Fernandez-Rivera, S. Crop-livestock Systems in Sub-Saharan Africa: Determinants and Intensification Pathways. In Property Rights, Risk, and Livestock Development in Africa; ILRI/IFRI: Washington, DC, USA, 2000; Volume 49, pp. 132–151. [Google Scholar] [CrossRef]
  66. Guilhermo, F.; De Souza, C.; Olga, L.; Mayorga, M. Enteric methane mitigation strategies for ruminant livestock systems in the Latin America and Caribbean region: A meta-analysis. J. Clean. Prod. 2021, 312. [Google Scholar] [CrossRef]
  67. Havlík, P.; Valin, H.; Herrero, M.; Obersteiner, M.; Schmid, E.; Rufino, M.C. Climate change mitigation through livestock system transitions. Proc. Natl. Acad. Sci. USA 2014, 111, 3709–3714. [Google Scholar] [CrossRef] [PubMed] [Green Version]
  68. Gautam, Y.; Andersen, P. Rural livelihood diversi fi cation and household well-being: Insights from Humla, Nepal. J. Rural. Stud. 2016, 44, 239–249. [Google Scholar] [CrossRef] [Green Version]
  69. Herrero, M.; Croz, D.M.; Thornton, P.K.; Fanzo, J.; Godde, C.; Bellows, A.; de Groot, A.; Palmer, J.; Chang, J.; van Zanten, H.; et al. Livestock and Sustainable Food Systems: Status, Trends, and Priority Actions; Center for Development Research ZEF: Bonn, Germany, 2021; Available online: https://sc-fss2021.org (accessed on 5 May 2021).
  70. Tubiello, F.N.; Conchedda, G.; Wanner, N.; Federici, S.; Rossi, S.; Grassi, G. Carbon emissions and removals from forests: New estimates, 1990–2020. Earth Syst. Sci. Data 2021, 13, 1681–1691. [Google Scholar] [CrossRef]
  71. Geber, P.; Steinfeld, H.; Henderson, B.; Mottet, A.; Opio, C.; Dijkman, J.; Falcucci, A.; Tempio, G. (Eds.) Tackling Climate Change through Livestock: Aglobal Assessment of Emissions and Mitigation Opportunities; FAO (Food and Agriculture Organisation of the United Nations): Rome, Italy, 2013; Available online: http://www.fao.org/../i3437e00.htm (accessed on 14 July 2018).
  72. Meng, B.; Peters, G.P.; Wang, Z. Tracing Greenhouse Gas Emissions in Global Value Chains; Working Paper No. 525; Stanford University: Stanford, CA, USA, 2015. [Google Scholar]
  73. Notenbaert, A.; Pfeifer, C.; Silvestri, S.; Herrero, M. Targeting, out-scaling and prioritising climate-smart interventions in agricultural systems: Lessons from applying a generic framework to the livestock sector in sub-Saharan Africa. Agric. Syst. 2017, 151, 153–162. [Google Scholar] [CrossRef]
  74. Government of Kenya. Kenya Climate Smart Agriculure Strategy 2017–2016; G.O.K.: Nairobi, Kenya, 2017. Available online: www.Kilimo.go.ke (accessed on 20 January 2018).
  75. Ministry of Environment and Forestry. Kenya’s First NDC (Updated Version); Ministry of Environment and Forestry: Nairobi, Kenya, 2020.
  76. Kenya National Bureau of Statistics. Kenya Population and Housing Census: Counting Our People for Sustainable Development and Devolution of Services; KNBS: Nairobi, Kenya, 2019; Volume I, Available online: www.knbs.or.ke (accessed on 20 September 2019).
  77. Government of Kenya. Climate Change Action Plan 2018–2022; G.O.K.: Nairobi, Kenya, 2018; Volume I. Available online: www.environment.go.ke (accessed on 2 July 2020).
  78. Volenzo, T.E.; Odiyo, J.O. Perception of Environmental Spillovers Across Scale in Climate Change Adaptation Planning: The Case of the case of small-scale farmers’ irrigation strategies, Kenya. Climate 2020, 8, 3. [Google Scholar] [CrossRef]
  79. Chesterman, S.; Neely, C. Agriculture in Kenya Working Paper implications of Climate—Smart Agriculture in Kenya; No. 90; Climate Change, Agriculture and Food Security (CCAFS): Copenhagen, Denmark, 2015; Available online: www.ccafs.cgiar.org (accessed on 6 July 2020).
  80. Weitz, N.; Strambo, C.; Kemp-benedict, E.; Nilsson, M. Closing the governance gapsin the water-energy-food nexus: Insights from integrative governance. Glob. Environ. Chang. 2017, 45, 165–173. [Google Scholar] [CrossRef]
  81. Food and Agriculture Organization. The Future of Livestock in Kenya: Opportunities and Challenges in the Face of Uncertainity; FAO: Rome, Italy, 2019; Available online: www.fao.org/publications (accessed on 2 May 2020).
  82. KDB (Kenya Dairy Board). KDB Online Portal; KDB: Nairobi, Kenya, 2020. Available online: www.kdb.co.ke (accessed on 3 April 2021).
  83. Bebe, B.O.; Rademaker, C.; van der Lee, J.; Kilelu, C.W.; Tonui, C. Sustainable growth of the Kenyan dairy sector—A quick scan of robustness, reli- ability and resilience. Wagening. Livest. Res. 2015. [Google Scholar] [CrossRef] [Green Version]
  84. Folke, C.; Hahn, T.; Olsson, P.; Norberg, J. Adaptive Governance of Social-Ecological Systems. Annu. Rev. Environ. Resour. 2005, 30, 441–443. [Google Scholar] [CrossRef] [Green Version]
  85. Adger, N.W.; Arnell, W.N.; Tompkins, L.E. Successful adaptation to climate change across scales. Glob. Environ. Chang. 2005, 15, 77–86. [Google Scholar] [CrossRef]
  86. Mees, H.L.; Dijk, J.; van Soest, D.; Driessen, P.P.; van Rijswick, M.H.; Runhaar, H. A method for the deliberate and deliberative selection of policy instrument. Ecol. Soc. 2014, 19, 190258. [Google Scholar] [CrossRef] [Green Version]
  87. Dupuis, J.; Knoepfel, P. The Adaptation Policy Paradox: The Implementation Deficit of Policies. Ecol. Soc. 2013, 18, 31–47. [Google Scholar] [CrossRef]
  88. Intergovernmental Panel on Climate Change. Summary for Policymakers. In Climate Change 2021: The Physical Science Basis; Contribution of Working Group I to the Sixth Assessment Report of the Intergovernmental Panel on Climate Change; Masson-Delmotte, V., Zhai, P., Pirani, A., Connors, S.L., Péan, C., Berger, S., Caud, N., Chen, Y., Goldfarb, L., Gomis, M.I., et al., Eds.; Cambridge University Press: Cambridge, UK, 2021; in press. [Google Scholar]
  89. Sovacool, B.K.; Martiskainen, M.; Hook, A.; Baker, L. Decarbonization and its discontents: A critical energy justice perspective on four low-carbon transitions. Clim. Chang. 2019, 2019, 581–619. [Google Scholar] [CrossRef] [Green Version]
  90. Folke, C.; Pritchard, L.; Berkes, F.; Colding, J.; Svedin, U. The Problem of Fit between Ecosystems and Institutions: Ten Years Later. Ecol. Soc. 2007, 12, 30–65. [Google Scholar] [CrossRef] [Green Version]
  91. Gordon, A.J.; Morton, L.W.; Hobbs, J. Understanding Farmer Perspectives on Climate Change Adaptation and Mitigation: The Roles of Trust in Sources of Climate Information, Climate Change Beliefs, and Perceived Risk. Environ. Behav. 2015, 47, 205–234. [Google Scholar] [CrossRef]
  92. Barrett, C.B.; Carter, M.; Little, P.D.; Barrett, C.; Carter, M.; Little, P. Understanding and Reducing Persistent Poverty in Africa: Introduction to a Special Issue. J. Dev. Stud. 2006, 42, 167–177. [Google Scholar] [CrossRef]
  93. Morgenstern, O. The Theory of Games. Sci. Am. 1949, 180, 22–25. [Google Scholar] [CrossRef]
  94. Rijke, J.; Brown, R.; Zevenbergen, C.; Ashley, R.; Farrelly, M.; Morison, P.; Van Herk, S. Fit-for-purpose governance: A framework to make adaptive governance operational. Environ. Sci. Policy 2012, 22, 73–84. [Google Scholar] [CrossRef]
  95. Kaplinsky, R. Globalisation and Unequalisation: What Can Be Learned from Value Chain Analysis? J. Dev. Stud. 2010, 37, 117–146. [Google Scholar] [CrossRef]
  96. Villamayor-tomas, S.; Grundmann, P.; Epstein, G.; Evans, T.; Kimmich, C. The Water-Energy-Food Security Nexus through the Lenses of the Value Chain and the Institutional Analysis and Development Frameworks. Water Altern. 2015, 8, 735–755. [Google Scholar]
  97. Ampaire, L.E.; Jassogne, L.; Providence, H.; Acosta, M.; Twyman, J.; Winowiecki, L.; Asten, P. Institutional challenges to climate change adaptation: A case study on policy action gaps in Uganda. Environ. Sci. Policy 2017, 75, 81–90. [Google Scholar] [CrossRef]
  98. Jaetzold, R.; Schmidt, H.; Hornetz, B.; Shisanya, C. Farm Management Handbook of Kenya Volume 11—Natural Condtions and Farm Management Information, 2nd ed.; Part II/A1(Western Kenya) and Part II/CI(Eastern Province); Ministry of Agriculture: Nairobi, Kenya, 2011; Volume II.
  99. Mills, J.A.N.; Kebreab, E.; Yates, C.M.; Crompton, L.A.; Cammell, S.B.; Dhanoa, M.S.; Agnew, R.E.; France, J. Alternative approaches to predicting methane emissions from dairy cows. J. Anim. Sci. 2003, 81, 3141–3150. [Google Scholar] [CrossRef]
  100. Ellis, J.L.; Kebreab, E.; Odongo, N.E.; Mcbride, B.W.; Okine, E.K.; France, J. Prediction of Methane Production from Dairy and Beef Cattle. J. Dairy Sci. 2007, 90, 3456–3466. [Google Scholar] [CrossRef]
  101. Hirooka, H. Systems approaches to beef cattle production systems using modelling and Simulation. Anim. Sci. J. 2010, 81, 411–424. [Google Scholar] [CrossRef] [PubMed]
  102. Turner, B.L.; Kasperson, R.E.; Matsone, P.A.; McCarthy, J.J.; Corell, R.W.; Christensene, L.; Eckley, N.; Kasperson, J.X.; Amy, L.; Marybeth, A.L.; et al. A framework for vulnerability analysis in sustainability science. Proc. Natl. Acad. Sci. USA 2003, 100, 8074–8079. [Google Scholar] [CrossRef] [PubMed] [Green Version]
  103. Debela, E.; Tolera, A.; Eik, L.O.; Salte, R. Nutritive Value of Morphological fractions of Sesbania sesban and Desmodium intortum. Trop. Subtrop. Agroecosyst. 2011, 14, 793–805. [Google Scholar]
  104. Fekadu, D.; Bediye, S.; Sileshi, Z. Characterizing and predicting chemical composition and in vitro digestibility of crop residue using near infrared reflectance spectroscopy (NIRS). Livest. Res. Rural. Dev. 2010, 22, 22029. Available online: http://www.lrrd.org/lrrd22/2/feka22029.htm (accessed on 7 March 2020).
  105. Muinga, R.W.; Topps, J.H.; Rooke, J.A.; Thorpe, W. The effect of supplementation with Leucaena leucocephala and maize bran on voluntary food intake, digestibility, live weight and milk yield of Bos indicus × Bos taurus dairy cows and rumen fermentation in steers offered Pennisetum purpureum ad libitum. Anim. Sci. 2010, 60, 13–23. [Google Scholar] [CrossRef]
  106. Zimmerer, K.; Lambin, E.; Vanek, S. Smallholder telecoupling and potential sustainabilit. Ecol. Soc. 2018, 23. [Google Scholar] [CrossRef] [Green Version]
  107. Masuda, K. Optimization Model for Mitigating Global Warming at the Farm Scale: An Application to Japanese Rice Farms. Sustainability 2016, 8, 593. [Google Scholar] [CrossRef] [Green Version]
  108. Intergovernmental Panel on Climate Change. IPCC guidelines for National Green House Gas Inventories: Agriculture, Forestry and Other Land Uses; Emissions from Livestock and Manure Management; IPCC: Geneva, Switzerland, 2006; Chapter 10; Volume 4. [Google Scholar]
  109. Murgueitio, E.; Calle, Z.; Uribe, F.; Calle, A.; Solorio, B. Native trees and shrubs for the productive rehabilitation of tropical cattle ranching lands. For. Ecol. Manag. 2011, 261, 1654–1663. [Google Scholar] [CrossRef]
  110. Campbell, B.M.; Thornton, P.; Zougmore, R.; Asten, P.V.; Lipper, L. Sustainable intensification: What is its role in climate smart agriculture? Curr. Opin. Environ. Sustain. 2014, 2014, 38–43. [Google Scholar] [CrossRef] [Green Version]
  111. Arslan, A.; Mccarthy, N.; Lipper, L.; Asfaw, S.; Cattaneo, A.; Kokwe, M. Climate Smart Agriculture? Assessing the Adaptation Implications in Zambia. J. Agric. Econ. 2015, 66, 753–780. [Google Scholar] [CrossRef]
  112. Kugelberg, S.; Bartolini, F.; Kanter, D.; Birgitte, A.; Pira, K.; Sanz-cobena, A.; Leip, A. Implications of a food system approach for policy agenda-setting design. Glob. Food Secur. 2021, 28, 100451. [Google Scholar] [CrossRef] [PubMed]
  113. Eakin, H.C.; Lemos, M.C.; Nelson, D.R. Differentiating capacities as a means to sustainable climate change adaptation. Glob. Environ. Chang. 2014, 27, 1–8. [Google Scholar] [CrossRef]
  114. Locatelli, B.; Pavageau, C.; Pramova, E.; Di Gregorio, M. Integrating climate change mitigation and adaptation in agriculture and forestry: Opportunities and trade-offs. Wires Clim. Chang. 2015, 6, 585–598. [Google Scholar] [CrossRef]
  115. Rogers, E. A prospective and retrospective look at the diffusion model. J. Health Commun. 2004, 9, 13–19. [Google Scholar] [CrossRef]
  116. Hopkins, D. The sustainability of climate change adaptation strategies in New Zealand’s ski industry: A range of stakeholder perceptions. J. Sustain. Tour. 2014, 22, 107–126. [Google Scholar] [CrossRef]
  117. Moser, S.C.; Ekstrom, J.; Kim, J.; Heitsch, S. Adaptation finance archetypes: Local governments’ persistent challenges offunding adaptation to climate change and ways to overcome them. Ecol. Soc. 2019, 24. [Google Scholar] [CrossRef]
Figure 1. A conceptual framework on role of risk on environmental externalities.
Atmosphere 12 01507 g001
Table 1. Social–economic characteristics for Kakamega and Bungoma Counties, Western Kenya.
KakamegaBungoma
Social Economic characteristic
Total Population1,867,5791,670,570
Households (HH)433,207358,796
Area (Size) in Sq. km30203023.9
Pop density (No. of persons)/km2618552
HH size (persons per Household4.34.6
% Poverty5052
% Ms use9572
Source: KNBS Census and Housing Report, 2019.
Table 2. Summary of Study Population Units, Sampling Method, and Data Collection Instruments.
Study Population UnitSampling
Method
Size (N)Data Collection
Instrument
Household HeadsMultistage400Questionnaire
Feed producersPurposive6Interview schedule
Agro-vet shopsPurposive13Interview schedule
FDG membersPurposive12Interview schedule
Farmer cooperative
managers
Purposive7Interview schedule
Advisory organisation
Managers
Purposive/census5Interview schedule
Table 3. Nutritional interventions practiced by farmers, Kakamega and Bungoma Counties, Kenya.
% Awareness% Adopted
Nutritional interventionKAKBGMKAKBGMOAW (%)OA (%)
Molasses252115122313.5
Minerals484527.516.346.516.3
Legume fodder571161
Potato vines254213.533.533.524.4
Grain residues402325331.514
Silage302832292.5
Hay76421395911
Ms9590878392.585
Napier (Deferred)857575658070
Source: Authors field data analysis. OAW; Overall awareness, OA; Overall adopted, KAK, Kakamega; BGM, Bungoma.
Table 4. Simulated methane emission levels (upper and lower limit) in CO2-eq 10−3 from maize-based rations.
Ratio of Stover to Supplement/Feed DM (g kg−1) Level
Ration type DM (g kg−1)1.00.90.80.70.60.5Mean
Whole Stover (930)887.7
432.8
857.8
407.7
827.9
382.5
798.3
357.3
768.4
332.2
738.5
307.0
813.1
369.9
Stover (top 890)874.8
422.3
846.3
397.8
817.7
374
789.1
349.9
760.6
325.3
732.0
301.6
803.4
361.8
Napier silage (468)617.2
207.1
617
206.0
615.1
203.0
613.7
202.0
612.3
200.6
611
199.6
614.4
189.7
Napier fresh (175)615.9
201.7
615.4
201.3
613.4
201.3
611.0
199.6
608.6
197.5
606.2
196.2
608.3
199.6
Desmodium (210)Na615.4
203.3
612
200.6
610.0
199.9
608.6
197.2
605.2
196.2
610.2
188.7
Leucaena (240)Na615.4
203.3
613.7
201.6
611.7
199.9
608.6
198.2
607.2
196.5
611.3
199.9
Sesbania (230)Na615.4
203.3
613.4
201.6
611.3
199.9
608.9
198.2
607.2
196.5
611.2
199.9
Calliandra (220)Na615.7
203.7
613.4
201.6
610.0
198.3
609.3
198.2
606.9
196.2
611
199.6
Potato vines (100)616.42
208.4
615.4
203.3
612.7
200.9
610.3
198.9
607.6
196.9
605.2
194.5
611.3
200.5
Mean (MBSWM)Na615.7
203.7
608.8
197.5
606.3
195.8
604.9
194.5
601.8
191.8
607.5
196.7
Mean for grain residue
mixture (MBSWG)
Na616.8
204.3
613.0
201.3
612.0
201.0
611.3
199.6
609.3
198.2
612.5
200.9
Mean MBSM with molasses (20% DM)Na615.4
203.3
613.0
201.6
611.0
199.6
608.6
197.9
606.6
195.8
610.9
199.6
Mean MBSMGNa616.1
203.7
613.0
201.3
611.7
199.9
610.0
198.9
607.9
197.2
611.7
200.2
Source: Author’s calculation based on literature data and field validation, 2019. Na—ration not nutritionally feasible based on various considerations such as antinutritive factors (i.e., tannin) content that renders the ration nutritionally impractical. SEM—Standard Error of Means, MBSWM—overall for Ms, legumes, and Napier, MBSM—MS with molasses, MBSWG—MS with maize grain (Simulated methane emissions in the numerator and denominator of each ration represent Upper and lower emissions respectively.
Table 5. Interplay of weather variability and price risks in dairy feeding strategies.
Feeding StrategiesSumMeanVariance
Ms25.433.187.51
Ms + L57.927.2434.55
Ms + Cs + M61.877.7340.51
NaP103.9612.99129.36
Nap + L43.535.4416.56
Nap + csc + M85.5910.7084.93
Ms + Nap43.135.3916.15
Ms + Nap + csc126.1915.77194.71
Ms + Nap + Csc + M143.5417.94254.54
Source: Author’s calculation based on field survey data among resource constrained farmers, 2019. Nap = Napier.
Table 6. Comparison of ecoefficiency between various dairy feeding strategies.
Feeding StrategiesMean Eco. Eff.
Ms113.4 ± 6.8
Ms + L277.4 ± 37.8
Ms + Cs + M296.7 ± 44.3
NaP501.5 ± 140.9
Nap + L206.7 ± 18.1
Nap + csc + M412.2 ± 92.6
Ms + Nap204.7 ± 17.7
Ms + Nap + csc609.6 ± 211.8
Ms + Nap + Csc + Nap693.4 ± 276.8
Source: Authors’ calculation from field data, 2019; Significant at p ≤ 0.05.
Publisher’s Note: MDPI stays neutral with regard to jurisdictional claims in published maps and institutional affiliations.

