Abstract
Nitrous oxide (N2O) is a potent greenhouse gas stemming mainly from nitrogen (N)-fertilizer application. It is challenging to quantify N2O emissions from agroecosystems because of the dearth of measured data and high spatial variability of the emissions. The eco-hydrological model SWAT (Soil and Water Assessment Tool) simulates hydrological processes and N fluxes in a catchment. However, the routine for simulating N2O emissions is still missing in the SWAT model. A submodule was developed based on the outputs of the SWAT model to partition N2O from the simulated nitrification by applying a coefficient (K2) and also to isolate N2O from the simulated denitrification (N2O + N2) with a modified semi-empirical equation. The submodule was applied to quantify N2O emissions and N2O emission factors from selected crops in two agricultural catchments by using NH4NO3 fertilizer and the combination of organic N and NO3− fertilizer as N input data. The setup with the combination of organic N and NO3− fertilizer simulated lower N2O emissions than the setup with NH4NO3 fertilizer. When the water balance was simulated well (absolute percentage error <11%), the impact of N fertilizer application on the simulated N2O emissions was captured. More research to test the submodule with measured data is needed.
1. Introduction
Nitrous oxide (N2O) is a potent greenhouse gas (GHG) that contributes to global warming and mainly stems from agricultural soils [1]. Agricultural activities are responsible for an estimated two-thirds of the total anthropogenic N2O emissions in the world [2].
To estimate the amount of N2O emitted from an agricultural field in the absence of measured data, the Intergovernmental Panel on Climate Change (IPCC) recommends estimating the N2O emissions as a fraction of the N input to the soil. This is known as the N2O emission factor (EF), which is defined as kg N2O-N kg−1 N input [3,4,5]. Initially, calculating the EF for N2O was based on a simple regression model established by Bouwman [6] who estimated the contribution of fertilizers encompassed 90% of the total N2O emissions. The IPCC thus proposed a unique EF for all agricultural soils, regardless of variations in soil management and climate [7]. An EF for N2O of 1.25 ± 1.0% of the applied N fertilizer amount was adopted in 1996 [3,8].
In 2006, after the data from 1215 measurements were analyzed by Stehfest and Bouwman [9], the IPCC revised the EF value of N2O and derived a value calculated as 0.01 kg N2O-N per kg N applied to a field (uncertainty range 0.003–0.03), which was valid for all fertilizer and manure types, application techniques, and land uses [4,10].
In 2019, based on a much larger number of measurements (~3000) [5], the IPCC refined the 2006 aggregated EF value of N2O, which is now deemed to be 1% of the total applied N fertilizer amount, with an updated uncertainty range of 0.1–1.8%. Furthermore, to highlight the role of different climate conditions on N2O emissions, the EF can be disaggregated according to wet and dry climatic zones, and in the wet climate zone can then be further disaggregated according to organic and mineral N fertilizer applied. In the dry climate zone, the fertilizer type is not differentiated.
Wet climates are defined to occur in temperate and boreal zones, where the ratio of annual precipitation to potential evapotranspiration is >1, and in tropical zones, where total annual precipitation is >1000 mm [5]. In wet climates, the N2O EF value is 0.6% of the organic N inputs (uncertainty range of 0.1–1.1%) and is 1.6% of the mineral N inputs (uncertainty range of 1.3–1.9%) [5]. In dry climates, the N2O EF value is 0.5% of the total organic and mineral N inputs (uncertainty range of 0–1.1%) [5].
In the absence of measured data, process-based simulation models offer an option to capture N2O emissions from agricultural fields under different management practices at different time steps (e.g., daily, monthly or yearly) and several scales (e.g., field, landscape or catchment). The governing processes to simulate N2O emissions from N fertilizers are manifold. The reactive N in mineral N fertilizers are ammonium (NH4+) and nitrate (NO3−). The NH4+ part of mineral fertilizers can be oxidized through the nitrification process to NO3− by Nitrosomonas and Nitrobacter, and thereby produce N2O gas as a by-product [11,12]. The percent of nitrified N lost as N2O varies with soil type with reported ranges lying anywhere between 0.01% and 95% [13].
Under anaerobic conditions, denitrification reduces the NO3−, part of mineral fertilizers (or the NO3− from the nitrification process), to nitric oxide (NO), then to N2O, and finally to dinitrogen (N2) gas [11]. Thus, N2O is an intermediate product in the denitrification process. The fraction of global N2O emitted from denitrification ranges between 0.02 and 0.37 [14].
Nitrification and denitrification are regulated by several field management practices and environmental factors [9,15,16]. The interaction of these factors increase the complexity and uncertainty of assessing N2O emissions at large spatial scales.
A number of system dynamic models have been developed to simulate N2O fluxes from agricultural soils. For a detailed description of these as well as their limitations see Wang et al. [12]. For example, the DAYCENT (Daily Century) and the DNDC (DeNitrification-DeComposition) models are two commonly used physically based, biogeochemical models that simulate N2O emissions at the plot or the field scale [17,18], and the SWAT (Soil and Water Assessment Tool) model can be used to simulate N2O emissions at the catchment scale [19,20,21,22,23,24,25].
The DAYCENT model simulates daily N2O, N2, and NOx (e.g., NO and NO2) emissions from nitrification and denitrification with the simulated soil water content, temperature, NH4+, NO3−, and respiration [18,26]. The DNDC model simulates N2O emissions by tracking different groups of microbes that are activated under several environmental conditions, including different temperature, moisture, pH, redox potential, and substrate concentration gradients in soils [27].
Somewhat different from these two biogeochemical models is the eco-hydrological SWAT model that simulates hydrological processes and crop growth at a larger (usually the catchment) scale to estimate the impacts of agricultural land use and the corresponding crop management practices on water, atmosphere and soil quality [19,28]. The advantage of using a hydrological model to simulate N2O emissions is the integration of several field crops in a defined area, and the resulting connectivity of the hydrological flow paths and subsequent N transformations in the area to quantify N2O emissions. As part of a larger study, we wished to obtain an integrated estimation of N2O (and other reactive N) emissions from various crops and their field management practices at the catchment scale. Therefore, the SWAT model was selected as the preferred modelling tool.
However, there are a few challenges for the SWAT model to simulate N2O emissions. For example, the model does not partition N2O from nitrification and treats the N2O + N2 outputs as a combined denitrification product. This grouping of N2O + N2 limits the ability of the SWAT model to simulate only the N2O fraction. In SWAT, nitrification is a function of soil temperature and soil moisture, while denitrification is a function of soil moisture, temperature, SOC, and soil NO3− [29]. A few studies have been undertaken to develop a SWAT N2O submodule to partition N2O emissions from the SWAT simulated nitrification and denitrification [20,21,22,23,24,25]. All the submodules use different approaches and equations.
For example, Yang et al. [22] integrated all the biogeochemical N2O emission algorithms from DAYCENT that were developed by Del Grosso et al. [30] and Parton et al. [18,26] into the SWAT model and did not use the SWAT default equations for simulating nitrification and denitrification based on SWAT simulated variables. The resulting SWAT-N2O model was applied to grain corn, switchgrass and brome grass fields in southwestern Michigan.
Furthermore, Wagena et al. [23] developed the SWAT_GHG model to assess N2O emissions from agroecosystems in North America. They integrated equations from Parton et al. [26], which were developed based on laboratory data and on data from Weier et al. [31], into the SWAT model to consider the impacts of soil temperature, soil moisture and pH on N2O emissions from the nitrification process. The SWAT_GHG model adopted equations from Parton et al. [26] to calculate denitrification and the N2/N2O ratio, and thereby considered the impacts of soil NO3−, SOC, and soil moisture. They also developed additional equations to include the impacts of soil pH on N2O emissions.
Shrestha et al. [24,25] estimated N2O emissions for catchments in Canada using SWAT by applying all equations from Parton et al. [26] into the SWAT model thereby did not use the initial equations in SWAT. Unlike the other two studies, Shrestha et al. [24,25] did not consider the impact of soil pH on denitrification and the N2/N2O ratio, since the SWAT model by default does not account for changes in soil pH. Also in their study, the only mineralized N was in the form of ammonium. However, SWAT adds the nitrogen mineralized from the active organic and fresh organic pools to the soil NO3− pool, which leads to N2O emissions from organic N input through the denitrification process.
Most recently, Gao et al. [20] established a database for N2O fluxes based on 4488 field measurements, and developed an empirical equation to simulate N2O emissions from an agricultural catchment in northeast China, specifically to predict N2O emissions from non-paddy fields. The N2O emissions from non-paddy fields are directly calculated with the simulated variables from SWAT of soil moisture, soil temperature and soil nitrogen [20].
Although several submodules exist for simulating N2O in the SWAT framework, they do not have a common agreement to simulate N2O emissions. The submodules developed by Yang et al. [22] and Wagena et al. [23] included soil pH. However, the changes in soil pH are not captured by the SWAT model. Furthermore, current studies show contradictory results regarding the impact of soil pH on nitrification and denitrification [12]. In addition, Yang et al. [22], Wagena et al. [23], and Shrestha et al. [24] adopted equations developed for the DAYCENT model from Parton et al. [26] to calculate nitrification and denitrification. Hydrological processes such as precipitation, infiltration, and runoff are particularly important in determining NO3− transformation and transportation, as well as N2O emissions. Thus, to simulate N2O emissions at the catchment scale, the N2O submodule should be ideally developed based on the variables simulated by a distributed hydrological model (e.g., soil NO3−, soil moisture, and SOC), such as the SWAT model and should partition N2O emissions directly from simulated nitrification and denitrification.
According to the estimation of the Environment Agency Austria carried out at the national level, in Austria in 2018, the N2O emissions from agriculture soils contributed 69% to the total national N2O emissions [32]. To our knowledge, only a few field studies [33,34,35] and modelling exercises [36] were undertaken to quantify N2O emissions from Austrian cropland at the field scale. Empirical and modelling studies on simulating N2O emissions at the catchment scale are few and therefore uncertainties in emissions from crop sites remain high.
In this study, we develop an N2O submodule based on the eco-hydrological SWAT model outputs to quantify the integrated N2O emissions and N2O EFs from two agricultural catchments (Melk and Zaya) with two N fertilizer regimes. We analyze the model performance and the impacts of management practices on simulating N2O emissions by comparing simulated N2O emissions with existing N2O data.
2. Methodology and Materials
2.1. The Case Study Catchments
The Melk and Zaya catchments were initially chosen as part of a large ongoing nationally funded project (NitroClimAT) in which N fluxes into the soil-water-atmosphere were evaluated. Both catchments are representative Austrian agricultural catchments within their respective main production region. These catchments were selected within the project framework to apply the SWAT model with the developed N2O submodule.
The Melk catchment (282 km2) and the Zaya catchment (522 km2), both of which are located in lower Austria (Figure 1), are two agricultural catchments with typical annual crops for the region. The percentages of cropland and pasture area in the Melk catchment are 63% and 12%, respectively, and in the Zaya catchment are 69% and 8%, respectively. The remaining areas in these two catchments are forest and urban. The main field crops grown in the Melk catchment are winter wheat, grain corn, soybean, and spring barley, while the main crops grown in the Zaya catchment are winter wheat, spring barley, sugar beet, and grain corn (INSPIRE data available from www.inspire.gv.at). Table 1 shows the site characteristics of both catchments.
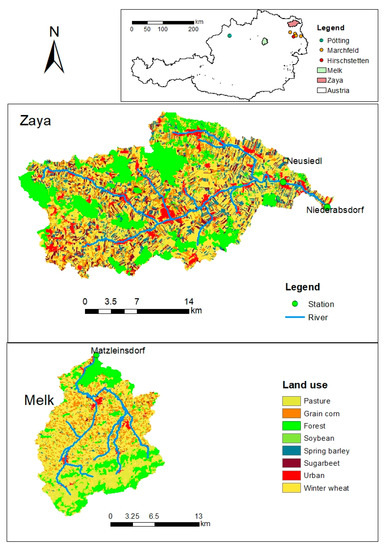
Figure 1.
The land use maps with crop categories according to SWAT and river distribution in the Melk and Zaya catchments. Matzleinsdorf and Niederabsdorf are the outlet gauges of the Melk catchment and the Zaya catchment, respectively. Pötting, Hirschstetten and Marchfeld are regions where we have measured N2O data and simulated N2O data (from the DNDC model), respectively.

Table 1.
Characteristics of the Melk and Zaya catchments. The soil information is the average value of all soil classes in the first layer (0–300 mm) of the two catchments collected from SoilGrids (https://soilgrids.org) (accessed on 8 August 2018). Daily air temperature, precipitation and other weather data was obtained from ZAMG (https://www.zamg.ac.at/cms/de/aktuell) (accessed on 19 December 2018) and eHYD (https://ehyd.gv.at/) (accessed on 6 August 2018). The resolution of dominant texture is 250 m × 250 m.
2.2. The SWAT Model and Model Setup
The SWAT model is a process-based model that simulates the impacts of agricultural management practices on the hydrology and water quality most frequently at the catchment scale [19]. In the SWAT model, a catchment is partitioned into a number of subbasins, which are further divided into HRUs (hydrological response units). HRUs are areas that have the same land cover, soil, and slope [19]. When specific crops are examined, these are analyzed at the HRU level, on the various soil and slope types on which they occur. The SWAT model implements routines of the EPIC crop growth submodule to simulate the annual variation in crop growth [29].
A SWAT model setup requires multiple input data, including a DEM (digital elevation model), a soil map (with soil properties), climate data, a land use map, as well as data on field management operations. The link to detailed input data sources and input data preparation for the Melk and Zaya catchments refers to Data Availability Statement.
In this study, the SWAT model in the Melk catchment was set up with two N fertilizer input data (Table 2), while the SWAT model was only set up for the Zaya catchment with the same N fertilization input data as from Melk M2 (Table 2). The M1 is an optimistic setup based on best-management practices and most likely under represents the amount of fertilizer that farmers apply to their fields. The N fertilizer type in M1 that is simulated in the SWAT model is input as NH4NO3. The amounts and types of applied N fertilizer in M2 are an attempt to represent the actual N fertilization regimes of farmers based on N-balance calculations. The N fertilizer types simulated in M2 are mineral N in the form NO3− and organic N.

Table 2.
Main crops categories, area and the amounts of applied N fertilizer in the Melk and Zaya catchments.
The SWAT model simulates N fluxes by several processes (e.g., mineralization, volatilization, nitrification, and denitrification). For example, mineralization converts organic N to NO3− [29]. Through nitrification and volatilization, NH4+ is converted to NO3− and NH3, respectively. The SWAT model simulates the total amount of nitrification and NH3 volatilization, and then partitions the nitrification from volatilization [29]. Equations for simulating and partitioning nitrification in the SWAT model are provided in Equations (S1)–(S11).
The SWAT model simulates the amount of NO3− lost to denitrification with two equations (Equations (1) and (2)) [29]. These calculate the total gases flux (N2O + N2) resulting from denitrification:
where is the amount of nitrogen lost to denitrification per area given in kg N ha−1. is the amount of NO3− per area in kg N ha−1 and calculated from the depth of the soil layer, ly. is the rate coefficient for denitrification. is the impact of soil temperature on denitrification. is the amount of organic carbon in the layer (%). is the denitrification water factor for layer ly, and is the threshold value of water factor for denitrification to occur. Equations for the effect of soil temperature and soil water on denitrification are provided in Equations (S12) and (S13).
To check the performance of these existing N2O submodules, we wrote all equations governing the N2O emissions from Parton et al. [26], Wagena et al. [23], and Shrestha et al. [24] in the “R” programming language. We then assigned values to each of the environmental factor in the equations to determine their impact on N2O emissions. The environmental factors include soil NO3−, SOC, and WFPS, and their ranges plotted were as follows: 0–350 ug N g−1, 0–35 kg C ha−1 d−1, and 0–1, respectively. We thereby determined that a bracket was misplaced in the equation of Parton et al. [26] because it provided negative values when soil NO3− concentration in the range of 0–350 ug N g−1 were used in the formula to calculate the N2/N2O ratio (Figure S1A). We corrected this as shown in Equation (5). Wagena et al. [23] applied the initial equation in their N2O module as found in Parton et al. [26]; however, Shrestha et al. [24] also corrected Parton et al.’s equation.
We furthermore found that the equation for calculating the impact of soil moisture on the N2/N2O ratio in Wagena et al. [23] contained a typo, due to the incorrect position of the exponent (Figure S1B).
2.3. The N2O Submodule
The N2O submodule was developed in the “R” programming language and was based on using the outputs of nitrification and denitrification from the SWAT model version 2012. The link to related R codes and used R packages refers to Data Availability Statement.
To partition the N2O from nitrification and from denitrification, we firstly modified the SWAT source code file “nminrl.f” to obtain the simulated nitrification in “output.hru” file, and then partitioned the by-product N2O from nitrification using a fraction (called K2) of nitrified N lost as N2O. Secondly, the denitrification output of the SWAT model was partitioned using a modified formula from Parton et al. [26] to differentiate N2O from total gaseous products of denitrification (N2O + N2). Figure 2 shows the N2O related processes in the SWAT model and the SWAT N2O submodule, where the red-dashed line outlines the N2O submodule was developed for SWAT.
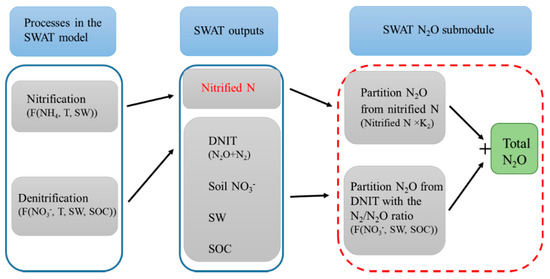
Figure 2.
Schematic diagram of the processes included in the SWAT model and the SWAT N2O submodule. Nitrified N in a red color indicates the SWAT model simulates the nitrified N but can only be examined in the output file after the SWAT source codes were modified. Abbreviations: F: function. T: soil temperature. SW: soil water. SOC: soil organic carbon. DNIT: denitrification. K2: the fraction of nitrified N lost as N2O.
The governing equations in the N2O submodule adopted together with SWAT output to calculate N2O emissions are provided below.
Partitioning N2O from the SWAT simulated nitrification is carried out as follows:
where is the N2O flux from nitrification (kg N ha−1 d−1), is the rate of nitrification (kg N ha−1 d−1), and K2 is the fraction of nitrified N lost as N2O (%). The K2 value was obtained from the literature for various soil types listed in Table S1. The value of K2 used in the submodule is set as 0.02 based on the results of the extensive literature review (Section 3.3).
For the simulated denitrification process, part of the N2O is converted to N2 under anaerobic conditions. Equation (4) modified from Parton et al. [26] was used to calculate the N2/N2O ratio ():
where , , and are the environmental impacts of soil NO3−, soil C, and soil moisture, respectively, on the ratio N2/N2O. We corrected the equation in Parton et al. [26] with the missing bracket. Thus, the final equations for , , and are as follows:
where NO3 is soil NO3− (ug N g−1), C is SOC (kg C ha−1d−1), WFPS is water-filled pore space (%), SW is soil water content (%), is soil bulk density (g cm−3).
Therefore, the amount of partitioned N2O from N2 can be calculated as
where is the N2O emissions from the denitrification process (kg N ha−1 d−1).
In our developed SWAT N2O submodule, the N2O emissions (kg N ha−1 d−1) from nitrification and denitrification are finally given by
2.4. Calibrating the SWAT Model
We performed a calibration/validation for the three SWAT model setups (M1, M2, and Zaya). The N2O submodule was not calibrated during this step.
We firstly perform a sensitivity analysis on selected parameters to determine the most sensitive parameters that control the model performance, cause uncertainty, and should be calibrated. The parameters for the sensitivity analysis, their definition, and initial ranges are listed in Table S5.
Simulations with 1000 parameter sets were performed by using the SWATplusR package, which integrates the SWAT model into users’ modeling workflows in “R” [37]. The parameter sets were sampled using Latin hypercube sampling within the parameters’ ranges (Table S5) [38] using the R package “lhs” (https://CRAN.R-project.org/package=lhs) (accessed on 12 March 2019). The sensitive parameters were selected based on the analysis of cumulative distribution with the PAWN approach [39]. In the PAWN approach, the Kolmogorov–Smirnov statistic is applied to measure the distance between the cumulative probability distributions of an output variable when all parameters are perturbed and when all but the analyzed parameters are perturbed. The performed sensitivity analysis implements the approximation of PAWN that is outlined by Pianosi and Wagener [39].
The SWAT model calibration and validation were performed at a daily time step with a warm-up period of 5 years. For the Melk catchment, the calibration was conducted simultaneously for discharge and NO3−-N concentration in the M1 setup. In the M2 setup and for the Zaya catchment, the parameters were calibrated sequentially first for discharge and then for NO3−-N concentration. The objective function used during the calibration and validation was the Kling-Gupta Efficiency (KGE) [40]. The calibration and validation results were also evaluated by the percentage of bias (PBIAS) [41].
In the Melk catchment, the gauging stations for both discharge and NO3−-N concentration measurements are located at the outlet, at Matzleinsdorf, and in the Zaya catchment, the gauging stations for measured discharge and NO3−-N concentration are located at Niederabsdorf and Neusiedl, respectively (Figure 1).
After running the validated SWAT model, we evaluated the model performance for the whole catchment by calculating the water balance for the catchment at the yearly time step, verifying the evapotranspiration (ET) and checking simulated crop yields against measured yields.
The water balance is calculated from the SWAT variables as follows [29]:
where PREC is the amount of precipitation (mm); Qsurf is the amount of surface runoff (mm); ET is the amount of evapotranspiration (mm); ∆SW is the change in soil water content (mm); PERC is the amount of water entering the vadose zone from the soil profile (mm) and GW_Q is the amount of groundwater contribution to streamflow (mm). Irrigation was not implemented in the SWAT model for either of the catchments.
PREC= Qsurf + ET + ∆SW + PERC − GW_Q,
The Penman–Monteith equation was selected in SWAT for calculating potential ET [29]. To verify the ET with independent data, the remote sensed ET data from ALEXI (Atmosphere-Land Exchange Inverse) was compared with the simulated ET in the Melk and Zaya catchments at the monthly time step.
The remote sensed ALEXI model with 5 × 5 km resolution estimates daily ET data. The ALEXI model is based on a surface energy balance modeling system, and is governed primarily by remote sensing inputs of land surface temperature [42,43,44]. Cawse-Nicholson et al. [45] quantified the uncertainty of the ALEXI model for estimating ET to have a mean offset of 0.01 mm day−1.
The SWAT simulated crop yields for grain corn, winter wheat, spring barley and soybean were compared with measured crop yields in Austria for the years 1993–2018 (Bundesanstalt für Agrarwirtschaft und Bergbauernfragen data available from https://j1dev.agrarforschung.at/index.php?lang=de) (accessed on 25 April 2020).
2.5. Evaluating the N2O Submodule
Since the two study catchments were chosen as part of a larger on-going project, a thorough research was undertaken to find measured N2O data in the Melk and Zaya catchments; however, to the best of our knowledge, no measured N2O data from agricultural field crops was available in these two catchments.
Therefore, to evaluate the submodule performance for simulating N2O emissions, we compared the simulated N2O emissions with available measured data in nearby adjacent regions. Measured N2O data from a proximate site located in Pötting, Upper Austria, located about 140 km away from the outlet gauge in the Melk catchment (Figure 1), was compared with selected crops in the Melk catchment. Pötting is dominated by a silty loam soil type and wet climate that are similar to the input data in the Melk catchment (Table 3). The N2O data in Pötting was measured during 2013 from a grain corn field at an hourly time step by using a closed chamber method made of PVC cylinders (10 cm height, 20 cm diameter) inserted 3 cm deep into the soil [35].

Table 3.
Site characteristics of Pötting, Melk, Zaya, Hirschstetten, and MF3.
Similarly, measured N2O data from an outdoor lysimeter experiment in Hirschstetten, Vienna, located about 46 km away from the Zaya outlet gauge (Figure 1), was compared to the simulated N2O emissions from crops in the Zaya catchment. Hirschstetten has a dry climate similar to the Zaya catchment (Table 3). The measured N2O data from spring barley and winter wheat in Hirschstetten were collected in 2018 and 2019, respectively.
We furthermore compared the simulated N2O emissions in the Melk and Zaya catchments with simulated N2O emissions from the DNDC model used to simulate N2O emissions from the Marchfeld region (Figure 1) for the years 2006–2011 [36]. From all the sites simulated with DNDC in Kasper et al. [36], we chose the site that had the most similar soil properties with the Melk and Zaya catchments to compare our simulated N2O emissions. This site is referred to as “MF3” in Kasper et al. [36]. The percentage of clay, silt and sand in Melk (23%, 45%, and 32%, respectively) and Zaya (28%, 49%, and 23%, respectively) are similar to MF3 (28%, 48%, and 24%, respectively). The MF3 site has a dry climate. Wet and dry climate are defined based on the definition in the IPCC report [5].
The similarity of the site characteristics between Pötting and Melk, between Hirschstetten and Zaya, and between MF3 and Melk/Zaya are provided in Table 3.
The measured hourly N2O emissions in Pötting and Hirschstetten were both aggregated to the daily time step, respectively, to compare with the corresponding simulated daily N2O emissions from the submodule. Linear interpolation was used to generate the cumulative N2O flux during the crop growing season [46,47,48]. In the Zaya catchment for each of the years 2006 to 2015, a one-way analysis of variance (ANOVA) was performed in R to analyze the effect of daily precipitation on daily N2O emissions during the growing season of spring barley (from approximately 22 March to 1 August each year).
The simulated N2O emissions from the submodule together with the SWAT applied N fertilizer amounts to the crop categories were used to calculate the EF for N2O in the Melk and Zaya catchments. The EFs were compared with the aggregated and disaggregated IPCC default EF values for N2O.
3. Results
3.1. Sensitivity Analysis, Calibration and Validation
The most sensitive parameters for the M1 setup were ALPHA_BF (base flow recession constant), CN2 (curve number), GWQMN (threshold water level in shallow aquifer for base flow), OV_N (Manning’s value for overland flow), SNO50COV (fraction of SNOCOVMX that provide 50% cover), CDN (rate coefficient for denitrification), NPERCO (nitrate percolation coefficient), and RCN (concentration of nitrogen in the rain). These most sensitive parameters were further calibrated. For the M2 and Zaya setups, all parameters in Table S5 were calibrated.
The calibration and validation results and time periods for all setups are shown in Table 4. In the M1 and M2 setups, the simulated NO3− in the stream are lower than the measured NO3− concentrations (Figures S4 and S5) and one main reason is the limited availability of the observed NO3−-N concentration data, for example, Gungor et al. [49] and Ikenberry et al. [50] highlighted the underestimation of NO3−. The discharge peaks for the years 1994, 1996, 1997, and 2002 were not well captured (Figure S2), which further affects the simulation of in-stream NO3− simulation [51]. As well, the sensitive parameters, such as ALPHA_BF and OV_N in the M1 setup, caused the underestimation of discharge. CDN, NPERCO and RCN are sensitive parameters in the M1 setup that influence the simulation of the mass of NO3− in water.

Table 4.
Model performance for the daily calibration and validation for discharge (Q) and NO3−-N concentration (N).
In the Zaya catchment, the simulated discharge and NO3− were both underestimated (Figures S6 and S7). One reason may be because irrigation was not included in the model, whereas farmers in the neighboring Marchfeld region commonly practice irrigating spring barley and winter wheat during the growing season [36].
3.2. Evaluation of the Calibrated and Validated SWAT Model
3.2.1. Water Balance
The SWAT model performed better in some years than in others, which could overall be determined by examining the annual water balance from 1985 to 2015 for each setup (M1, M2, and Zaya). Based on 31 simulation years, the percentage errors of water balance in the Melk catchment with M1 and M2 setups ranged from −5.6% to 3.0% and −11.8% to 3.6%, respectively. The percentage error of water balance in the Zaya catchment ranged from −38.7% to 21.4% (Tables S6–S8). Ideally, the long-term water balance should be 0% whereby the input and output components balance each other. Here, we use an annual water balance 0% as one additional indicator of good hydrological model performance.
3.2.2. Remote Sensed and Simulated ET
Compared to remote sensed ET from the ALEXI model, the SWAT model underestimated ET for higher values (above 50 mm) in the Melk catchment, and overestimated ET for smaller values (below 25 mm) in the Melk catchment with M2 setup (Figure 3A). Overall, the SWAT model could simulate ET quite well for the Melk catchment with a relative coefficient R2 for the M1 and M2 setups of 0.90 and 0.94, respectively.
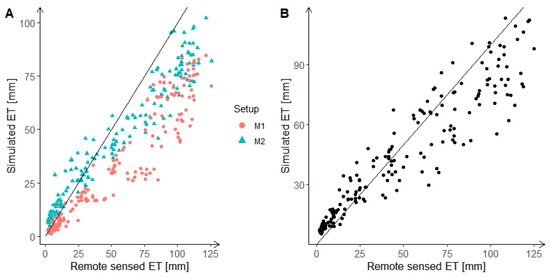
Figure 3.
Scatter plot for simulated and remote sensed monthly ET for the years 2001–2015 in the Melk catchment (A) and Zaya catchment (B). The black line is the reference line with slope 1.
In the Zaya catchment, although the R2 of the SWAT simulated ET and ALEXI remote sensed ET was 0.89, the SWAT model underestimated ET for larger values (above 50 mm) and tended to overestimate ET for smaller values (below 25 mm) (Figure 3B).
3.2.3. Measured and Simulated Crop Yields
The main crop yields from SWAT were compared to available measured data at the district level. Figure 4, Figure 5 and Figure 6 show simulated crop yields in the Melk and Zaya catchments at the HRU level compared to reported yields for the years 1993–2015. For the Melk M1 setup, the spring barley yields were consistently and grossly overestimated (Figure 4). The BARL category in SWAT included several other crops that cover a wide range of yields (Table S2), for example, in addition to spring grains, the BARL category included flax, buckwheat, and quinoa. Although the SWAT simulated yields for CORN, SOYB, and WWHT varied across the HRUs, the median of simulated crop yields from all HRUs fit the measured crops yields rather well (Figure 4 and Figure 5).
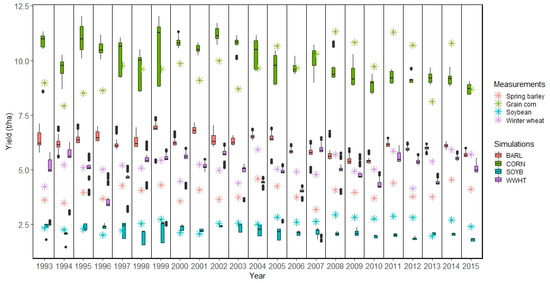
Figure 4.
Measured and simulated crop yields at the HRU level in the Melk catchment for M1 setup. The SWAT simulated crops BARL (spring barley), CORN (grain corn), SOYB (soybean), and WWHT (winter wheat) refer to Table S2.
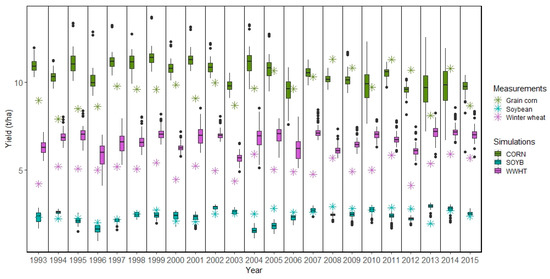
Figure 5.
Measured and simulated crop yields at the HRU level in the Melk catchment for M2 setup. The SWAT simulated crops CORN (grain corn), SOYB (soybean), and WWHT (winter wheat) refer to Table S3.
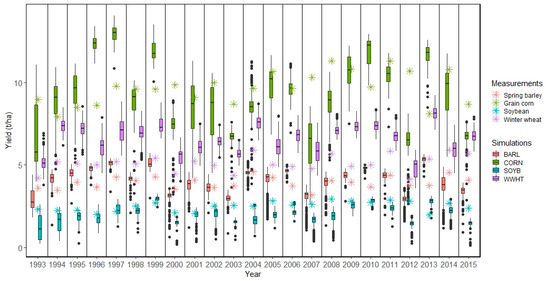
Figure 6.
Measured and simulated crop yields at the HRU level in the Zaya catchment. The SWAT simulated crops BARL (spring barley), CORN (grain corn), SOYB (soybean), and WWHT (winter wheat) refer to Table S4.
For the Zaya catchment, not including irrigation in the SWAT model may have been a reason for some of the deviations in simulated yields especially for grain corn (Figure 6).
3.3. The Fraction of Nitrified N Lost as N2O
N2O is the by-product of the nitrification process. After the N flux from the nitrification process is simulated, the fraction (K2) that partitions N2O emissions from nitrification was applied to the SWAT N2O submodule (Figure 2).
The fraction of nitrified N lost as N2O varies with soil type (Table S1). The Melk catchment was set up with SWAT using input soil data from SoilGrids in which the soil texture for the entire catchment was simulated as one soil type, namely, silt loam (Table 1). Literature values for the fraction K2 measured from a similar soil texture were collected (Table 5) and the median value of the K2 was calculated to be 0.02. This value was applied as the fraction K2 value for the Melk catchment. Wagena et al. [23] also set the K2 value to 0.02, based on measured N2O data in their study area.

Table 5.
The fraction K2 collected from literature, which has a similar soil texture with the Melk catchment.
For the SWAT model setup in the Zaya catchment, the mineral N fertilizer applied did not contain NH4, the simulated nitrification was zero and we did not specifically determine the fraction K2 for the Zaya catchment.
3.4. Simulated N2O Emissions and the EFs for N2O
The N2O submodule was applied to estimate N2O emissions for the years 2006–2015 from the following dominant crops in the Melk catchment: winter wheat, grain corn, spring barley and pasture for M1 and M2 setups (Table 6). In the Zaya catchment, N2O emissions from the main crops winter wheat, spring barley, grain corn and sugar beet were examined (Table 6). The ranges of simulated annual N2O emissions in the Zaya catchment varied widely with crops (Table 6). The largest simulated N2O emissions in the M1, M2 and Zaya setups are from grain corn, soybean and sugar beet, respectively.

Table 6.
Simulated annual N2O emissions (N kg ha−1) and calculated EFs for N2O (%) for the crops in the Melk and Zaya catchments for the years 2006–2015.
3.5. Comparison of Simulated N2O Emissions with Measured N2O
We are fully aware that it is not possible to directly compare the N2O emissions from different sites to each other, since the timing and absolute values of N2O emissions will be different, as they depend on the local weather, soil characteristics, and field management practices. In this study, we want to compare the magnitude of emissions and the emission trends from similar crops grown on similar soil.
3.5.1. The Melk Catchment
The amount and type of applied N fertilizer in Pötting, M1 and M2, are listed in Table 3. The measured N2O emissions and the simulated N2O emissions in 2013 from the HRUs with grain corn in the M1 and M2 setups were plotted to examine the trends of simulated N2O emissions in the Melk catchment (Figure 7).
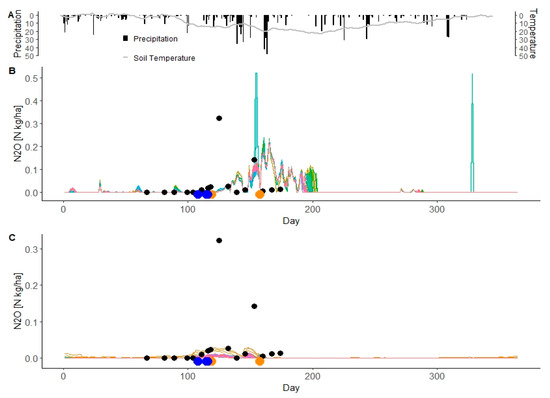
Figure 7.
Simulated N2O emissions from grain corn in the Melk catchment at the HRU level (color lines) and measured N2O emissions (black points) from grain corn in Pötting in 2013 (A). (B,C) are M1 setup and M2 setup, respectively. Blue points indicate the dates of N fertilizer application in Pötting and orange points show the N fertilization in the SWAT simulations.
The low spring N2O emissions from grain corn in the M1 and M2 setups in the first 120 days of the year are covered well, but the peak of N2O emissions after fertilizer application (real and simulated) are not captured by SWAT. During the remainder of the year for the M1 setup, the simulated N2O emissions from most grain corn HRUs show more peaks and are higher than the measured N2O emissions. For the M2 setup, the two main peaks of N2O emissions from grain corn were not captured by SWAT (Figure 7). The trends and timing for the low values were captured. Overall, the M2 setup had lower fluxes than the M1 setup (Figure 7).
The measured N2O emissions during the crop growing season were calculated by using linear interpolation, from these values, the average daily measured N2O emissions were calculated. Figure 8 shows the average measured daily N2O and the median, maximum and minimum values of simulated daily N2O emissions. Compared to measured daily N2O emissions, the simulated daily N2O emissions from grain corn in the M1 and M2 setups were lower by 5.37 and 12.27 N g ha−1, respectively. However, the ranges of M1 and M2 simulated daily N2O covered the measured daily N2O.
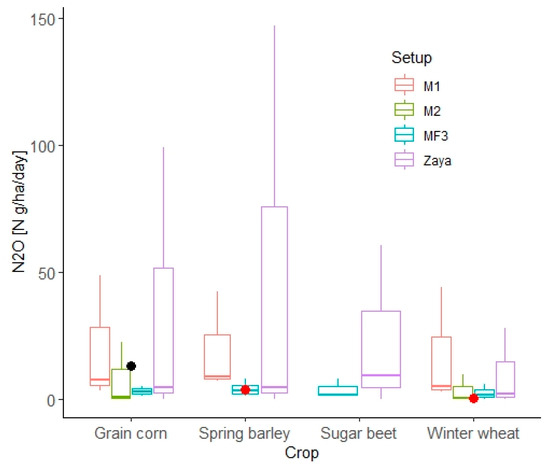
Figure 8.
The comparison of average simulated daily N2O and average measured daily N2O during the growing season. The boxplot shows the median with hinges on the 25% and 75% quantiles. Black point indicates measured average daily N2O in Pötting. Red points indicate measured average daily N2O in Hirschstetten.
3.5.2. The Zaya Catchment
In Hirschstetten in 2018, the measured N2O emissions from spring barley were obtained after it was planted, after the N fertilizer was applied and after a heavy rainfall [63]. The N2O emissions from winter wheat were measured in 2019 after N fertilizer was applied and after the harvest [64]. Precipitation was applied during the growing season to spring barley 346 mm and to winter wheat 352 mm [63,64].
From the SWAT simulations, two years (2009 and 2013) with a good performing model (i.e., when the absolute water balance was <11%) and two years (2014 and 2015) with bad performing model (i.e., when the absolute water balance was >11%) were selected to check the daily N2O emissions from spring and winter wheat. For the years 2009 and 2013 the percentage errors of simulated water balance are 8.1% and 0.0%, respectively. The simulated N2O emissions occurred mainly during the crop growing season, after N fertilizer application, although the impact of N fertilizer application on N2O emissions was clearer for spring barley (Figure 9A,B and Figure 10A,B). For two years in which the simulated water balance was poor (in 2014 and 2015 with 21.4% and −23.8%, respectively), the impact of N fertilizer application on N2O emissions could not be captured (Figure 9C,D and Figure 10C,D).
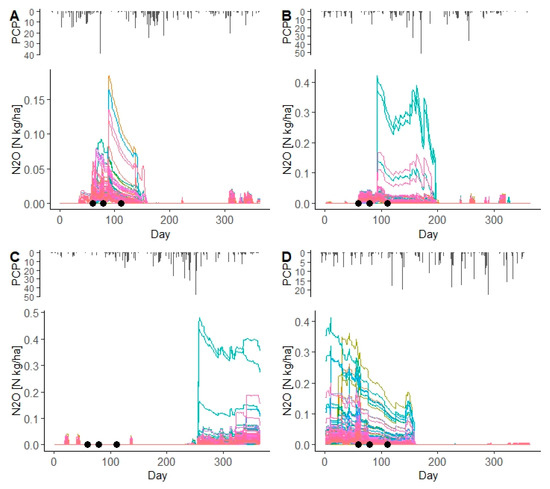
Figure 9.
Simulated N2O emissions (color lines) from BARL HRUs in the Zaya catchment for the years 2009 (A), 2013 (B), 2014 (C), and 2015 (D). PCP is daily precipitation (mm). Black points indicate the dates of N fertilizer application for the setup in the Zaya catchment.
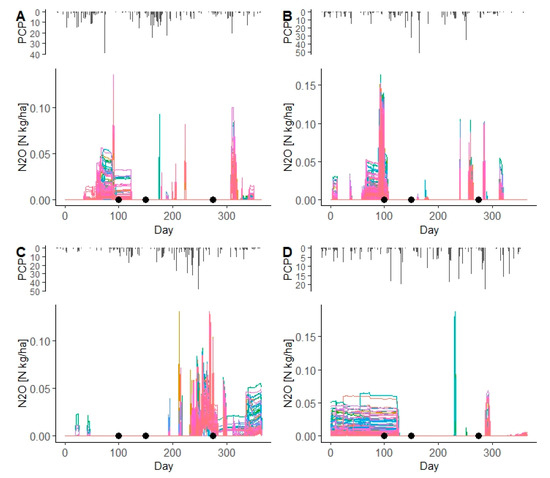
Figure 10.
Simulated N2O emissions (color lines) from WWHT HRUs in the Zaya catchment for the years 2009 (A), 2013 (B), 2014 (C), and 2015 (D). PCP is daily precipitation (mm). Black points indicate the dates of N fertilizer application for the setup in the Zaya catchment.
The simulated average daily N2O from spring barley and winter wheat in the Zaya catchment were 0.66 and 1.6 N g ha−1 higher, respectively compared to the average measured daily N2O emissions from spring barley and winter wheat in Hirschstetten (calculated based on linear interpolation) (Figure 8).
3.6. Comparing Simulated N2O Emissions with DNDC Simulations
For the M1 setup in the Melk catchment, the same type of N fertilizer, namely, NH4NO3, was also applied in the DNDC model for MF3 in Kasper et al. [36] (Table 3). The SWAT simulated daily N2O from grain corn, winter wheat, and spring barley were higher by 4.73, 3.54, and 5.5 N g ha−1, respectively, compared with the DNDC simulated N2O in MF3 (Figure 8). For the M2 setup, the applied N fertilizer for grain corn and winter wheat were higher by 10.3 and 18.8 kg ha−1, respectively, than the N fertilizer application in MF3 (Table 3). However, the median values of simulated average daily N2O emissions from grain corn and winter wheat were lower by 2.17 and 1.39 N g ha−1, respectively, than the simulated N2O emissions in MF3 (Figure 8).
In the Zaya catchment, the simulated daily N2O emissions from grain corn, winter wheat, spring barley, and sugar beet were higher by 1.62, 0.26, 1.56, and 7.32 N g ha−1, respectively, than simulated daily N2O emissions in MF3, regardless of the amount of fertilizer applied (Figure 8).
3.7. EFs for N2O for the Melk and Zaya Catchments
Using the 31 years of climate data in the simulation period, the ratio of annual precipitation/potential evapotranspiration is calculated to be 1.18 for the Melk catchment and 0.66 for the Zaya catchment. Melk is considered to be a wet climate, and Zaya is in a dry climate zone. According to IPCC, the description “mineral N” includes both the category of mineral N as well as the category of a fertilizer mixture, which includes both mineral and organic N [5]. The simulated N2O EFs from the Melk catchment were compared with the aggregated IPCC default N2O EF value (1%) and disaggregated IPCC default N2O EF for wet climate applied with mineral N (1.6%) (Figure 11A). The simulated N2O EFs from the Zaya catchment were compared with the aggregated IPCC default N2O EF value (1%) and disaggregated IPCC default N2O EF for dry climate (0.5%) (Figure 11B).
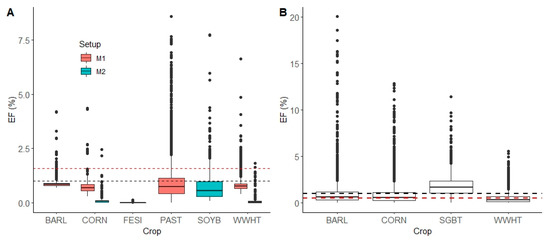
Figure 11.
Boxplots of the simulated N2O EFs from the main crops in the Melk (A) and Zaya (B) catchments for all HRUs for 2006–2015. The boxplot shows the median with hinges on the 25% and 75% quantiles. The black dashed line indicates the aggregated IPCC default N2O EF value 1%. The red dashed line in (A) indicates the disaggregated IPCC default N2O EF for wet climate (1.6%) and in (B) indicates disaggregated IPCC default N2O EF value 0.5% for dry climate. The crops included in BARL (spring barley), CORN (grain corn), FESI (intensively managed pasture), PAST (pasture), SOYB (soybean), WWHT (winter wheat), and SGBT (sugar beet) are listed in Tables S2–S4.
The median simulated N2O EFs in the Melk catchment in the M1 and M2 setups are lower than the aggregated and disaggregated IPCC default values (Figure 11A). Particularly, the N2O EFs with M2 setup are much lower than the N2O EFs. The median simulated N2O EFs in the Zaya catchment for BARL, CORN and WWHT were between the aggregated and disaggregated IPCC values and showed fairly good agreement with the IPCC calculations. However, the outliers for some HRUs and years showed much higher values, with EFs up to 20%.
4. Discussion
4.1. Model Performance for Simulating N2O Emissions
In the M1 setup, the SWAT simulated average daily N2O during the growing season from grain corn was 70% lower than the measured daily N2O in Pötting (Figure 8). Aggregating measured hourly N2O to the daily level during the growing season in Pötting and the linear interpolation method both tend to overestimate the N2O emissions [48,65]. In addition, the M1 simulated N2O showed more frequent peaks than the measured N2O data in Pötting (Figure 7). The reasons are (1) more than 35 kg ha−1 N fertilizer was applied to the grain corn in the M1 setup, which contributes to more N2O emissions (Table 3, Figure 8). (2) The dates of N fertilizer application in the M1 setup were split according to different crop growing stages (Figure 7), which influenced the efficiency of fertilizer use and N2O emissions [66]. (3) The samples of N2O measurements were very few, which leads to the missing of peaks of N2O emissions [8].
As well, the average daily N2O emissions from grain corn, winter wheat, and spring barley simulated with the M1 setup were 62%, 70%, and 64% higher, respectively, compared to simulated N2O emissions in Kasper et al. [36] (Figure 8). The reasons are (1) the N fertilizer application for grain corn, winter wheat and spring barley in the M1 setup were 47.6, 54, and 75 kg ha−1, respectively, higher than MF3 (Table 3). (2) During the comparison period, the Melk catchment had an average of 85 mm more precipitation annually than the area where DNDC was simulating N2O. Therefore, the N2O emissions were correspondingly higher in the Melk during this period. (Table 3) [67].
In the M2 setup, the simulated average daily N2O emissions from grain corn were 12.27 and 2.17 N g ha−1 lower than measured daily N2O emissions in Pötting and simulated daily N2O in MF3, respectively. The M2 simulated daily N2O from winter wheat was 1.39 N g ha−1 lower than MF3 simulated by DNDC (Figure 8). The type of N fertilizer used as input in the M2 setup influenced the simulated N flux in the SWAT model. In the M2 setup, the N fertilizer is a combination of organic N and mineral fertilizer (NO3−). In the SWAT model, the organic N is added to the soil NO3− through the mineralization process, and then NO3− is reduced to N2O or N2 by denitrification [29]. In the M2 setup, the N2O emissions occur, therefore, only during the denitrification process. The denitrification parameter (CDN) was set at a very low value in the M2 setup during the calibration to meet the in-stream NO3− concentration data (Table S5), as a result, low denitrification, N2O emissions and N2O EFs were simulated (Figure 8 and Figure 11A).
For soybean in the M1 setup, no N fertilizer was applied to this crop; however, in the M2 setup, N fertilizer was applied to soybean (33 kg ha−1), which caused high simulated N2O emissions. Overall, they were the highest in soybean compared to grain corn and winter wheat. However, the soybean yields were not significantly improved with N fertilizer application in the SWAT model.
For both M1 and M2 setups, the simulated N2O emissions mainly occurred during the crop growing season and after N fertilizer application, which fits the findings based on measured N2O data [35].
In the Zaya setup, the simulated average daily N2O emissions were higher than measured daily N2O in Hirschstetten (16.5% and 1000% higher for spring barley and winter wheat, respectively) (Figure 8). Simulated daily N2O for grain corn, winter wheat, spring barley and sugar beet were higher by 56%, 17%, 50%, and 430%, respectively, than MF3 simulated by DNDC (Figure 8).
The type of N fertilizer for the Zaya setup is the same as the M2 setup, and simulated N2O emissions occurred only by denitrification. The denitrification parameter CDN was also set at a low value (Table S5). However, the simulated N2O emissions in the Zaya catchment were higher than the M2 setup (3.79 and 1.65 N g ha−1 day−1 higher for grain corn and winter wheat, respectively). The M2 setup had more N fertilizer application, silt loam soil as input and more than 393 mm annual precipitation (Table 3). The positive relationships between N2O emissions and N fertilizer application, soil texture and precipitation had been described previously, for example, Wang et al. [12].
As Figure 9 and Figure 10 show, the impact of N fertilizer application on simulated N2O emissions from spring barley and winter wheat in the Zaya catchment was captured for the years 2009 and 2013, which were years when the simulated water balance was <11%.
Precipitation influences N2O emissions in the Zaya catchment by influencing soil moisture and further affecting denitrification and the N2/N2O ratio. Based on the ANOVA analysis for the years 2006–2015, the significant impact of daily precipitation on simulated daily N2O emissions from spring barley in the Zaya catchment can be identified for the years 2006, 2009, 2010, and 2013, when the absolute percentage error of the simulated water balance were good (−11.4%, 8.1%, 10.4%, and 0.0%, respectively) (Tables S8 and S9).
4.2. Uncertainties of Simulated N2O Emissions
To quantify the uncertainties in the simulated N2O emissions, we varied the factors that influence the simulated N2O emissions in the submodule, such as the fraction K2, simulated soil NO3−, SOC, and soil water. These factors were changed by ±10%, ±20%, and ±30% to analyze the impact of each factor on N2O emissions in winter wheat (Figure 12) and grain corn (Figure 13) in the Melk catchment with M1 and M2 setups. The same analysis was performed in the Zaya catchment for winter wheat and spring barley.
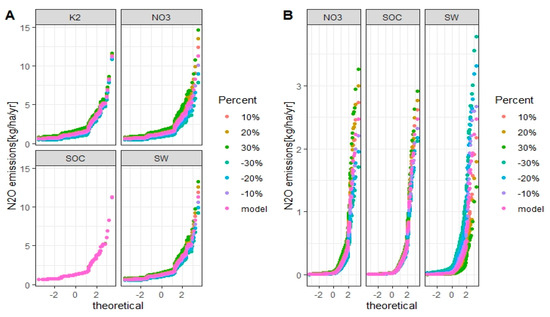
Figure 12.
Uncertainties of simulated annual N2O emissions from winter wheat in the Melk catchment with M1 (A) and M2 (B) setups for each considered factor. The X-axis is the standard normal distribution of simulated N2O emissions with mean 0 and standard deviation 1. Model is the validated SWAT model and is the baseline.
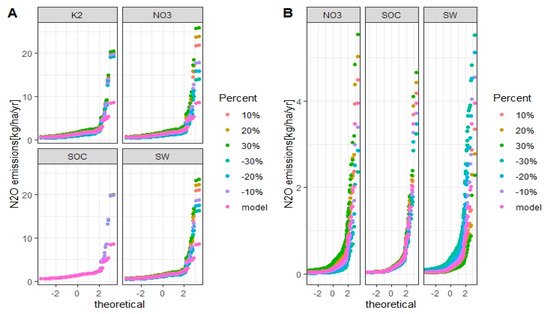
Figure 13.
Uncertainties of simulated annual N2O emissions from grain corn in the Melk catchment with M1 (A) and M2 (B) setups for each considered factor. The X-axis is the standard normal distribution of simulated N2O emissions with mean 0 and standard deviation 1. Model is the validated SWAT model and is the baseline.
For the M1 setup, the fraction K2, soil NO3−, and soil water are sensitive factors that influence the simulation of N2O emissions (Figure 12A and Figure 13A). For the M2 setup, soil NO3− and soil water are sensitive factors that influence the simulation of N2O emissions (Figure 12B and Figure 13B).
When the factors were changed by +30%, the simulated N2O emissions from winter wheat and grain corn increased by 99% and 98% for M1 setup, 93% and 79% for M2 setup, respectively, compared to baseline. With −30% of factors, the simulated N2O emissions from winter wheat and grain corn compared to baseline decreased by 60% and 60% for M1 setup, 30% and 27% for M2 setup, respectively.
For the Zaya catchment, soil NO3− and soil water are sensitive factors that influence the simulation of N2O emissions from winter wheat. Soil NO3−, SOC, and soil water are sensitive factors that influence the simulation of N2O emissions from spring barley (Figure 14).
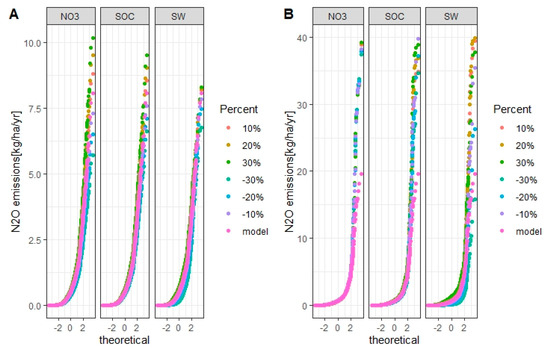
Figure 14.
Uncertainties of simulated annual N2O emissions from winter wheat (A) and spring barley (B) in the Zaya catchment for each considered factor. The X-axis is the standard normal distribution of simulated N2O emissions with mean 0 and standard deviation 1. Model is the validated SWAT model and is the baseline.
In the Zaya catchment, when the values were changed by +30%, the simulated N2O emissions from winter wheat and spring barley increased by 88% and 135%, respectively, compared to baseline. When the values were decreased by 30%, the simulated N2O emissions from winter wheat and spring barley decreased by 80% and 86%, respectively, compared to baseline.
To highlight future areas for model improvement, the uncertainties are listed to report on the limitations of the simulated variables (Table 7).

Table 7.
Sources of uncertainty for simulating N2O emissions with the N2O submodule in the Melk and Zaya catchments.
5. Conclusions
In this study, we developed an N2O submodule for the SWAT model to improve the ability for simulating N2O emissions based on spatially distributed hydrological and N outputs at the catchment scale. The N2O submodule was developed by partitioning N2O from SWAT simulated nitrification with the fraction K2 and also by isolating N2O from SWAT simulated denitrification (N2O + N2) using a modified semi-empirical equation. The N2O emissions and N2O EFs from the main crops (e.g., grain corn, winter wheat, spring barley, and soybean) in the Melk and Zaya catchments were quantified from the developed N2O submodule.
By comparing NH4NO3 as N fertilizer input data with a combination of organic N and NO3− as fertilizer input, we found the type of N fertilizer chosen for the SWAT model influences the amounts of simulated N2O emissions. In the Melk catchment, the setup with the combination of organic N and NO3− fertilizer simulated lower N2O emissions from grain corn and winter wheat than the setup with NH4NO3 fertilizer. The simulated N2O emissions in the Melk setup with NH4NO3 fertilizer were closer to the measured N2O data than the other model setups.
The SWAT model performance for simulating hydrological processes influences the simulation of N fluxes and N2O emissions. In the Zaya catchment, by examining selected years in which the absolute percentage error of the simulated water balance was good (<11%), we found daily precipitation significantly impacts N2O emissions, and the N2O submodule captured the impact of N fertilizer application on N2O emissions for both catchments, and was in agreement with the existing measured N2O data. The hot moments of simulated N2O emissions were during the crop growing season and after N fertilizer application.
The N2O submodule developed in this study should be further tested in catchments with existing measured N2O data and under a wider range of crops and climates.
Supplementary Materials
The following supporting information can be downloaded at: https://www.mdpi.com/article/10.3390/atmos13010050/s1, Figure S1. The representation of the equations for the impacts of soil NO3− (A) and soil water (B) on the ratio of N2/N2O in Parton et al. [26] and Wagena et al. [23]. Figures S2–S7. Hydrographs for discharge and NO3. Table S1. Literature values of the fraction of nitrified N lost as N2O, which is denoted by K2. Tables S2–S4. Crop classification into groups for the M1, M2 and Zaya setups, respectively. Table S5. The calibrated parameters with their initial ranges and final validated values for the Melk and Zaya catchments. Tables S6–S8. SWAT simulated water balance for the M1, M2 and Zaya setups, respectively. Table S9. ANOVA analysis for identifying the impact of daily precipitation on daily N2O emissions from spring barley. References [68,69,70,71,72,73,74,75,76,77,78,79,80,81,82,83,84,85] are cited in the Supplementary Materials.
Author Contributions
Conceptualization, C.W. and B.M.-S.; methodology, C.W., B.M.-S., and K.S.; software, C.W. and C.S.; formal analysis, C.W.; writing—original draft preparation, C.W.; writing—review and editing, B.M.-S. and K.S.; measured N2O data in Hirschstetten, A.W.; measured N2O data in Pötting, G.B.; fertilizer data for M2 and Zaya, O.Z. and M.Z. All authors have read and agreed to the published version of the manuscript.
Funding
This work is supported by the China Scholarship Council [grant numbers 201708620181] and by the NitroClimAT project [KR17AC0K13625] funded by the Austrian Climate and Energy Fund in the 10th call of the ACRP program.
Institutional Review Board Statement
Not applicable.
Informed Consent Statement
Not applicable.
Data Availability Statement
All input data used for setting up the SWAT model are available at: https://github.com/snailslowrun/N2O-submodule/blob/main/Input_data.docx (accessed on 19 December 2018). R codes for the N2O submodule are available at: https://github.com/snailslowrun/N2O-submodule (accessed on 19 December 2018).
Acknowledgments
This work was supported by the Doctoral School “Human River Systems in the 21st Century (HR21)” of the University of Natural Resources and Life Sciences, Vienna. N2O data acquisition was gained within the project Climagrocycle [KR16AC0K13275] funded in the 9th call of the ACRP program. We would like to thank Omar Chebib and Robert Michałowski for the help in modifying and compiling SWAT source codes. We would also like to thank Claire Brenner and Martha Anderson for the sharing of remote sensed ET from ALEXI model.
Conflicts of Interest
The authors declare no conflict of interest.
References
- Tian, H.; Xu, R.; Canadell, J.G.; Thompson, R.L.; Winiwarter, W.; Suntharalingam, P.; Davidson, E.A.; Ciais, P.; Jackson, R.B.; Janssens-Maenhout, G.; et al. A comprehensive quantification of global nitrous oxide sources and sinks. Nature 2020, 586, 248–256. [Google Scholar] [CrossRef]
- Tubiello, F.N.; Rosenzweig, C.; Conchedda, G.; Karl, K.; Gütschow, J.; Xueyao, P.; Obli-Laryea, G.; Wanner, N.; Qiu, S.Y.; De Barros, J.; et al. Greenhouse gas emissions from food systems: Building the evidence base. Environ. Res. Lett. 2021, 16, 065007. [Google Scholar] [CrossRef]
- IPCC. 1996. Revised 1996 IPCC Guidelines for National Greenhouse Gas Inventories: Workbook. Available online: https://www.ipcc-nggip.iges.or.jp/public/gl/invs5.html (accessed on 24 November 2020).
- De Klein, C.; Novoa, R.S.A.; Ogle, S.; Smith, K.A.; Rochette, P.; Wirth, C.T.; McConkey, B.G.; Mosier, A.; Williams, S.A. N2O Emissions from Managed Soils, and CO2 Emissions from Lime and Urea Application; 2006 IPCC Guidelines for National Greenhouse Gas Inventories. 2006. Available online: https://www.ipcc-nggip.iges.or.jp/public/2006gl/pdf/4_Volume4/V4_11_Ch11_N2O&CO2.pdf (accessed on 19 August 2018).
- Hergoualc’h, K.; Akiyama, H.; Bernoux, M.; Chirinda, N.; del Prado, A.; Kasimir, Å.; MacDonald, J.D.; Ogle, S.M.; Regina, K.; van der Weerden, T.J. N2O Emissions from Managed Soils, and CO2 Emissions from Lime and Urea Application; 2019 Refinement to the 2006 IPCC Guidelines for National Greenhouse Gas Inventories. 2019. Available online: https://www.ipcc-nggip.iges.or.jp/public/2019rf/pdf/4_Volume4/19R_V4_Ch11_Soils_N2O_CO2.pdf (accessed on 23 September 2019).
- Bouwman, A.F. Direct emission of nitrous oxide from agricultural soils. Nutr. Cycl. Agroecosystems 1996, 46, 53–70. [Google Scholar] [CrossRef]
- Sozanska, M.; Skiba, U.; Metcalfe, S. Developing an inventory of N2O emissions from British soils. Atmos. Environ. 2002, 36, 987–998. [Google Scholar] [CrossRef]
- Smith, K.A.; McTaggart, I.P.; Tsuruta, H. Emissions of N2O and NO associated with nitrogen fertilization in intensive agriculture, and the potential for mitigation. Soil Use Manag. 1997, 13, 296–304. [Google Scholar] [CrossRef]
- Stehfest, E.; Bouwman, L. N2O and NO emission from agricultural fields and soils under natural vegetation: Summarizing available measurement data and modeling of global annual emissions. Nutr. Cycl. Agroecosystems 2006, 74, 207–228. [Google Scholar] [CrossRef]
- Velthof, G.L.; Mosquera, J. The impact of slurry application technique on nitrous oxide emission from agricultural soils. Agric. Ecosyst. Environ. 2011, 140, 298–308. [Google Scholar] [CrossRef]
- Fowler, D.; Steadman, C.E.; Stevenson, D.; Coyle, M.; Rees, R.M.; Skiba, U.M.; Sutton, M.A.; Cape, J.N.; Dore, A.J.; Vieno, M.; et al. Effects of global change during the 21st century on the nitrogen cycle. Atmos. Chem. Phys. 2015, 15, 13849–13893. [Google Scholar] [CrossRef]
- Wang, C.; Amon, B.; Schulz, K.; Mehdi, B. Factors That Influence Nitrous Oxide Emissions from Agricultural Soils as Well as Their Representation in Simulation Models: A Review. Agronomy 2021, 11, 770. [Google Scholar] [CrossRef]
- Farquharson, R. Nitrification rates and associated nitrous oxide emissions from agricultural soils—A synopsis. Soil Res. 2016, 54, 469–480. [Google Scholar] [CrossRef]
- Scheer, C.; Fuchs, K.; Pelster, D.E.; Butterbach-Bahl, K. Estimating global terrestrial denitrification from measured N2O:(N2O+N2) product ratios. Curr. Opin. Environ. Sustain. 2020, 47, 72–80. [Google Scholar] [CrossRef]
- Bouwman, A.F.; Boumans, L.J.M.; Batjes, N.H. Modeling global annual N2O and NO emissions from fertilized fields. Glob. Biogeochem. Cycles 2002, 16, 28. [Google Scholar] [CrossRef]
- Dalal, R.C.; Wang, W.; Robertson, G.P.; Parton, W.J. Nitrous oxide emission from Australian agricultural lands and mitigation options: A review. Soil Res. 2003, 41, 165–195. [Google Scholar] [CrossRef]
- Li, Y.; Chen, D.; Zhang, Y.; Edis, R.; Ding, H. Comparison of three modeling approaches for simulating denitrification and nitrous oxide emissions from loam-textured arable soils. Glob. Biogeochem. Cycles 2005, 19. [Google Scholar] [CrossRef]
- Parton, W.J.; Holland, E.A.; Del Grosso, S.J.; Hartman, M.D.; Martin, R.E.; Mosier, A.R.; Ojima, D.S.; Schimel, D.S. Generalized model for NOx and N2O emissions from soils. J. Geophys. Res. Atmos. 2001, 106, 17403–17419. [Google Scholar] [CrossRef]
- Arnold, J.G.; Srinivasan, R.; Muttiah, R.S.; Williams, J.R. Large area hydrologic modeling and assessment part I: Model development 1. J. Am. Water Resour. Assoc. 1998, 34, 73–89. [Google Scholar] [CrossRef]
- Gao, X.; Ouyang, W.; Hao, Z.; Xie, X.; Lian, Z.; Hao, X.; Wang, X. SWAT-N2O coupler: An integration tool for soil N2O emission modeling. Environ. Model. Softw. 2019, 115, 86–97. [Google Scholar] [CrossRef]
- Ghimire, U.; Shrestha, N.K.; Biswas, A.; Wagner-Riddle, C.; Yang, W.; Prasher, S.; Rudra, R.; Daggupati, P. A Review of Ongoing Advancements in Soil and Water Assessment Tool (SWAT) for Nitrous Oxide (N2O) Modeling. Atmosphere 2020, 11, 450. [Google Scholar] [CrossRef]
- Yang, Q.; Zhang, X.; Abraha, M.; Del Grosso, S.; Robertson, G.P.; Chen, J. Enhancing the soil and water assessment tool model for simulating N2O emissions of three agricultural systems. Ecosyst. Health Sustain. 2017, 3, e01259. [Google Scholar] [CrossRef]
- Wagena, M.B.; Bock, E.M.; Sommerlot, A.R.; Fuka, D.R.; Easton, Z.M. Development of a nitrous oxide routine for the SWAT model to assess greenhouse gas emissions from agroecosystems. Environ. Model. Softw. 2017, 89, 131–143. [Google Scholar] [CrossRef]
- Shrestha, N.K.; Thomas, B.W.; Du, X.; Hao, X.; Wang, J. Modeling nitrous oxide emissions from rough fescue grassland soils subjected to long-term grazing of different intensities using the Soil and Water Assessment Tool (SWAT). Environ. Sci. Pollut. Res. 2018, 25, 27362–27377. [Google Scholar] [CrossRef] [PubMed]
- Shrestha, N.K.; Wang, J. Current and future hot-spots and hot-moments of nitrous oxide emission in a cold climate river basin. Environ. Pollut. 2018, 239, 648–660. [Google Scholar] [CrossRef]
- Parton, W.J.; Mosier, A.R.; Ojima, D.S.; Valentine, D.W.; Schimel, D.S.; Weier, K.; Kulmala, A.E. Generalized model for N2 and N2O production from nitrification and denitrification. Glob. Biogeochem. Cycles 1996, 10, 401–412. [Google Scholar] [CrossRef]
- Li, C. User’s Guide for the DNDC Model (Version 9.5) 2017. University of New Hampshire. 2017. Available online: http://www.dndc.sr.unh.edu/model/GuideDNDC95.pdf (accessed on 25 November 2020).
- David, M.B.; Del Grosso, S.J.; Hu, X.; Marshall, E.P.; McIsaac, G.F.; Parton, W.J.; Tonitto, C.; Youssef, M.A. Modeling denitrification in a tile-drained, corn and soybean agroecosystem of Illinois, USA. Biogeochemistry 2009, 93, 7–30. [Google Scholar] [CrossRef]
- Neitsch, S.L.; Arnold, J.G.; Kiniry, J.R.; Williams, J.R. Soil and Water Assessment Tool Theoretical Documentation version 2009. Texas Water Resources Institute. 2009. Available online: https://swat.tamu.edu/media/99192/swat2009-theory.pdf (accessed on 9 March 2018).
- Del Grosso, S.J.; Parton, W.J.; Mosier, A.R.; Ojima, D.S.; Kulmala, A.E.; Phongpan, S. General model for N2O and N2 gas emissions from soils due to dentrification. Glob. Biogeochem. Cycles 2000, 14, 1045–1060. [Google Scholar] [CrossRef]
- Weier, K.L.; Doran, J.W.; Power, J.F.; Walters, D.T. Denitrification and the dinitrogen/nitrous oxide ratio as affected by soil water, available carbon, and nitrate. Soil Sci. Soc. Am. J. 1993, 57, 66–72. [Google Scholar] [CrossRef]
- Umweltbundesamt (Austria’s National Inventory Report). 2020. Available online: https://www.umweltbundesamt.at/fileadmin/site/publikationen/rep0724.pdf. (accessed on 12 October 2020).
- Petersen, S.O.; Regina, K.; Pöllinger, A.; Rigler, E.; Valli, L.; Yamulki, S.; Esala, M.; Fabbri, C.; Syväsalo, E.; Vinther, F.P. Nitrous oxide emissions from organic and conventional crop rotations in five European countries. Agric. Ecosyst. Environ. 2006, 112, 200–206. [Google Scholar] [CrossRef]
- Eder, A.; Blöschl, G.; Feichtinger, F.; Herndl, M.; Klammler, G.; Hösch, J.; Erhart, E.; Strauss, P. Indirect nitrogen losses of managed soils contributing to greenhouse emissions of agricultural areas in Austria: Results from lysimeter studies. Nutr. Cycl. Agroecosystems 2015, 101, 351–364. [Google Scholar] [CrossRef]
- Bodner, G.; Mentler, A.; Klik, A.; Kaul, H.P.; Zechmeister-Boltenstern, S. Do cover crops enhance soil greenhouse gas losses during high emission moments under temperate Central Europe conditions? Die Bodenkultur: J. Land Manag. Food Environ. 2018, 68, 171–187. [Google Scholar] [CrossRef]
- Kasper, M.; Foldal, C.; Kitzler, B.; Haas, E.; Strauss, P.; Eder, A.; Zechmeister-Boltenstern, S.; Amon, B. N2O emissions and NO3− leaching from two contrasting regions in Austria and influence of soil, crops and climate: A modelling approach. Nutr. Cycl. Agroecosystems 2019, 113, 95–111. [Google Scholar] [CrossRef]
- Schürz, C. SWATplusR Package. 2019. Available online: https://chrisschuerz.github.io/SWATplusR/articles/SWATplusR.html. (accessed on 12 March 2019).
- Shields, M.D.; Zhang, J. The generalization of Latin hypercube sampling. Reliab. Eng. Syst. Saf. 2016, 148, 96–108. [Google Scholar] [CrossRef]
- Pianosi, F.; Wagener, T. A simple and efficient method for global sensitivity analysis based on cumulative distribution functions. Environ. Model. Softw. 2015, 67, 1–11. [Google Scholar] [CrossRef]
- Gupta, H.V.; Sorooshian, S.; Yapo, P.O. Status of automatic calibration for hydrologic models: Comparison with multilevel expert calibration. J. Hydrol. Eng. 1999, 4, 135–143. [Google Scholar] [CrossRef]
- Gupta, H.V.; Kling, H.; Yilmaz, K.K.; Martinez, G.F. Decomposition of the mean squared error and NSE performance criteria: Implications for improving hydrological modelling. J. Hydrol. 2009, 377, 80–91. [Google Scholar] [CrossRef]
- Anderson, M.C.; Kustas, W.P.; Norman, J.M.; Hain, C.R.; Mecikalski, J.R.; Schultz, L.; Gonz’alez-Dugo, M.P.; Cammalleri, C.; d’Urso, G.; Pimstein, A.; et al. Mapping daily evapotranspiration at field to continental scales using geostationary and polar orbiting satellite imagery. Hydrol. Earth Syst. Sci. 2011, 15, 223–239. [Google Scholar] [CrossRef]
- Anderson, M.C. Level-3 Evapotranspiration(ET_ALEXI)Algorithm Theoretical Basis Document. 2018. Available online: https://lpdaac.usgs.gov/documents/332/ECO3ETALEXIU_ATBD_V1.pdf. (accessed on 27 May 2021).
- Mecikalski, J.R.; Mackaro, S.M.; Anderson, M.C.; Norman, J.M.; Basara, J.B. Evaluating the use of the Atmospheric Land Exchange Inverse (ALEXI) model in short-term prediction and mesoscale diagnosis. In Proceedings of the Conference on Hydrology, San Diego, CA, USA, 12 January 2005; pp. 8–13. Available online: https://citeseerx.ist.psu.edu/viewdoc/download?doi=10.1.1.553.1402&rep=rep1&type=pdf (accessed on 27 May 2021).
- Cawse-Nicholson, K.; Braverman, A.; Kang, E.L.; Li, M.; Johnson, M.; Halverson, G.; Anderson, M.; Hain, C.; Gunson, M.; Hook, S. Sensitivity and uncertainty quantification for the ECOSTRESS evapotranspiration algorithm–DisALEXI. Int. J. Appl. Earth Obs. Geoinf. 2020, 89, 102088. [Google Scholar] [CrossRef]
- Parkin, T.B. Effect of sampling frequency on estimates of cumulative nitrous oxide emissions. J. Environ. Qual. 2008, 37, 1390–1395. [Google Scholar] [CrossRef] [PubMed]
- Silva, J.P.; Lasso, A.; Lubberding, H.J.; Peña, M.R.; Gijzen, H.J. Biases in greenhouse gases static chambers measurements in stabilization ponds: Comparison of flux estimation using linear and non-linear models. Atmos. Environ. 2015, 109, 130–138. [Google Scholar] [CrossRef]
- Foltz, M.E.; Zilles, J.L.; Koloutsou-Vakakis, S. Prediction of N2O emissions under different field management practices and climate conditions. Sci. Total Environ. 2019, 646, 872–879. [Google Scholar] [CrossRef]
- Gungor, K.; Karakaya, N.; Evrendilek, F.; Akgul, S.; Baskan, O.; Cebel, H.; Farhoud, H.J.; Turkecan, O.; Yasar, S.; Gumus, O. Spatiotemporal modeling of watershed nutrient transport dynamics: Implications for eutrophication abatement. Ecol. Inform. 2016, 34, 52–69. [Google Scholar] [CrossRef]
- Ikenberry, C.D.; Crumpton, W.G.; Arnold, J.G.; Soupir, M.L.; Gassman, P.W. Evaluation of existing and modified wetland equations in the SWAT model. JAWRA J. Am. Water Resour. Assoc. 2017, 53, 1267–1280. [Google Scholar] [CrossRef]
- Pott, C.A.; Fohrer, N. Best management practices to reduce nitrate pollution in a rural watershed in Germany. Rev. Ambiente Água 2017, 12, 888–901. [Google Scholar] [CrossRef][Green Version]
- Bremner, J.M.; Blackmer, A.M. Effects of acetylene and soil water content on emission of nitrous oxide from soils. Nature 1979, 280, 380–381. [Google Scholar] [CrossRef]
- Lipschultz, F.; Zafiriou, O.C.; Wofsy, S.C.; McElroy, M.B.; Valois, F.W.; Watson, S.W. Production of NO and N2O by soil nitrifying bacteria. Nature 1981, 294, 641–643. [Google Scholar] [CrossRef]
- Goodroad, L.L.; Keeney, D.R. Nitrous oxide production in aerobic soils under varying pH, temperature and water content. Soil Biol. Biochem. 1984, 16, 39–43. [Google Scholar] [CrossRef]
- Remde, A.; Conrad, R. Production of nitric oxide in Nitrosomonas europaea by reduction of nitrite. Arch. Microbiol. 1990, 154, 187–191. [Google Scholar] [CrossRef]
- Garrido, F.; Hénault, C.; Gaillard, H.; Pérez, S.; Germon, J.C. N2O and NO emissions by agricultural soils with low hydraulic potentials. Soil Biol. Biochem. 2002, 34, 559–575. [Google Scholar] [CrossRef]
- Khalil, K.; Mary, B.; Renault, P. Nitrous oxide production by nitrification and denitrification in soil aggregates as affected by O2 concentration. Soil Biol. Biochem. 2004, 36, 687–699. [Google Scholar] [CrossRef]
- Bateman, E.J.; Baggs, E.M. Contributions of nitrification and denitrification to N2O emissions from soils at different water-filled pore space. Biol. Fertil. Soils 2005, 41, 379–388. [Google Scholar] [CrossRef]
- Mathieu, O.; Hénault, C.; Lévêque, J.; Baujard, E.; Milloux, M.J.; Andreux, F. Quantifying the contribution of nitrification and denitrification to the nitrous oxide flux using 15N tracers. Environ. Pollut. 2006, 144, 933–940. [Google Scholar] [CrossRef]
- Mørkved, P.T.; Dörsch, P.; Henriksen, T.M.; Bakken, L.R. N2O emissions and product ratios of nitrification and denitrification as affected by freezing and thawing. Soil Biol. Biochem. 2006, 38, 3411–3420. [Google Scholar] [CrossRef]
- Mørkved, P.T.; Dörsch, P.; Bakken, L.R. The N2O product ratio of nitrification and its dependence on long-term changes in soil pH. Soil Biol. Biochem. 2007, 39, 2048–2057. [Google Scholar] [CrossRef]
- Frame, C.H.; Casciotti, K.L. Biogeochemical controls and isotopic signatures of nitrous oxide production by a marine ammonia-oxidizing bacterium. Biogeosciences 2010, 7, 2695–2709. [Google Scholar] [CrossRef]
- Leitner, S.; Spiridon, A.; Hood-Nowotny, R.; Heiling, M.; Resch, C.; Berthold, H.; Hösch, J.; Murer, E.; Wagenhofer, J.; Formayer, H.; et al. Impact of Future Precipitation Patterns in Agroecosystems on CO2 and N2O Emissions—A Green Manure Stable Isotope Labelling Study; EGU General Assembly. 2019. Available online: https://meetingorganizer.copernicus.org/EGU2019/2019-17269.pdf (accessed on 14 April 2021).
- Spiridon, A.; Hood-Nowotny, R.; Leitner, S.; Berthold, H.; Hösch, J.; Murer, E.; Wagenhofer, J.; Formayer, H.; Bruckner, A.; Wanek, W.; et al. Consequences of Climate Change for Agroecosystem Carbon and Nitrogen Cycling—A Stable Isotope Labelling Study; 16th Stable Isotope Network Austria Meeting. 2018. Available online: https://meeting.sina.or.at/sites/default/files/16th_SINA_ProgramAbstracts_2018.pdf (accessed on 14 April 2021).
- Schäfer, K.; Böttcher, J.; Weymann, D.; von der Heide, C.; Duijnisveld, W.H. Evaluation of a Closed Tunnel for Field-Scale Measurements of Nitrous Oxide Fluxes from an Unfertilized Grassland Soil. J. Environ. Qual. 2012, 41, 1383–1392. [Google Scholar] [CrossRef]
- Schwenke, G.D.; Haigh, B.M. Can split or delayed application of N fertiliser to grain sorghum reduce soil N2O emissions from sub-tropical Vertosols and maintain grain yields? Soil Res. 2019, 57, 859–874. [Google Scholar] [CrossRef]
- Choudhary, M.A.; Akramkhanov, A.; Saggar, S. Nitrous oxide emissions in soils cropped with maize under long-term tillage and under permanent pasture in New Zealand. Soil Tillage Res. 2001, 62, 61–71. [Google Scholar] [CrossRef]
- Yoshida, T.; Alexander, M. Nitrous Oxide Formation by Nitrosomonas Europaea and Heterotrophie Microorganisms. Soil Sci. Soc. Am. J. 1970, 34, 880–882. [Google Scholar] [CrossRef]
- Bremner, J.M. Sources of nitrous oxide in soils. Nutr. Cycl. Agroecosystems 1997, 49, 7–16. [Google Scholar] [CrossRef]
- Freney, J.; Denmead, O.; Simpson, J. Nitrous oxide emission from soils at low moisture contents. Soil Biol. Biochem. 1979, 11, 167–173. [Google Scholar] [CrossRef]
- Goreau, T.J.; Kaplan, W.A.; Wofsy, S.C.; McElroy, M.B.; Valois, F.W.; Watson, S.W. Production of NO2-and N2O by Nitrifying Bacteria at Reduced Concentrations of Oxygen. Appl. Environ. Microbiol. 1980, 40, 526–532. [Google Scholar] [CrossRef]
- Hynes, R.K.; Knowles, R. Production of nitrous oxide by Nitrosomonas europaea: Effects of acetylene, pH, and oxygen. Can. J. Microbiol. 1984, 30, 1397–1404. [Google Scholar] [CrossRef]
- Martikainen, P.J. Nitrous Oxide Emission Associated with Autotrophic Ammonium Oxidation in Acid Coniferous Forest Soil. Appl. Environ. Microbiol. 1985, 50, 1519–1525. [Google Scholar] [CrossRef]
- Tortoso, A.C.; Hutchinson, G.L. Contributions of Autotrophic and Heterotrophic Nitrifiers to Soil NO and N2O Emissions. Appl. Environ. Microbiol. 1990, 56, 1799–1805. [Google Scholar] [CrossRef]
- Martikainen, P.; De Boer, W. Nitrous oxide production and nitrification in acidic soil from a dutch coniferous forest. Soil Biol. Biochem. 1993, 25, 343–347. [Google Scholar] [CrossRef]
- Maag, M.; Vinther, F. Nitrous oxide emission by nitrification and denitrification in different soil types and at different soil moisture contents and temperatures. Appl. Soil Ecol. 1996, 4, 5–14. [Google Scholar] [CrossRef]
- A Kester, R.; De Boer, W.; Laanbroek, H.J. Production of NO and N(inf2)O by Pure Cultures of Nitrifying and Denitrifying Bacteria during Changes in Aeration. Appl. Environ. Microbiol. 1997, 63, 3872–3877. [Google Scholar] [CrossRef] [PubMed]
- Jiang, Q.-Q.; Bakken, L.R. Nitrous Oxide Production and Methane Oxidation by Different Ammonia-Oxidizing Bacteria. Appl. Environ. Microbiol. 1999, 65, 2679–2684. [Google Scholar] [CrossRef]
- Ingwersen, J.; Butterbach-Bahl, K.; Gasche, R.; Richter, O.; Papen, H. Barometric Process Separation: New Method for Quantifying Nitrification, Denitrification, and Nitrous Oxide Sources in Soils. Soil Sci. Soc. Am. J. 1999, 63, 117–128. [Google Scholar] [CrossRef]
- Cheng, W.; Tsuruta, H.; Chen, G.; Yagi, K. N2O and NO production in various Chinese agricultural soils by nitrification. Soil Biol. Biochem. 2004, 36, 953–963. [Google Scholar] [CrossRef]
- Carter, M.S. Contribution of nitrification and denitrification to N2O emissions from urine patches. Soil Biol. Biochem. 2007, 39, 2091–2102. [Google Scholar] [CrossRef]
- Chen, D.; Suter, H.; Islam, A.; Edis, R. Influence of nitrification inhibitors on nitrification and nitrous oxide (N2O) emission from a clay loam soil fertilized with urea. Soil Biol. Biochem. 2010, 42, 660–664. [Google Scholar] [CrossRef]
- Galbally, I.E.; Meyer, M.C.; Wang, Y.-P.; Smith, C.J.; Weeks, I.A. Nitrous oxide emissions from a legume pasture and the influences of liming and urine addition. Agric. Ecosyst. Environ. 2010, 136, 262–272. [Google Scholar] [CrossRef]
- Zhu-Barker, X.; Silva, L.; Doane, T.A.; Horwath, W.R. Iron: The Forgotten Driver of Nitrous Oxide Production in Agricultural Soil. PLoS ONE 2013, 8, e60146. [Google Scholar] [CrossRef]
- Paul, J.W.; Beauchamp, E.G.; Zhang, X. Nitrous and nitric oxide emissions during nitrification and denitrification from manure-amended soil in the laboratory. Can. J. Soil Sci. 1993, 73, 539–553. [Google Scholar] [CrossRef]
Publisher’s Note: MDPI stays neutral with regard to jurisdictional claims in published maps and institutional affiliations. |
© 2021 by the authors. Licensee MDPI, Basel, Switzerland. This article is an open access article distributed under the terms and conditions of the Creative Commons Attribution (CC BY) license (https://creativecommons.org/licenses/by/4.0/).