Article

501 Years of Spring Precipitation History for the Semi-Arid Northern Iran Derived from Tree-Ring δ18O Data

1
Institute of Geography, Friedrich-Alexander-University Erlangen-Nürnberg, 91054 Erlangen, Germany
2
Department of Wood and Paper Science & Technology, Faculty of Natural Resources, University of Tehran, 31587-77871 Karaj, Iran
*
Author to whom correspondence should be addressed.
Atmosphere 2020, 11(9), 889; https://doi.org/10.3390/atmos11090889
Submission received: 24 June 2020 / Revised: 18 August 2020 / Accepted: 20 August 2020 / Published: 22 August 2020
(This article belongs to the Special Issue Climate and the Oxygen Isotope Patterns from Trees)

Abstract

:
In semi-arid regions of the world, knowledge about the long-term hydroclimate variability is essential to analyze and evaluate the impact of current climate change on ecosystems. We present the first tree-ring δ18O based hydroclimatic reconstruction for northern semi-arid Iran spanning the period 1515–2015. A highly significant correlation between tree-ring δ18O variations of juniper trees and spring (April–June) precipitation reveals a major influence of spring water availability during the early growing season. The driest period of the past 501 years occurred in the 16th century while the 18th century was the wettest, during which the overall highest frequency of wet year events occurred. A gradual decline in spring precipitation is evident from the beginning of the 19th century, pointing to even drier climate conditions. The analysis of dry/wet events indicates that the frequency of years with relatively dry spring increased over the last three centuries, while the number of wet events decreased. Our findings are in accordance with historical Persian disaster records (e.g., the severe droughts of 1870–1872, 1917–1919; severe flooding of 1867, the 1930s, and 1950). Correlation analyses between the reconstruction and different atmospheric circulation indices revealed no significant influence of large-scale drivers on spring precipitation in northern Iran.

1. Introduction

Iran is located in western Asia, in one of the world’s most water-scarce and dry regions of the Middle East [1,2]. Due to its geographic location between the arid to the semi-arid mid-latitude belt and the subtropical zone, and complex topography, Iran is highly sensitive to climate change [3]. Nearly 85% of the Iranian land area is characterized by arid or semi-arid conditions, underlining the vulnerability of the region to climate change, especially to changes in hydroclimate [4,5,6].
Adaptation to climate change requires concerted efforts in different sectors to seek accurate baseline information about the range and magnitude of past and projected changes in climate as well as region-specific vulnerability analyses of climate change. A study examining the output of 18 global climate models presumed that the Eastern Mediterranean region including northeastern Iran will encounter a substantial decrease around 15% of the current annual precipitation by the end of the 21st century [7]. In addition, the timing of maximum precipitation in northern Iran is postulated to shift from April to November, which will very likely affect the regional water supply during the growing season [7].
Climate change is expected to have even more sound and financial impacts on developing countries with manifold effects on water resources, and will affect the type, frequency, and intensity of extreme weather events, such as floods, droughts, or heavy precipitation events [8,9]. Despite the great impact of climate change for this region, its effects on meteorological variables have not sufficiently received inquiries, both locally and regionally. Recently, the interest in Iran for analyzing trends in climate has increased. The majority of these studies concluded considerable and adverse changes in climate and hydrological parameters [10] towards generally warmer and drier climate conditions in Iran [11,12], which will consequently lead to an extension of semi-arid areas. In particular, such expansion already occurs in the dryer regions of Iran [13]. Tabari and Aghajanloo [14] postulated an increase in aridity at 10 stations located in sensitive agricultural regions in Iran, which was caused by the concurrent occurrence of a negative precipitation trend and a positive evapotranspiration trend. Tabari and Willems [6] pointed to a slight increase in the number of dry days and longer drought periods (up to 90%) for almost the entire Middle East and showed that in the future prolonged droughts will further aggravate the already high level of regional water stress.
However, these studies rely on datasets from meteorological stations only providing climate records since the 1950s. The shortage of instrumental climate data series, which often show a substantial portion of missing data, poses a challenge to derive robust trends of recent climate change. Since the spatial density of meteorological stations is very scarce over large parts of Iran, it is difficult to draw sound conclusions about changes in moisture-bringing atmospheric circulation systems [11].
In this context, natural climate archives offer important assistance. Fingerprints of past climate variations recorded in annually resolved tree rings offer great opportunities for high-resolution paleoclimate reconstructions [15,16]. The analysis of stable oxygen isotopic composition of tree-ring cellulose overcomes restrictions often associated to the analyses of tree-ring width, like inherent biological trends, and the required number of trees to create a robust tree-ring chronology [17,18,19]. The δ18O variations in tree-ring cellulose contain climate signals originating from (i) the isotopic composition of meteoric water (liquid and solid precipitation) used by trees during water uptake by the roots, and (ii) evaporative isotopic enrichment in leaf water which is controlled by various climatic factors controlling tree growth (precipitation, temperature, relative humidity, and sunshine duration) [20,21,22,23].
Tree-ring based reconstructions of climate variables have been widely employed in assessing inter-annual climate fluctuations on different time scales [24,25,26]. Despite the prominent role of tree rings in investigating past climate variability, dendroclimatological analyses have been only sparsely applied so far in Iran. Few explorations of the relationship between tree-ring variables and various climate factors have unlocked tree rings’ considerable potential for climate studies, particularly for the mountain regions in the northern, northeastern, and western parts of Iran [27,28,29,30,31,32,33]. Nevertheless, only a handful of investigations have utilized dendrochronological methods, using tree-ring width variations, for reconstructions of precipitation variations [5,34,35] in the Zagros Mountains, and of temperature in the north of Iran [36]. Juniperus polycarpos is considered as a valuable timber tree species in Iran, with positive effects on biodiversity and soil conservation [37]. This frost and drought tolerant tree species can grow in harsh environments like the semi-arid mountain regions [38,39] and shows a high sensitivity towards changes in the environment and climate [28,29,30,36].
Stable oxygen isotope ratios in tree rings have been proven in various regions of the world being a suitable proxy for palaeoclimatic research [40,41,42,43,44,45]. In this context, stable oxygen isotope ratios in tree-rings of juniper trees have been successfully applied for the long-term (multi-centennial to millennial) reconstruction of moisture and hydroclimatic variations in different climatic regions of Asia [24,29,46,47,48]. In a first evaluation, Foroozan et al. [29] found that precipitation and temperature exert a significant influence on δ18O variations in juniper tree rings in north Iran and proved their suitability to reconstruct hydroclimate variations during the early growing season. They indicated that relative humidity or vapor pressure deficit are the best parameters to represent moisture variations driving regional tree-ring δ18O variations. Given previous investigations, the δ18O variations in juniper tree-rings have proven to be significantly more sensitive to precipitation fluctuations than its tree-ring width variations [29,36,49].
In the present study, we established a 501-year spanning tree-ring δ18O chronology, representing the first stable isotope archive with the annual resolution for past hydroclimatic investigations in Iran. Our main objectives are to reconstruct (i) regional precipitation and (ii) to study long-term hydroclimatic trends in this climatically sensitive and hardly studied semi-arid region.

2. Materials and Methods
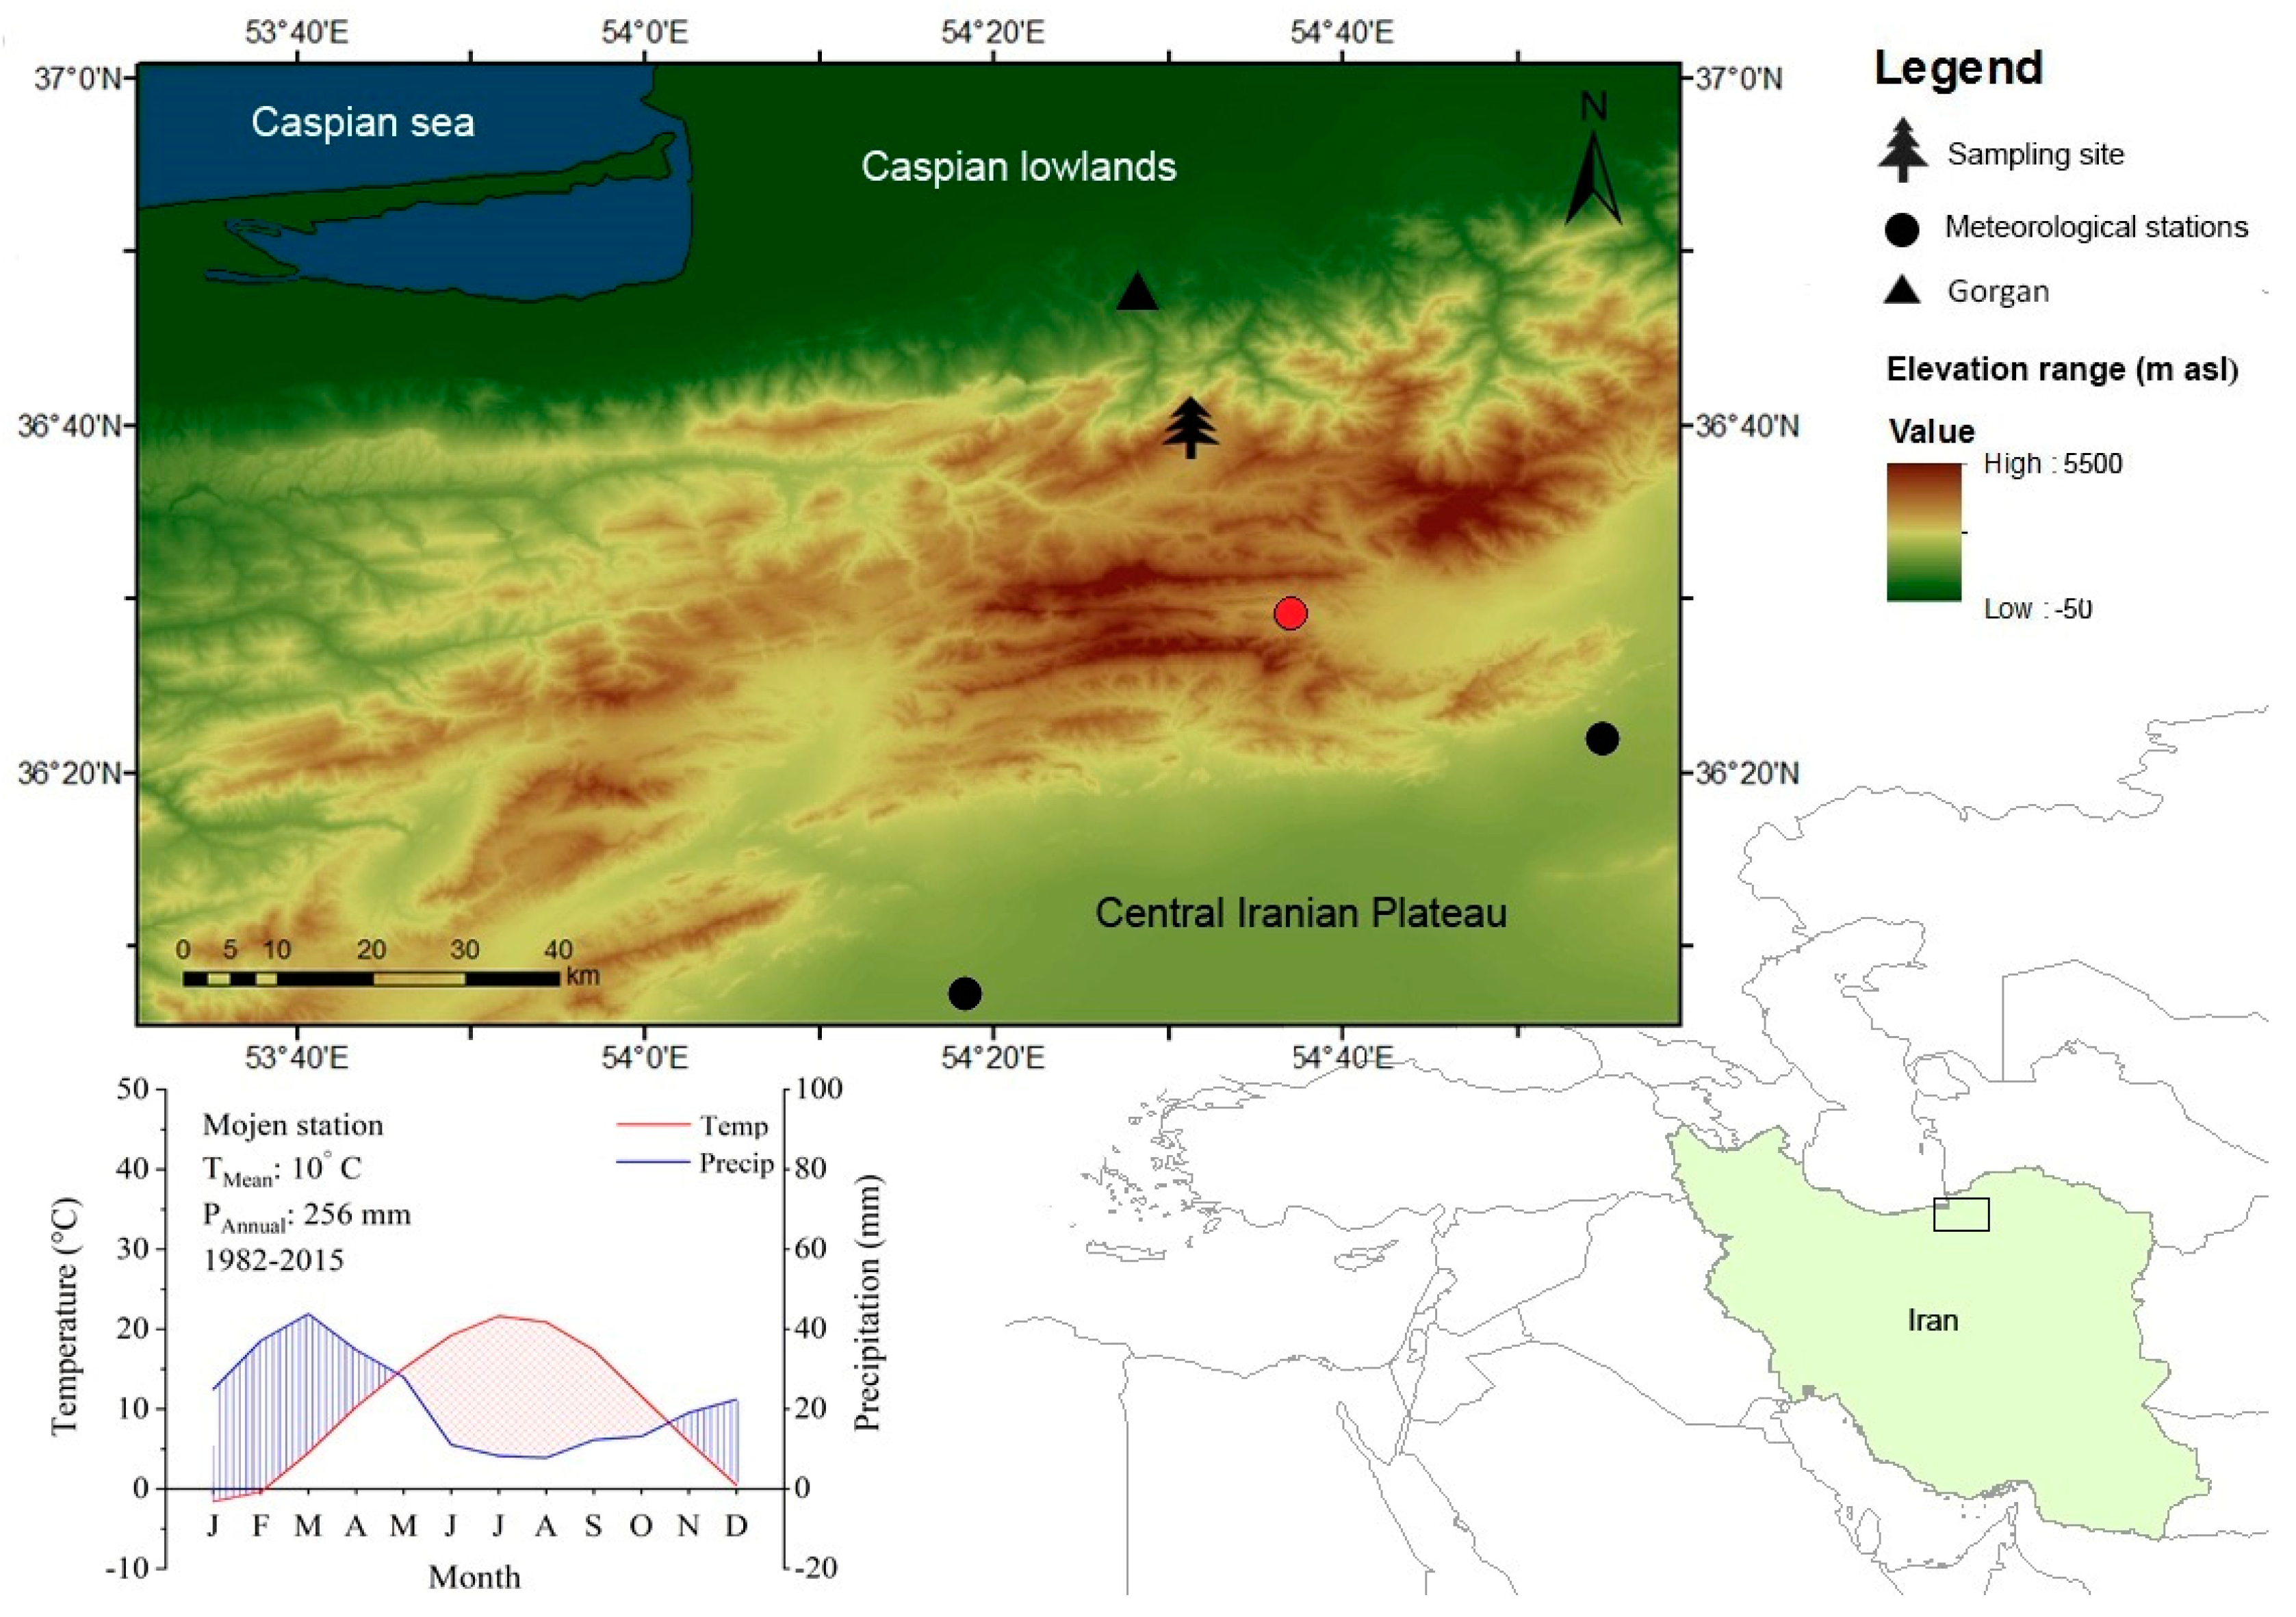
2.1. Study Area

The Alborz Mountains form a west–east extending barrier between the southern coastline of the Caspian Sea and the inner central Iranian plateau. The mountain range inclines sharply from the Caspian Sea at 26 m below sea level up to Mount Damavand, the highest mountain in Iran of 5671 m a.s.l. [50]. It hence serves as a climatological barrier for humid air masses flowing from the Caspian Sea southwards to the Interior parts of Iran [3], causing steep climate gradient and related vegetation changes between the northern and southern slopes of the Alborz Mountains. Consequently, the annual rainfall ranges from 2000 mm on the north-facing side of the Alborz Mountains to about 25 mm in the interior parts of the Iranian Plateau. On average, the estimated amount of precipitation across Iran reaches only 250 mm [51,52]. Consequently, the northern slopes of the Alborz Mountains are characterized by the lush vegetation of the Hyrcanian forest, whereas the southern slopes are dominated by leeside and foehn effects resulting in a more arid climate. Accordingly, the dominant vegetation on the southern slopes belongs to the steppic Irano-Turanian vegetation zone [38].
The study site is situated in the eastern part of the Alborz mountain forests, in the Irano-Turanian vegetation zone. The regional woodlands are dominated by open stands of Juniperus polycarpos C. Koch (1700–2500 m a.s.l.) growing on shallow and calcareous soils [39,53] with pH values ranging from 7.7 to 8.7, indicating weakly alkaline soils [54]. Due to steep slopes resulting in well-drained soils, trees have only sporadic or no access to groundwater.
The regional, typically continental climate is characterized by long and cold winters followed by a dry, hot summer with slight cloud cover and therefore intensive solar radiation. Instrumental meteorological stations with available climate data for more than 50 years are mostly located far and in a considerable vertical distance from the study site in the mountain forelands or in valley bottoms (Figure 1). Very few high elevation stations in the surroundings of study areas have recorded climate data albeit for very short periods, almost 20 years, whilst there are also many missing data in these records.
In the absence of climate stations at higher altitudes of the Alborz Mountains, the closest and highest available meteorological station is Mojen station (36°29′ N; 54°37′ E; 1970 m a.s.l.), which is located 21 km east of our study site at the southern slope of the Alborz Mountains and shows comparable ecological characteristics. Mojen station has an average annual precipitation of approximately 256 mm and a mean annual temperature of 10 °C for the measuring period 1982–2019. The highest and lowest monthly mean temperatures occur in July (21.62 °C) and January (−1.57 °C), respectively. The wet season starts from late autumn and continues to winter until June (11 mm). Precipitation occurs very irregularly, with the highest amounts of precipitation originating from westerly airflows during the winter season from January (24.9 mm) to March (43.8 mm) and early spring. The mean duration of winter snow cover is 104 days. In contrast, lowest precipitation amounts occur in August (7.8 mm) during the dry and warm summer season (July–September).

2.2. Sample Collection and Preparation

Samples were collected from an open J. polycarpos forest (36°39′54.4″ N; 54°31′53.7″ E) at an elevation of 2540 m a.s.l. near the village of Chahar Bagh in the southwestern highlands of Golestan province. In order to develop a multi-century stable oxygen chronology, long-living juniper trees were cored at breast height using a 5 mm increment borer. For the late period, additional samples were acquired by collecting disks of old building timbers in the village Chahar Bagh. After air-drying the increment cores, surfaces of the samples were carefully sanded and prepared to make tree-width boundaries clearly visible [55]. Following standard dendrochronological methods, tree ring widths were first measured with a Lintab 5 table (Rinntech, Heidelberg, Germany) at a resolution of 0.01 mm and then were statistically and visually cross dated to the exact calendar year against already available regional tree-ring chronologies using the TSAP-Win software package [56].
In accordance with recommendations from previous studies [57,58], a sample replication of at least five trees was ensured over the entire period of investigation (Figure 2). The average single series length is 248 years, with the longest individual having 487 years. The oldest five samples are available since 1515 AD, resulting in a full chronology time spanning from AD 1515 to 2015. Subsequently, a standard protocol was followed for cutting tree rings precisely under a binocular and split into smaller pieces using a razor blade [57].

2.3. Development of the Stable Oxygen Isotope Chronology

Since the extremely narrow tree rings of junipers pose an analytical challenge to provide sufficient material for isotope analyses, equal wood masses of five individuals of exactly dated trees (1957–1515) were pooled prior to isotopic analysis and further processed for α-cellulose extraction. In previous methodological studies evaluating the common signal between individual isotope series from juniper trees [29] and the suitability of different pooling methods, we demonstrated that this number of trees and the approach of inter-tree pooling is the best alternative to individual-tree isotope measurements [59]. Inter-tree pooling enables the establishment of a reliable regional δ18O isotope chronology providing a representative climate signal for the region. To calculate chronology quality parameters like expressed population signal (EPS) and inter-tree correlation [60] for our δ18O chronology, stable oxygen isotopes ratios of the last 58 years (1958–2015), were analyzed individually for the included trees (Figure 2). Since inter-tree pooling results in only one single annual δ18O value for each year, calculation of Rbar and EPS was not possible for the chronology sequence 1515–1958.
We extracted α-cellulose of bulk wood material following the chemical multi-stage procedure described by [61]. The α-cellulose samples were subsequently homogenized using an ultrasonic system, freeze-dried, and loaded into silver capsules. The stable oxygen isotope compositions of α-cellulose samples were measured by an isotope ratio mass spectrometer (Delta V Advantage, Thermo Fisher) interfaced to a high temperature (1450 °C) pyrolysis reactor (HT Oxygen Analyzer). The analytical precision of δ18O measurement was typically better than ±0.25‰.

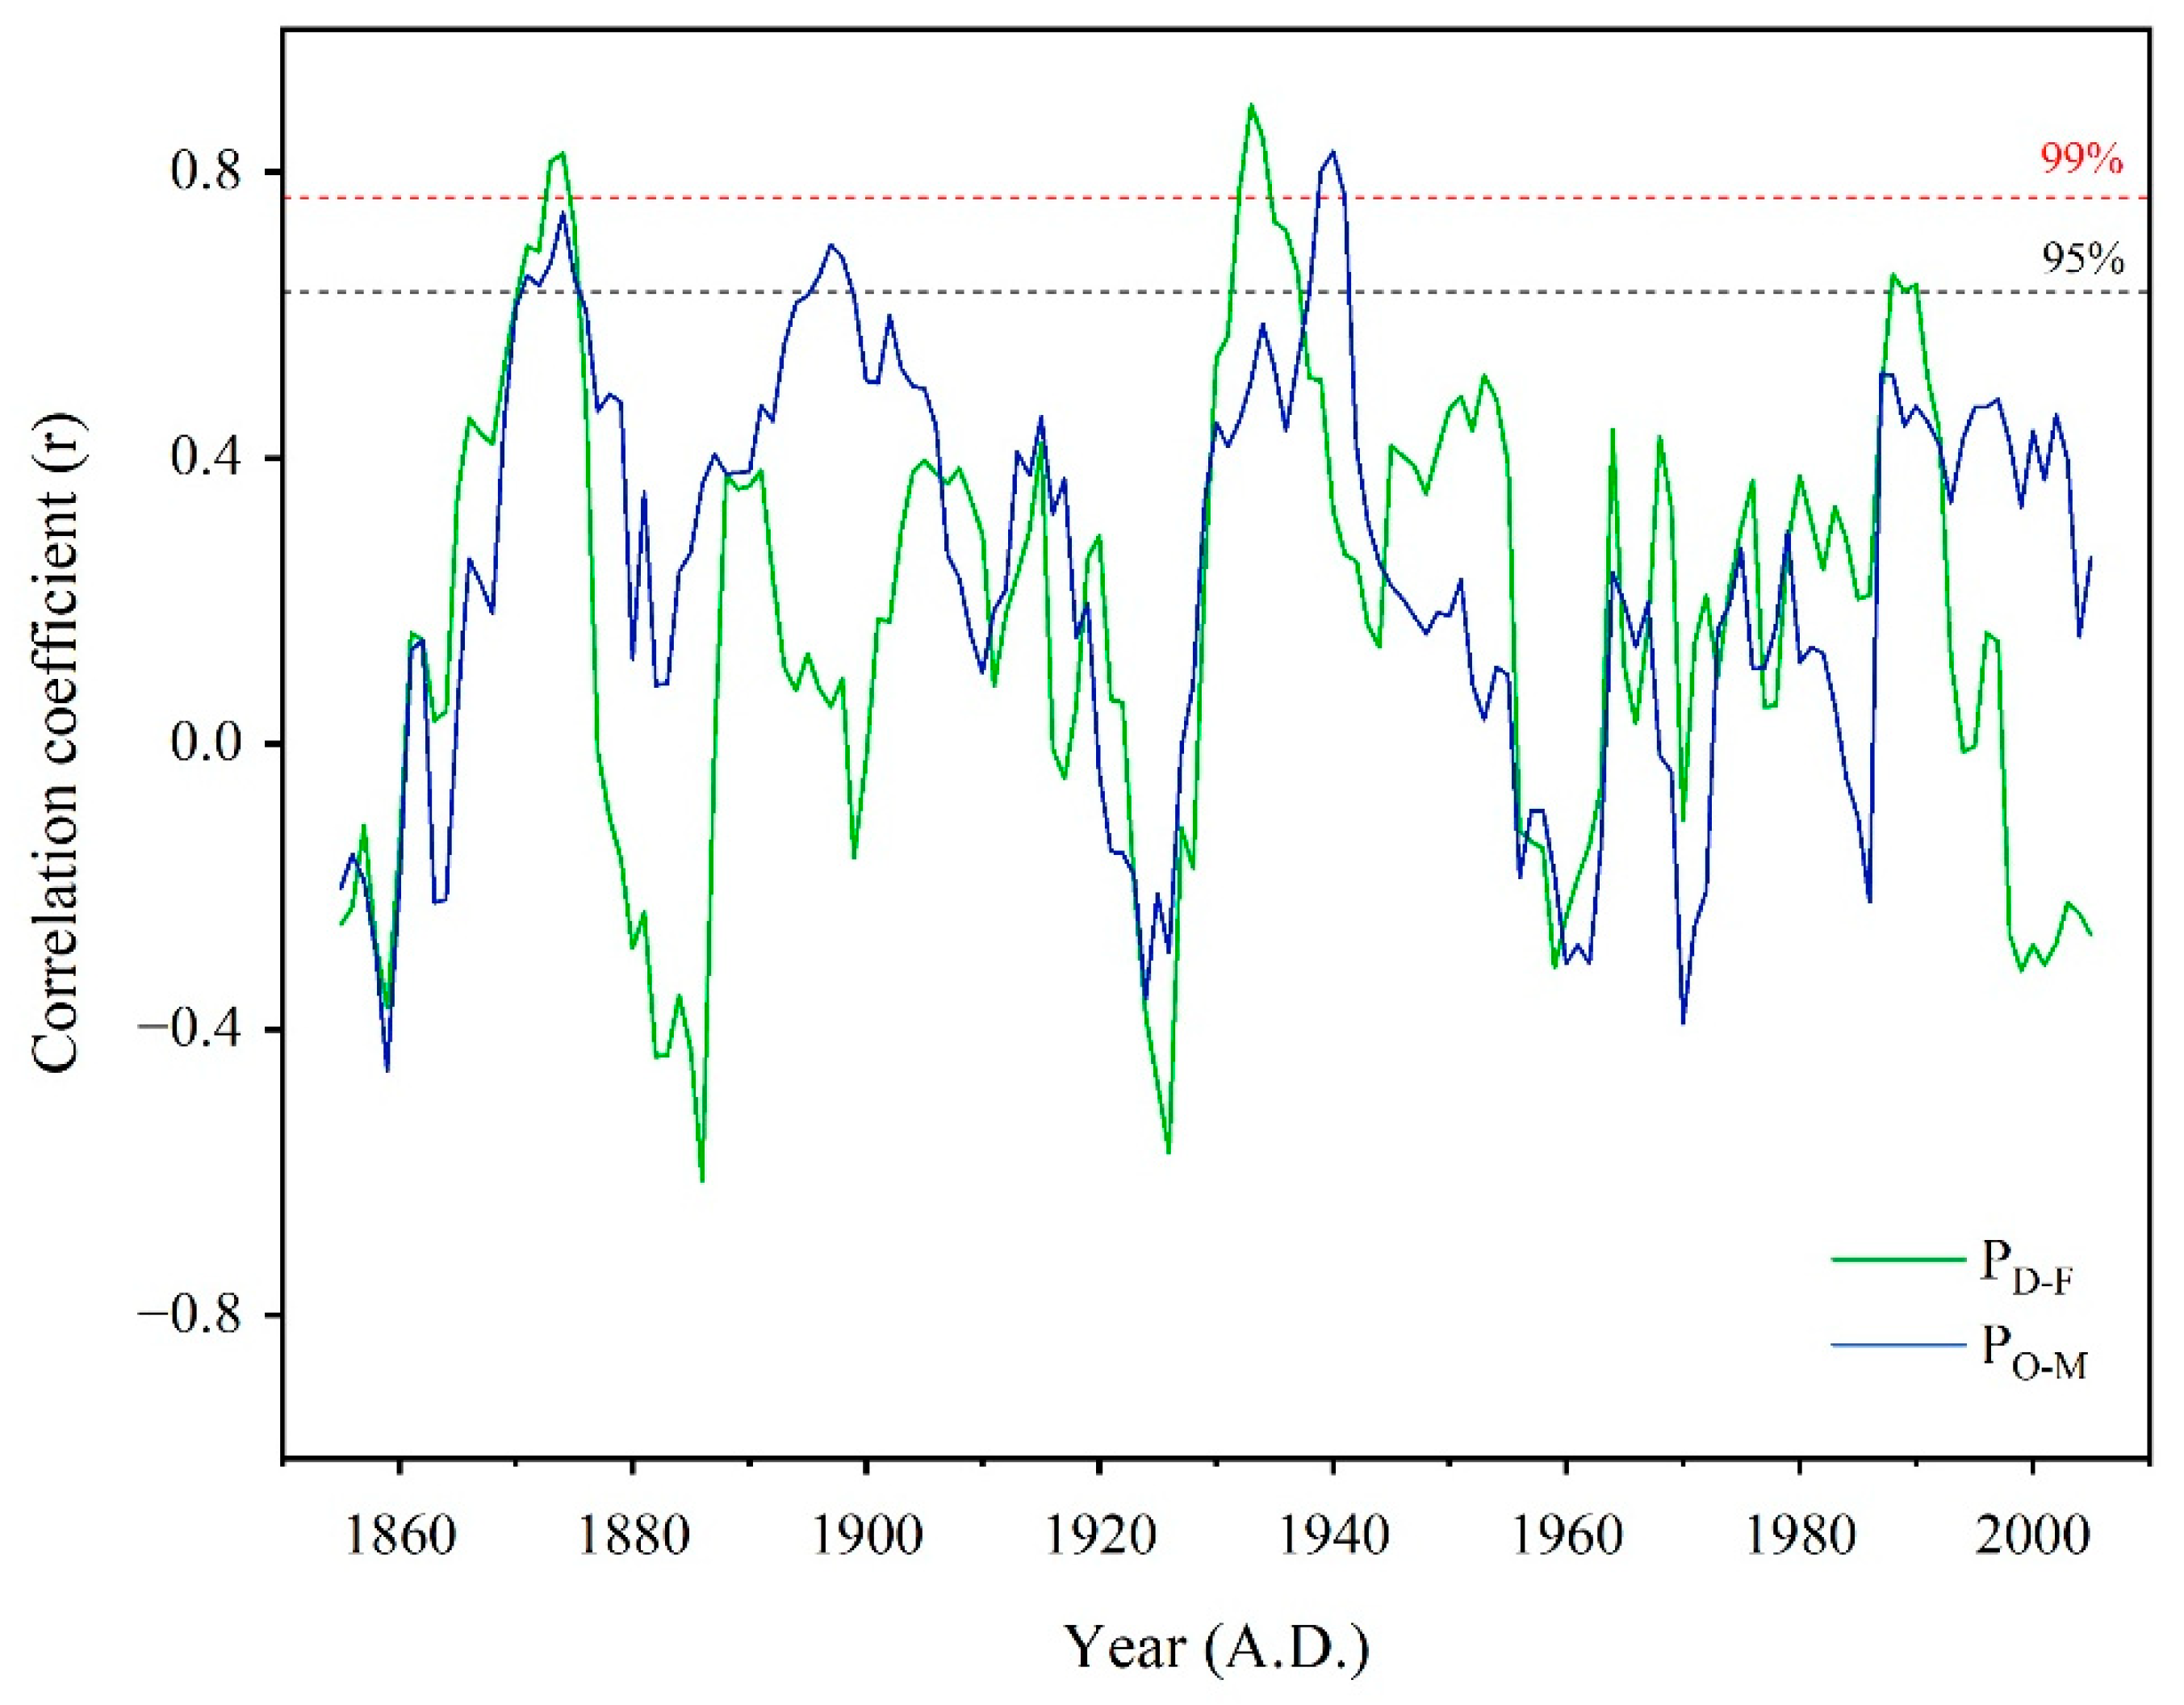
2.4. Climate Reconstruction and Statistical Analysis

To determine the proxy-precipitation relationships, we calculated Pearson’s correlation coefficients between tree-ring δ18O and precipitation data obtained from several instrumental and modeled sources available for the study site. We also tested correlations with vapor pressure and temperature data from CRU TS 4.03, 0.5° × 0.5° grids [62], and Mojen climate station, respectively.
According to the high correlation coefficients between δ18O and precipitation records from the nearby meteorological station of Mojen, this station was selected for further in-depth calibration analyses at monthly and seasonal time scales. The calibration of the oxygen isotope series with precipitation data was accomplished by calculating Pearson’s correlation coefficients over the time span from January of the previous year (py J) until September of the current year (S). Furthermore, the total precipitation of different seasons: previous January–March (py winter; py JFM), April–June (py spring; py AMJ), current January–March (winter; JFM), and April–June (spring; AMJ) seasons were calculated and correlated with the δ18O series. Based on the highest observed correlations between the δ18O chronology and seasonalized precipitation data during the calibration period of 1982–2015, a linear regression model was developed to reconstruct past precipitation conditions.
Due to the short period of available instrumental records (34 years; 1982–2015), the leave-one-out cross-validation method was employed to assess the reliability and stability of the transfer function trough time [63]. Thus, reconstruction evaluation parameters including the reduction of error (RE), the sign test (ST), F-test, Durbin–Watson test and product means test (PMT) were calculated [15] using the open source R software [64].
In order to identify dry/wet events, we defined the intensity of dry/wet years following the classification introduced by Liu et al. [65]: dry year < mean − 1σ, wet year > mean + 1σ, extreme dry year < mean − 2σ, extreme wet year > mean + 2σ. We additionally conducted Wavelet analyses to identify significant periodicities of precipitation variations in our multi-century reconstructed data. In doing so, the ‘morlet wavelet analysis’ [66] method was employed using the dplR package in the open software R [67].
In order to further validate the reconstruction with regional historical datasets, we collected information on historical hydrological extreme events recorded throughout Persian history and compared them with our reconstructed precipitation series [68,69,70,71,72]. We also compared our reconstruction with two other existing precipitation reconstructions established for western Iran to analyze the coherence of precipitation fluctuations on decadal time scales and to test for the spatial extent of extreme events at annual resolution. The available reconstructions have been derived from tree-ring width data of oak (Quercus macranthera) from the central and southern Zagros Mountains, respectively [5,34]. Therefore, we calculated Pearson correlations and moving correlations between the respective paleoclimate reconstructions.
To test for the influence of large-scale atmospheric circulation patterns on our local spring precipitation reconstruction, we also computed correlations between our reconstructed precipitation and several climatic indices, including the North Atlantic Oscillation (NAO) and the Atlantic Multi-decadal Oscillation (AMO), which were downloaded from the National Oceanic and Atmospheric Administration (NOAA) databank (www.esrl.noaa.gov).

3. Results and Discussion

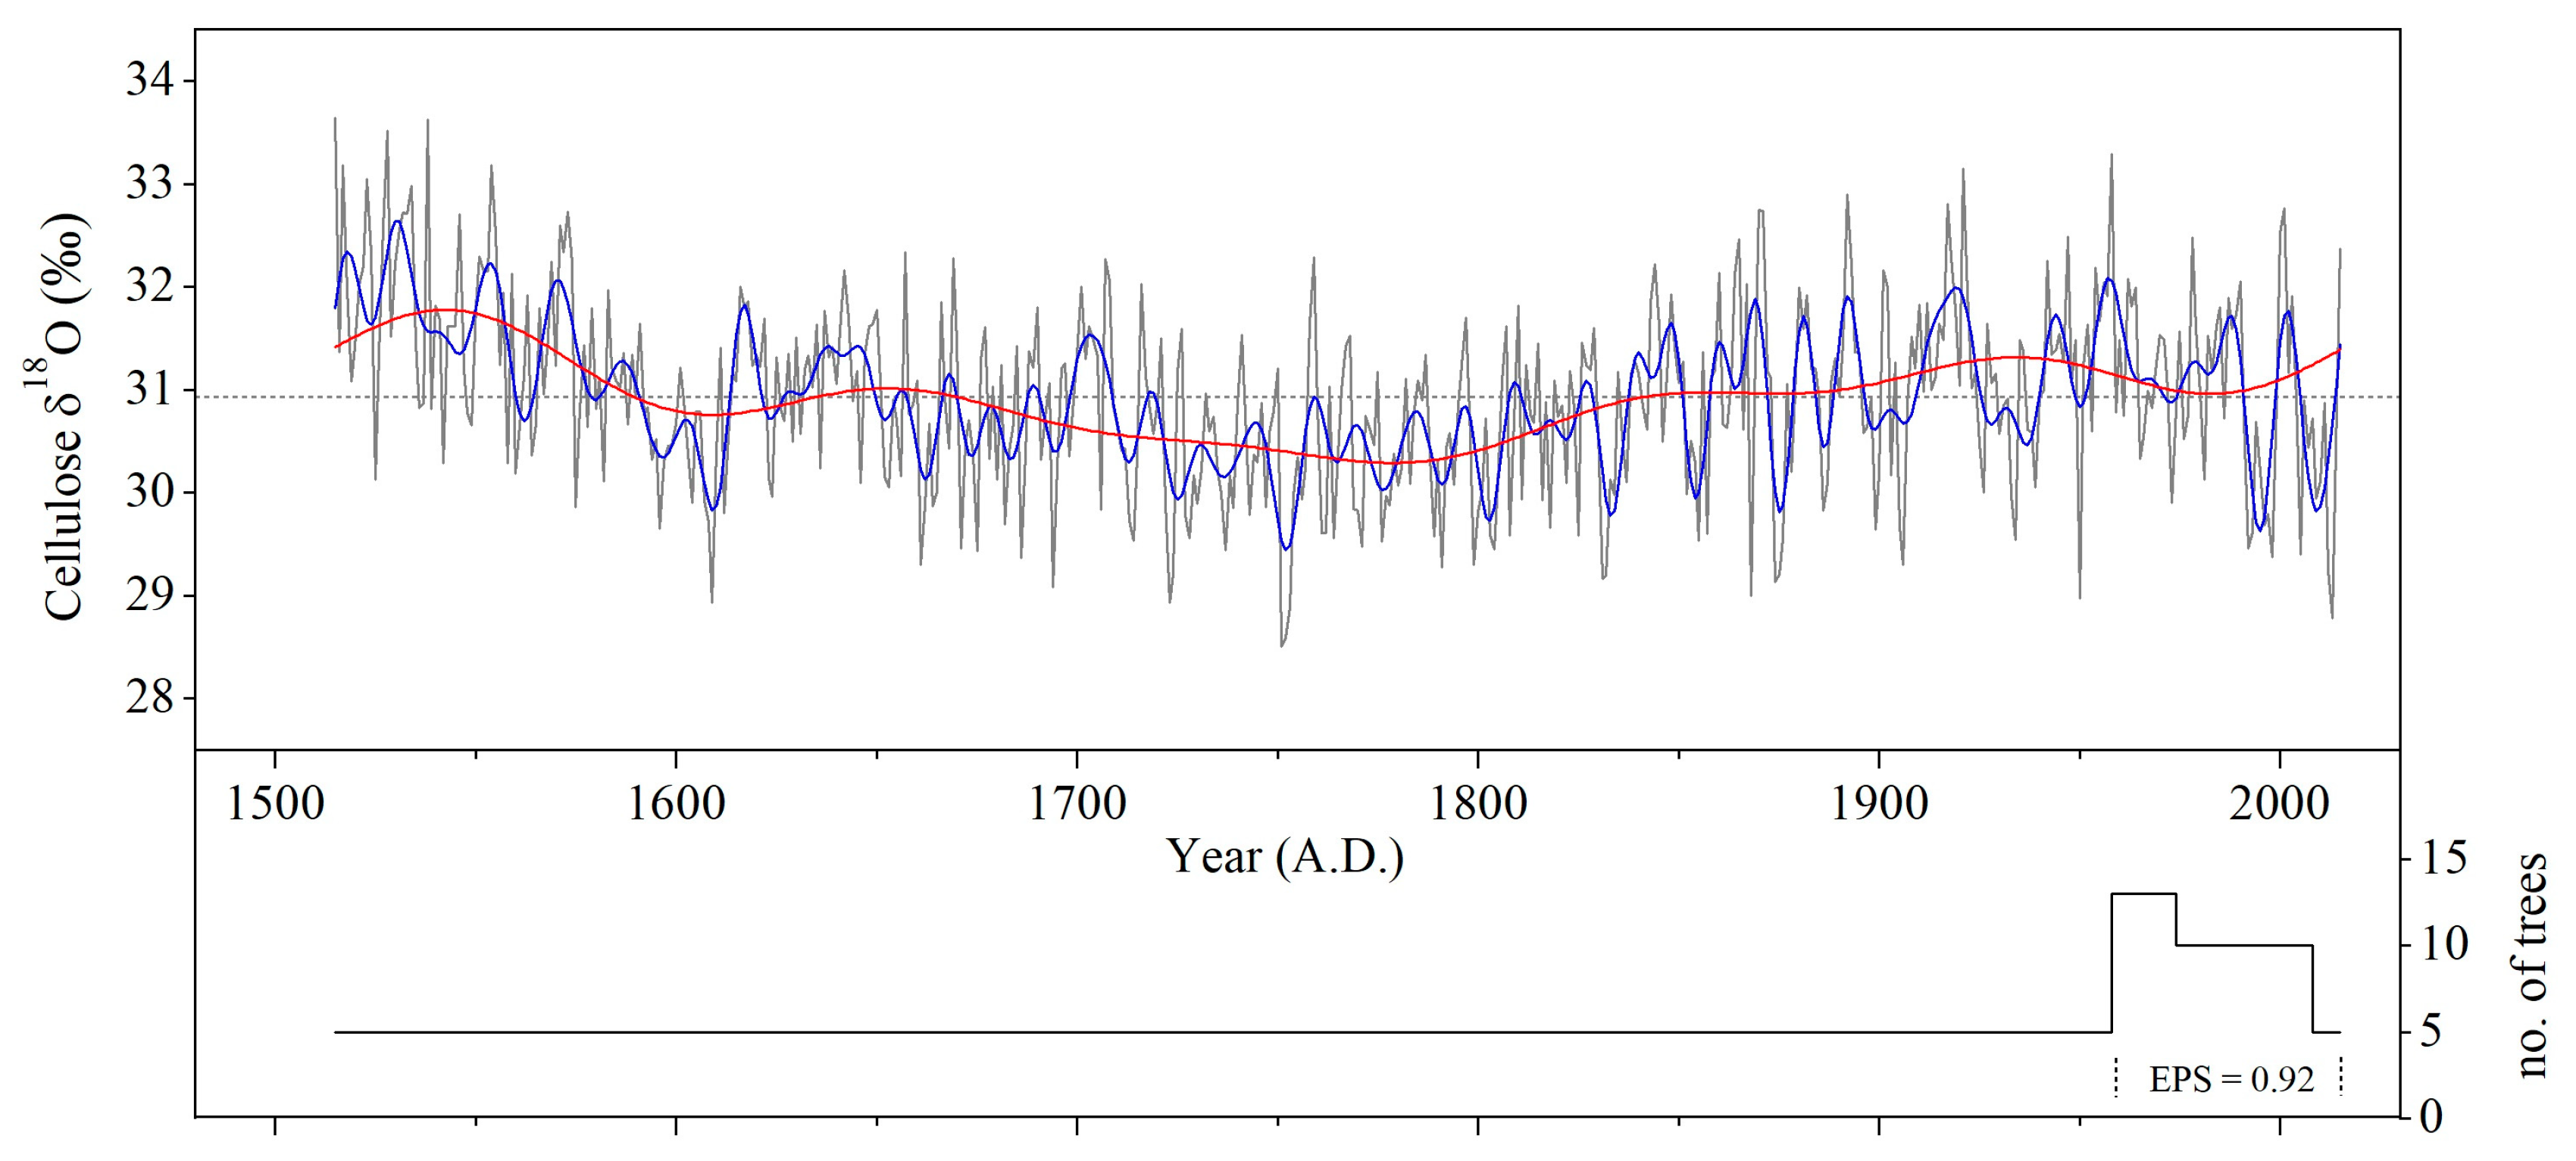
3.1. Characteristics of the Tree-Ring δ18O Chronology

Our resulting δ18O chronology extends from 2015 back to 1515 AD (Figure 2). The mean δ18O value of the chronology is 30.94‰ ± 0.91, with a range of δ18O values between 28.51‰ and 33.64‰, respectively (Table 1). The average Rbar and EPS calculated for the period 1958–2015 were 0.48 (p < 0.01) and 0.92. This exceeds the commonly accepted threshold of 0.85 for sufficient signal strength of a chronology [60], indicating a high consistency between individual trees’ isotope series. Hence, we are confident that isotope chronology is also robust for the time before 1958, for which isotope samples were pooled for individual years (Figure 2).
The first-order autocorrelation coefficient (AC1) was 0.41, indicating a significant influence of the previous year on the isotopic composition of the current tree ring. Trees with the access to snow meltwater or/and groundwater stored over one growing season can carry the climate signal of the preceding year along with the actual climate signal [73,74,75]. Moreover, memory effects stemming from the incorporation of carbohydrates taken up during preceding years into the earlywood cell walls formed in the following year may contribute to the isotope signal of the whole tree ring. Considering the often very narrow tree rings of junipers of ca. 0.1 mm and their small portions of latewood, we nevertheless had to conduct stable isotope analyses for whole tree rings.
Our multi-century δ18O chronology showed higher oxygen isotope values during the 16th century. Since the mid-16th century, a steady decline in tree ring δ18O values can be observed (Figure 2). From ca. 1670–1840, δ18O values stayed below the 501-year mean δ18O values for two centuries, with a gradual increase since 1790 AD. With regard to findings of Foroozan et al. [29], more humid local climate conditions can be inferred for this period, as it was identified as a cooler period by Bayramzadeh et al. [36]. After 1850 AD, the stable oxygen isotope ratios are constantly above the long-term mean, indicating generally drier climate conditions in northern Iran.

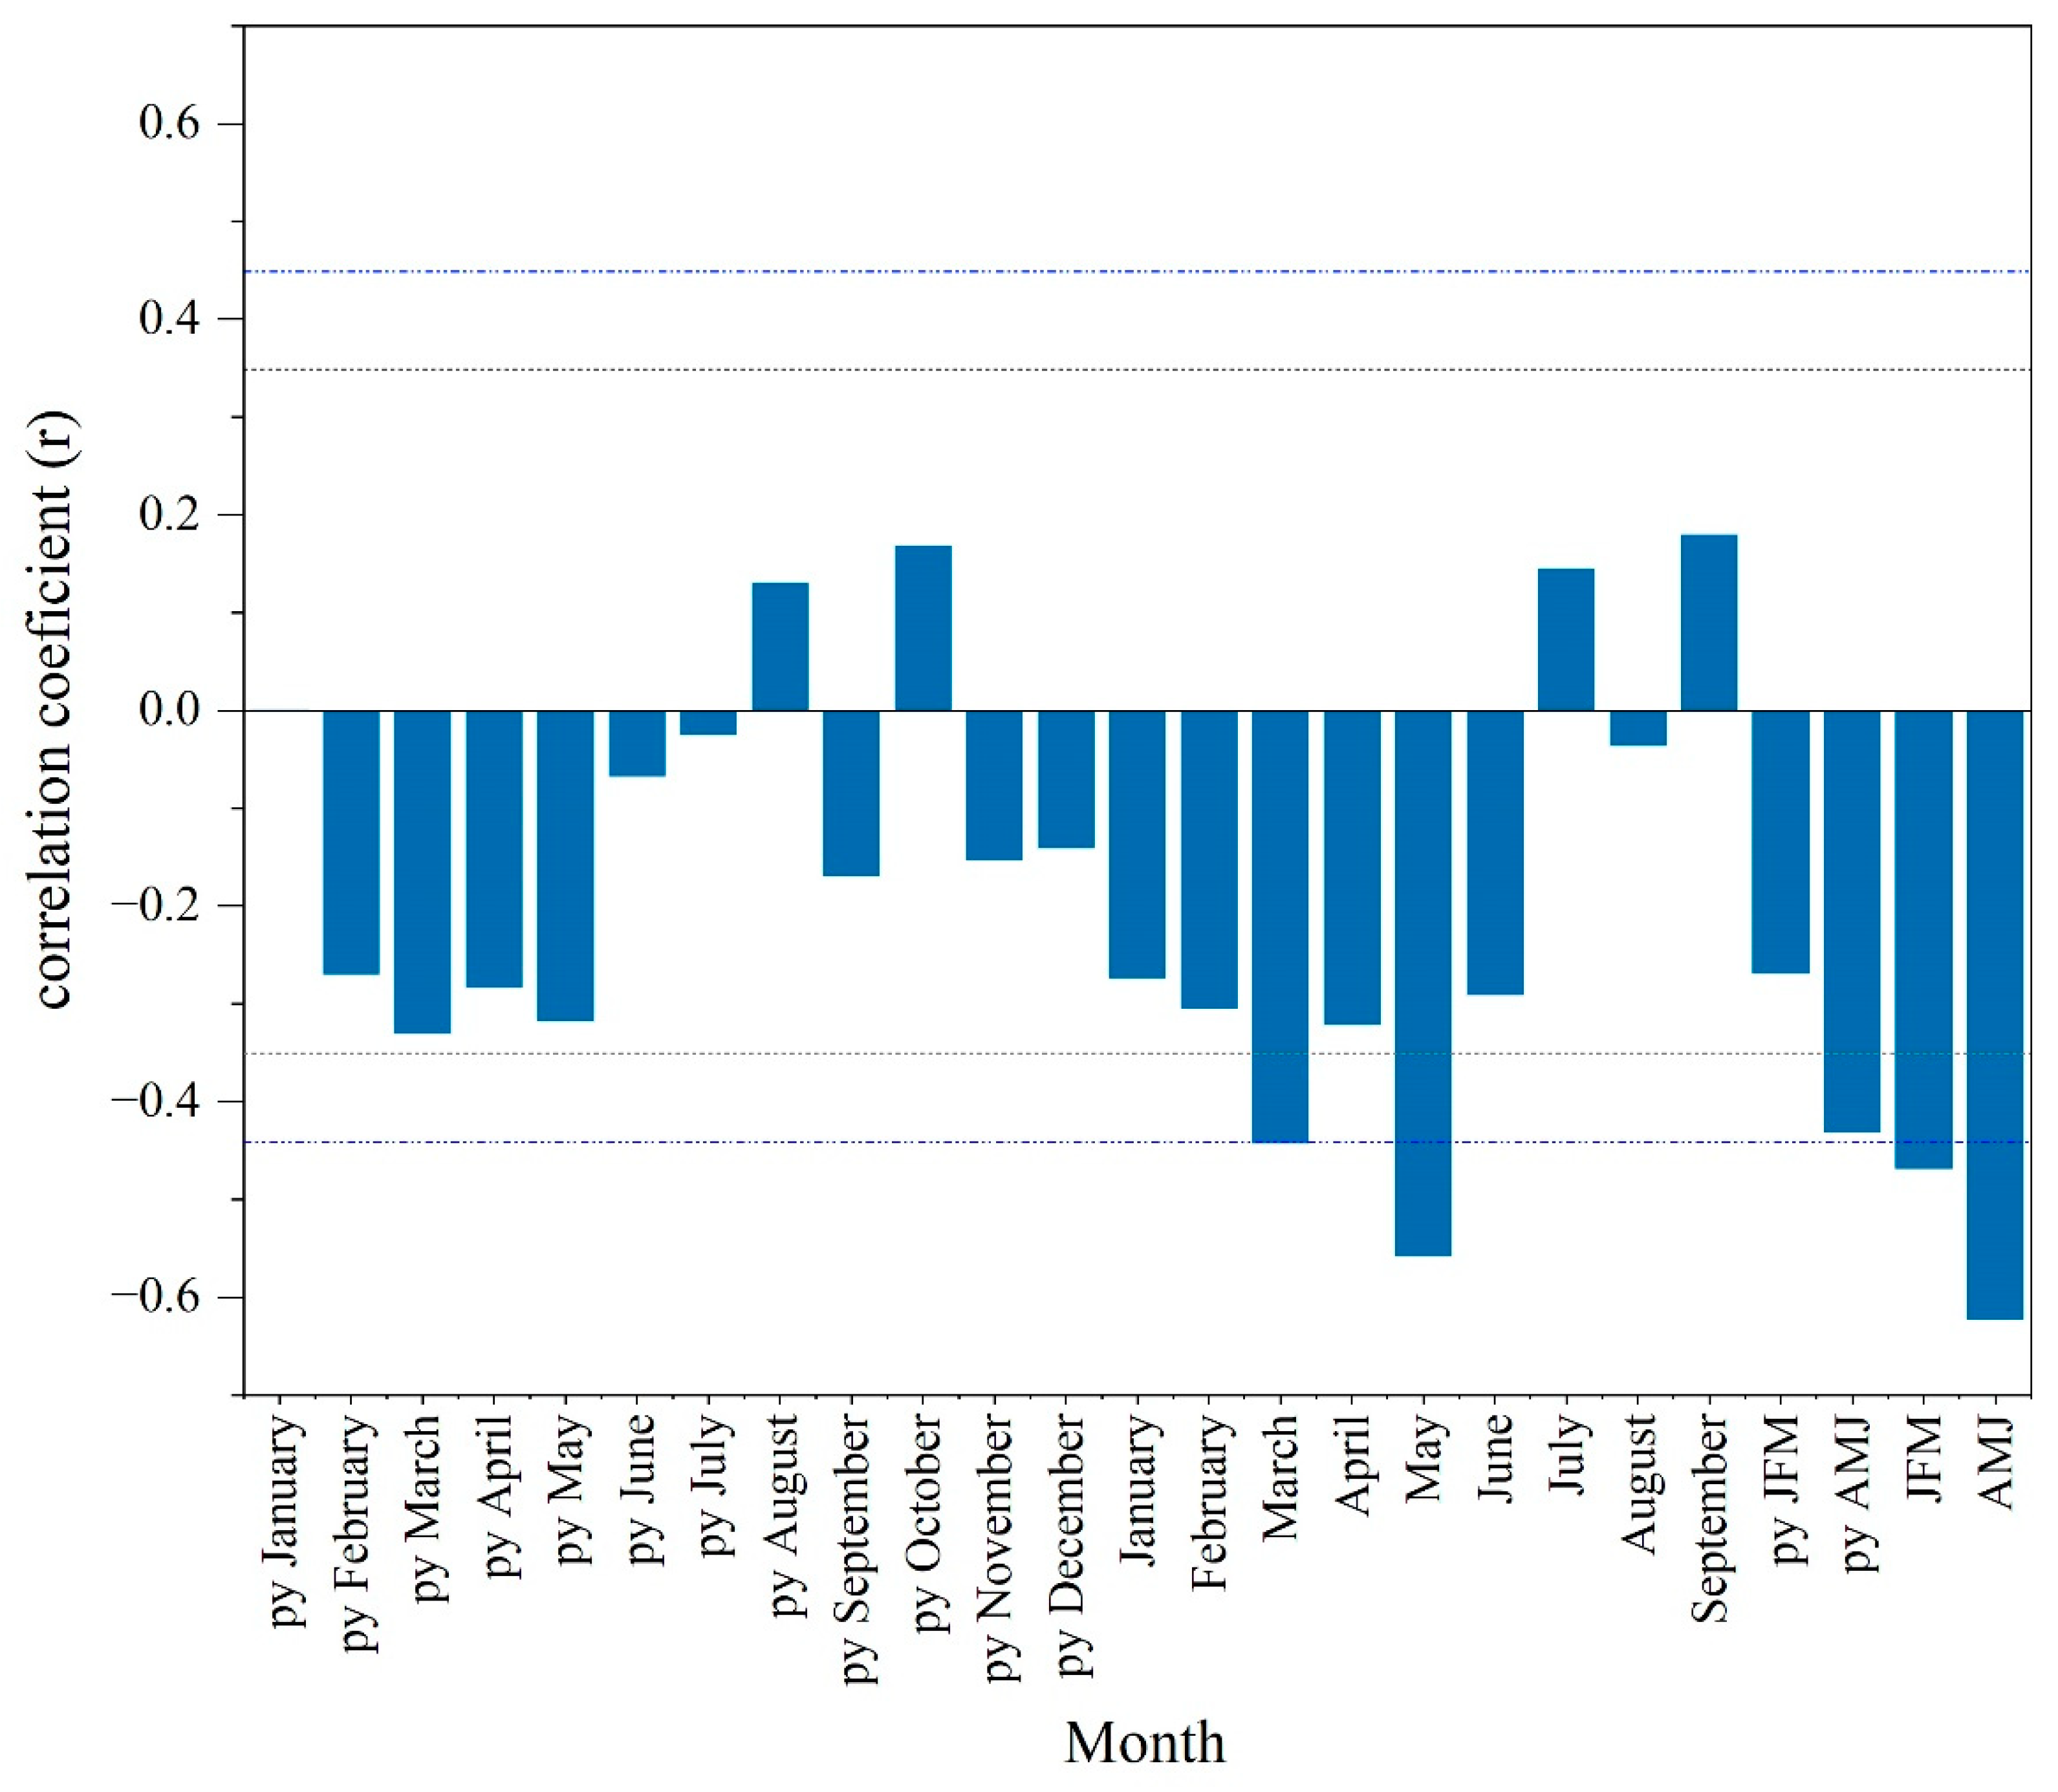
3.2. Climate—δ18O Response

Figure 3 illustrates the proxy-climate relationships as derived from calibration analyses between our δ18O series and climate data from Mojen station.
In general, a significant negative relationship was observed between tree-ring δ18O values with monthly precipitation during spring and winter months in both the current and previous year. Like in other studies conducted in Asia, statistically significant negative correlations were found between the tree-ring δ18O values and precipitation [24,45,47,76,77,78]. Strongest negative correlations are apparent for tree-ring δ18O and April–June seasonal precipitation during the year of growth (r = −0.62, p < 0.01), indicating the major influence of spring precipitation on tree-ring δ18O variations during the calibration period (AD 1982–2015) (Figure 3).
In general, the variability of the oxygen isotope composition of plant organic material, such as tree-ring cellulose, depends on three main sources. The first source of δ18O variability is determined by the source water absorbed from the soil by tree roots, which flows through the xylem into the leaf without further fractionation [79,80]. Source water for trees derives from meteoric water including local rainfall and snow, and from water stored in deeper soil layers or groundwater. The δ18O of source water is determined by the isotopic composition of precipitation, which varies mainly with temperature [57,81]. The δ18O of precipitation in high latitudes is in positive relation with temperature during droplet formation, so that winter precipitation under cold conditions will be more depleted in δ18O [20,81,82,83]. Further, δ18O in soil water alters by residence time in the soil and evaporation from the upper soil layers, causing the highest δ18O enrichment in the superficial water pool [84]. However, trees growing under drought conditions may use the deeper soil water pool, if the superficial soil moisture is depleted. Accordingly, such trees can show a different source water signal from the enriched δ18O signal of the upper soil layers [85,86,87].
The second source of tree-ring δ18O variability is the δ18O variations in leaf water. Within leaves, the δ18O signal of the source water is modified at the evaporative sites as the result of evaporative losses of the lighter water isotopologues H16O during transpiration [88,89]. This indicates the key role of relative humidity determining the gradient of the water vapor pressure in the intercellular air spaces and the air around the leaves on transpiration rate, and consequently on the evaporative enrichment of leaf water [23,88,90,91]. Accordingly, plants growing at higher vapor pressure deficit are expected to have higher leaf water enrichment [92]. However, this is the case when the variation in evaporative demand controls the transpiration rate [89]. The other likely scenario happens when the dominant advection of non-δ18O enriched water from the xylem to the evaporative sites hinders the isotopically enriched water to diffuse back from the evaporative sites to the leaf lamina, where it mixes with unenriched xylem water, which is called Péclet-effect [88,89,93]. According to the conceptual Péclet model, the greater the Péclet number, the less the enrichment of water in the leaf will be. However, conifer needles have a rather low density of stomata, and their transportation rates are relatively low. In addition, the variation of their effective path length for water movement through the mesophyll is not very well understood [94]. In this concept, some studies even applied a two-pool model as a sufficient alternative to explain the leaf water enrichment in conifers [94,95]. The two-pool model proposes the existence of two separate water pools within leaves, the unenriched source water mainly in the major veins and the enriched water in the evaporative site, to explain the difference between the isotopic enrichment of leaf water and evaporative site. Either way, compared with the positive effect of the evaporation on leaf water enrichment, the negative effect of the Péclet model is negligible and will further diminish through the process of tree-ring formation. Hence it does not have a considerable effect on isotopic signals in tree-ring cellulose [23,96].
The 18O signature of leaf water enrichment will be imprinted on sucrose during assimilation, by which oxygen atoms exchange between enriched leaf water and carbonyl groups. Sucrose is then carried down along the trunk through the phloem to the cambium cells, where additional oxygen atom exchange occurs between sucrose and source (xylem) water during cellulose biosynthesis [97]. Based on initial measurements, an enrichment factor of 27‰ on average is considered for δ18O of cellulose relative to δ18O of the source water [98,99,100]. Thus, the isotopic signal of cellulose will eventually reflect the δ18O signal of the source water and leaf water enrichment, relative to their relative strength.
Due to the shallow root system of junipers, trees in this study use the superficial soil water pools during the growing season, which probably contain a mixture of solid winter precipitation (snow) and liquid precipitation falling during the early growing season. Therefore, the significant negative correlation (r = − 0.47, p < 0.05) between the tree-ring δ18O and winter (January–March) precipitation during the current year points to a probable use of less 18O enriched water by the trees coming from snowmelt during the early growing season for earlywood formation (Figure 3).
With regard to the negative effects of vapor pressure during spring on δ18O values (r = −0.58, p < 0.01) in junipers, the strong negative correlation between spring precipitation and cellulose δ18O can be explained by the influence of precipitation on vapor pressure and plant transpiration. Accordingly, a growing season with higher precipitation results in lower vapor pressure deficit and plant transpiration, and consequently to a lower enrichment of leaf water δ18O. Lower evaporative enrichment on the leaf level will lead to carbohydrates with a lower δ18O signature, which will be transported via the phloem down the stem to be finally incorporated in wood cellulose [23,101].
The significant positive δ18O-temperature relationship (r = 0.49, p < 0.01) supports our interpretation that the δ18O signal in tree-ring cellulose rather reflects variations in leaf water evaporative enrichment than in source water. Actually, the temperature has an indirect effect on δ18O variations in juniper tree-rings by increasing evaporative enrichment during spring.
Regarding the highest negative δ18O-precipitation correlation, the total sum of spring precipitation of the current and the previous year (r = −0.72, p < 0.01) was chosen as the most robust predictor of δ18O variations in tree rings in our study site (Table 2).

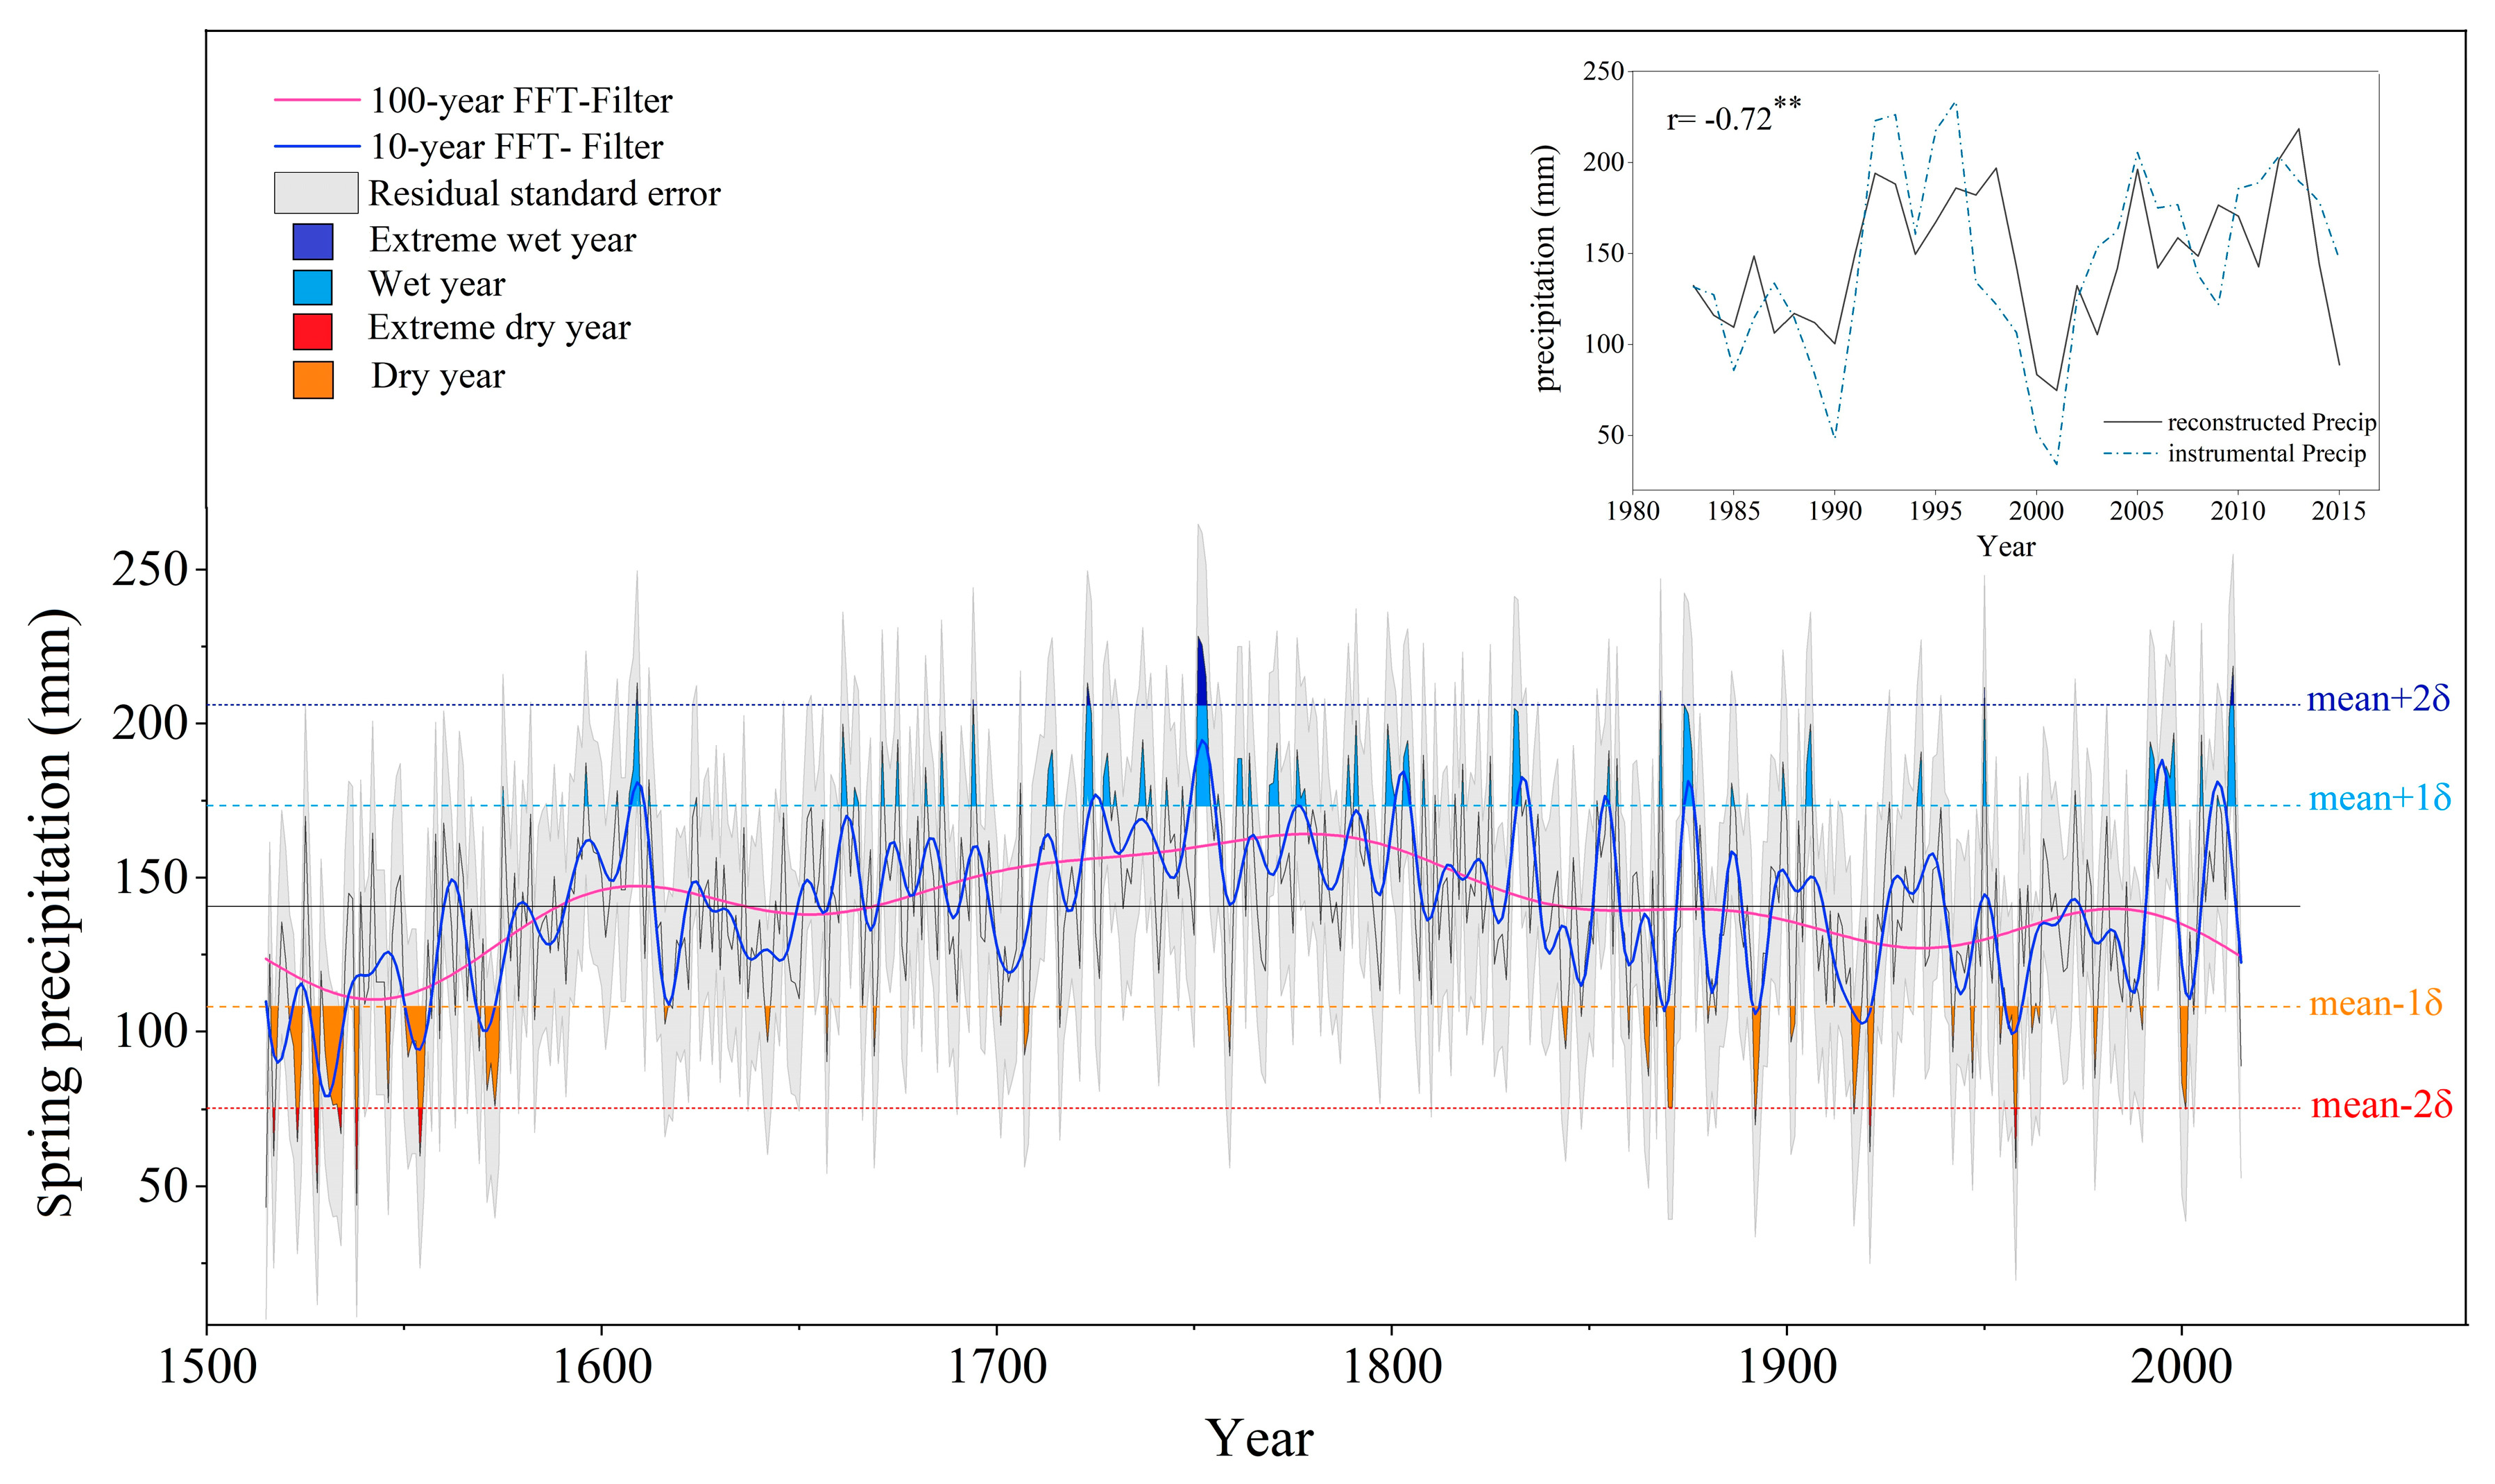
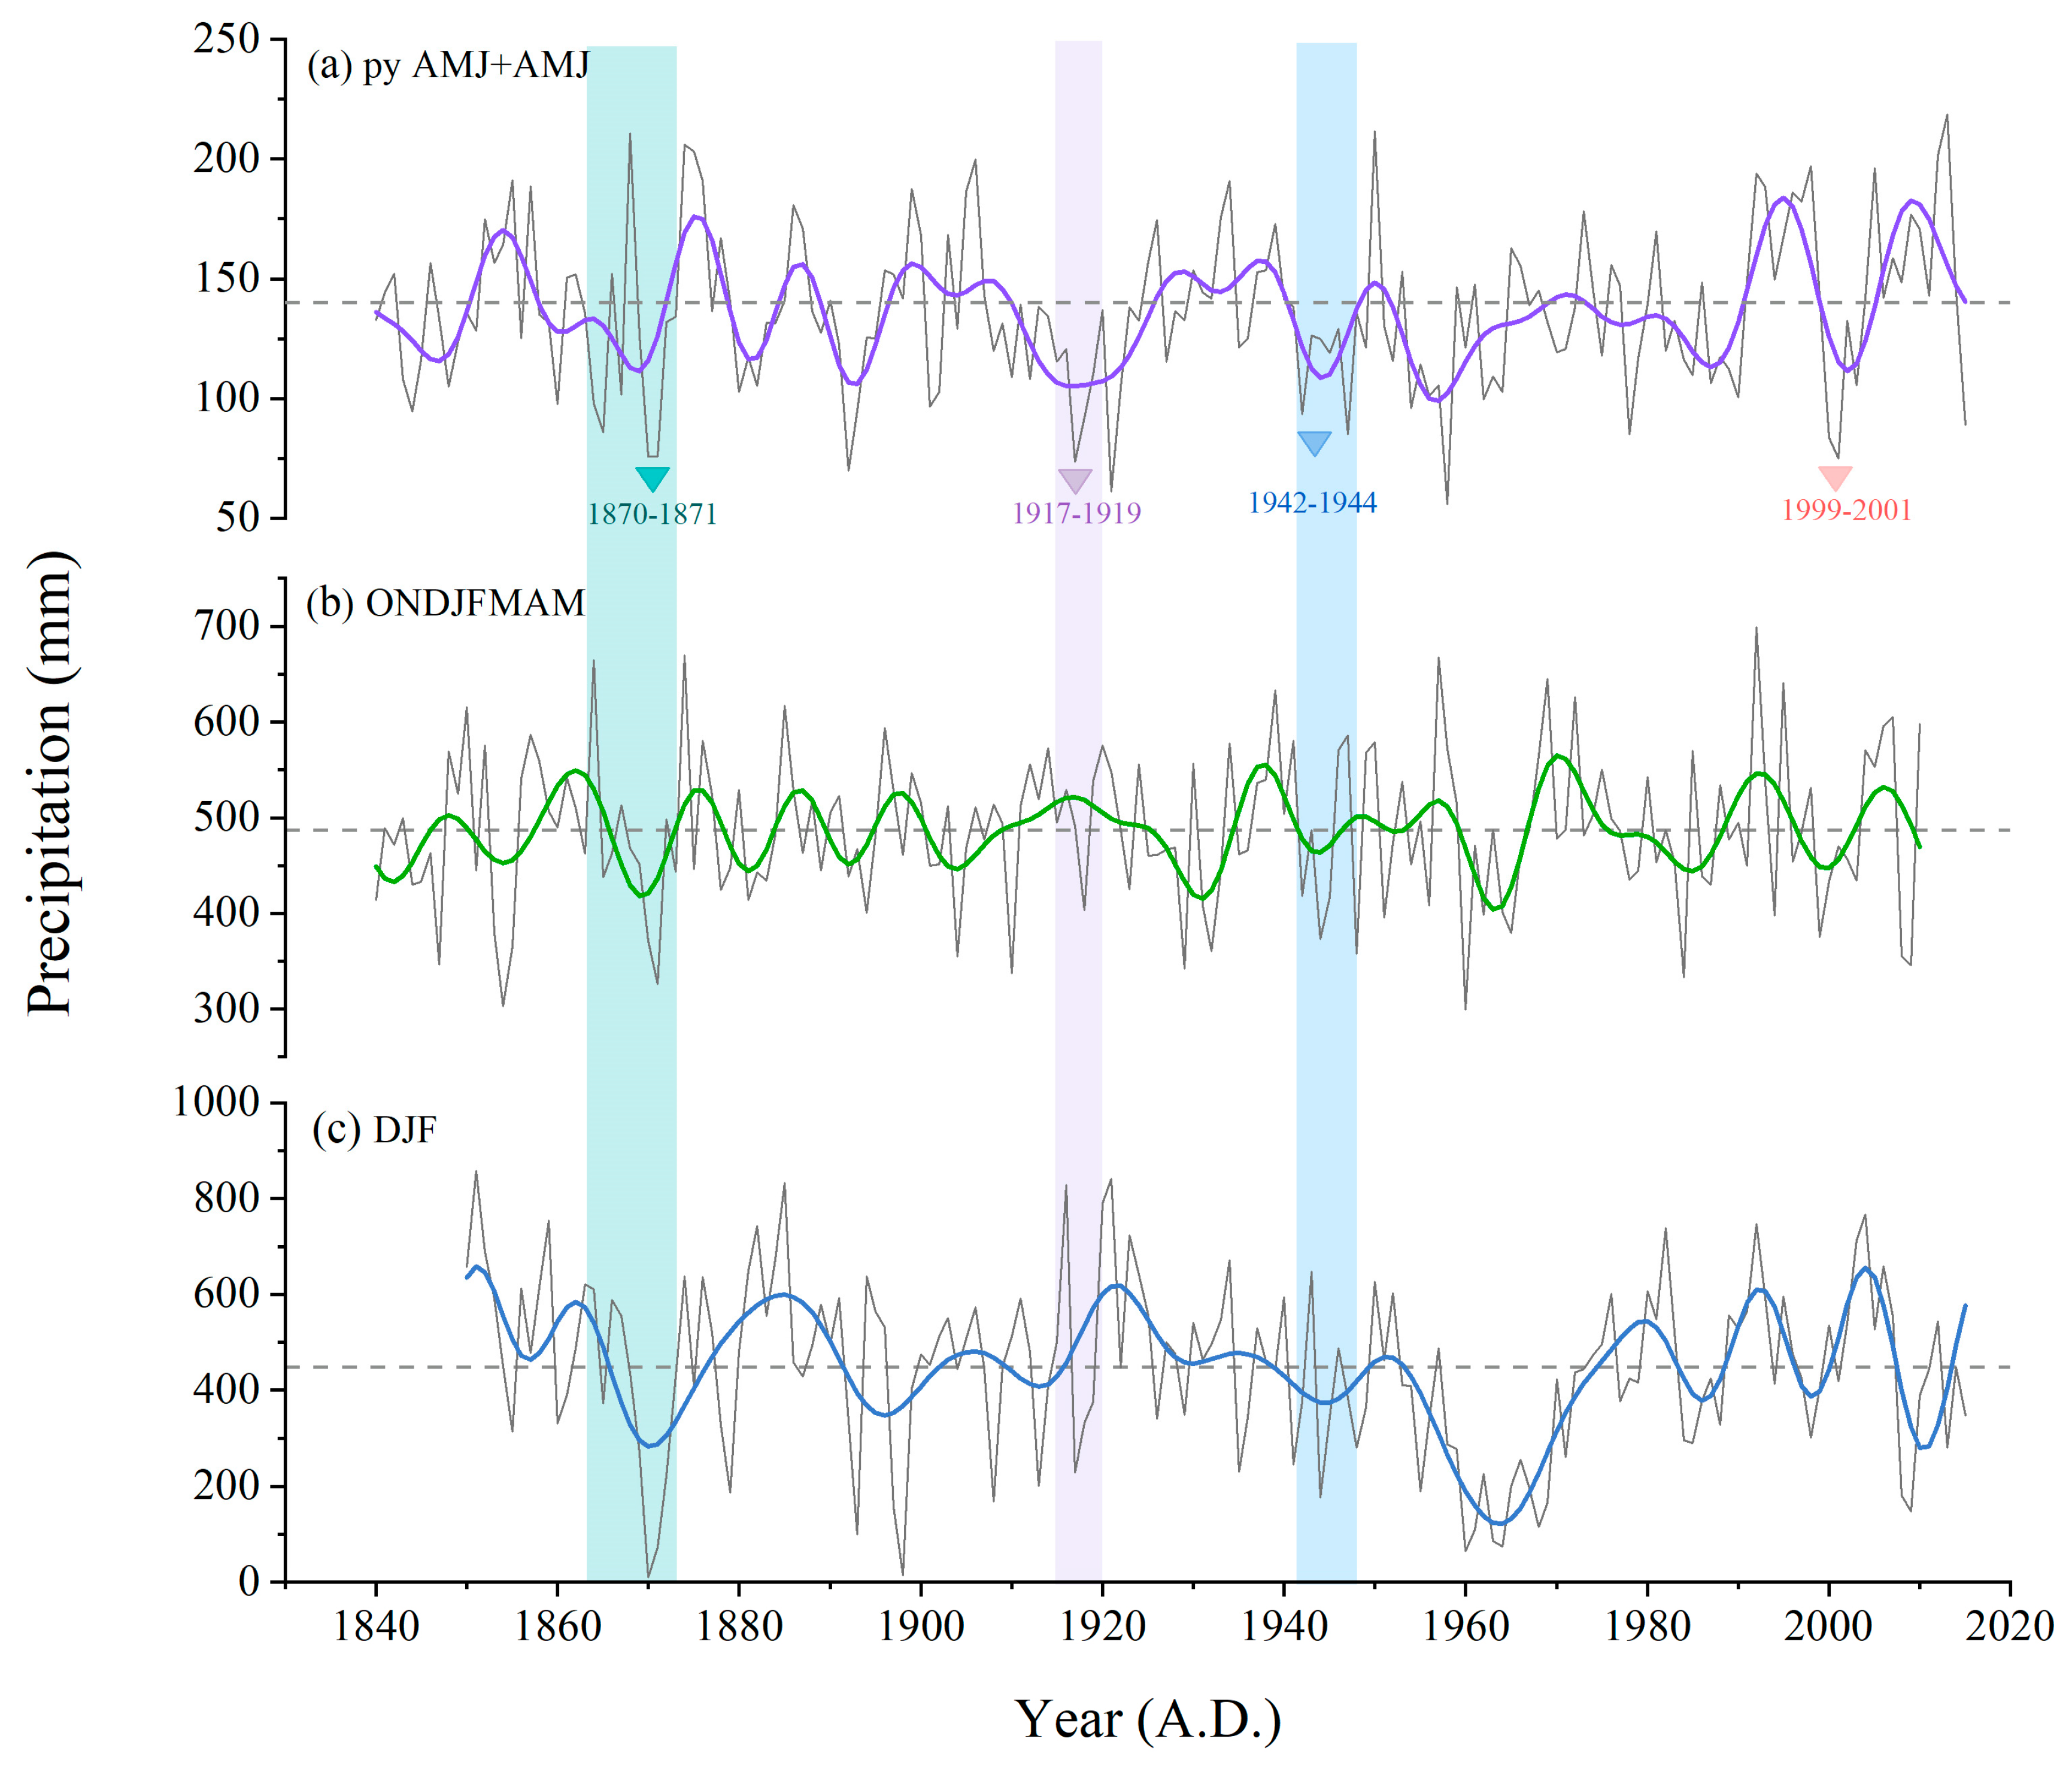
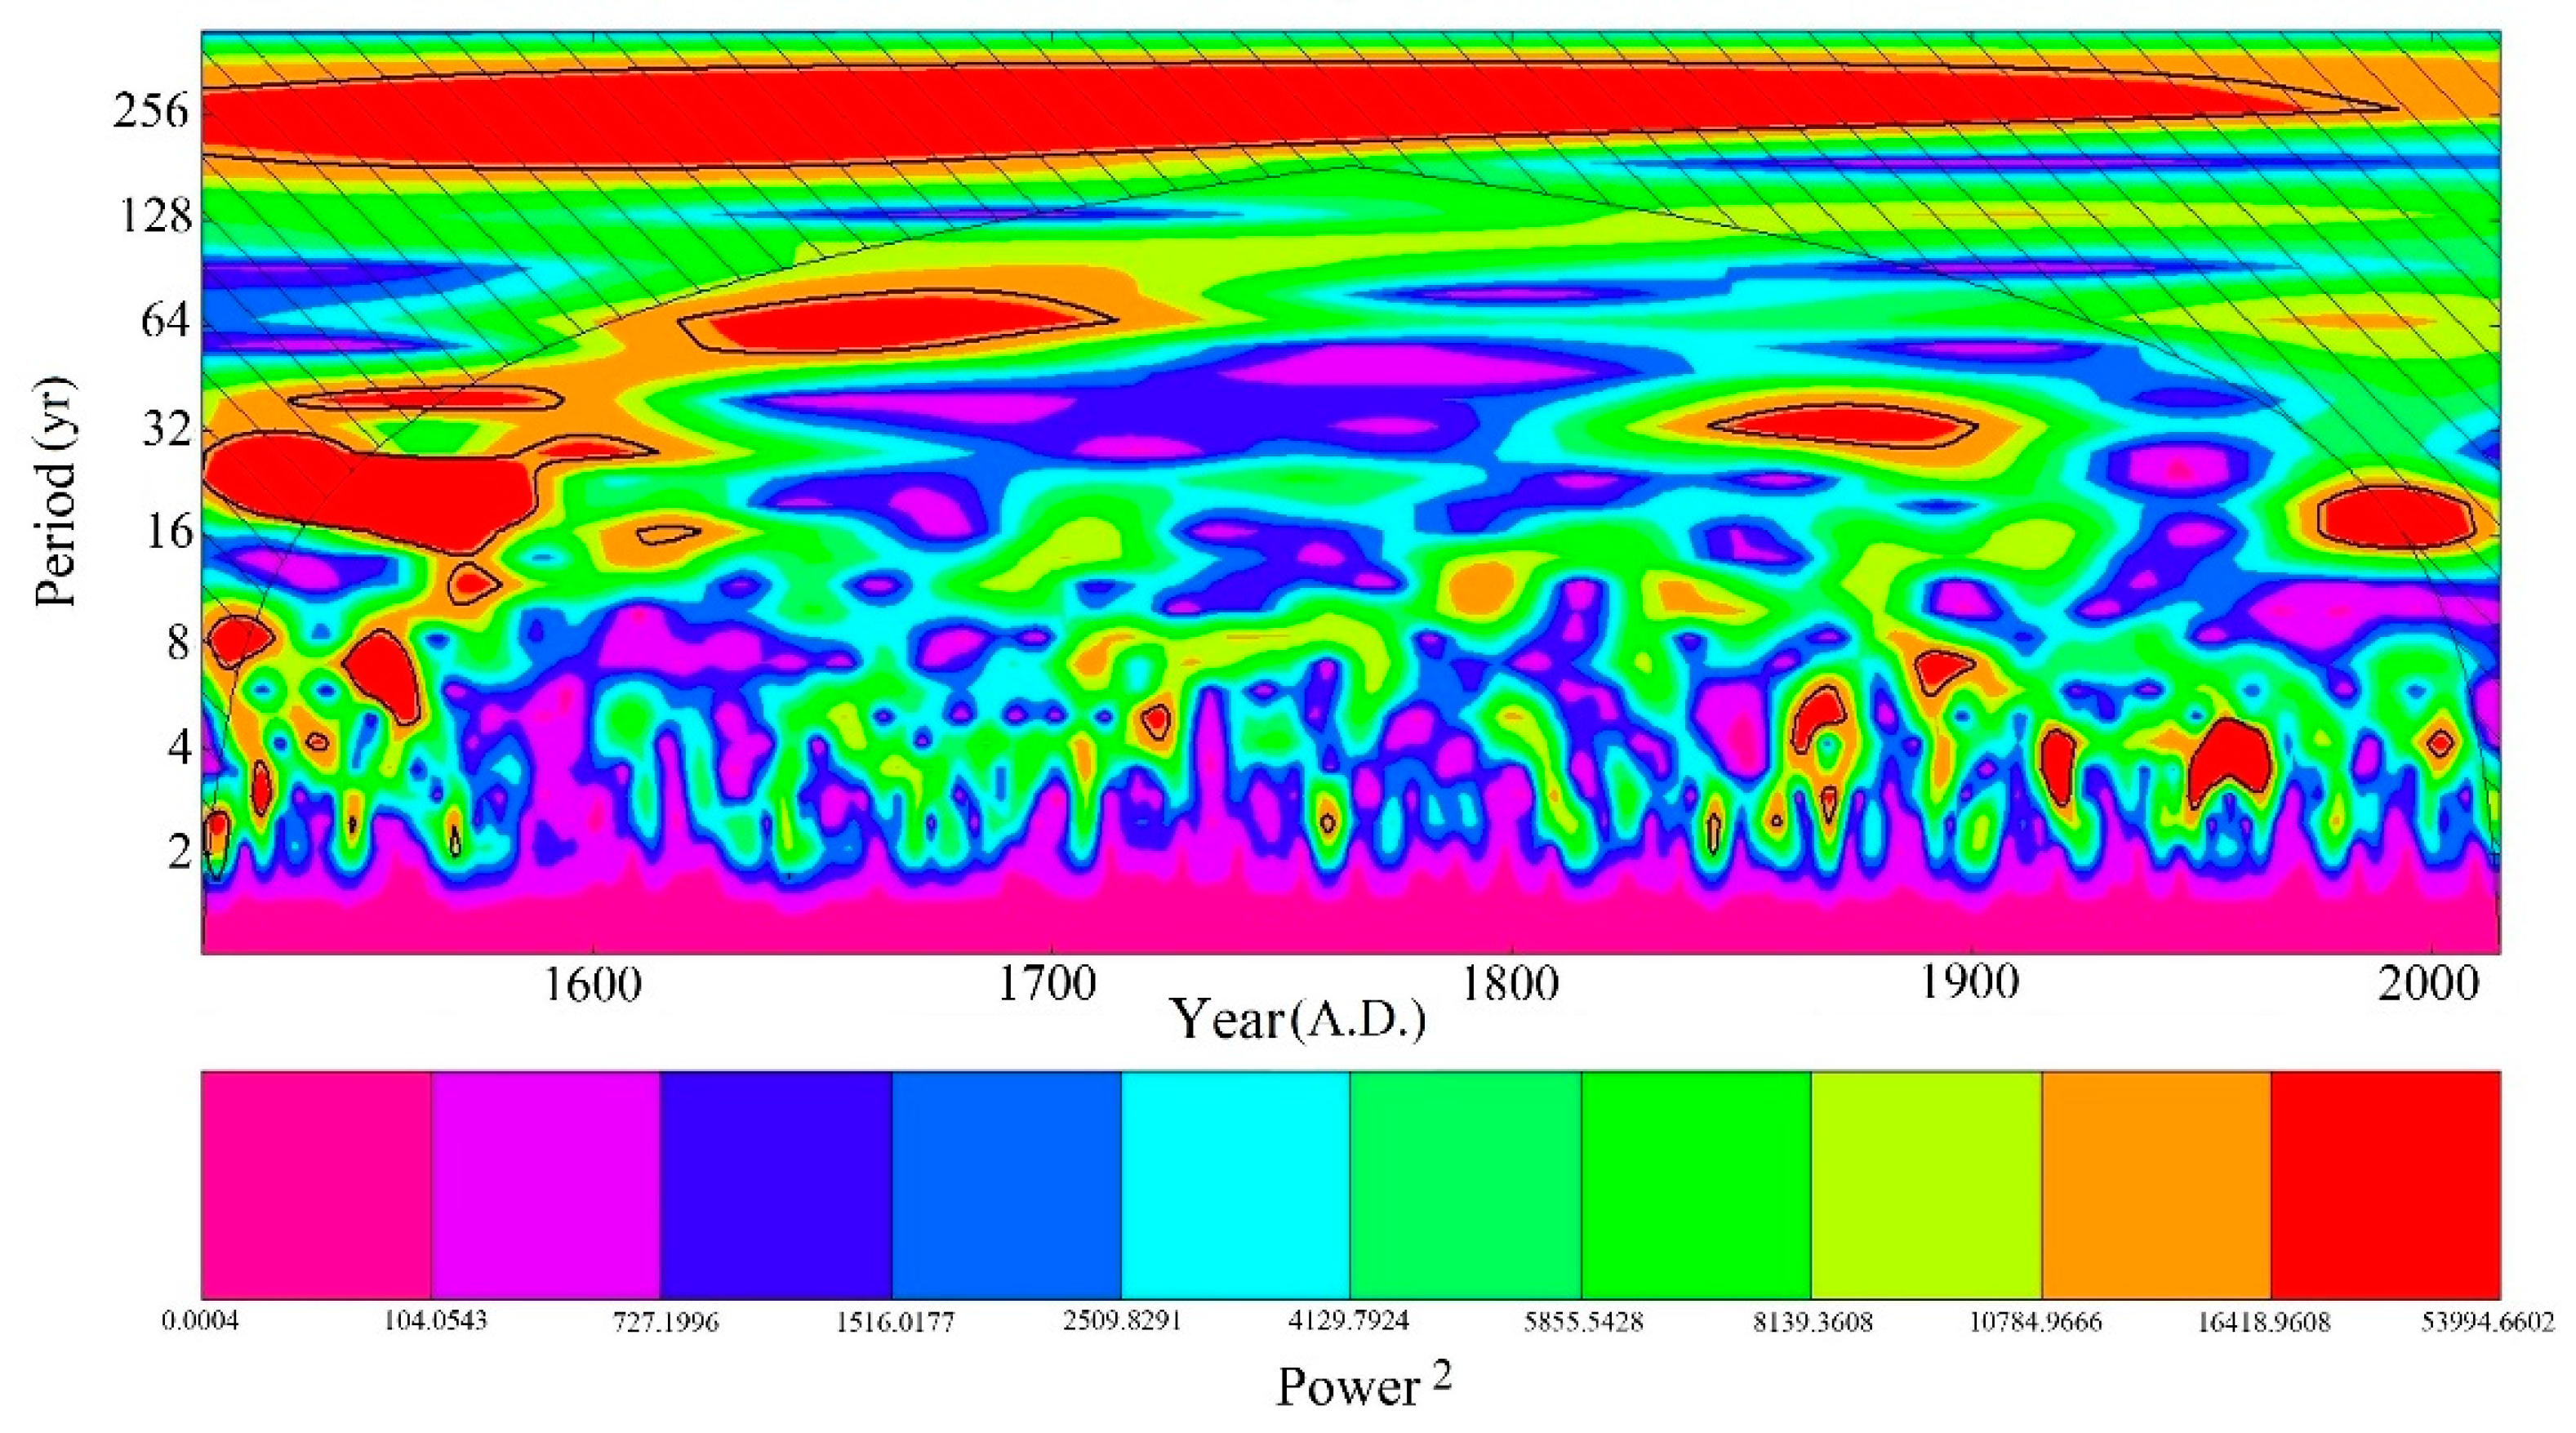
3.3. Precipitation Reconstruction

We developed the following linear regression model to reconstruct the variations in the combined total precipitation of py AMJ + AMJ in northern Iran back to 1515 AD:
Y = −36.10 × δ18O + 1257.44
Verification statistics for our precipitation reconstruction including the reduction of error (RE), the sign test (ST), F-stat, Durbin–Watson test, and product means test (PMT) [15,102,103] are shown in Table 3. The resulting reconstruction explained 52% of the actual precipitation py AMJ + AMJ variance during the calibration period. The Durbin–Watson (DW) statistic was less than 2 (DW = 1.14), meaning that moderate autocorrelation is apparent in the regression residuals of the calibration model (Table 3). Positive RE and an F-test value of 33.90 confirmed the validity and reliability of the linear regression model (Table 3). According to the significant sign-test, the number of agreements and disagreements between the reconstructed and instrumental data [15], indicates consistency in the high-frequency variations of the actual and reconstructed values (Table 3). In summary, the statistical results proved the stability and predictive skill of the regression model.
Based on these verification results, we reconstructed precipitation during the early growing season (py AMJ + AMJ) using Equation (1) for the 501-year long period from 1515 to 2015 (Figure 4). Unfortunately, the shortness of the climate data series covering only 34 years does not allow for testing the stationarity of the climate-proxy relationships. However, the explanations of the tree-ring isotope relations are meaningful from a tree physiological point of view, since the reconstructed climatic window covers the main growing season of the trees. Therefore, we have confidence that the detected main climate influence on the isotope variation in the studied trees was also valid in other climate periods and that the presented reconstruction is trustworthy.
The mean total precipitation py AMJ + AMJ reconstructed for 1515–2015 was 140.7 ± 32.7 mm. On a centennial timescale, the 16th century showed the highest negative deviation below the 501-year average precipitation (mean precip = 120 mm) (Figure 4). However, this period showed a gradual tendency towards wetter conditions into the 17th century. From ca. 1665–1840, spring precipitation stayed above average (Figure 4). The most humid periods occurred during the second half of the 18th century. These humid periods seem to coincide with cold periods at the beginning of the 17th and 18th century and 1749 until 1830, as reported by Bayramzadeh et al. [36]. In contrast, the 19th and 20th centuries witnessed a gradual decline in spring precipitation (Figure 4). Our finding is consistent with results by Khaleghi [32], who postulated for northeastern Iran a long-term declining precipitation trend over the last two centuries.
Years with relatively dry/wet AMJ periods were identified as dry year < 108 mm, wet year > 173.4 mm, extreme dry year < 75.4 mm, and extreme wet year > 206 mm, respectively. The identification of dry/wet events revealed that our multi-century reconstruction consists of 68% normal years, 17% years with relatively wet and extremely wet AMJ periods, and 15% years with relatively dry and extremely dry AMJ periods (Table A1 and Table A2). About 38% of wet and extreme wet events of the last 501 years were observed during the 18th century (Figure 4, Table 4). Hence, the 18th century was the wettest century during the past 501 years, with a mean total precipitation of 157.7 mm. The highest frequencies of dry and extremely dry year events occurred in the 16th century, the driest period of the past 501 years (Figure 4, Table 4). The 20th century can be characterized as the driest century since the past 400 years (mean precip = 133.3 mm), with the highest frequencies of the dry and extreme dry events since the 16th century. Throughout the last three centuries, the occurrence of dry events continued to rise, whereas wet year events decreased. However, the frequency of the occurrence of extreme events increased in this period (Table 4). In accordance with the NDWMC report, years with dry and wet conditions have frequently occurred in Iran during the last 30 years, while the frequency of dry years is higher [104].
Based on our precipitation reconstruction, the duration of the dry periods varied from one year to maximum five years, whilst one and two year dry periods occurred more frequently, as 70% and 21% of dry periods lasted for one and two years, respectively. The highest frequencies of one and two year length dry period has been reported for the southern Zagros Mountains in Southwest Iran [5,34] (Table A1). Longer dry periods of 4–5 years, that account for 9% of the dry periods, arose only in the 16th century. The periods 1530–1534, 1551–1555, and 1956–1958 were the longest periods with drier conditions during the 16th and 20th centuries (Table A1). The persistence of wet periods varies from one to three years, whilst 64% of wet periods lasted for one year and 21% and 13% lasted for two and three years, respectively. However, one wet period in the 18th century (1751–1754) lasted for four years. Prolonged wet periods occurred mostly in the 18th century and included about 57% of three year wet periods of the last five centuries (Table A1).
Figure 5 compares the annual and decadal scale fluctuations in the reconstructed total spring precipitation py AMJ + AMJ for the period 1840–2015, for which other precipitation reconstructions from neighboring regions are available. In particular, our reconstructed precipitation py AMJ + AMJ synchronized with reconstructed dry events in 1860–1861 [105,106], 1870–1871, 1917–1919, 1942–1945 [34], and 1958 [5,107]. Additionally, dry years in our reconstruction were contemporaneous to negative pointer years in western Asia in 1917 and 1961 [27]. Hydrological extreme events have been recurring throughout Persian history. Although Iran covers a vast area, several historic meteorological disasters resulting from widespread flood and drought occurred throughout the country. Three catastrophic famines that occurred during 1869–1873, 1917–1919, and 1942–1944 have been reported by historical documents [68,69,70,71,72]. In compliance with historical records, the decadal-frequency observations of reconstructed spring precipitation (py AMJ + AMJ) indicate that the decline in precipitation since 1861 lead to the severe drought and famine in 1870–1872 that affected almost the whole country, while eastern and northeastern Iran were affected in 1870–1871 [69,70,72] (Figure 5a). The great drought disasters of 1917–1919 and 1942–1944 were also observed in our study region [71,108] (Figure 5a).
Likewise, historical documents recorded widespread and serious flooding in 1867, 1885, 1924–1925, the 1930s, and 1948–1949 (1950, northeastern-Mashhad) distinguished by heavy and continuous rainfalls in different months [68]. Unprecedented, torrential rainfalls have been frequently reported by observations during the 1930s around our study site, for instance in April 1931, May 1933, April 1934 (northeastern, Mashhad), and 1939 (March in Mashhad, whole spring in Birjand). In agreement with historical documents, our reconstruction registered the years 1868, 1886, 1926, 1933–1934, and 1950 as wet years at the southern slopes of the Alborz Mountains. Besides, the decadal mean precipitation stayed above the overall mean during the 1930s.
As recorded by the nearest meteorological stations Shahroud, Semnan, Mashhad, Bojnord and Sabzevar, the region experienced two common noteworthy decadal scale periods of low spring precipitation since 1950. In agreement with the nearby climate stations records, our reconstruction reveals a significant decrease in precipitation in the 1980s [32]. This reduction is followed by a considerable increase starting in the middle of the 1990s. Afterwards, the famous severe drought during the last years of the 20th century from 1999 to 2001 occurred (Figure 5a). The severe 1999–2001 drought is one of the largest persistent droughts globally since the 1940s, affecting Central and Southwest Asia, with the most severe impact on Iran, Afghanistan, Tajikistan, Western Pakistan, Uzbekistan, and Turkmenistan [1,109]. This drought affected more than 20 provinces of Iran, whereby the area around our study site was among the most affected ones.
We also compared our precipitation reconstruction with two other tree-ring-width based reconstructions of December–February [5] and October–May precipitation [34] from the Zagros Mountains in western Iran (Figure 5). The October–May reconstructed precipitation by Azizi et al. [34] (Figure 5b) was significantly (r = 0.20, p < 0.05) correlated with our spring precipitation reconstruction over the common period of 1840–2010. In addition, a significant correlation between our reconstruction and December–February precipitation for the southern Zagros Mountain by Arsalani et al. [5] (Figure 5c) was observed for 1850–2015 (r = 0.16, p < 0.05). As both reconstructions are located quite far from our study site in northern Iran, the correlation coefficients are expectably low.
Nonetheless, moving correlations reveal that significant correlations between reconstructed spring precipitation in the Alborz Mountains and precipitation variations in the Zagros Mountains are restricted to the second half of the 19th century (PO–M = 1855–1918) and the 20th century (PO–M = 1972–2008 and PD-F = 1922–1964) (Figure 6). Since precipitation variations in the Zagros Mountains are mainly controlled by the mid-latitude westerlies, bringing moisture from the North Atlantic Ocean and the Mediterranean Sea, these correlations point to a temporally strong influence of westerly winds on spring precipitation in the eastern Alborz Mountains. However, we found no significant correlation between our reconstruction and large-scale climatic indices representing the westerlies’ influence/strength (NAO, AMO).
A wavelet analysis revealed that the presence of significant periodicities in our reconstructed precipitation is not persistent over the study period (Figure 7). Significant cycles of precipitation fluctuations with periodicities lower than ca. 15 years appear during the 16th and at the beginning of 17 centuries, and during the late 19th and 20th centuries. These observations point to a variable strength of the influence of the westerlies on precipitation variations at our study side and a strong influence of regional atmospheric factors. These factors include the influence of local topography, the high elevation of our study site, and the regional climatic effect of the nearby Caspian Sea, for which no long-term data are yet available.

4. Conclusions

We developed a multi-century tree-ring stable oxygen isotope chronology from J. polycarpos and developed the first multi-centennial spring precipitation reconstruction for the semi-arid region of northern Iran. Despite the short instrumental climate record, the verification statistics confirmed the validity and reliability of the linear regression model. Our reconstruction reveals the 18th (the 16th) century as the wettest (driest) period during the last 501 years. Our findings indicate a gradual decline in spring precipitation from the beginning of the 19th century until the ongoing dry period of the 20th century.
Our precipitation reconstruction additionally manifest variations and extreme events in spring rainfall and the occurrence of extreme climate events increased over the last 501 years. Periods of common climate signals between our reconstruction and two other tree-ring width-based precipitation reconstructions for western Iran indicated some common forcing factors.
The present study has taken an important step in improving our knowledge of hydroclimatic variations in the semi-arid northern Iran, which is of great relevance for sustainable water management. Given the deficiency of other hydroclimate proxies in the region, a denser network of annually resolved proxy series is still needed for a better understanding of spatio-temporal variability of climate and effects of global climate change on the ecosystems in semi-arid regions in northern Iran.

Author Contributions

Conceptualization, A.B., K.P., and J.G.; methodology, writing and original draft preparation, all authors; formal analysis and visualization, Z.F.; validation, Z.F., J.G., A.B.; resources, A.B.; supervision, A.B., K.P., J.G. All authors have read and agreed to the published version of the manuscript.

Funding

This research received no external funding.

Acknowledgments

We gratefully acknowledge Christoph Mayr and Roswitha Höfner-Stich for laboratory analyses. The authors would like to thank Mohsen Arsalani who graciously provided us with the reconstructed precipitation series from the Zagros Mountains for comparison. We are particularly grateful to Iris Burchardt for helpful comments and technical assistance during sample preparation, and to Sugam Aryal for invaluable advice on statistical analyses. We express our deep appreciation to the German Academic Exchange Service (DAAD) and Bavarian Equal Opportunities Sponsorship—Realisierung von Frauen in Forschung und Lehre (FFL)—Promotion Equal Opportunities for Women in Research and Teaching, for the financial support of Z.F.

Conflicts of Interest

The authors declare no conflict of interest.

Appendix A

Table A1. Reconstructed dry and wet periods for the southern slope of the Alborz Mountains during the period 1515–2015.
Dry PeriodsNo. of YearsWet PeriodsNo. of Years
1515115751
1517–1518215961
1521–1524416041
1527–2821607–16093
1530–1534516121
1538116241
154611661–16622
1551–155551664–16652
1557116711
1559116751
1563116821
1569116861
1571–1574416941
1583117061
161611713–17142
161811722–17243
164211727–17282
1657117301
166611736–17372
1669117391
1701117431
1707–1708217471
171611751–17544
1759117561
184411761–17622
1848117641
186011769–17713
1864–186521776–17783
1867117891
1870–1871217911
188011799–18013
188211803–18042
1892–1893218081
1901–1902218111
1917–1918218161
1921–1922218181
1942118251
194711831–18322
1954118341
1956–1958318521
1962118551
1964118571
1978118681
198711874–18763
1990118861
2000–2001218991
200311905–19062
2015119261
1933–19342
19501
19731
1992–19932
1996–19983
20051
20091
2012–20132
Table A2. Reconstructed extreme-dry and -wet events for the southern slope of the Alborz Mountains during the period 1515–2015.
Extreme Dry EventsExtreme Wet Events
15151609
15171694
15231723
15281751
15341752
15381753
15541868
18921950
19172013
1921
1958
2001

References

  1. Barlow, M.; Zaitchik, B.; Paz, S.; Black, E.; Evans, J.; Hoell, A. A review of drought in the Middle East and southwest Asia. J. Clim. 2016, 29, 8547–8574. [Google Scholar] [CrossRef]
  2. Veldkamp, T.I.E.; Wada, Y.; Aerts, J.C.J.H.; Ward, P.J. Towards a global water scarcity risk assessment framework: Incorporation of probability distributions and hydro-climatic variability. Environ. Res. Lett. 2016, 11. [Google Scholar] [CrossRef] [Green Version]
  3. Modarres, R.; Sarhadi, A. Statistically-based regionalization of rainfall climates of Iran. Glob. Planet. Chang. 2011, 75, 67–75. [Google Scholar] [CrossRef]
  4. Madani, K. Water management in Iran: What is causing the looming crisis? J. Environ. Stud. Sci. 2014, 4, 315–328. [Google Scholar] [CrossRef]
  5. Arsalani, M.; Pourtahmasi, K.; Azizi, G.; Bräuning, A.; Mohammadi, H. Tree-ring based December–February precipitation reconstruction in the southern Zagros Mountains, Iran. Dendrochronologia 2018, 49, 45–56. [Google Scholar] [CrossRef]
  6. Tabari, H.; Willems, P. More prolonged droughts by the end of the century in the Middle East. Environ. Res. Lett. 2018, 13, 104005. [Google Scholar] [CrossRef] [Green Version]
  7. Evans, J.P. 21st century climate change in the Middle East. Clim. Chang. 2009, 92, 417–432. [Google Scholar] [CrossRef]
  8. UNFCCC. Climate Change: Impacts, Vulnerabilities and Adaptation in Developing Countries; United Nations Framework Convention on Climate Change; UNFCCC Secretariat: Bonn, Germany, 2007. [Google Scholar]
  9. IPCC. Summary for Policymakers. In Global Warming of 1.5 °C; Masson-Delmotte, V., Zhai, P., Pörtner, H.-O., Roberts, D., Skea, J., Shukla, P.R., Pirani, A., Moufouma-Okia, W., Péan, C., Pidcock, R., et al., Eds.; An IPCC Special Report on the impacts of global warming of 1.5 °C above pre-industrial levels and related global greenhouse gas emission pathways, in the context of strengthening the global response to the threat of climate change, sustainable development, and efforts to eradicate poverty; 2018; in press. [Google Scholar]
  10. Rahimi, J.; Malekian, A.; Khalili, A. Climate change impacts in Iran: Assessing our current knowledge. Theor. Appl. Climatol. 2019, 135, 545–564. [Google Scholar] [CrossRef]
  11. Shifteh Some’e, B.; Ezani, A.; Tabari, H. Spatiotemporal trends and change point of precipitation in Iran. Atmos. Res. 2012, 113, 1–12. [Google Scholar] [CrossRef]
  12. Soltani, S.; Saboohi, R.; Yaghmaei, L. Rainfall and rainy days trend in Iran. Clim. Chang. 2012, 110, 187–213. [Google Scholar] [CrossRef]
  13. Abbaspour, K.C.; Faramarzi, M.; Ghasemi, S.S.; Yang, H. Assessing the impact of climate change on water resources in Iran. Water Resour. Res. 2009, 45, 413. [Google Scholar] [CrossRef] [Green Version]
  14. Tabari, H.; Aghajanloo, M.-B. Temporal pattern of aridity index in Iran with considering precipitation and evapotranspiration trends. Int. J. Climatol. 2013, 33, 396–409. [Google Scholar] [CrossRef]
  15. Fritts, H. Tree Rings and Climate; Elsevier Science: Oxford, UK, 1976; ISBN 9780122684500. [Google Scholar]
  16. Hughes, M.K. Dendrochronology in climatology—The state of the art. Dendrochronologia 2002, 20, 95–116. [Google Scholar] [CrossRef]
  17. Helle, G.; Schleser, G.H. Interpreting Climate Proxies from Tree-rings. In The Climate in Historical Times: Towards a Synthesis of Holocene Proxy Data and Climate Models; Fischer, H., Ed.; Springer: Berlin/Heidelberg, Germany, 2011; pp. 129–148. ISBN 978-3-642-05826-4. [Google Scholar]
  18. Young, G.H.F.; Demmler, J.C.; Gunnarson, B.E.; Kirchhefer, A.J.; Loader, N.J.; McCarroll, D. Age trends in tree ring growth and isotopic archives: A case study of Pinus sylvestris L. from northwestern Norway. Glob. Biogeochem. Cycles 2011, 25. [Google Scholar] [CrossRef]
  19. Loader, N.J.; Young, G.H.F.; McCarroll, D.; Wilson, R.J.S. Quantifying uncertainty in isotope dendroclimatology. Holocene 2013, 23, 1221–1226. [Google Scholar] [CrossRef]
  20. Dansgaard, W. Stable isotopes in precipitation. Tellus 1964, 16, 436–468. [Google Scholar] [CrossRef]
  21. Roden, J.S.; Lin, G.; Ehleringer, J.R. A mechanistic model for interpretation of hydrogen and oxygen isotope ratios in tree-ring cellulose. Geochim. Cosmochim. Acta 2000, 64, 21–35. [Google Scholar] [CrossRef]
  22. Barbour, M.M. Stable oxygen isotope composition of plant tissue: A review. Funct. Plant Biol. 2007, 34, 83. [Google Scholar] [CrossRef]
  23. Gessler, A.; Ferrio, J.P.; Hommel, R.; Treydte, K.; Werner, R.A.; Monson, R.K. Stable isotopes in tree rings: Towards a mechanistic understanding of isotope fractionation and mixing processes from the leaves to the wood. Tree Physiol. 2014, 34, 796–818. [Google Scholar] [CrossRef] [Green Version]
  24. Grießinger, J.; Bräuning, A.; Helle, G.; Hochreuther, P.; Schleser, G. Late Holocene relative humidity history on the southeastern Tibetan plateau inferred from a tree-ring δ18O record: Recent decrease and conditions during the last 1500 years. Quat. Int. 2017, 430, 52–59. [Google Scholar] [CrossRef]
  25. Huang, R.; Zhu, H.; Liang, E.; Asad, F.; Grießinger, J. A tree-ring–based summer (June–July) minimum temperature reconstruction for the western Kunlun Mountains since AD 1681. Theor. Appl. Climatol. 2019, 48, 3381. [Google Scholar] [CrossRef]
  26. Opała-Owczarek, M. Warm-season temperature reconstruction from high-elevation juniper tree rings over the past millennium in the Pamir region. Palaeogeogr. Palaeoclimatol. Palaeoecol. 2019, 532, 109248. [Google Scholar] [CrossRef]
  27. Pourtahmasi, K.; Parsapajouh, D.; Bräuning, A.; Esper, J.; Schweingruber, F.H. Climatic analysis of pointer years in tree-ring chronologies from Northern Iran and neighboring high mountain areas. Geokodynamik 2007, 28, 27–42. [Google Scholar]
  28. Pourtahmasi, K.; Bräuning, A.; Poursartip, L.; Burchardt, I. Growth-climate responses of oak and juniper trees in different exposures of the Alborz Mountains, northern Iran. Trace 2012, 10, 49–53. [Google Scholar]
  29. Foroozan, Z.; Pourtahmasi, K.; Bräuning, A. Stable oxygen isotopes in juniper and oak tree rings from northern Iran as indicators for site-specific and season-specific moisture variations. Dendrochronologia 2015, 36, 33–39. [Google Scholar] [CrossRef]
  30. Foroozan, Z.; Pourtahmasi, K.; Bräuning, A. Climatic signals in stable carbon isotope ratios of Juniper and Oak tree rings from northern Iran. Glob. Planet. Chang. 2018, 165, 90–99. [Google Scholar] [CrossRef]
  31. Gholami, V.; Ahmadi Jolandan, M.; Torkaman, J. Evaluation of climate change in northern Iran during the last four centuries by using dendroclimatology. Nat. Hazards 2017, 85, 1835–1850. [Google Scholar] [CrossRef]
  32. Khaleghi, M.R. Application of dendroclimatology in evaluation of climatic changes. J. For. Sci. 2018, 64, 139–147. [Google Scholar] [CrossRef] [Green Version]
  33. Arsalani, M.; Bräuning, A.; Pourtahmasi, K.; Azizi, G.; Mohammadi, H. Multiple tree-ring parameters of Quercus brantii Lindel in SW Iran show a strong potential for intra-annual climate reconstruction. Trees 2018, 32, 1531–1546. [Google Scholar] [CrossRef]
  34. Azizi, G.; Arsalani, M.; Bräuning, A.; Moghimi, E. Precipitation variations in the central Zagros Mountains (Iran) since A.D. 1840 based on oak tree rings. Palaeogeogr. Palaeoclimatol. Palaeoecol. 2013, 386, 96–103. [Google Scholar] [CrossRef]
  35. Arsalani, M.; Azizi, G.; Bräuning, A. Dendroclimatic reconstruction of May-June maximum temperatures in the central Zagros Mountains, western Iran. Int. J. Climatol. 2015, 35, 408–416. [Google Scholar] [CrossRef]
  36. Bayramzadeh, V.; Zhu, H.; Lu, X.; Attarod, P.; Zhang, H.; Li, X.; Asad, F.; Liang, E. Temperature variability in northern Iran during the past 700 years. Sci. Bull. 2018, 63, 462–464. [Google Scholar] [CrossRef] [Green Version]
  37. Fallah, A.; Balapour, S.A.; Yekekhani, M.; Jalilvand, H. Dendrochronological studies of Juniperus polycarpos in alborz mountains: (Case study: Shahkuh of shahrood). Iran. J. Wood Paper Sci. Res. 2014, 29, 94–105. [Google Scholar]
  38. Sagheb-Talebi, K.; Sajedi, T.; Pourhashemi, M. Forests of Iran. A Treasure from the Past, a Hope for the Future; Springer: Dordrecht, The Netherlands, 2014; ISBN 9400773714. [Google Scholar]
  39. Fatemi, S.S.; Rahimi, M.; Tarkesh, M.; Ravanbakhsh, H. Predicting the impacts of climate change on the distribution of Juniperus excelsa M. Bieb. In the central and eastern Alborz Mountains, Iran. iForest 2018, 11, 643–650. [Google Scholar] [CrossRef] [Green Version]
  40. Li, Q.; Liu, Y.; Nakatsuka, T.; Zhang, Q.-B.; Ohnishi, K.; Sakai, A.; Kobayashi, O.; Pan, Y.; Song, H.; Liu, R.; et al. Oxygen stable isotopes of a network of shrubs and trees as high-resolution plaeoclimatic proxies in Northwestern China. Agric. For. Meteorol. 2020, 285–286, 107929. [Google Scholar] [CrossRef]
  41. Leonelli, G.; Battipaglia, G.; Cherubini, P.; Saurer, M.; Siegwolf, R.T.W.; Maugeri, M.; Stenni, B.; Fusco, S.; Maggi, V.; Pelfini, M. Larix decidua δ18O tree-ring cellulose mainly reflects the isotopic signature of winter snow in a high-altitude glacial valley of the European Alps. Sci. Total Environ. 2017, 579, 230–237. [Google Scholar] [CrossRef]
  42. Lorrey, A.M.; Brookman, T.H.; Evans, M.N.; Fauchereau, N.C.; Macinnis-Ng, C.; Barbour, M.M.; Criscitiello, A.; Eischeid, G.; Fowler, A.M.; Horton, T.W.; et al. Stable oxygen isotope signatures of early season wood in New Zealand kauri (Agathis australis) tree rings: Prospects for palaeoclimate reconstruction. Dendrochronologia 2016, 40, 50–63. [Google Scholar] [CrossRef]
  43. Olson, E.J.; Dodd, J.P.; Rivera, M.A. Prosopis sp. tree-ring oxygen and carbon isotope record of regional-scale hydroclimate variability during the last 9500 years in the Atacama Desert. Palaeogeogr. Palaeoclimatol. Palaeoecol. 2020, 538. [Google Scholar] [CrossRef]
  44. Grießinger, J.; Langhamer, L.; Schneider, C.; Saß, B.-L.; Steger, D.; Skvarca, P.; Braun, M.H.; Meier, W.J.-H.; Srur, A.M.; Hochreuther, P. Imprints of Climate Signals in a 204 Year δ18O Tree-Ring Record of Nothofagus pumilio From Perito Moreno Glacier, Southern Patagonia (50°S). Front. Earth Sci. 2018, 6, 564. [Google Scholar] [CrossRef]
  45. Cai, Q.; Liu, Y.; Duan, B.; Li, Q.; Sun, C.; Wang, L. Tree-ring δ18O, a tool to crack the paleo-hydroclimatic code in subtropical China. Quat. Int. 2018, 487, 3–11. [Google Scholar] [CrossRef]
  46. Wernicke, J.; Grießinger, J.; Hochreuther, P.; Bräuning, A. Variability of summer humidity during the past 800 years on the eastern Tibetan Plateau inferred from δ18O of tree-ring cellulose. Clim. Past 2015, 11, 327–337. [Google Scholar] [CrossRef] [Green Version]
  47. Wernicke, J.; Hochreuther, P.; Grießinger, J.; Zhu, H.; Wang, L.; Bräuning, A. Multi-century humidity reconstructions from the southeastern Tibetan Plateau inferred from tree-ring δ18O. Glob. Planet. Chang. 2017, 149, 26–35. [Google Scholar] [CrossRef]
  48. Wang, H.; Shao, X.; Li, M. A 2917-year tree-ring-based reconstruction of precipitation for the Buerhanbuda Mts., Southeastern Qaidam Basin, China. Dendrochronologia 2019, 55, 80–92. [Google Scholar] [CrossRef]
  49. Pourtahmasi, K.; Poursartip, L.; Bräuning, A.; Parsapajouh, D. Comparison between the radial growth of Juniper (Juniperus polycarpos) and Oak (Quercus macranthera) in two sides of the Alborz Mountains in the Chaharbagh region of Gorgan. Iran J. For. Wood Prod. 2009, 62, 159–169. [Google Scholar]
  50. Noroozi, J.; Körner, C. A bioclimatic characterization of high elevation habitats in the Alborz mountains of Iran. Alp. Bot. 2018, 128, 1–11. [Google Scholar] [CrossRef] [Green Version]
  51. Moameni, A. Production Capacity of Land Resources of Iran; Soil and Water Research Institute: Tehran, Iran, 2000. [Google Scholar]
  52. Mesgaran, M.; Madani, K.; Hashemi, H.; Azadi, P. Evaluation of Land and Precipitation for Agriculture in Iran; Working Paper 2, Stanford Iran 2040 Project; Stanford University: Stanford, CA, USA, 2016; Available online: http://purl.stanford.edu/vf990qz0340 (accessed on 24 June 2020).
  53. Ravanbakhsh, H.; HamzeH’Ee, B.; Etemad, V.; Marvie Mohadjer, M.R.; Assadi, M. Phytosociology of Juniperus excelsa M.Bieb. Forests in Alborz mountain range in the north of Iran. Plant Biosyst. Int. J. Deal. Asp. Plant Biol. 2015, 150, 987–1000. [Google Scholar] [CrossRef]
  54. Nezhad, M.M.; Shataee, S.; Habashi, H.; Babanezhad, M. Spatial and statistical analysis of quantitative characteristics of Juniperus stands in Chahar-bagh of Gorgan regarding to topographic and soil features. Iran. J. For. 2013, 5, 195–206. [Google Scholar]
  55. Stokes, M.A.; Smiley, T.L. An Introduction to Tree-Ring Dating; University of Chicago Press: Chicago, IL, USA; London, UK, 1968. [Google Scholar]
  56. Rinn, F. TSAP-WIN. Time Series Analysis and Presentation Dendrochonology and Related Applications; Rinntech: Heidelberg, Germany, 2013. [Google Scholar]
  57. McCarroll, D.; Loader, N.J. Stable isotopes in tree rings. Quat. Sci. Rev. 2004, 23, 771–801. [Google Scholar] [CrossRef]
  58. Leavitt, S.W. Tree-ring C-H-O isotope variability and sampling. Sci. Total Environ. 2010, 408, 5244–5253. [Google Scholar] [CrossRef]
  59. Foroozan, Z.; Grießinger, J.; Pourtahmasi, K.; Bräuning, A. Evaluation of Different Pooling Methods to Establish a Multi-Century δ18O Chronology for Paleoclimate Reconstruction. Geosciences 2019, 9, 270. [Google Scholar] [CrossRef] [Green Version]
  60. Wigley, T.M.L.; Briffa, K.R.; Jones, P.D. On the Average Value of Correlated Time Series, with Applications in Dendroclimatology and Hydrometeorology. J. Clim. Appl. Meteorol. 1984, 23, 201–213. [Google Scholar] [CrossRef]
  61. Wieloch, T.; Helle, G.; Heinrich, I.; Voigt, M.; Schyma, P. A novel device for batch-wise isolation of α-cellulose from small-amount wholewood samples. Dendrochronologia 2011, 29, 115–117. [Google Scholar] [CrossRef] [Green Version]
  62. University of East Anglia Climatic Research Unit; Harris, I.C.; Jones, P.D. CRU TS4.03: Climatic Research Unit (CRU) Time-Series (TS) Version 4.03 of High-Resolution Gridded Data of Month-by-Month Variation in Climate (January 1901–December 2018); CEDA: Didcot, UK, 2019. [Google Scholar]
  63. Michaelsen, J. Cross-Validation in Statistical Climate Forecast Models. J. Clim. Appl. Meteorol. 1987, 26, 1589–1600. [Google Scholar] [CrossRef] [Green Version]
  64. R Core Team. R: A Language and Environment for Statistical Computing; R Core Team: Vienna, Austria, 2019; Available online: http://www.R-project.org/ (accessed on 24 June 2020).
  65. Liu, Y.; Ta, W.; Li, Q.; Song, H.; Sun, C.; Cai, Q.; Liu, H.; Wang, L.; Hu, S.; Sun, J.; et al. Tree-ring stable carbon isotope-based April–June relative humidity reconstruction since ad 1648 in Mt. Tianmu, China. Clim. Dyn. 2018, 50, 1733–1745. [Google Scholar] [CrossRef]
  66. Torrence, C.; Compo, G.P. A Practical Guide to Wavelet Analysis. Bull. Am. Meteorol. Soc. 1998, 79, 61–78. [Google Scholar] [CrossRef] [Green Version]
  67. Bunn, A.G. A dendrochronology program library in R (dplR). Dendrochronologia 2008, 26, 115–124. [Google Scholar] [CrossRef]
  68. Melville, C. Meteorological Hazards and Disasters in Iran: A Preliminary Survey to 1950. Iran 1984, 22, 113–150. [Google Scholar] [CrossRef]
  69. Okazaki, S. The great Persian famine of 1870–71. Bull. Sch. Orient. Afr. Stud. 1986, 49, 183–192. [Google Scholar] [CrossRef]
  70. Melville, C. The persian famine of 1870-1872: Prices and politics. Disasters 1988, 12, 309–325. [Google Scholar] [CrossRef]
  71. Majd, M.G. The Great Famine & Genocide in Iran. 1917-1919/Mohammad Gholi Majd, 2nd ed.; University Press of America: Lanham, MD, USA, 2013; ISBN 9780761861683. [Google Scholar]
  72. Majd, M.G. A Victorian Holocaust. Iran in the Great Famine of 1869-1873/Mohammad Gholi Majd; Hamilton Books: Lanham, MD, USA, 2017; ISBN 9780761870159. [Google Scholar]
  73. Marshall, J.D.; Monserud, R.A. Co-occurring species differ in tree-ring δ18O trends. Tree Physiol. 2006, 26, 1055–1066. [Google Scholar] [CrossRef]
  74. Loader, N.J.; McCarroll, D.; Gagen, M.; Robertson, I.; Jalkanen, R. Extracting Climatic Information from Stable Isotopes in Tree Rings. In Stable Isotopes as Indicators of Ecological Change; Dawson, T.E., Siegwolf, R.T.W., Eds.; Academic: Oxford, UK, 2007; pp. 25–48. ISBN 9780123736277. [Google Scholar]
  75. Saurer, M.; Cherubini, P.; Reynolds-Henne, C.E.; Treydte, K.S.; Anderson, W.T.; Siegwolf, R.T.W. An investigation of the common signal in tree ring stable isotope chronologies at temperate sites. J. Geophys. Res. 2008, 113, 31625. [Google Scholar] [CrossRef]
  76. Liu, X.; Zeng, X.; Leavitt, S.W.; Wang, W.; An, W.; Xu, G.; Sun, W.; Wang, Y.; Qin, D.; Ren, J. A 400-year tree-ring δ18O chronology for the southeastern Tibetan Plateau: Implications for inferring variations of the regional hydroclimate. Glob. Planet. Chang. 2013, 104, 23–33. [Google Scholar] [CrossRef]
  77. Qin, C.; Yang, B.; Bräuning, A.; Grießinger, J.; Wernicke, J. Drought signals in tree-ring stable oxygen isotope series of Qilian juniper from the arid northeastern Tibetan Plateau. Glob. Planet. Chang. 2015, 125, 48–59. [Google Scholar] [CrossRef]
  78. Xu, G.; Wu, G.; Liu, X.; Chen, T.; Wang, B.; Hudson, A.; Trouet, V. Age-related climate response of tree-ring δ 13 C and δ18O from spruce in northwestern China, with implications for relative humidity reconstructions. J. Geophys. Res. Biogeosci. 2020. [Google Scholar] [CrossRef]
  79. Ehleringer, J.R.; Dawson, T.E. Water uptake by plants: Perspectives from stable isotope composition. Plant Cell Environ. 1992, 15, 1073–1082. [Google Scholar] [CrossRef]
  80. Ferrio, J.P.; Voltas, J. Carbon and oxygen isotope ratios in wood constituents of Pinus halepensis as indicators of precipitation, temperature and vapour pressure deficit. Tellus B 2005, 57, 164–173. [Google Scholar] [CrossRef]
  81. Rozanski, K.; Araguás-Araguás, L.; Gonfiantini, R. Isotopic Patterns in Modern Global Precipitation. In Climate Change in Continental Isotopic Records; Swart, P.K., Lohmann, K.C., Mckenzie, J., Savin, S., Eds.; American Geophysical Union: Washington, DC, USA, 1993; pp. 1–36. ISBN 9781118664025. [Google Scholar]
  82. Baldini, L.M.; McDermott, F.; Foley, A.M.; Baldini, J.U.L. Spatial variability in the European winter precipitation δ18O-NAO relationship: Implications for reconstructing NAO-mode climate variability in the Holocene. Geophys. Res. Lett. 2008, 35. [Google Scholar] [CrossRef]
  83. Field, R.D. Observed and modeled controls on precipitation δ18O over Europe: From local temperature to the Northern Annular Mode. J. Geophys. Res. 2010, 115. [Google Scholar] [CrossRef] [Green Version]
  84. Wingate, L.; Seibt, U.; Maseyk, K.; Ogée, J.; Almeida, P.; Yakir, D.A.N.; Pereira, J.S.; Mencuccini, M. Evaporation and carbonic anhydrase activity recorded in oxygen isotope signatures of net CO2 fluxes from a Mediterranean soil. Glob. Chang. Biol. 2008, 14, 2178–2193. [Google Scholar] [CrossRef] [Green Version]
  85. Sarris, D.; Siegwolf, R.; Körner, C. Inter- and intra-annual stable carbon and oxygen isotope signals in response to drought in Mediterranean pines. Agric. For. Meteorol. 2013, 168, 59–68. [Google Scholar] [CrossRef]
  86. Saurer, M.; Kirdyanov, A.V.; Prokushkin, A.S.; Rinne, K.T.; Siegwolf, R.T.W. The impact of an inverse climate-isotope relationship in soil water on the oxygen-isotope composition of Larix gmelinii in Siberia. New Phytol. 2016, 209, 955–964. [Google Scholar] [CrossRef]
  87. Szymczak, S.; Barth, J.; Bendix, J.; Huneau, F.; Garel, E.; Häusser, M.; Juhlke, T.; Knerr, I.; Santoni, S.; Trachte, K.; et al. Tracking the oxygen isotope composition from source to sink in pine trees along an elevation gradient in a Mediterranean ecosystem. Chem. Geol. 2020, 549, 119695. [Google Scholar] [CrossRef]
  88. Farquhar, G.D.; Lloyd, J. Carbon and Oxygen Isotope Effects in the Exchange of Carbon Dioxide between Terrestrial Plants and the Atmosphere. In Stables Isotopes and Plant Carbon: Water Relations; Ehleringer, J.R., Hall, A.E., Farquhar, G.D., Eds.; Academic Press: San Diego, CA, USA; Toronto, ON, Canada, 1993; pp. 47–70. ISBN 9780122333804. [Google Scholar]
  89. Farquhar, G.D.; Cernusak, L.A.; Barnes, B. Heavy water fractionation during transpiration. Plant Physiol. 2007, 143, 11–18. [Google Scholar] [CrossRef] [Green Version]
  90. Dongmann, G.; Nürnberg, H.W.; Förstel, H.; Wagener, K. On the enrichment of H2 18-O in the leaves of transpiring plants. Radiat. Environ. Biophys. 1974, 11, 41–52. [Google Scholar] [CrossRef]
  91. Cernusak, L.A.; Barbour, M.M.; Arndt, S.K.; Cheesman, A.W.; English, N.B.; Feild, T.S.; Helliker, B.R.; Holloway-Phillips, M.M.; Holtum, J.A.M.; Kahmen, A.; et al. Stable isotopes in leaf water of terrestrial plants. Plant Cell Environ. 2016, 39, 1087–1102. [Google Scholar] [CrossRef]
  92. Sheshshayee, M.S.; Bindumadhava, H.; Ramesh, R.; Prasad, T.G.; Lakshminarayana, M.R.; Udayakumar, M. Oxygen isotope enrichment (delta18O) as a measure of time-averaged transpiration rate. J. Exp. Bot. 2005, 56, 3033–3039. [Google Scholar] [CrossRef]
  93. Barbour, M.M.; Roden, J.S.; Farquhar, G.D.; Ehleringer, J.R. Expressing leaf water and cellulose oxygen isotope ratios as enrichment above source water reveals evidence of a Péclet effect. Oecologia 2004, 138, 426–435. [Google Scholar] [CrossRef]
  94. Roden, J.; Kahmen, A.; Buchmann, N.; Siegwolf, R. The enigma of effective path length for (18) O enrichment in leaf water of conifers. Plant Cell Environ. 2015, 38, 2551–2565. [Google Scholar] [CrossRef]
  95. Song, X.; Simonin, K.A.; Loucos, K.E.; Barbour, M.M. Modelling non-steady-state isotope enrichment of leaf water in a gas-exchange cuvette environment. Plant Cell Environ. 2015, 38, 2618–2628. [Google Scholar] [CrossRef]
  96. Song, X.; Clark, K.S.; Helliker, B.R. Interpreting species-specific variation in tree-ring oxygen isotope ratios among three temperate forest trees. Plant Cell Environ. 2014, 37, 2169–2182. [Google Scholar] [CrossRef]
  97. Sternberg, L.; Pinzon, M.C.; Anderson, W.T.; Jahren, A.H. Variation in oxygen isotope fractionation during cellulose synthesis: Intramolecular and biosynthetic effects. Plant Cell Environ. 2006, 29, 1881–1889. [Google Scholar] [CrossRef] [PubMed]
  98. DeNiro, M.J.; Epstein, S. Isotopic composition of cellulose from aquatic organisms. Geochim. Cosmochim. Acta 1981, 45, 1885–1894. [Google Scholar] [CrossRef]
  99. Sternberg, L.d.S.; Deniro, M.J.; Savidge, R.A. Oxygen Isotope Exchange between Metabolites and Water during Biochemical Reactions Leading to Cellulose Synthesis. Plant Physiol. 1986, 82, 423–427. [Google Scholar] [CrossRef] [PubMed] [Green Version]
  100. Sternberg, L.S.L. Oxygen and Hydrogen Isotope Ratios in Plant Cellulose: Mechanisms and Applications. In Stable Isotopes in Ecological Research; Rundel, P.W., Ehleringer, J.R., Nagy, K.A., Eds.; Springer: New York, NY, USA, 1989; pp. 124–141. ISBN 978-1-4612-3498-2. [Google Scholar]
  101. Offermann, C.; Ferrio, J.P.; Holst, J.; Grote, R.; Siegwolf, R.; Kayler, Z.; Gessler, A. The long way down--are carbon and oxygen isotope signals in the tree ring uncoupled from canopy physiological processes? Tree Physiol. 2011, 31, 1088–1102. [Google Scholar] [CrossRef] [PubMed] [Green Version]
  102. Cook, E.R.; Kairiukstis, L.A. Methods of Dendrochronology; Springer: Dordrecht, The Netherlands, 1990; ISBN 978-90-481-4060-2. [Google Scholar]
  103. Cook, E.R.; Briffa, K.R.; Jones, P.D. Spatial regression methods in dendroclimatology: A review and comparison of two techniques. Int. J. Climatol. 1994, 14, 379–402. [Google Scholar] [CrossRef]
  104. NDWMC. Yearbook-2019 of the National Center for Drought and Crisis Management; NDWMC: Tehran, Iran, 2019. [Google Scholar]
  105. Brugsch, H. Reise der K. Preussischen Gesandtschaft Nach Persien, 1860 und 1861, Geschildert; J.C. Hinrichs: Leipzig, Germany, 1862. [Google Scholar]
  106. Kazemi, R. The Black Winter of 1860–61. Comp. Stud. South Asia Afr. Middle East 2017, 37, 24–48. [Google Scholar] [CrossRef] [Green Version]
  107. Touchan, R.; Meko, D.; Hughes, M.K. A 396-year reconstruction of precipitation in southern Jordan. J. Am. Water Resour. Assoc. 1999, 35, 49–59. [Google Scholar] [CrossRef]
  108. Majd, M.G. Iran under Allied Occupation in World War II. The Bridge to Victory & a Land of Famine/Mohammad Gholi Majd; University Press of America: Lanham, MD, USA, 2016; ISBN 9780761867395. [Google Scholar]
  109. Agrawala, S.; Barlow, M.; Cullen, H.; Lyon, B. The drought and humanitarian crisis in central and southwest Asia: A climate perspective. IRI Rep. 2001, 1–11. [Google Scholar] [CrossRef]
Figure 1. Location of Iran and the study area (rectangle in overview map). Tree symbol: sampling site, Triangle: Gorgan provincial capital, Circle: meteorological stations, Mojen meteorological station marked with red circle. Inlay: climate diagram of Mojen meteorological station (1982–2015).
Atmosphere 11 00889 g001
Figure 2. Tree-ring stable oxygen isotope chronology of Juniperus polycarpos from the southern slope of the Alborz Mountains over the period 1515–2015. Blue and red lines represent decadal and centennial δ18O variations calculated with 10 and 100 Fast Fourier transform (FFT)-Filters, respectively. The overall mean value of the tree-ring δ18O chronology (horizontal black dotted line) and the number of trees included in the chronology are presented in the lower panel.
Atmosphere 11 00889 g002
Figure 3. Correlations between tree-ring δ18O and monthly and seasonal precipitation during the period 1982–2015. Correlations were calculated for a 21-month period from January of the previous year (py January) until September of the current year, and seasonally averaged data of the previous (January. February. March, as previous winter: py JFM; April. May. June, as previous spring: py AMJ) and current (January. February. March, as winter: JFM; April. May. June, as spring: AMJ) years. Gray and blue horizontal lines indicate significance levels at p < 0.05 and p < 0.01, respectively.
Atmosphere 11 00889 g003
Figure 4. Reconstruction of spring precipitation py AMJ + AMJ for the southern slope of the Alborz Mountains during the period 1515–2015. Blue and red lines represent decadal and centennial δ18O variations calculated with 10 and 100-year FFT-Filters, respectively. The horizontal black and dotted colored lines indicate the 501-year mean and dry/wet and extreme dry/wet events, respectively, based on the dryness/wetness classification by Liu et al. [65]. Inlay rectangle: comparison between the reconstructed and instrumental precipitation variations during the calibration period of 1983–2015.
Atmosphere 11 00889 g004
Figure 5. Comparison between the annual and decadal (bold lines) variations of the reconstructed spring precipitation py AMJ + AMJ and two precipitation reconstructions from the Zagros Mountains, west Iran. (a) Reconstructed precipitation py AMJ + AMJ in the present study, (b) October to May precipitation in the central Zagros Mountains during 1840–2010 [34], (c) December to February precipitation in the southern Zagros Mountains during 1850–2015 [5]. Colored bars indicate historical famine and drought periods.
Atmosphere 11 00889 g005
Figure 6. The 30-year moving correlation coefficients between our spring precipitation reconstruction in the Alborz Mountain, northeast Iran, and two precipitation reconstructions from the Zagros Mountains, west Iran, during 1850–2010. PD–F and PO–M represent December to February precipitation in the southern Zagros Mountains during 1850–2015 [5] and October to May precipitation at the central Zagros Mountains during 1840–2010 [34], respectively. Black and red horizontal lines indicate the 95% and 99% confidence limits, respectively.
Atmosphere 11 00889 g006
Figure 7. Wavelet analysis of the spring precipitation reconstruction py AMJ + AMJ from 1515 to 2015. Detected periodicities highlighted by black outline are significant at the 95% confidence level.
Atmosphere 11 00889 g007
Table 1. Chronology statistics of the δ18O time series of J. polycarpos in northern Iran.
Statistical Parameters1515–2015
Mean (‰)30.94
Minimum (‰)28.51
Maximum (‰)33.64
Range (‰)5.13
Std. deviation0.91
Variance0.82
Standard error of mean (‰)0.04
AC10.41
Skewness0.08
Kurtosis−0.02
Table 2. Correlation coefficient (r) and explained variance (R2) between the Chahar Bagh Juniper δ18O chronology and precipitation.
py AMJ + AMJMAMJFMAMJpy AM + AM
r−0.72−0.64−0.63−0.71
R20.520.410.400.50
All correlations are significant at the 0.01 level.
Table 3. Statistics of the leave-one-out cross-validation method for the precipitation py AMJ + AMJ reconstruction using linear regression. R2: Explained variance, R2adj: Adjusted explained variance, F: F-stat, RE: Reduction of Error, ST: Sign test, DW: Durbin–Watson test, PMT: Product means test.
PeriodR2R2adjFRESTDWPMT
1983–20150.520.5033.900.4521+/121.144.19
Table 4. Frequency of occurrence of dry/wet and extreme dry/wet events.
Dry/Wet Year ClassificationCentury (No. of Years Observed)
16th17th18th19th20th21st (2000–2015)
Dry306512174
Wet2153121124
Extremely dry7--131
Extremely wet-24111

