1. Introduction
Hurricanes are characterized by maximum sustained winds exceeding 74 mph (64 knots). The eye of a hurricane and the strong wind associated with the eyewall can vary considerably [
1,
2]. Damaging winds, devastating storm surge, flooding rains, and tornadoes are the greatest threats to coastal areas associated with landfalling hurricanes. Therefore, an accurate description of wind and water forecasts by numerical simulation models is needed to prepare for the potential threats and impacts from landfalling hurricanes and for post-storm assessments.
The Named Storm Event Model (NSEM) is a high-resolution hindcast system, which is being developed to meet the requirements of the National Oceanic and Atmospheric Administration’s (NOAA) Consumer Option for an Alternative System to Allocate Losses (COASTAL) Act of 2012 [
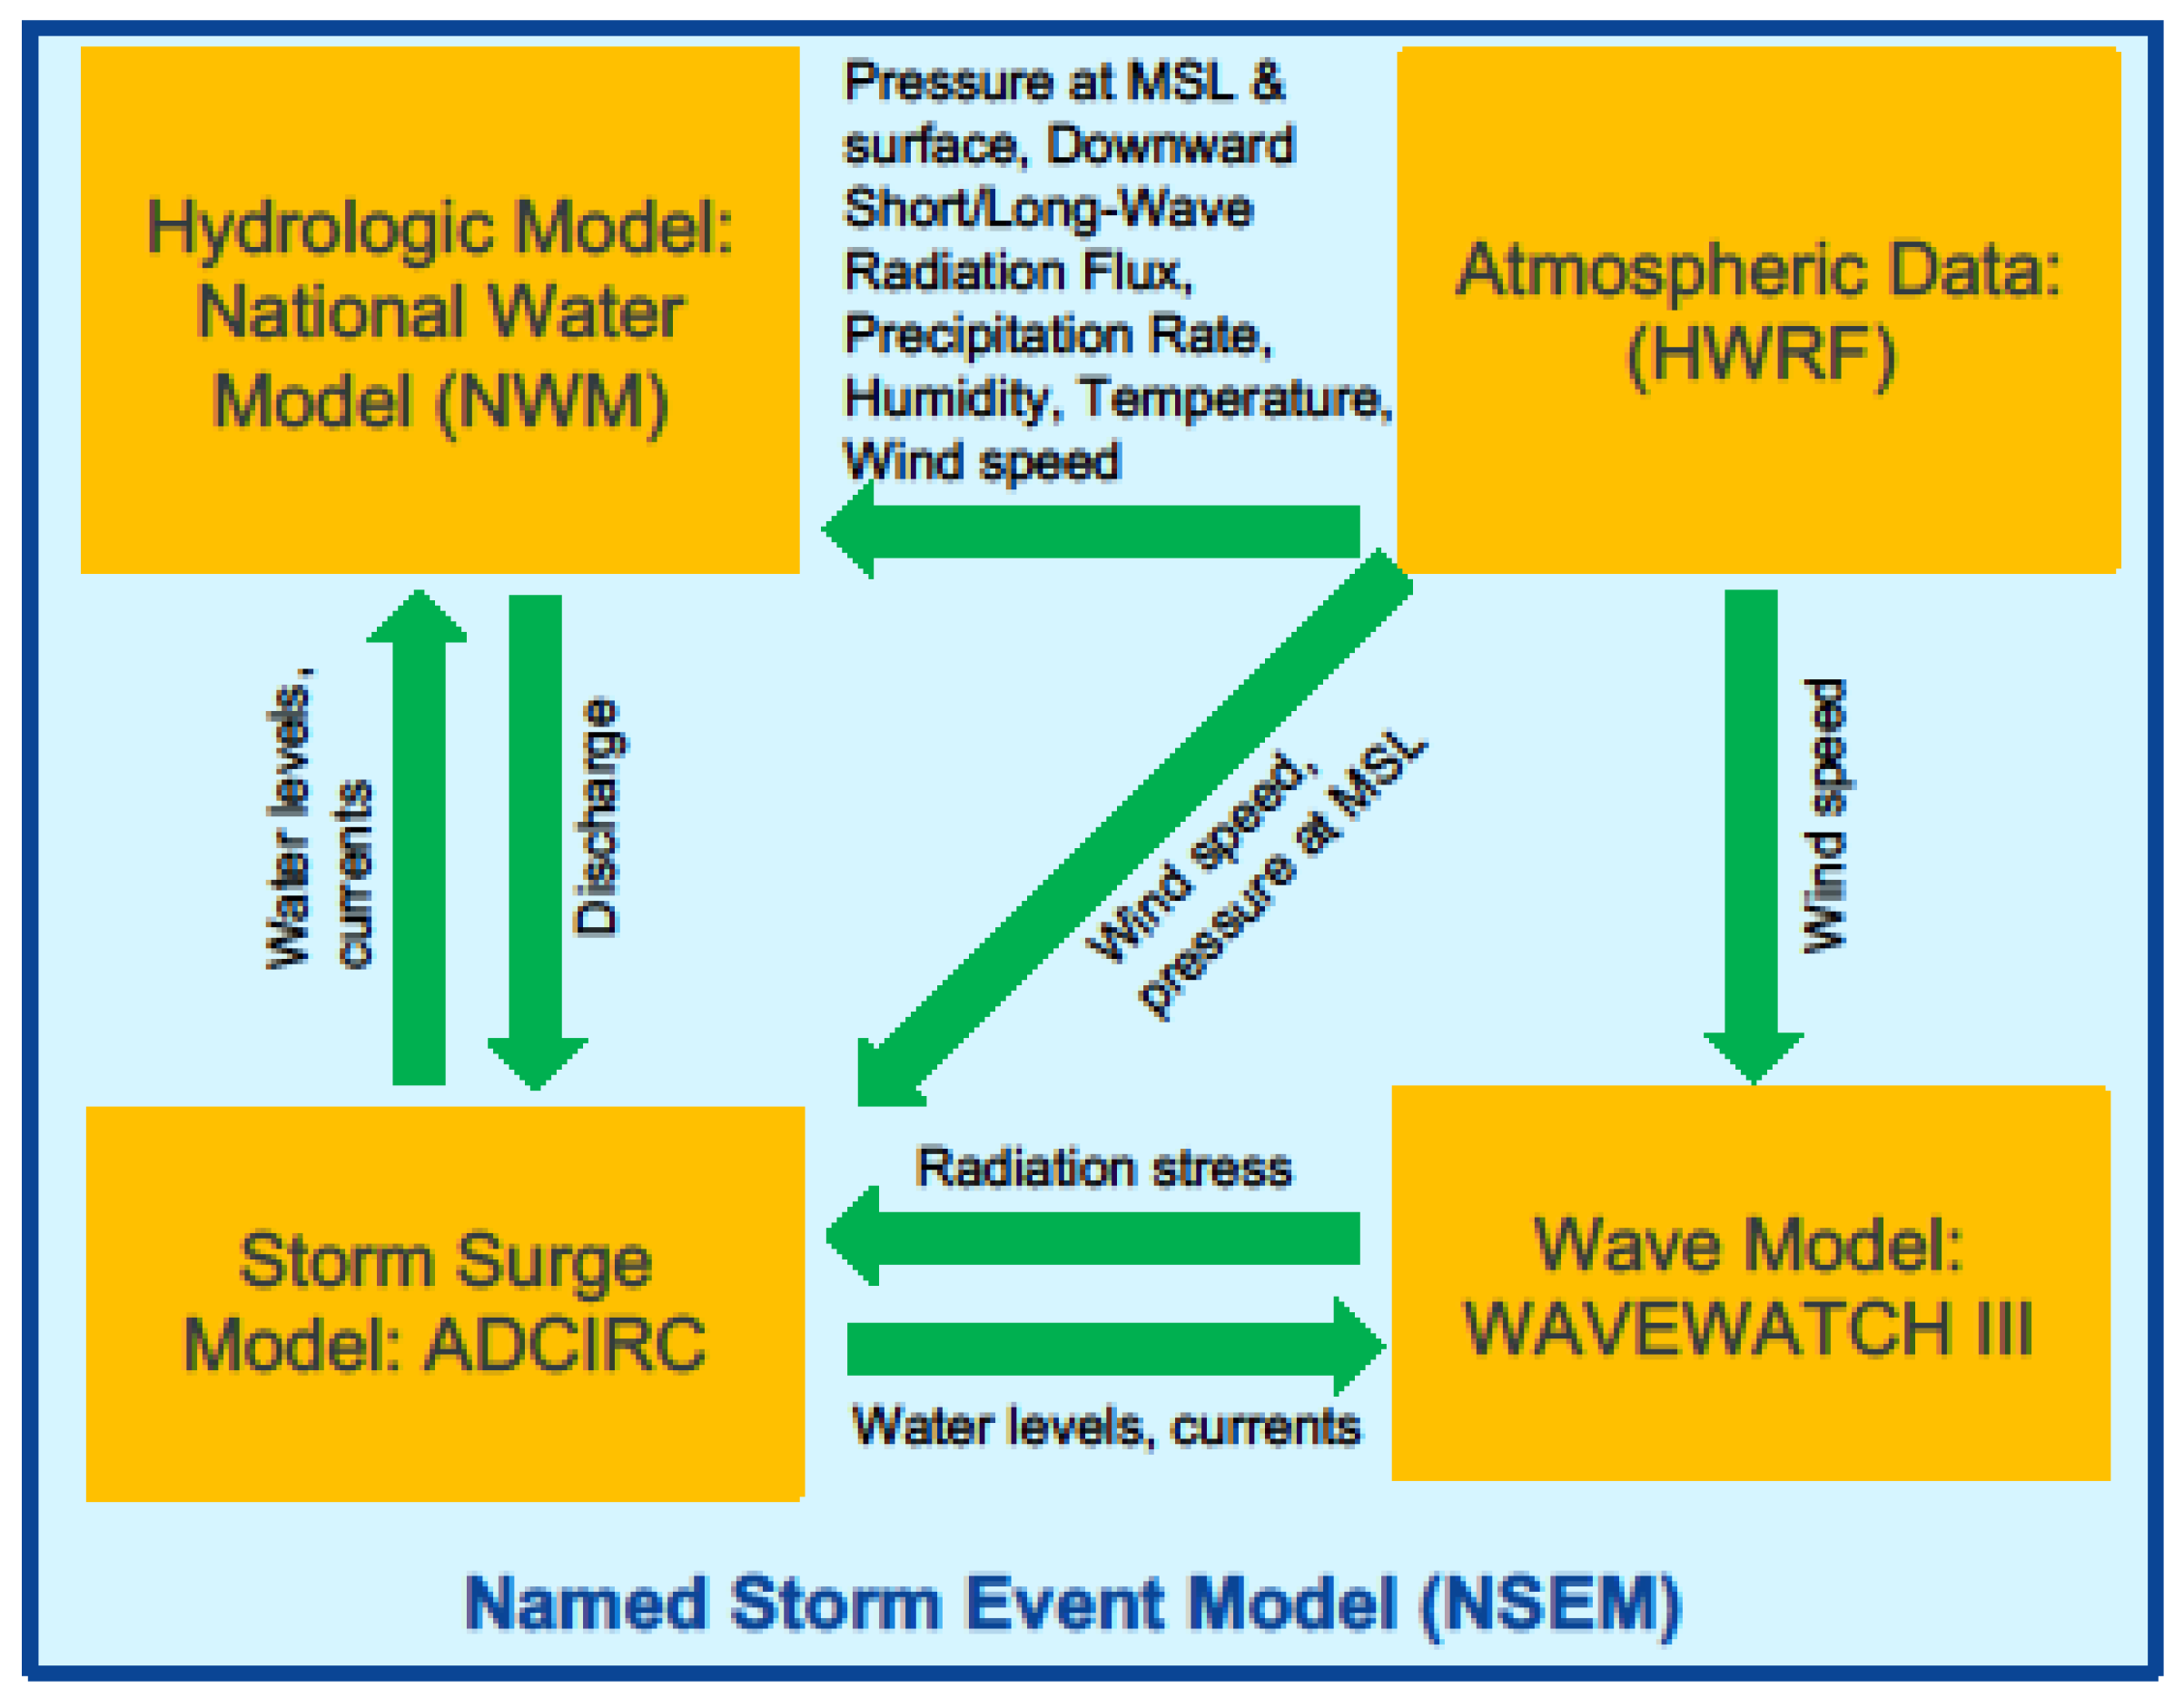
3]. The assessments generated by the NSEM will indicate the timing and strength of damaging winds and water at a given location in the area impacted by the hurricane. The NSEM is a coupled system of atmosphere, inland flooding, wave, and storm surge within a flexible framework. The detailed workflow of the NSEM is shown in
Figure 1. The Hurricane Weather Research and Forecasting (HWRF; [
4,
5]) model has been selected as the atmospheric component of the NSEM to provide atmospheric forcing fields for the wave/surge simulation in NSEM. Therefore, the quality of the HWRF atmospheric forcing fields in the entire simulation domain, especially in coastal areas where hurricanes make landfall, will be one of the key components to the success of the NSEM system in the COASTAL Act program.
The HWRF modeling system, which has been operational at the NOAA’s National Centers for Environmental Prediction (NCEP), has undergone significant advances over the past several years, and it has evolved as a unique high-resolution atmosphere–ocean-wave coupled system providing real-time forecast guidance for all global tropical cyclones [
4,
9]. Hurricane track and intensity forecasts from the HWRF model outperform many other operational forecast guidance available to the forecasters [
4,
10]. Advancements in current forecast capabilities have resulted in a demand for generating more accurate hurricane reanalysis and reforecast datasets with a wide range of applications. Experiments have been conducted with the NSEM and include reruns of historically significant tropical cyclones, using the operational HWRF model. These experiments provide valuable information on hurricane analysis for landfalling storms which is needed for downstream marine/coastal applications under the COASTAL Act.
High-resolution wind information is critical for accurate forecasting of landfalling hurricanes. The operational HWRF system has a triple-nest capability with horizontal grid resolutions of 13.5, 4.5, and 1.5 km. The same resolutions were originally used for the land–sea mask, to avoid dealing with inconsistent land–sea masks between the parent and nested domains [
11]. As a result, details of the land–sea features within the nested domains (4.5 and 1.5 km) are lost due to the use of the coarser resolution (13.5 km) land–sea mask dataset.
In this study, we introduce the high-resolution land–sea masks for the inner HWRF nests (4.5 and 1.5 km) into the operational HWRF system for a more accurate definition of coastlines, land-use, and soil categories. Four destructive North Atlantic hurricanes (Harvey and Irma in 2017; and Florence and Michael in 2018), which brought historic wind damage and storm surge along the Eastern Seaboard of the United States and Northeastern Gulf Coast, were selected to demonstrate the methodology of introducing the high-resolution land–sea masks in HWRF. A set of hurricane simulations was carried out, using the HWRF model, with and without the high-resolution land–sea masks. The accurate definition of coastlines, land use, and the quality of simulated wind along the coastline were investigated, as well as a detailed assessment of the hurricane track and intensity forecasts.
This paper is organized as follows: In
Section 2, an overview of the operational HWRF system upgrades performed by the NOAA Environmental Modeling Center (EMC) during the fiscal year 2018 is provided, as well as a detailed description of the HWRF land–sea mask issue;
Section 3 summarizes the storms selected from the 2017–2018 Atlantic hurricane seasons for this study;
Section 4 presents detailed results of structural verifications with and without high-resolution land–sea masks; and a summary and conclusions are provided in
Section 5.
2. HWRF System and Land–Sea Mask Issue
2.1. HWRF System
The HWRF system, which is used as the atmospheric component in NSEM in this study, is an atmosphere–ocean coupled system dedicated to tropical cyclone applications [
11]. Since 2007, the HWRF system has been widely applied in both operational and research environments as a leading storm simulation model. It includes the Weather Research and Forecasting (WRF) model as the software infrastructure, the Non-Hydrostatic Mesoscale Model on the E Grid (NMM-E) as the dynamic core, the Message Passing Interface Princeton Ocean Model for Tropical Cyclone (MPIPOM-TC) as the ocean model component, and the NCEP coupler. HWRF employs a suite of advanced physical parameterizations developed for tropical cyclone applications [
12]. These parameterizations include the NOAA’s Geophysical Fluid Dynamics Laboratory (GFDL) surface-layer parameterization, the Ferrier–Aligo microphysics, the Noah land surface model (LSM; [
13]), the Rapid Radiative Transfer Model (RRTMG; [
14]) for general circulation model radiation schemes, the Global Forecast System (GFS) Hybrid Eddy Diffusivity Mass-Flux (Hybrid-ESMF) planetary boundary layer (PBL) scheme [
15], and the scale-aware GFS simplified Arakawa–Schubert (SAS) deep and shallow convection scheme [
16].
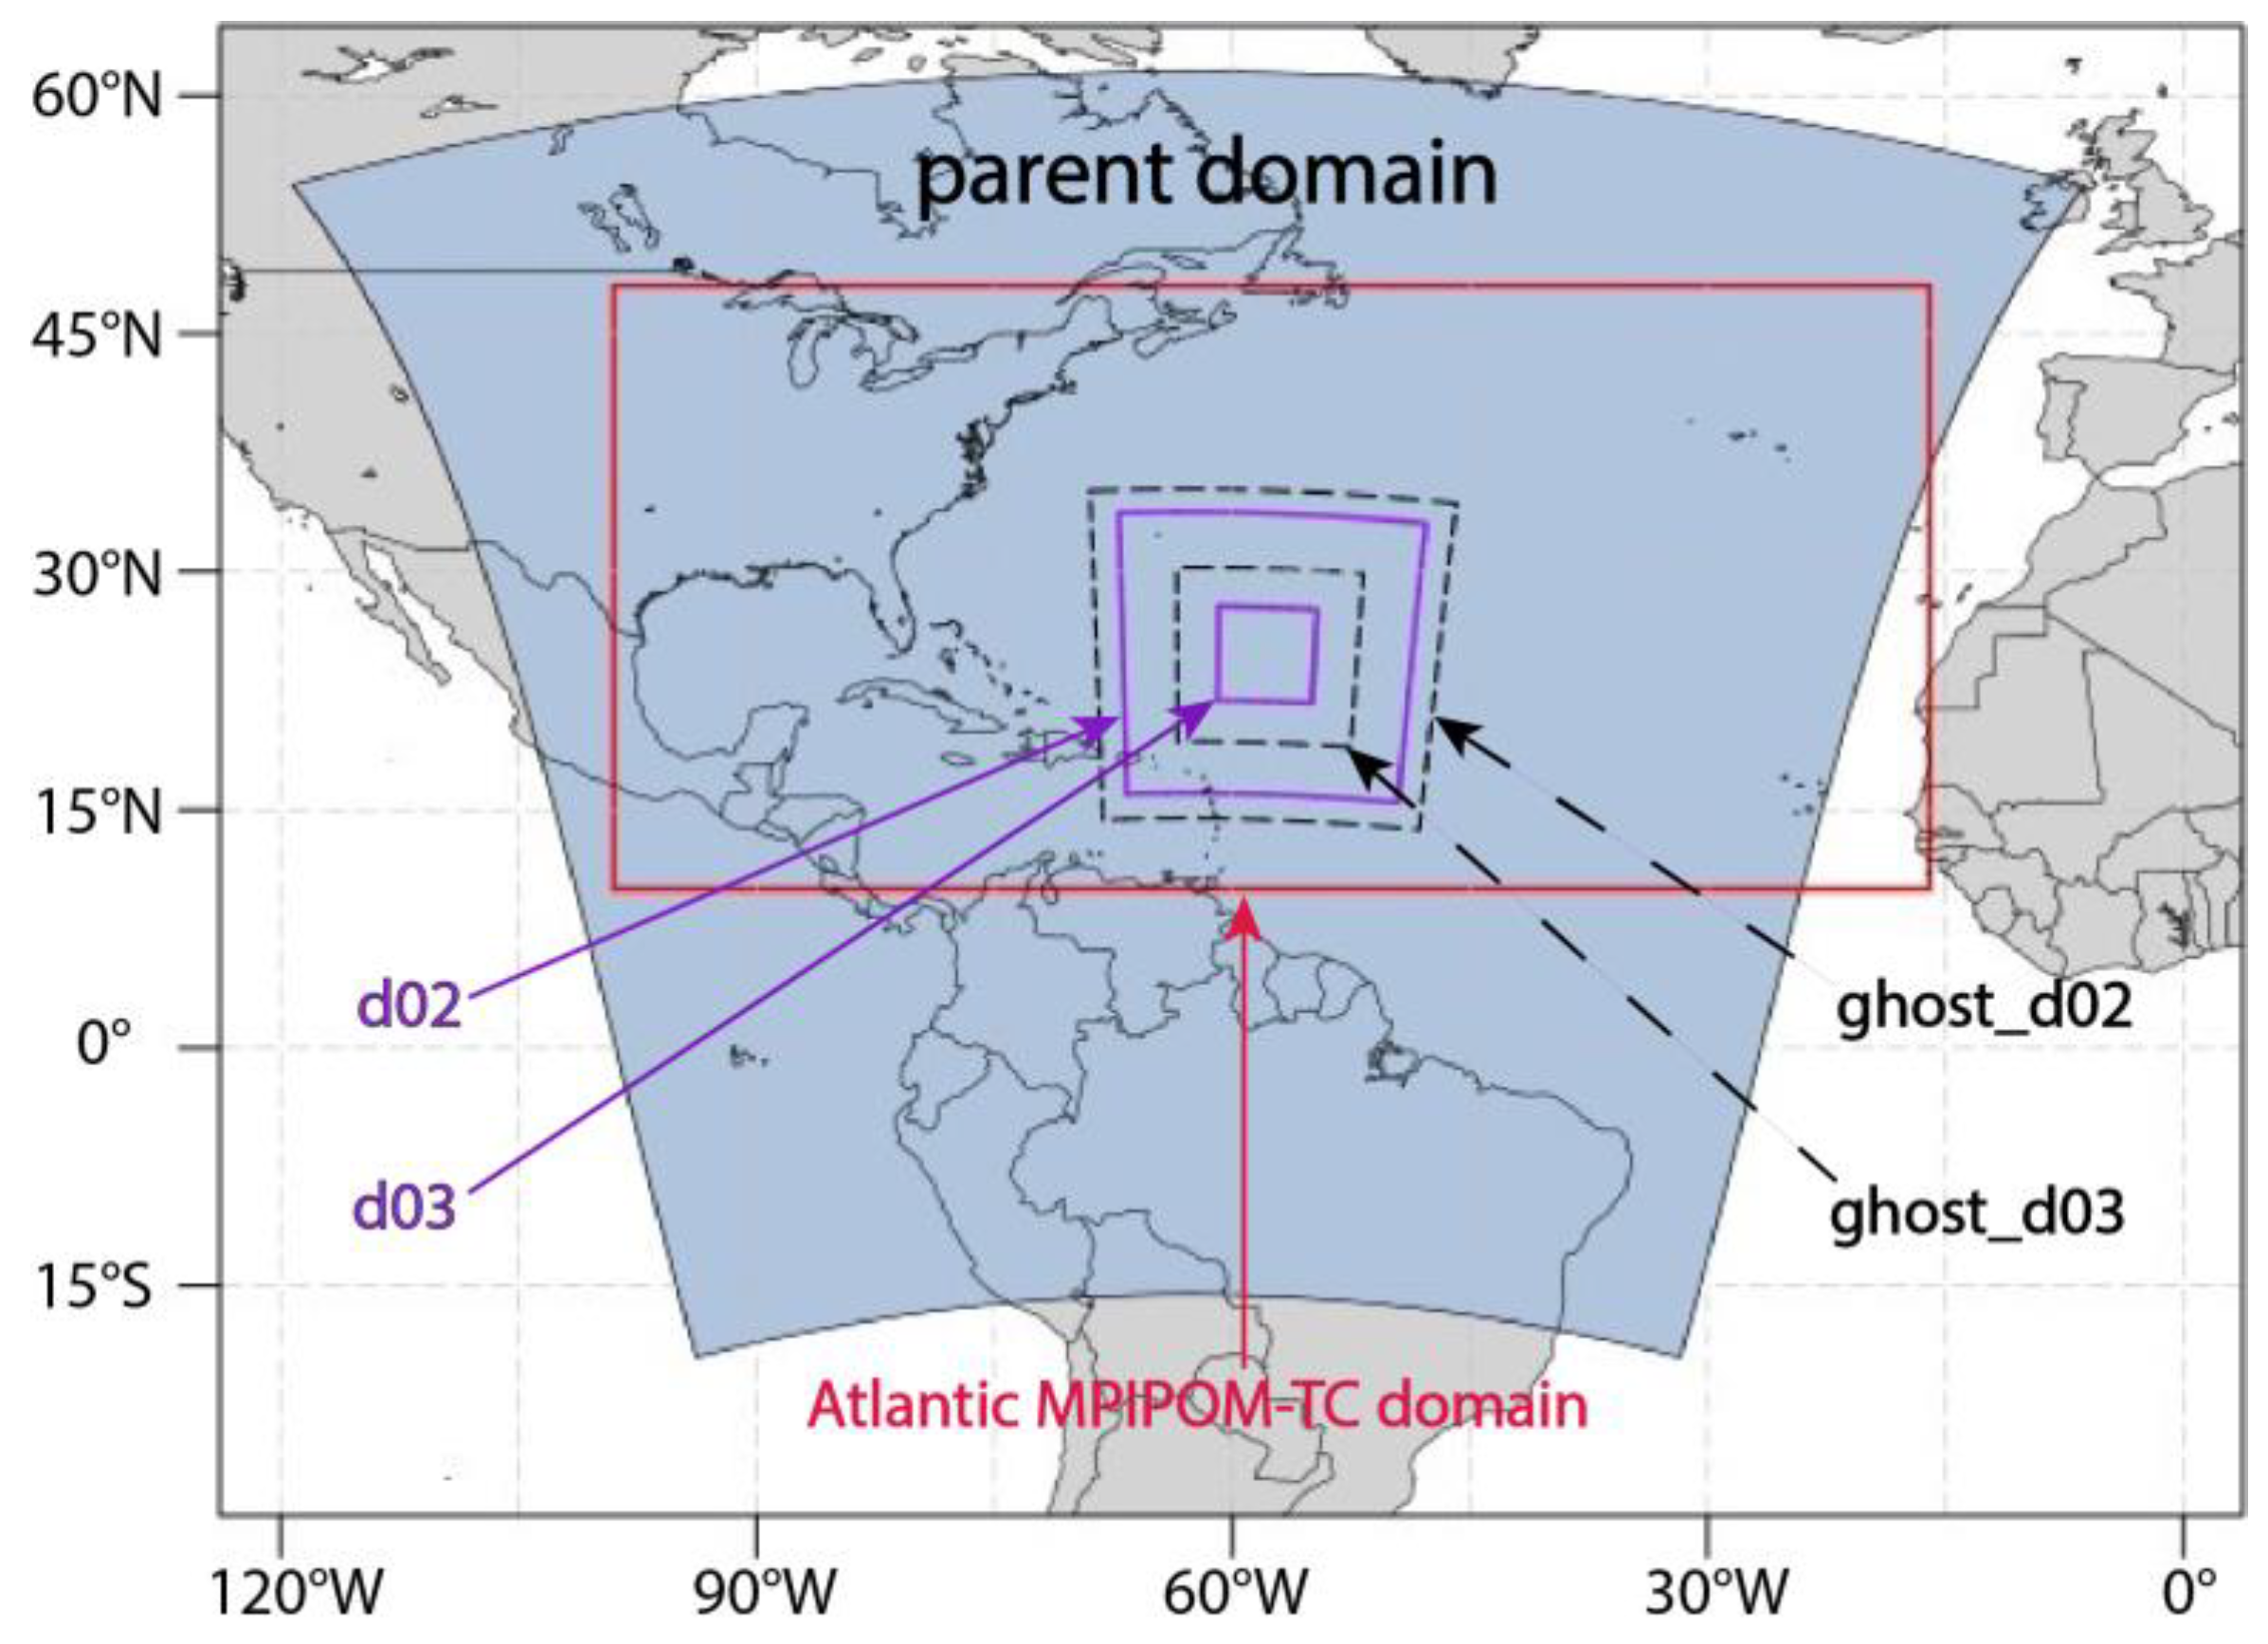
The HWRF model has three nested grids, at 13.5, 4.5, and 1.5 km, for the parent domain, intermediate nest, and innermost domains, respectively (
Figure 2). The parent domain is approximately 77.2° × 77.2°, with its center determined by the initial location of the storm’s position and the 72-h forecast from National Hurricane Center (NHC) or the Joint Typhoon Warning Center (JTWC), while the intermediate domain covers ~17.8° × ~17.8° and the innermost domain covers ~5.9° × ~5.9°. Both of the nested domains move and are centered on the storm. They are also two-way interactive, (i.e., model information is exchanged between the nested domains and their parent domain). Additionally, the HWRF system has two ghost domains, which are generated for storm (ghost-d02) and inner-core environment (ghost-d03) data assimilations [
17]. They have the same spatial resolutions as the nested domains. However, the ghost domains have a larger spatial coverage (20° × 20° and 11° × 11°). The ghost-d02 domain sufficiently covers the entire storm and the near-storm environment, while the ghost-d03 domain is used primarily to assimilate aircraft reconnaissance data.
The HWRF system is triggered, operationally, when NHC or JTWC identifies an area or disturbance that has the potential of becoming a tropical depression. Once a disturbance is identified, the HWRF system is executed four times daily (0000, 0600, 1200, and 1800 UTC) to generate five-day hurricane forecasts (hurricane track, intensity, structure, and rainfall). The HWRF is no longer executed when a tropical cyclone either dissipates after making landfall, becomes extratropical, or degenerates into a remnant low when convection becomes disorganized around the center of circulation. A more detailed description of this state-of-the-art tropical cyclone forecast system may be found in the HWRF users’ guide [
11].
2.2. Issues with Land–Sea Masks in HWRF
Static geographical conditions, such as terrain and land–sea masks, provide important external forcings on the dynamics and thermodynamics of the HWRF system. Therefore, a vital aspect in numerical weather prediction is in properly representing geographical conditions (topography and land-use type) on the model grid and with respect to resolution.
In this study, the 2 arc minutes (approximately 4 km) horizontal grid spacing topography is the only static high-resolution dataset in the HWRF system. Before the HWRF model forecast is executed, the WRF Preprocessing System (WPS) is used to interpolate topographic information from prescribed high-resolution-terrain datasets to the required grid resolutions over the nested domains to ensure the movable nests always have access to high-resolution topography. However, due to pragmatic considerations, the land–sea masks for the two inner nest domains within the FY18 operational HWRF system were designed to be identical to the coarser-resolution parent domain to avoid dealing with different definitions of land/sea points for moving nests [
11]. This means the resolution of the land–sea mask in the innermost domain (d03) of the FY18 operational HWRF system is not 1.5 km, but 13.5 km, retaining the same resolution as the parent domain. Note that the land–sea mask in HWRF is the proportion of land, as opposed to ocean or inland waters (coastal waters, lakes, reservoirs, and rivers), in a numerical model grid box.
In order to provide more realistic wind information in areas near the coastline during hurricane landfall, high-resolution land–sea masks for the nested domains were introduced in the NCEP HWRF system. The high-resolution land–sea masks were developed to meet the requirements of NOAA COASTAL Act of 2012. Rather than using the same land–sea masks as the outermost coarse parent domain, the two storm-following moving nests use the high-resolution land–sea masks together with the land-use and soil types compatible with their own grid resolutions. Meanwhile, for the parent–nest interaction, a nearest point search algorithm is utilized to search for the nearest point with the same land-use type when the parent and nested domains have inconsistent land–sea masks at collocated grids. When the parent and nest domains interact with each other, especially when the storm-following nests move within their parent domains, special treatment is needed to provide proper values for those land-use type related variables (e.g., land/water surface temperature, soil temperature, and soil moisture) when the collocated parent/nest grid boxes have inconsistent land–sea masks. A nearest point search method is utilized to provide proper values for those land-use type related variables from a nearest point with the same land–sea mask. For example, considering the situation when the nested domain moves within its parent domain, the leading edge of the nested grid will need get values from its coarse parent grid. For a water point in the nested grid, if its collocated or nearest parent grid point is a water point, it will take the value from that parent grid point. If the collocated or nearest parent grid point is a land point, then it will search for the next nearest water point among the four surrounding parent grid points and take that value instead. If all the four surrounding coarse grid points are land points, which means this is a one-cell lake/ocean point, it will then take the value from its nearest parent point and ignore the land–sea mask difference. A similar method is used when the nested grid point is a land point. Of course, this will introduce some additional input/output and memory considerations, as well as communications during the model integration. However, the overall overhead added for the model forecast wall clock time is negligible (less than 2%).
3. Storms Selection from the 2017–2018 Atlantic Hurricane Seasons
The COASTAL Act (2012) requires NOAA to produce detailed “post-storm assessments” in the aftermath of a damaging tropical cyclone that strikes the US or its territories. Therefore, high-resolution wind information is needed in the areas close to the coastline during landfall. To meet this requirement, four destructive landfalling Atlantic hurricanes (Harvey and Irma in 2017; and Florence and Michael in 2018) were selected to investigate the successful implementation of the high-resolution land–sea masks for the moving nested domains in the HWRF system. The NHC best tracks for these four Atlantic hurricanes are shown in
Figure 3.
In addition,
Table 1 provides a short summary of these four selected hurricanes, based on the NOAA NHC’s tropical cyclone reports.
The 2017 Atlantic hurricane season featured 17 named storms, 10 hurricanes, and 6 major hurricanes. Harvey and Irma (2017), two of the costliest hurricanes in US history, brought widespread death and destruction to Texas and Florida, respectively. Hurricane Irma developed into one of the most intense storms of the season in the Atlantic, as it moved over the open warm ocean for a long distance, without encountering land. Hurricane Irma soared to Category 5 strength. The storm caused damage from high winds, prolonged rainfall and flooding, and severe convective storms that were recorded well inland from the initial landfall location.
Hurricanes Florence and Michael (2018) were selected in this high-resolution land–sea mask case study due to the highly significant impacts of these two very different hurricanes. Hurricane Florence was a destructive hurricane that produced historic flooding in parts of North Carolina and South Carolina. Hurricane Florence made landfall near Wrightsville Beach, North Carolina as a Category 1 storm on 14 September 2018, after it had weakened over the Atlantic Ocean from Category 4 intensity four days earlier. Over the course of a seven-day period, widespread catastrophic flooding occurred across the impacted region after many areas received 15 to 35 inches of rainfall. Unlike Florence, Michael developed much closer to the continental United States and underwent rapid intensification. Michael was a catastrophic hurricane that produced historic storm surge and wind damage across parts of Florida, Alabama, and Georgia. Hurricane Michael made landfall on 10 October 2018, near Mexico Beach, Florida, as a Category 5 storm, with maximum sustained winds of 135 knots.
4. Numerical Experiments and Results
Two experiments were carried out to assess the impact of the high-resolution land–sea masks in the HWRF system. The first experiment (hereafter CTRL) was comprised of the hurricane analyses and forecasts, using the operational FY18 HWRF system, where the 13.5 km land–sea mask was used for all three domains. The second experiment (hereafter HMSK) was configured identical to CTRL, but with the high-resolution land–sea masks in the inner nested domains. Therefore, the resolution of the land–sea mask in HMSK is consistent with the model grid resolution of each domain (13.5, 4.5, or 1.5 km).
A case study conducted for Hurricane Irma (2017) and the verification of all four selected hurricane forecasts generated by CTRL and HMSK are discussed in this section. In the Hurricane Irma case study, the timeseries of HWRF simulated wind speeds are validated with NOAA National Data Buoy Center (NDBC) buoys [
18] along the coast. The meteorological information collected at NDBC locations are widely used, due to their high quality, long duration, and availability of wave measurements for hydrodynamic model evaluations. The NHC best-track data [
19], which include an official “best track” chronology of storm center locations, 10 m maximum wind speeds, and wind radii, are used as a reference for verification.
4.1. Hurricane Irma Case Study
4.1.1. The Impact of High-Resolution Land–Sea Masks
One cycle simulation of Hurricane Irma was selected as the case study to investigate the impact of high-resolution land–sea masks within the HWRF system. Hurricane Irma (2017) was the costliest storm in the history of the US state of Florida. To clearly demonstrate the impact of the high-resolution land–sea mask on multiple atmospheric field configurations, a cycle valid at 0000 UTC, 11 September 2017 was selected for a more detailed analysis because Irma made landfall near this time.
The accuracy of the land–sea mask distribution along the coastline was assessed first. Compared with
Figure 4a, it is clear that the high-resolution mask in
Figure 4b provides an improved representation for Florida in the United States, especially in the regions close to the ocean or inland waters, which is better represented after using the high-resolution land–sea masks in the HWRF innermost domain (d03).
Furthermore, the 13.5 km coarse resolution of the land–sea masks in the HWRF innermost domain (d03) reduces the capability to accurately analyze the spatial distribution of atmospheric fields at very high spatial (1.5 km) resolutions.
Figure 5a,c illustrates the impact to U10 and V10 (U and V components of wind speed at 10 m above the land/sea surface) from the low-resolution land–sea masks in the current operational HWRF. The jagged pattern of the U10 and V10 wind distribution along the coastline is due to the coarse resolution (13.5 km) of the land–sea mask from the parent domain. After implementing the high-resolution land–sea masks, high resolution wind information is produced in the area along the coastline during hurricane landfall (shown in
Figure 5b,d).
4.1.2. Ten-Meter Wind Forecast Verification against NDBC Buoys
Verification of wind forecasts by HWRF were conducted by using NDBC buoy measurements. Buoy data were obtained directly from NOAA NDBC’s online data archives (
http://www.ndbc.noaa.gov/). Note that the velocity profile is logarithmic where one variable is the surface roughness. Land surfaces have different issues than water surfaces. For water surfaces, the roughness changes as a function of the surface stress, which is in turn modified by stratification. The estimation of Wind Speed measurement at NDBC, which is not at 10 m, raised or lowered to a height of 10 m following a logarithmic profile calculation method [
20].
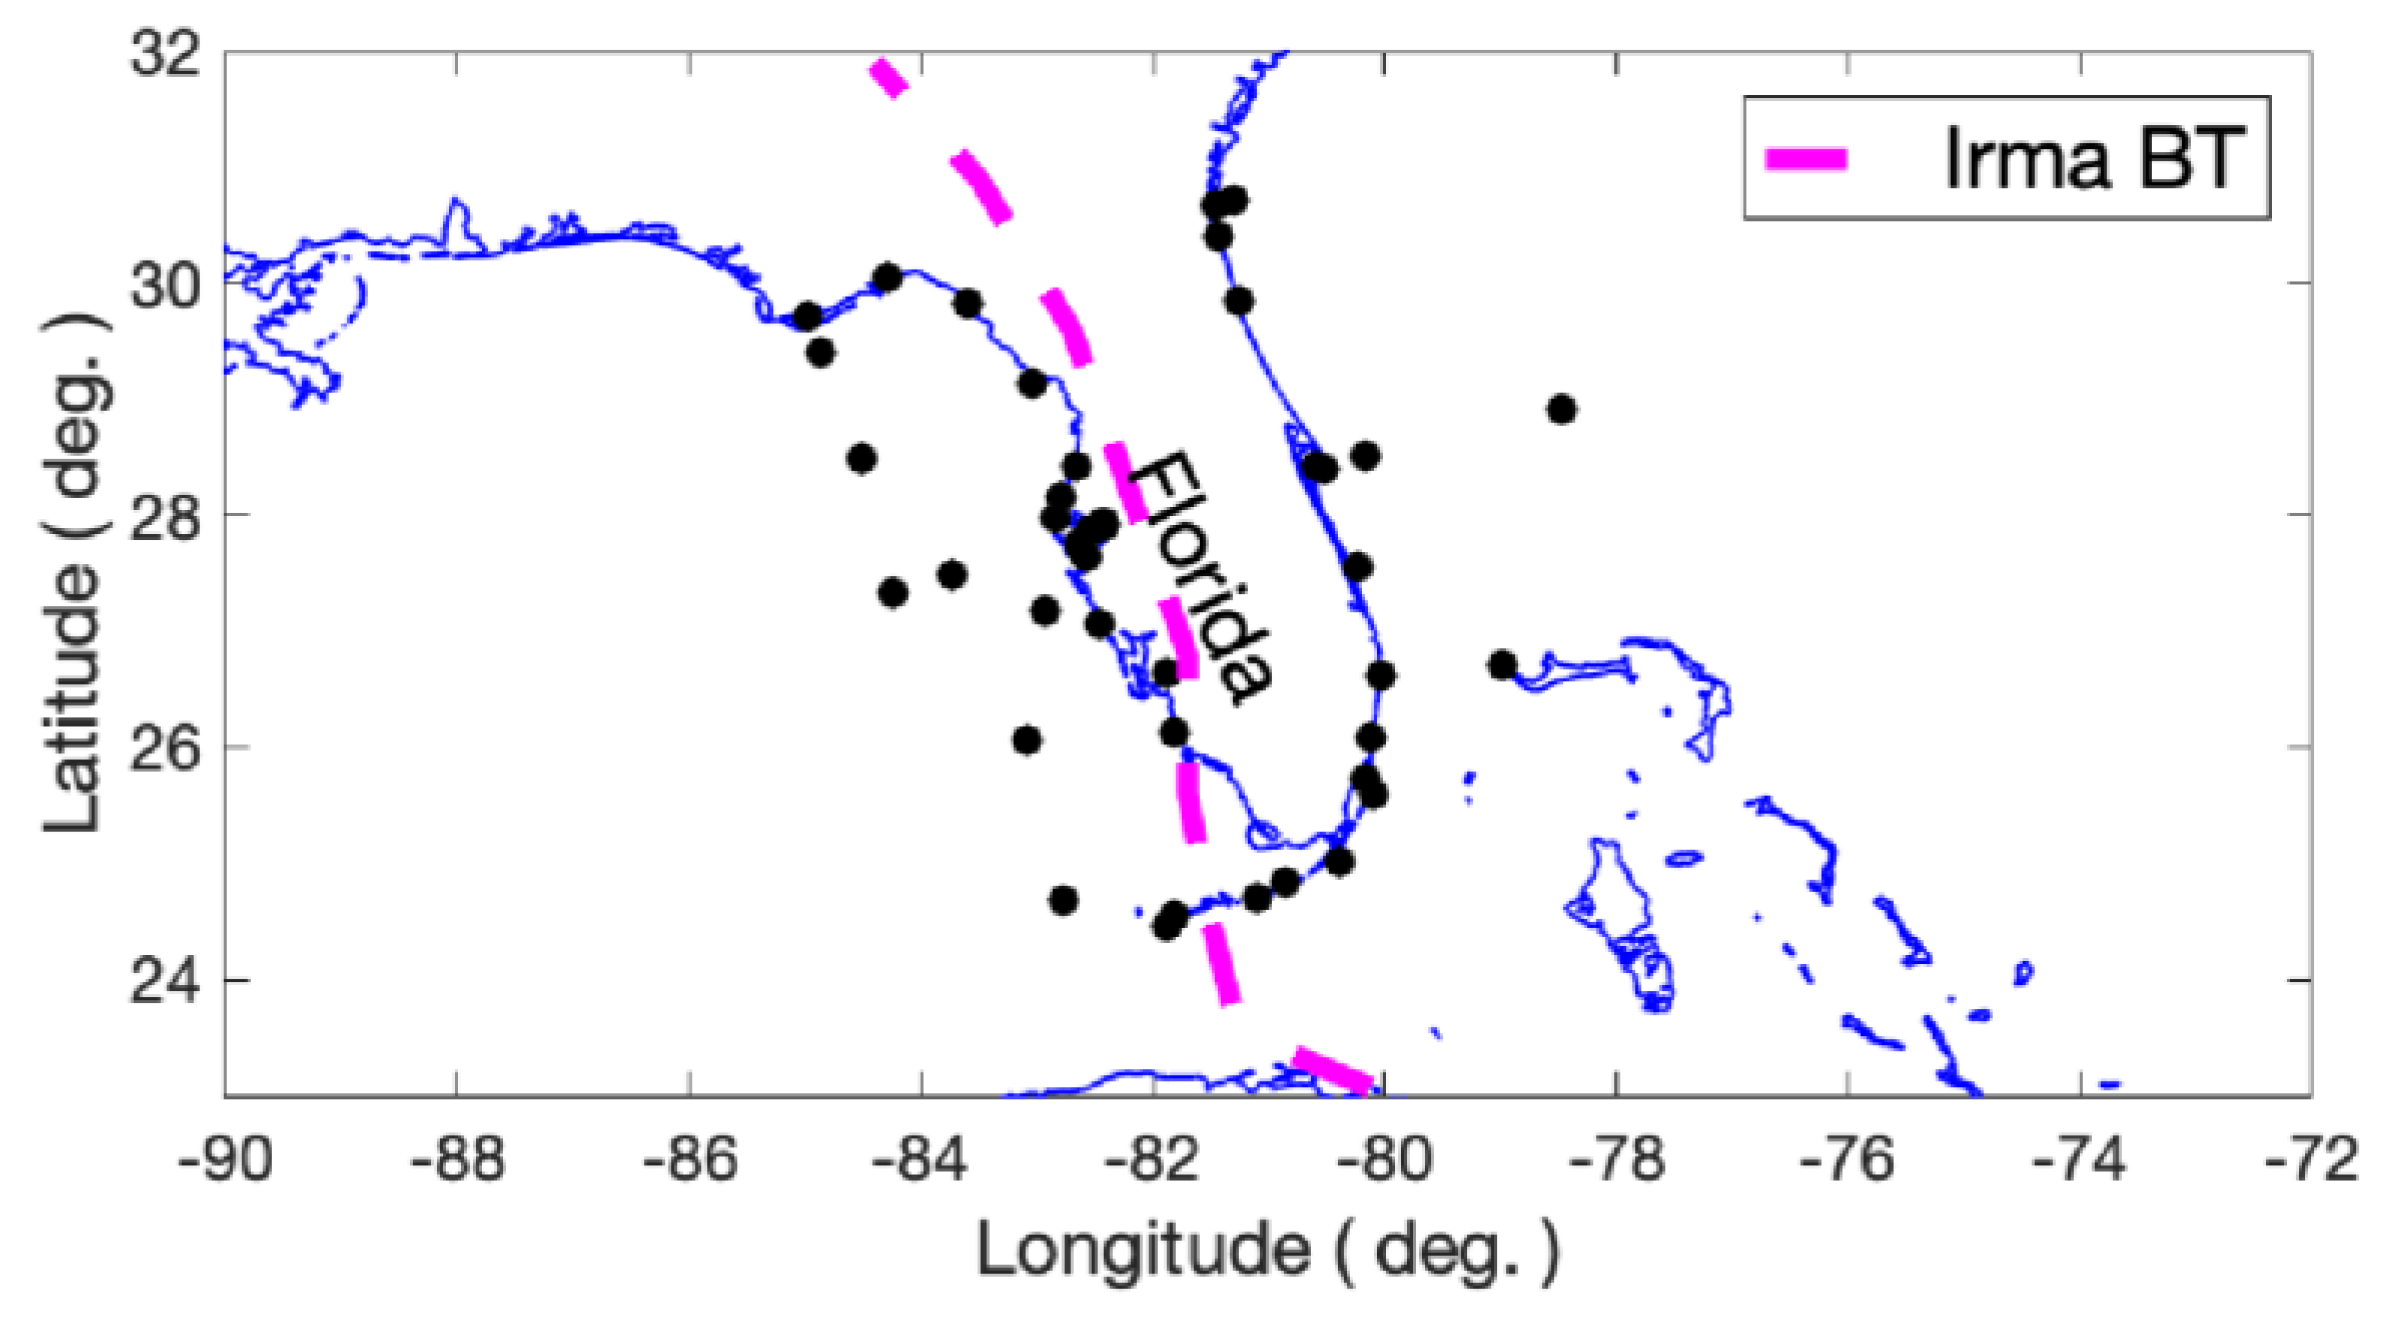
Figure 6 shows the locations of the NDBC buoy measurements selected for the performance assessment of 10 m wind forecasts from CTRL and HMSK for Hurricane Irma. A total of 43 stations were available along the hurricane track and within close vicinity of hurricane landfall, on both sides of the Florida Peninsula, and were used for the case study wind forecast assessment.
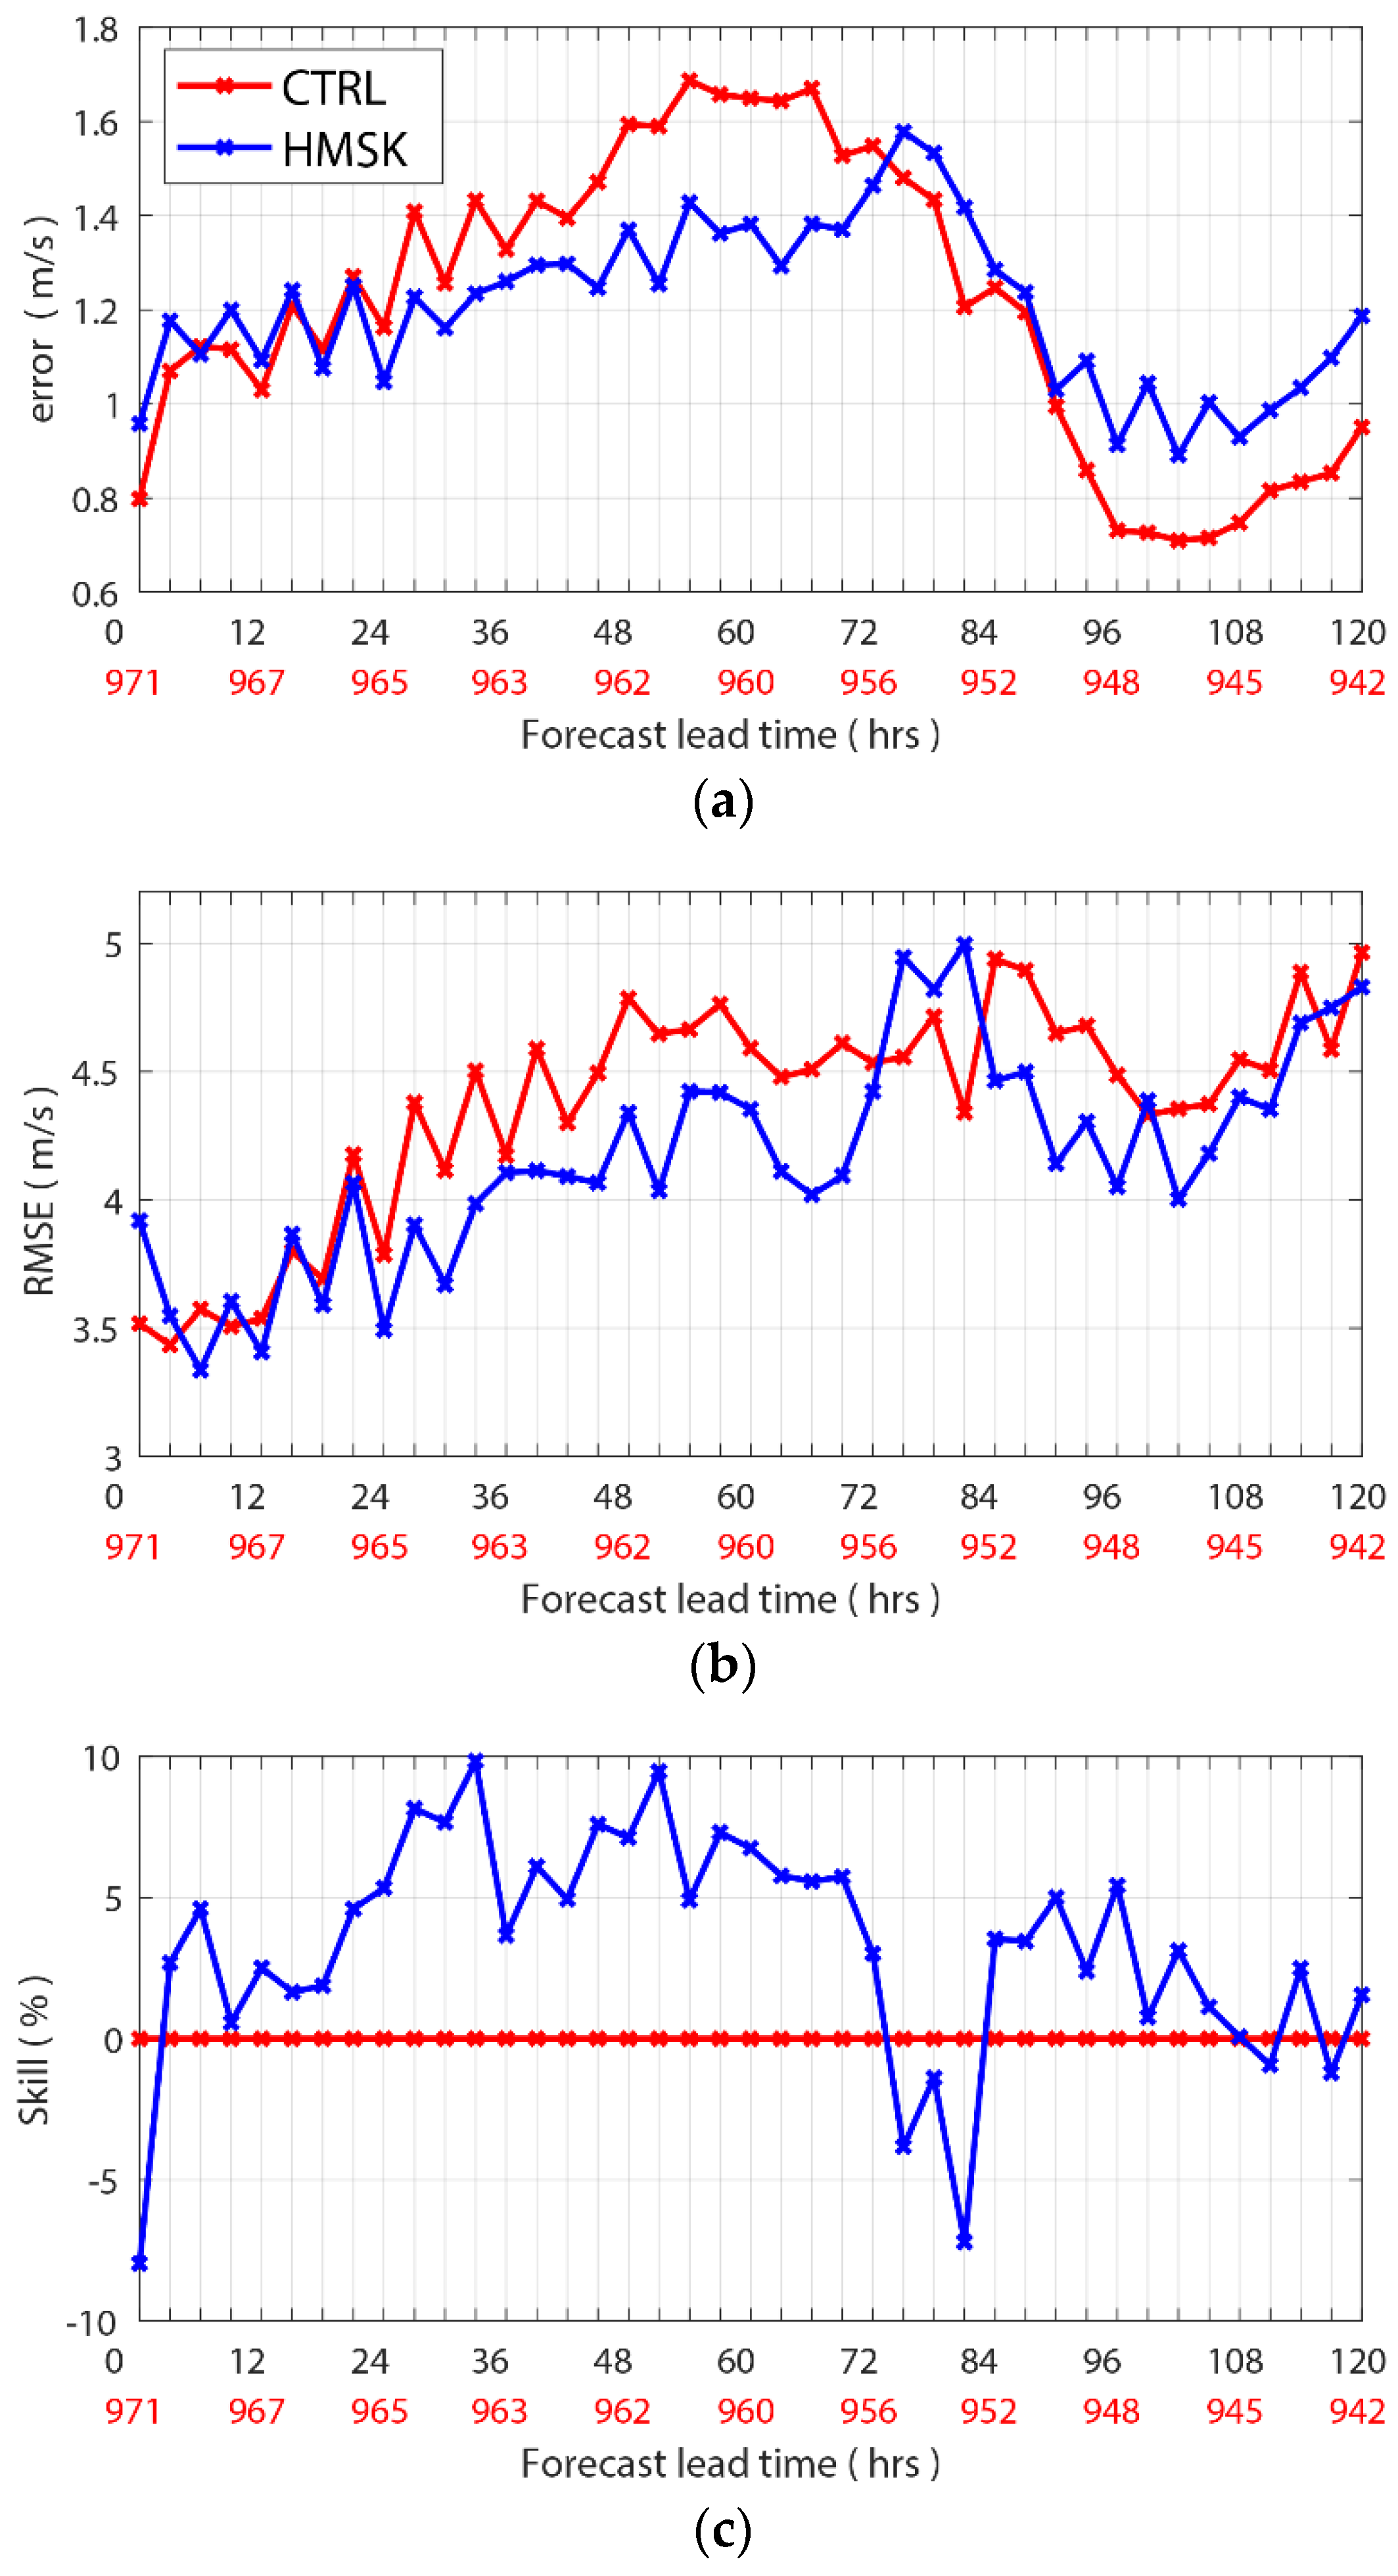
Figure 7 shows the qualitative assessment of the 10 m wind speed simulations for two experiments (CTRL and HMSK). The results were calculated on the basis of computing bulk statistics of modeled wind speed at 10 m above mean sea level relative to available NDBC buoy measurements. The time period is from 7 to 11 September 2017, when Hurricane Irma had the most destructive wind speeds around landfall. The bias error and root-mean-square errors (RMSEs) of the 10 m wind speed simulations, as a function of forecast lead time, are shown in
Figure 7a,b. A noticeable improvement for the point source observations is revealed from the HMSK experiment with the high-resolution land–sea mask in the moving nested domains. In addition, an improvement is shown in
Figure 7c for the skill score of 10 m wind speed forecast error, which was calculated from the 120-h forecast by comparing the 10 m wind speed forecast error of HMSK to CTRL, using the following equation:
The model skill statistics in
Figure 7c also shows the accuracy improvement from HMSK for the entire forecast time period, with the exception of the first couple of hours, due to model spin-up, and the 72–84 h time period.
4.2. Verification of HWRF Hurricane Predictions
4.2.1. Track Forecast Verification
Hurricane track verifications for these selected Atlantic hurricanes were examined. Track forecast errors, which are defined as the distance between the predicted storm center and the best track location, were conducted for all hurricane cases. The NHC post-processed best-track data (bdeck) in the Automated Tropical Cyclone Forecasting (ATCF) format were utilized, along with HWRF model-generated tracker outputs (adeck) [
21].
The cases selected for track forecast verification in
Figure 8 include four Atlantic hurricanes in 2017–2018 which made landfall along the US East Coast (shown in
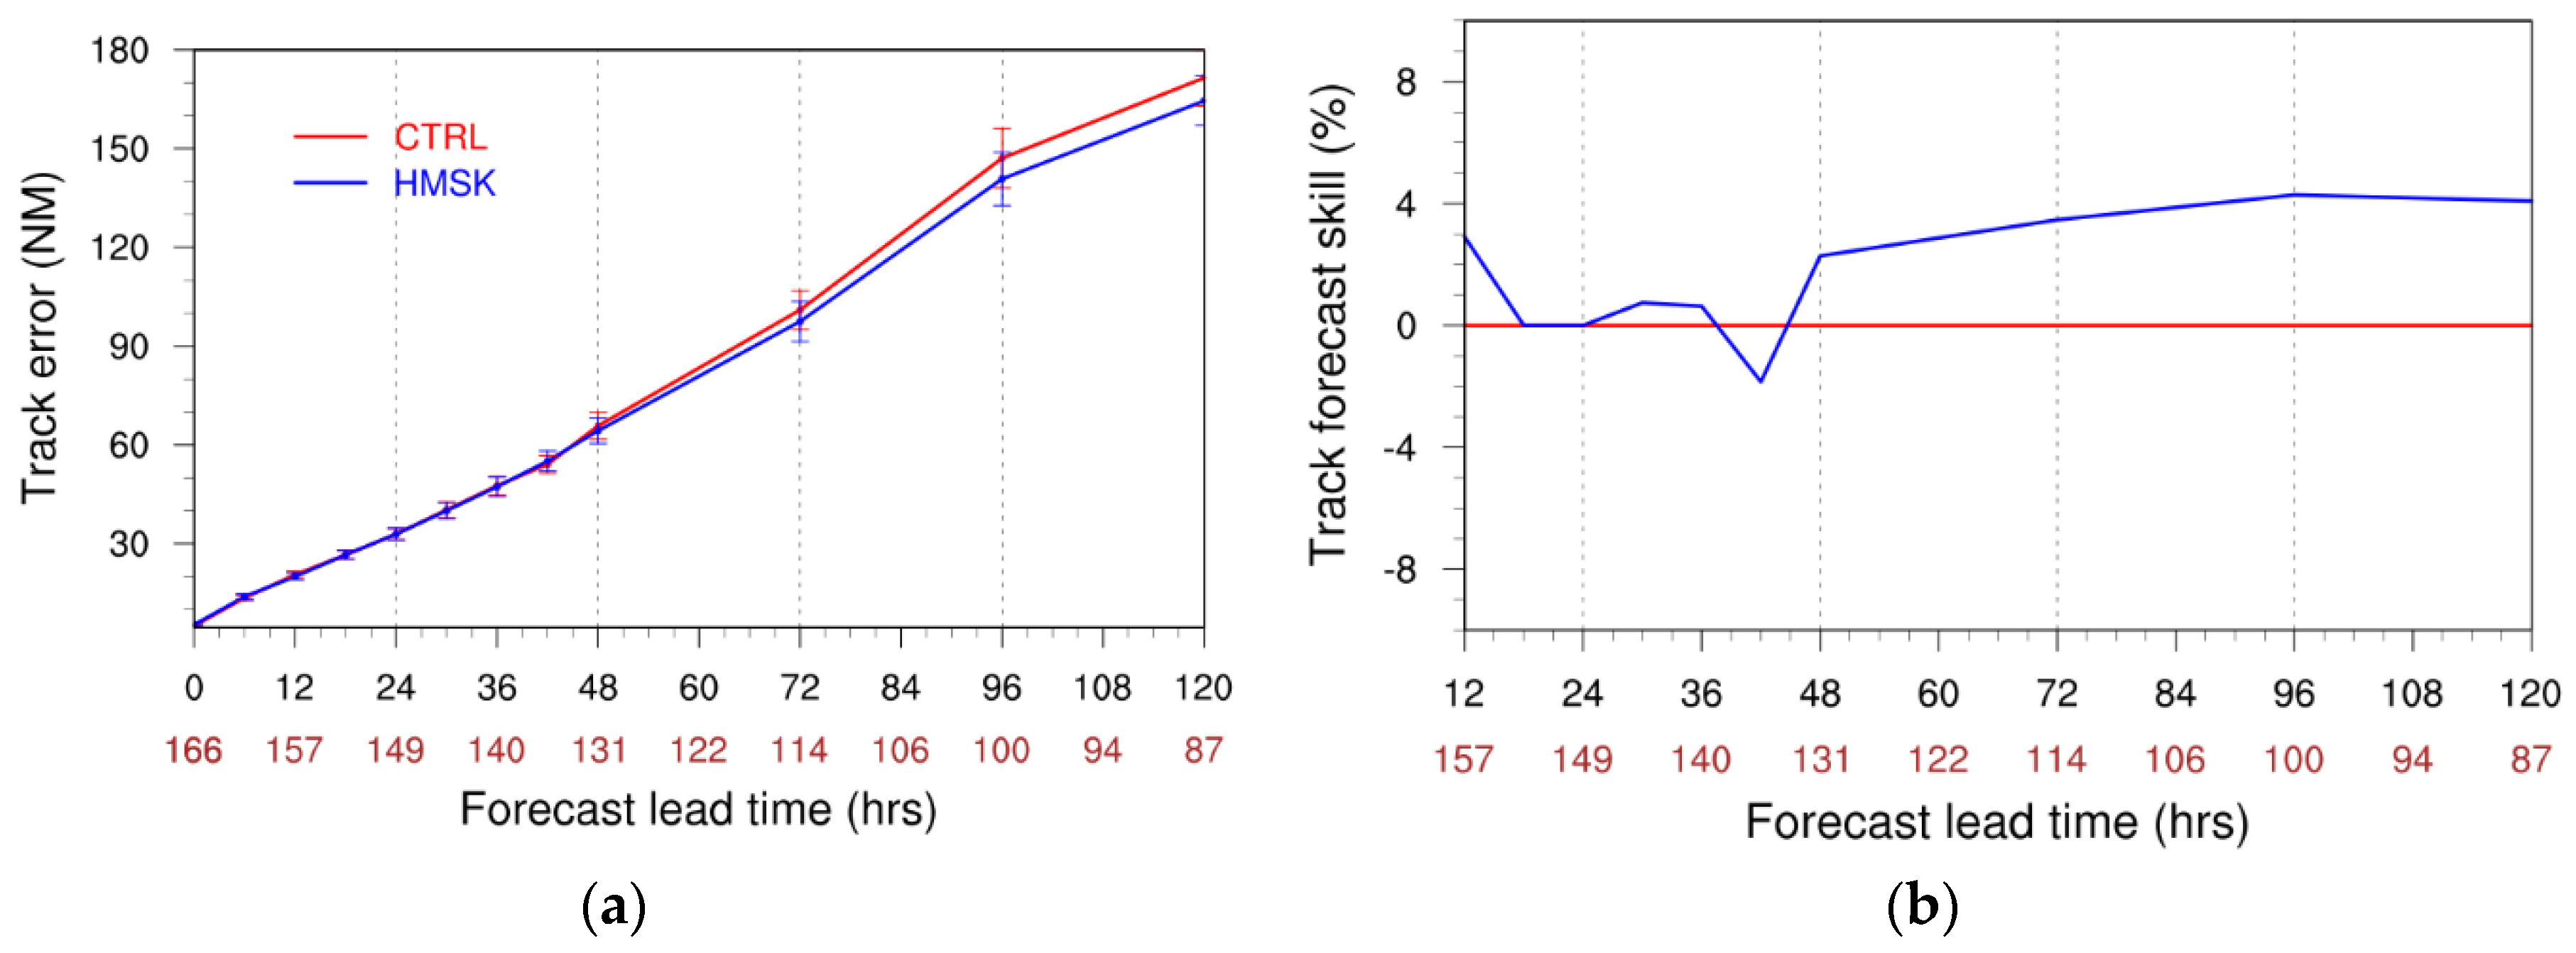
Table 1). When comparing model performance between the two experiments (CTRL and HMSK), all forecast cycles (except the early invest cycles, when the storm’s initial intensity is weaker than 35 kt or the late forecast cycles when the storm has already transitioned into an extra-tropical cyclone) were included as verifiable forecast cycles against the best track data. Therefore, there are 166 verification forecast cycles available from all of the selected storms in this study. The average track forecast error of HMSK, with the high-resolution land–sea mask, is close to or lower than the CTRL experiment for almost all of the lead times throughout 120 h. In the first 48 h, the HMSK experiment has a relatively neutral impact on the track forecast, but the track forecast error of HMSK is substantially smaller than CTRL from 48 to 120 h. The 95% confidence intervals, which represent statistically significant pattern correlations, were calculated to quantify the uncertainty in the average track forecast error and are shown in
Figure 8a for each lead time. This analysis is also used for intensity and storm size forecast verifications in the following discussion.
An improvement of approximately 5% is shown in
Figure 8b for the hurricane track forecast error skill score, which was calculated from the 12-h forecast, by comparing the track forecast error of HMSK to CTRL, using Equation (1). Note that the skill score commonly used in hurricane forecast verification is useful for evaluating predictions of hurricane track, intensity, and other parameters.
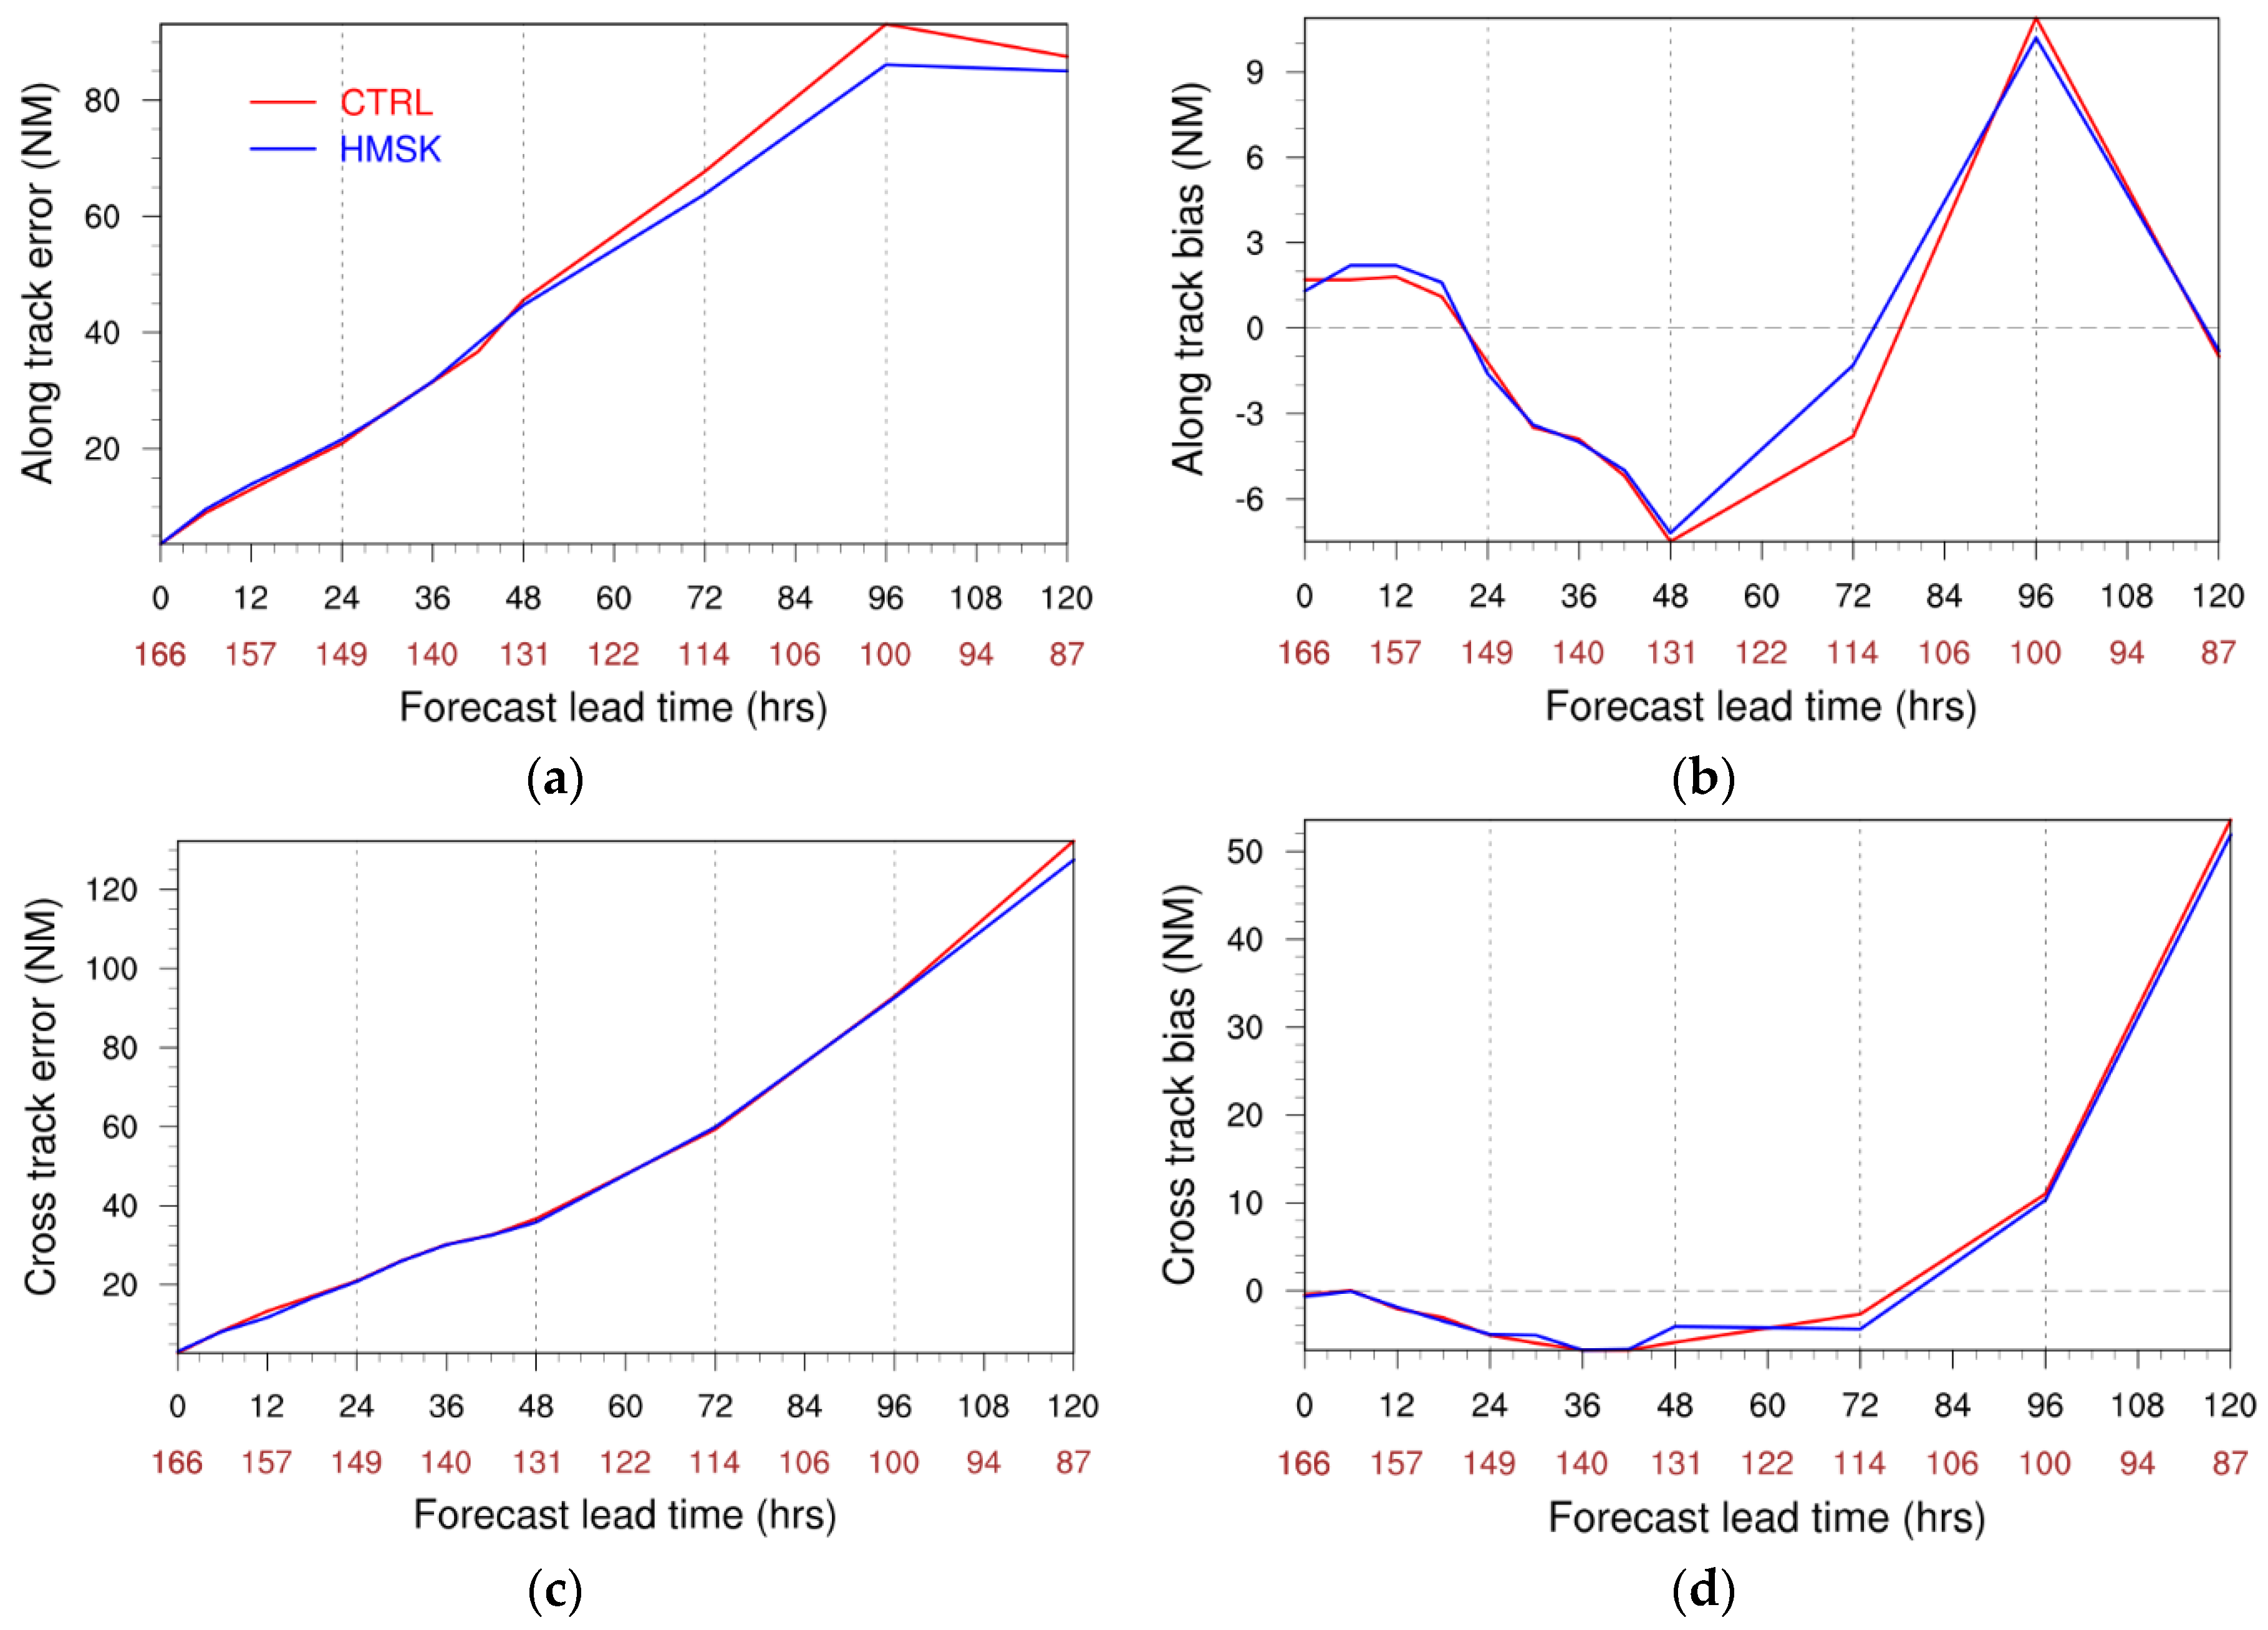
Hurricane cross- and along-track errors were also investigated, as shown in
Figure 9a,c. Total track forecast errors may be decomposed into two components along and perpendicular to its direction. The errors in terms of the cross-track forecast error (C) and the along-track forecast error (A) may be defined as follows:
where E represents hurricane total track error. The cross-track forecast error (
Figure 9c) from two experiments are similar, but the along-track forecast error from HMSK is much smaller than that of CTRL, in
Figure 9a.
The along- and cross-track biases shown in
Figure 9b,d were further examined for hurricane track forecasts, as well. The along-track forecast bias is a component of the total-track forecast bias and can be used as a measure of whether the forecast is fast or slow. Along-track biases from two experiments have a similar pattern: negative between the 24 and 72 h forecast period, suggesting slower moving speeds along the best track direction, and positive after the 72-h forecast, suggesting faster moving speeds along the best track direction. However, the results show the along-track forecast from the HMSK is closer to the best track than that of CTRL, especially after 48 h. The cross-track forecast bias is another component of the total-track forecast bias and can be used as a measure of how far the forecast is to the left or right of the verifying position.
Figure 9d shows that HMSK, with the high-resolution land–sea mask, is close to the best track moving direction, especially in the forecast period between 48 and 96 h.
Based on the above track forecast performance comparison for all four landfalling storms, it is evident the HMSK experiment produced better track forecasts for nearly all forecast lead times, in which a major part of the improvement is reflected in smaller along-track errors. The HMSK experiment, with more realistic high-resolution land–sea masks, is a better representation of the land-use type and surface-layer processes, which may have led to better steering flows and smaller translation speed biases for both the along-track and cross-track biases (
Figure 9b,d).
4.2.2. Intensity Forecast Verification
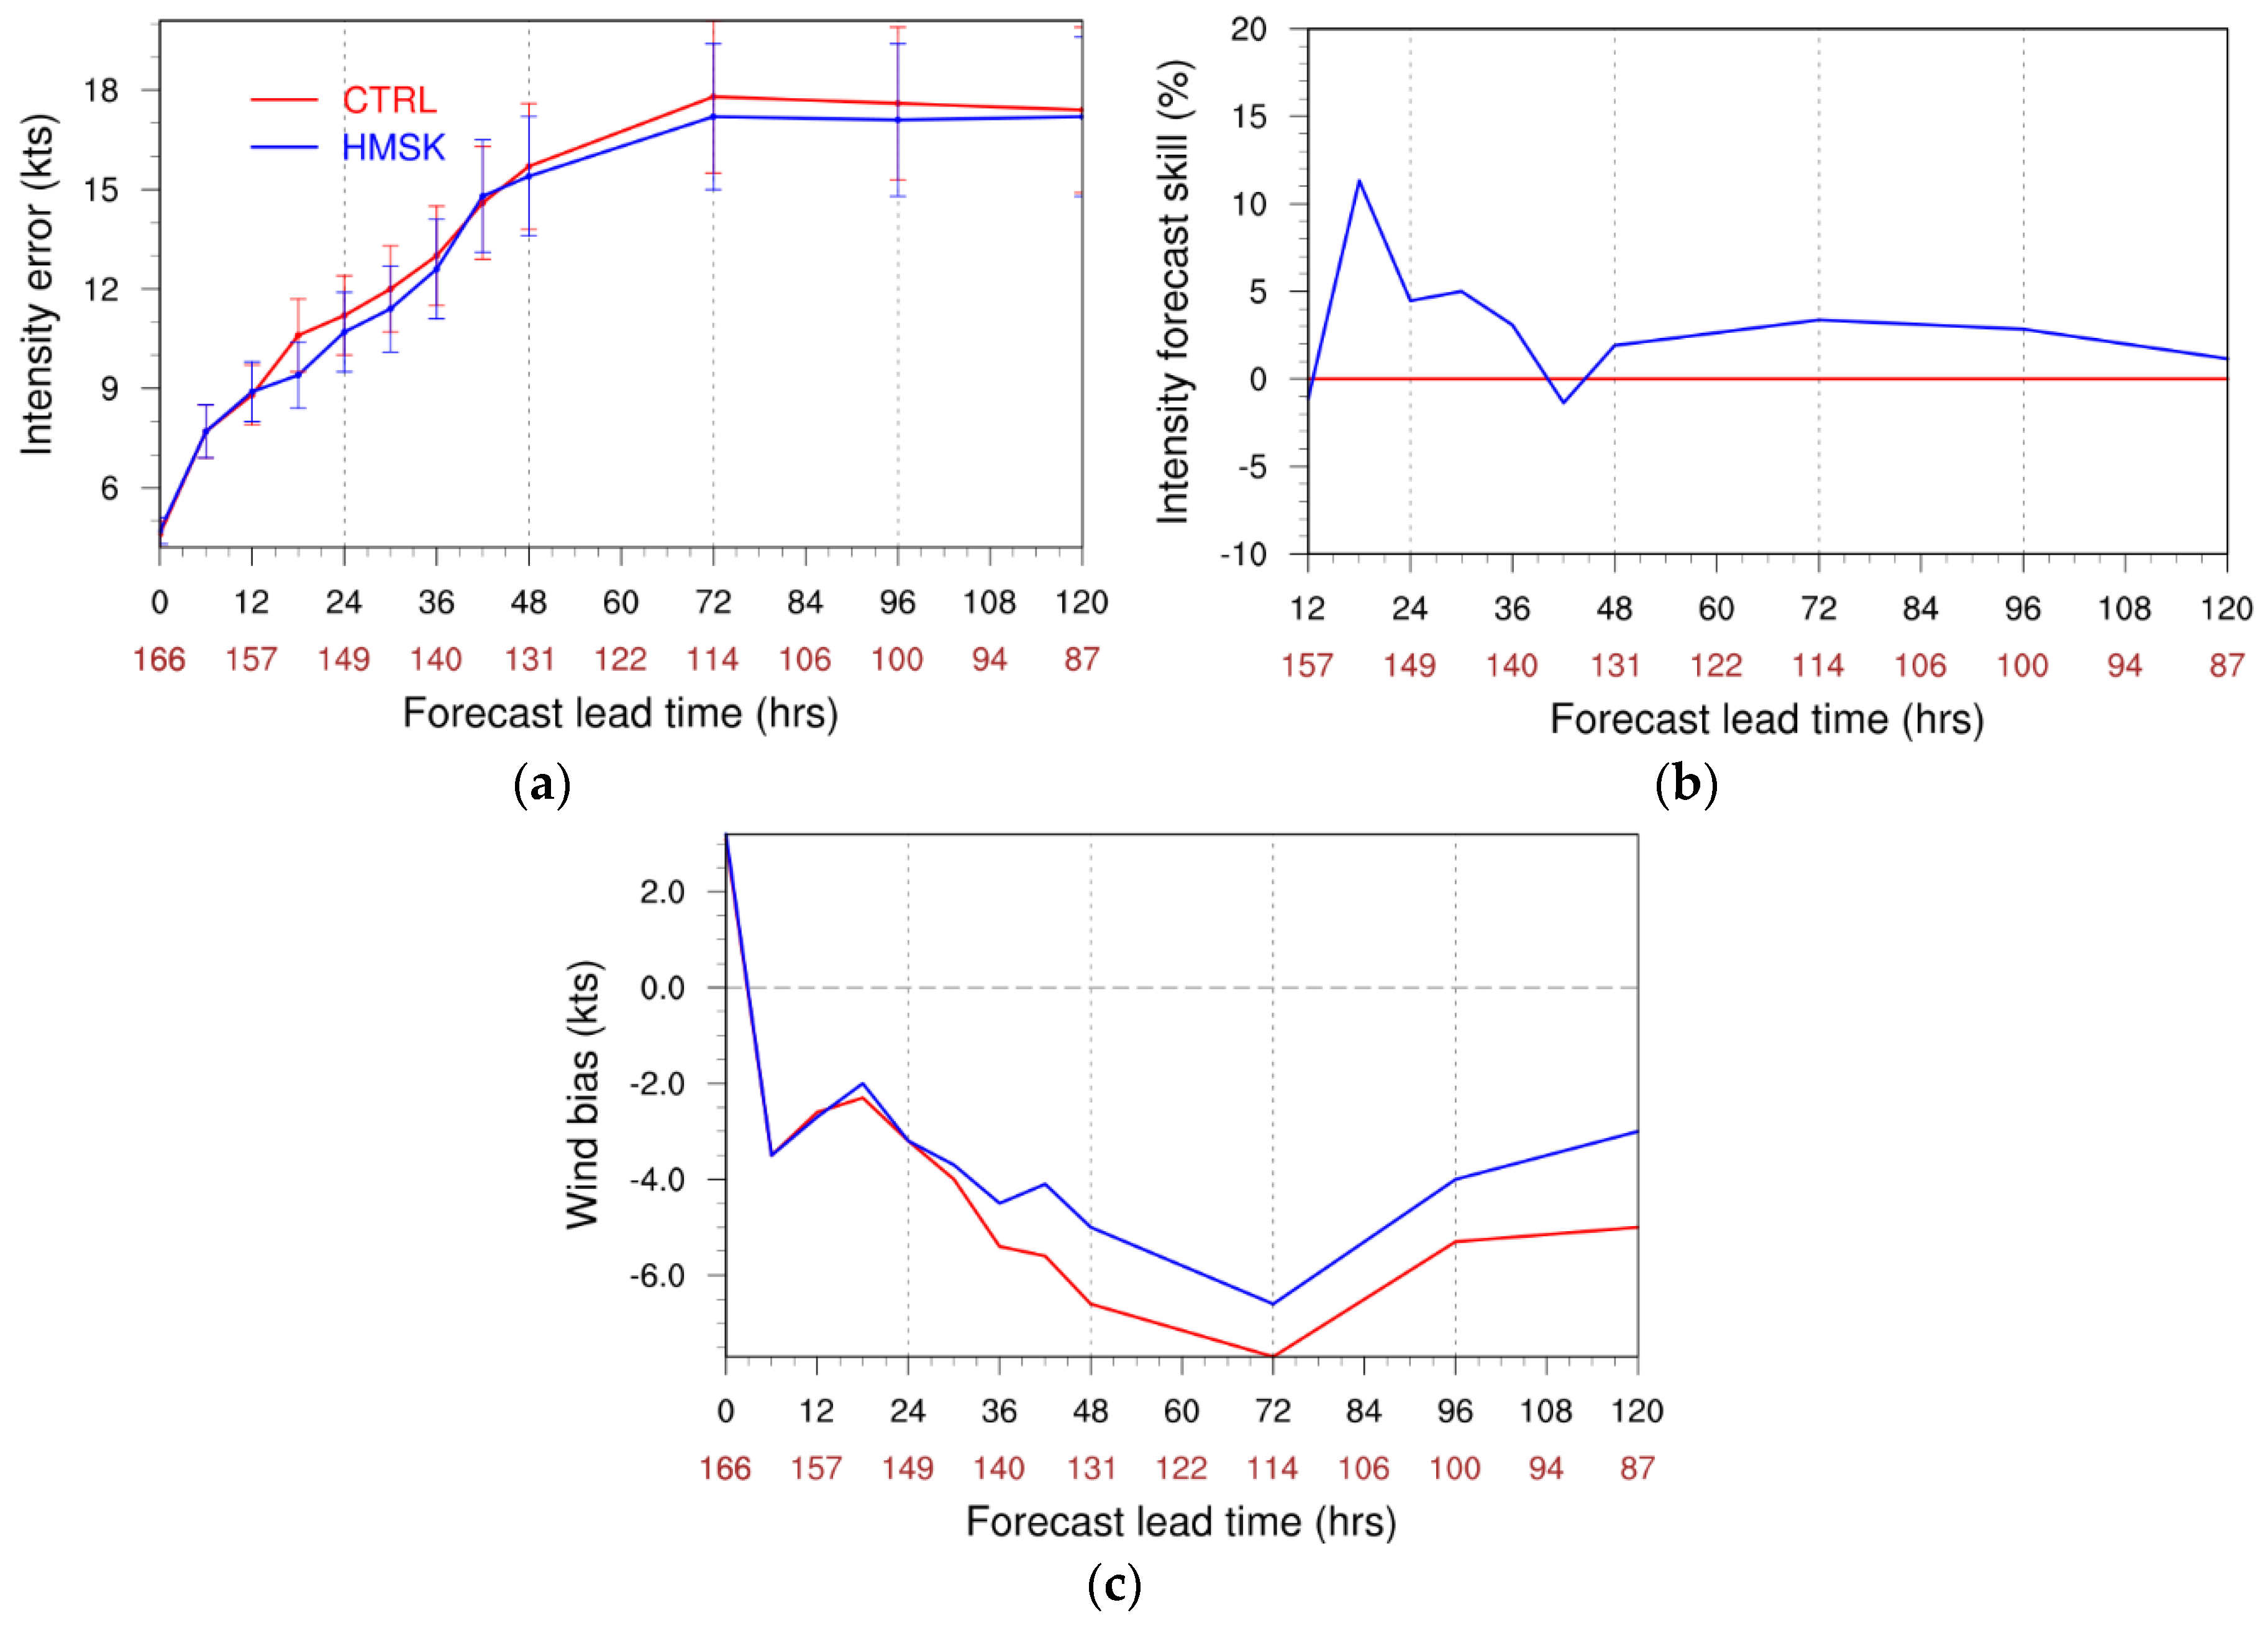
The intensity, in terms of 10 m maximum wind, which defines the strength and destructive capability of a hurricane, is examined and compared in the two experiments with/without the high-resolution land–sea mask in HWRF. The hurricane intensity forecasts were verified against the NHC best-track data, as mentioned earlier.
Figure 10a shows the performance comparison of CTRL and HMSK intensity forecast errors, which are the absolute value of the difference between the forecast and the best-track intensity during the forecast verifying time. The error from HMSK, with the high-resolution land–sea mask, is lower than that of CTRL for nearly the entire forecast period for the four Atlantic landfalling hurricanes that are verified in this study. Overall, the average improvement is approximately 4%, as reflected in the intensity forecast skill comparison in
Figure 10b. Wind bias reflects whether the model predicts a stronger (positive) or weaker (negative) storm.
Figure 10c shows that both the CTRL and HMSK under-predict intensity, with negative wind biases during most forecast hours. However, the bias of HMSK is less than CTRL after 24 h.
4.2.3. Storm-Size Forecast Verification
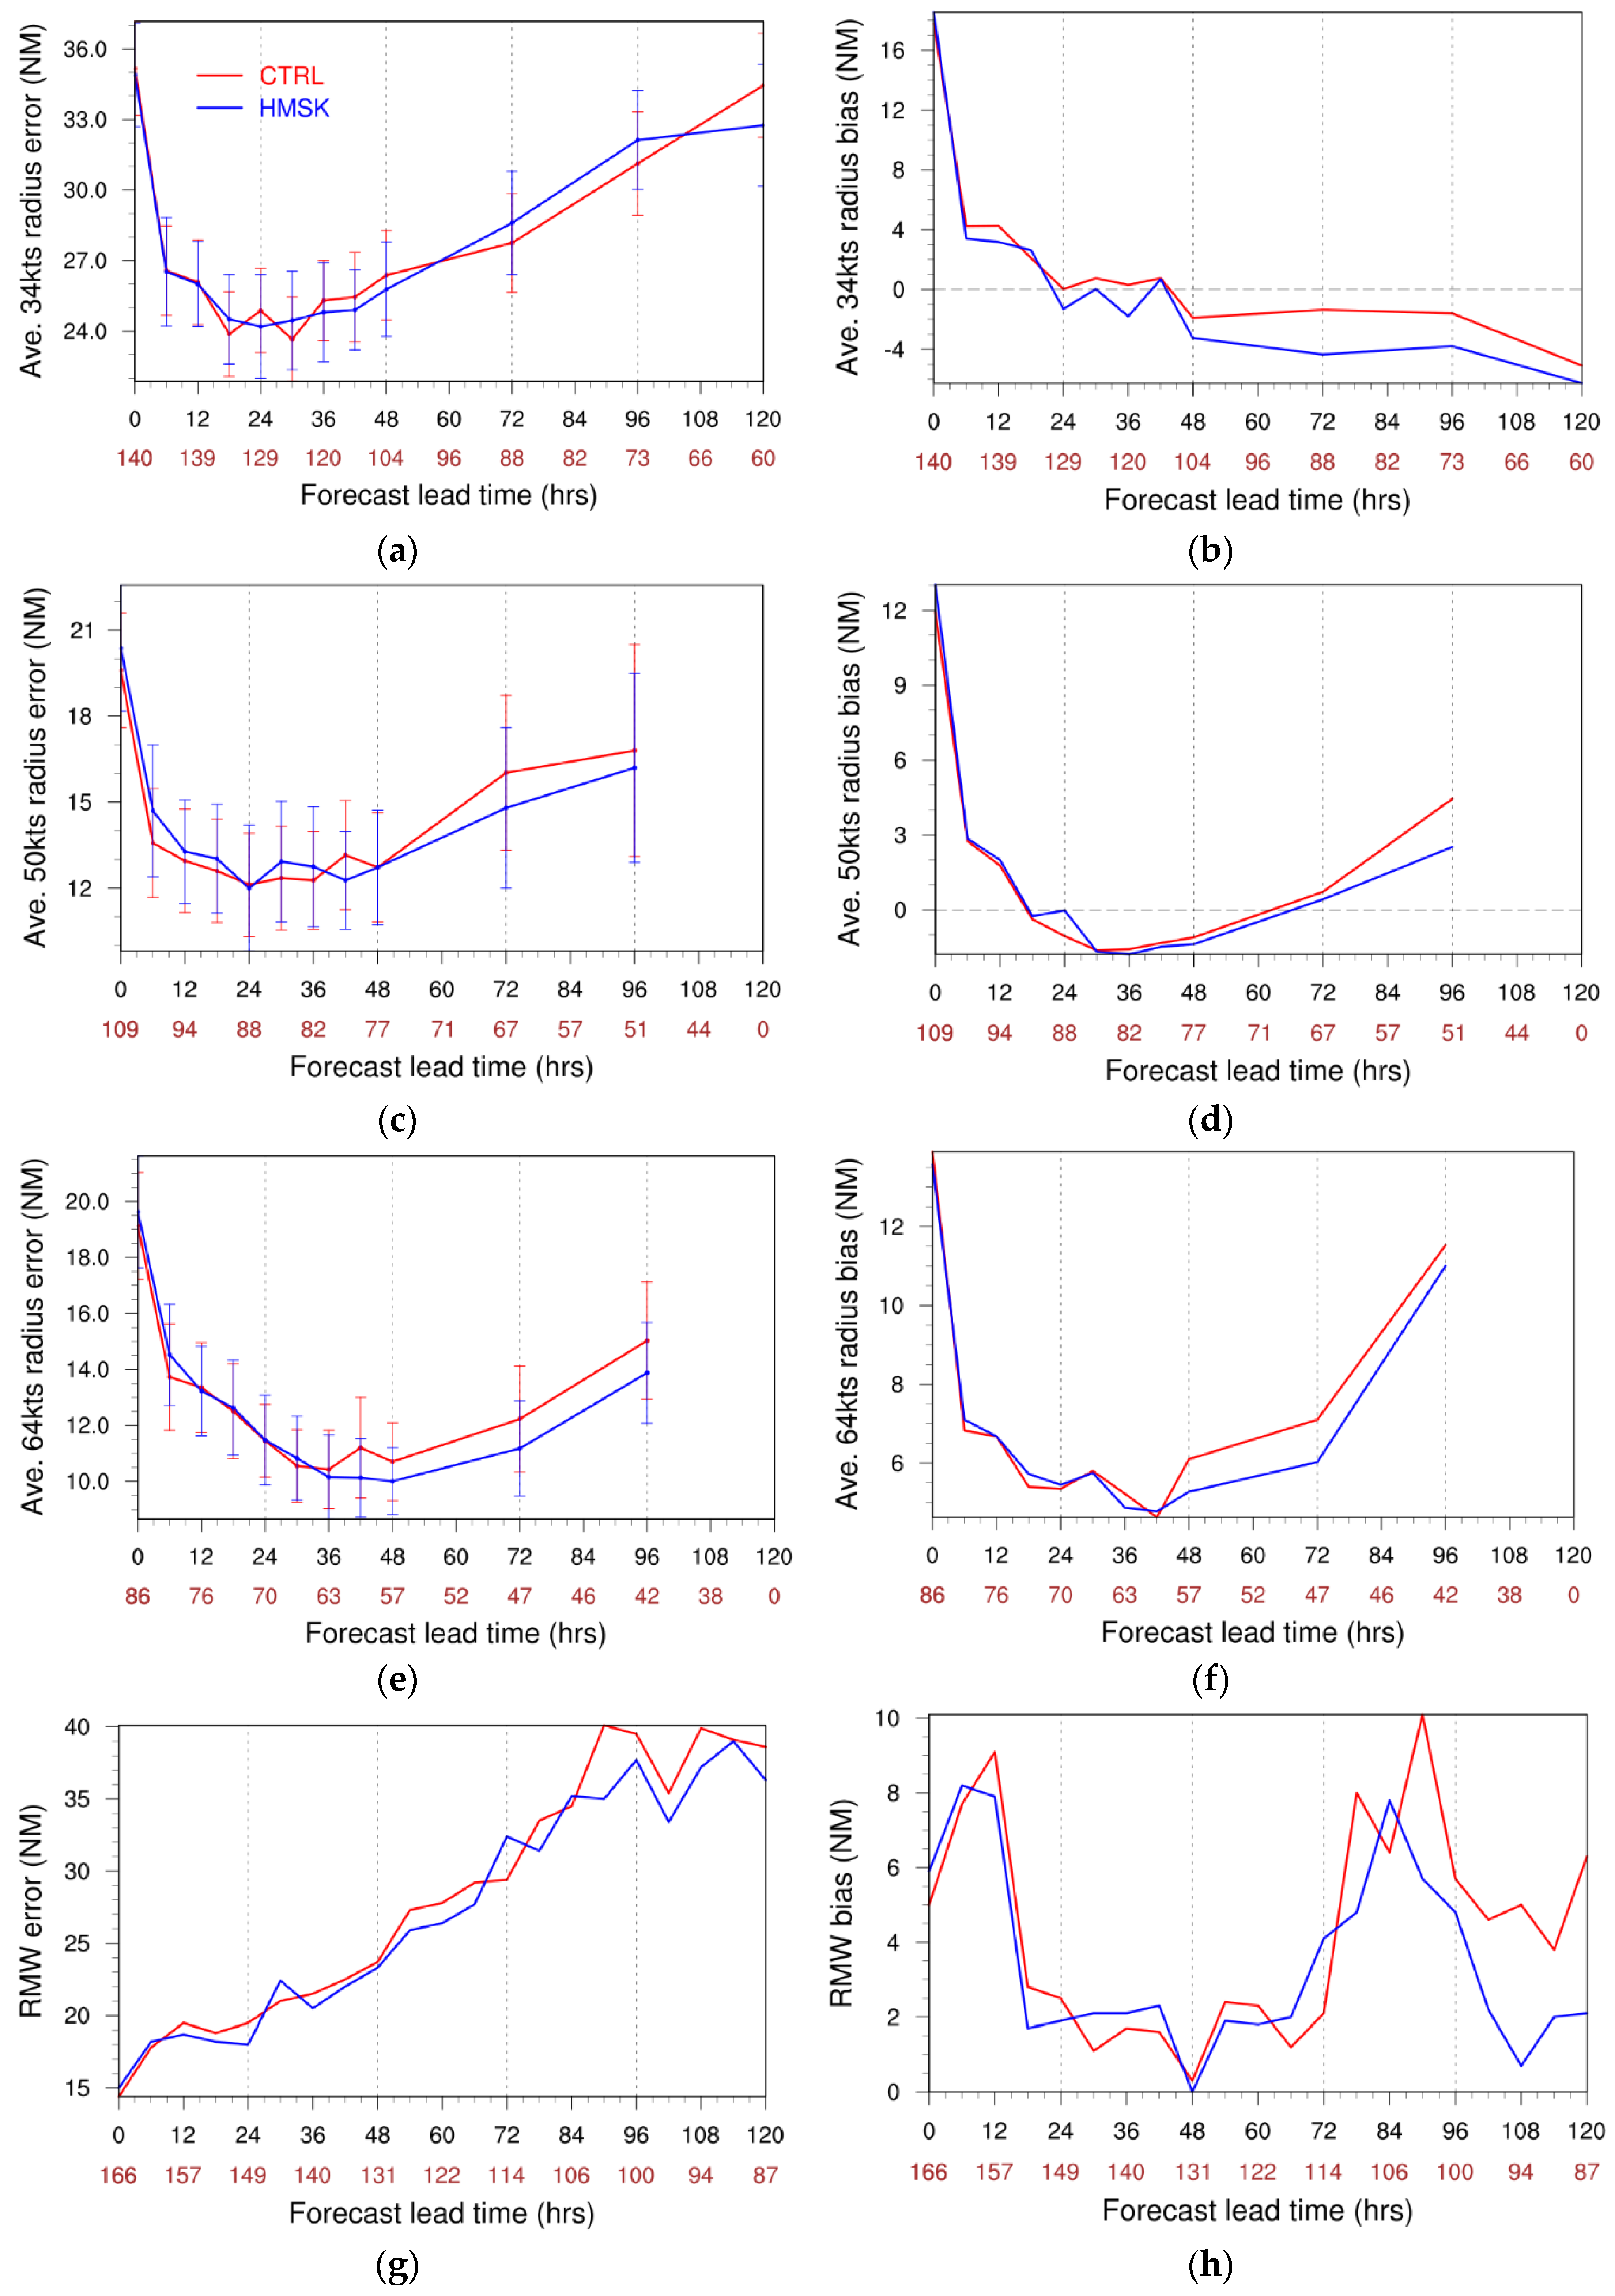
Figure 11a–h shows the verification of storm size in terms of wind radii at 34, 50, and 64 kt thresholds in different quadrants, as well as for the radius of maximum wind (RMW). Here, the 34 kt wind radii errors in each quadrant are defined as the radius in which the mean tangential wind is equal to 34 kt (and similarly for 50 and 64 kt). The mean radii are obtained by taking an average of the radii in four different quadrants [
22,
23]. Except for the 34 kt wind radii errors in
Figure 11a, improvements with the high-resolution land–sea mask in HMSK are shown in the forecast error comparison after 48 h forecast times, particularly for the 50 and 64 kt wind radii errors (
Figure 11c,e). Some neutral-to-positive improvements, especially for forecast lead times after 84 h, may also be seen in the RMW forecast errors and biases (
Figure 11g,h).
The reduction of strong wind radii errors indicates that HMSK, with the high-resolution land–sea mask, is able to more realistically capture the inner-core region of storms. This is expected, as storm structure and fine-scale processes are believed to be better resolved with a higher resolution land–sea mask in the moving nested domains. More specifically, the better represented air–sea–land–water interactions and surface-layer processes (including the surface friction effects), with more realistic land-use categories consistent with the domain’s own resolution, should result in more realistic surface wind distributions and thus improved wind radii forecasts. It should also be noted that, for the 34 kt wind radii, the HMSK experiment shows overall neutral results without noticeable improvements. One possible reason for this may be the domain size of the innermost nest (~5.9° × ~5.9°) is not large enough, and the 34 kt wind radii of a storm can sometimes be close to the D03 domain boundaries or even extend outside of the innermost domain. Thus, the benefits from using the highest land–sea masks in the innermost domain will have less or no impact for those situations.
5. Summary and Conclusions
In this study, high-resolution land–sea masks were successfully introduced into the moving nested domains in the HWRF system to meet the requirement of the COASTAL Act of 2012. The land–sea mask issue in HWRF was addressed upon review of the 10 m wind analysis and forecast in coastal regions and along islands during hurricane landfall. Non-realistic wind information along the coastline was produced by the HWRF system due to the coarse resolution of the land–sea mask in the innermost domain (d03), which was designed by model developers with the same coarse resolution as the parent domain to avoid dealing with different definitions of land/sea points for moving nests.
The resolutions of the land–sea mask and other atmospheric variables that are likely to be influenced by the use of the high-resolution land–sea mask dataset, such as 10 m wind, skin temperature, and accumulated precipitation along coastlines, were investigated carefully after the implementation of the high-resolution land–sea masks with a case study of hurricane Irma in 2017. The high-resolution (1.5 km) spatial distribution of atmospheric fields related to the land–sea masks may be represented more accurately along coastlines in the innermost domain (d03). To further understand why the high-resolution land–sea mask produced more skillful wind forecasts than the operational system, a detailed 10 m wind forecast was evaluated by using NOAA NDBC observations in the Hurricane Irma case study. Comparisons of simulated wind information with NDBC observations show that the forecasts from HMSK captured strong maximum wind speeds more accurately along coastlines.
Two sets (CTRL and HMSK) of HWRF analyses and forecasts for several destructive North Atlantic hurricanes (Harvey and Irma in 2017; Florence and Michael in 2018) were selected to validate the COASTAL Act NSEM, with the same configuration except for the high-resolution land–sea masks. The results show the higher-resolution land–sea masks in the moving nested domains improve HWRF model performance in terms of track and intensity forecasts for a majority of forecast lead times in this set of destructive North Atlantic hurricanes. The most significant improvement in the forecasts with the high-resolution land–sea masks is the reduction of intensity errors compared with operational FY18 HWRF system forecasts.
In addition to highlighting the introduction of the high-resolution land–sea masks, which lead to an improvement of hurricane track and intensity forecasts, this study shows this approach may be beneficial to the quality of the wind forecasts along the coastlines during hurricane landfall. In the future, additional hurricane cases will be examined. This high-resolution land–sea mask technique will be transitioned to the next operational HWRF system implementation, along with the other updates.
Author Contributions
Conceptualization, Z.M., B.L., and A.M.; methodology, Z.M. and B.L.; software, B.L. and Z.M.; validation, Z.M., A.A., L.Z., and K.W.; formal analysis, A.A., A.v.d.W., S.M., and Z.Z.; investigation, Z.M.; resources, Z.M., B.L., and A.A.; writing—original draft preparation, Z.M.; writing—review and editing, B.L., A.A., S.V., R.S., and A.K.; supervision, A.M. and V.T.; project administration and funding acquisition, N.K. All authors have read and agreed to the published version of the manuscript.
Funding
This work was supported by The Consumer Option for an Alternative System to Allocate Losses (COASTAL) Act Program and Water Initiative project within the National Oceanic and Atmospheric Administration (NOAA).
Acknowledgments
This work has been supported by the COASTAL Act program within NOAA. The authors thank Weiguo Wang and Jili Dong at NOAA/NCEP/Environmental Modeling Center (EMC) for very detailed and thorough reviews as EMC internal reviewers.
Conflicts of Interest
The authors declare no conflict of interest.
References
- Gray, W.M. Global View of the Origin of Tropical Disturbances and Storms. Mon. Weather Rev. 1968, 96, 669–700. [Google Scholar] [CrossRef]
- Smith, E. Atlantic and East Coast Hurricanes 1900–98: A Frequency and Intensity Study for the Twenty-First Century. Bull. Amer. Meteor. Soc. 1999, 80, 2717–2720. [Google Scholar] [CrossRef]
- Moghimi, S.; Van Der Westhuysen, A.; Abdolali, A.; Myers, E.; Vinogradov, S.; Ma, Z.; Liu, F.; Mehra, A.; Kurkowski, N. Development of an ESMF Based Flexible Coupling Application of ADCIRC and WAVEWATCH III for High Fidelity Coastal Inundation Studies. J. Mar. Sci. Eng. 2020, 8, 308. [Google Scholar] [CrossRef]
- Tallapragada, V.; Kieu, C.; Trahan, S.; Zhang, Z.; Liu, Q.; Wang, W.; Tong, M.; Zhang, B.; Strahl, B. Forecasting Tropical Cyclones in the Western North Pacific Basin Using the NCEP Operational HWRF: Real-Time Implementation in 2012. Weather Forecast. 2015, 30, 1355–1373. [Google Scholar] [CrossRef]
- Tallapragada, V.; Kieu, C.; Kwon, Y.; Trahan, S.; Liu, Q.; Zhang, Z.; Kwon, I.-H. Evaluation of Storm Structure from the Operational HWRF during 2012 Implementation. Mon. Weather Rev. 2014, 142, 4308–4325. [Google Scholar] [CrossRef]
- Bakhtyar, R.; Maitaria, K.; Velissariou, P.; Trimble, B.; Mashriqui, H.; Moghimi, S.; Abdolali, A.; Van der Westhuysen, A.J.; Ma, Z.; Clark, E.P.; et al. A new 1D/2D Coupled Modeling Approach for a Riverine-Estuarine System under Storm Events: Application to Delaware River Basin. J. Geophys. Res. Oceans 2020, 125, e2019JC015822. [Google Scholar] [CrossRef]
- The WAVEWATCH III® Development Group (WW3DG): User Manual and System Documentation of WAVEWATCH III®. Version 6.07 Tech. Note 333. NOAA/NWS/NCEP/MMAB. Available online: https://github.com/NOAA-EMC/WW3/wiki/files/manual.pdf (accessed on 8 June 2020).
- Abdolali, A.; Roland, A.; Van Der Westhuysen, A.; Meixner, J.; Chawla, A.; Hesser, T.J.; Smith, J.M.; Sikiric, M.D. Large-scale hurricane modeling using domain decomposition parallelization and implicit scheme implemented in WAVEWATCH III wave model. Coast. Eng. 2020, 157, 103656. [Google Scholar] [CrossRef]
- Gopalakrishnan, S.G.; Marks, F., Jr.; Zhang, J.A.; Zhang, X.; Bao, J.-W.; Tallapragada, V. A Study of the Impacts of Vertical Diffusion on the Structure and Intensity of the Tropical Cyclones Using the High-Resolution HWRF System. J. Atmos. Sci. 2013, 70, 524–541. [Google Scholar] [CrossRef]
- Alaka, G.J.; Zhang, X.; Gopalakrishnan, S.G.; Goldenberg, S.B.; Marks, F., Jr. Performance of Basin-Scale HWRF Tropical Cyclone Track Forecasts. Weather Forecast. 2017, 32, 1253–1271. [Google Scholar] [CrossRef]
- Biswas, M.K.; Abarca, S.; Bernardet, L.; Ginis, I.; Grell, E.; Iacono, M.; Kalina, E.; Liu, B.; Liu, Q.; Marchok, T.; et al. Hurricane Weather Research and Forecasting (HWRF) Model: 2018 Scientific Documentation. 2018. Available online: https://dtcenter.org/HurrWRF/users/docs/index.php (accessed on 8 June 2020).
- Zhang, X.; Gopalakrishnan, S.G.; Trahan, S.; Quirino, T.S.; Liu, Q.; Zhang, Z.; Alaka, G.; Tallapragada, V. Representing Multiple Scales in the Hurricane Weather Research and Forecasting Modeling System: Design of Multiple Sets of Movable Multilevel Nesting and the Basin-Scale HWRF Forecast Application. Weather Forecast. 2016, 31, 2019–2034. [Google Scholar] [CrossRef]
- Chen, F.; Dudhia, J. Coupling an advanced land surface–hydrology model with the Penn State–NCAR MM5 modeling system. Part I: Model description and implementation. Mon. Weather Rev. 2001, 129, 569–585. [Google Scholar] [CrossRef]
- Iacono, M.J.; Delamere, J.S.; Mlawer, E.J.; Shephard, M.W.; Clough, S.A.; Collins, W.D. Radiative forcing by long-lived greenhouse gases: Calculations with the AER radiative transfer models. J. Geophys. Res. Space Phys. 2008, 113, 13103. [Google Scholar] [CrossRef]
- Wang, W.; Sippel, J.A.; Abarca, S.; Zhu, L.; Liu, B.; Zhang, Z.; Mehra, A.; Tallapragada, V. Improving NCEP HWRF Simulations of Surface Wind and Inflow Angle in the Eyewall Area. Weather Forecast. 2018, 33, 887–898. [Google Scholar] [CrossRef]
- Grell, G.A. Prognostic evaluation of assumptions used by cumulus parameterizations. Mon. Weather Rev. 1993, 121, 764–787. [Google Scholar] [CrossRef]
- Tong, M.; Sippel, J.A.; Tallapragada, V.; Liu, E.; Kieu, C.Q.; Kwon, I.-H.; Wang, W.; Liu, Q.; Ling, Y.; Zhang, B. Impact of Assimilating Aircraft Reconnaissance Observations on Tropical Cyclone Initialization and Prediction Using Operational HWRF and GSI Ensemble–Variational Hybrid Data Assimilation. Mon. Weather Rev. 2018, 146, 4155–4177. [Google Scholar] [CrossRef]
- Gilhousen, D.B. A Field Evaluation of NDBC Moored Buoy Winds. J. Atmospheric Ocean. Technol. 1987, 4, 94–104. [Google Scholar] [CrossRef]
- Rappaport, E.N.; Franklin, J.L.; Avila, L.A.; Baig, S.R.; Beven, J.L.; Blake, E.S.; Burr, C.A.; Jiing, J.-G.; Juckins, C.A.; Knabb, R.D.; et al. Advances and Challenges at the National Hurricane Center. Weather Forecast. 2009, 24, 395–419. [Google Scholar] [CrossRef]
- Liu, W.T.; Katsaros, K.B.; Businger, J.A. Bulk Parameterization of Air-Sea Exchanges of Heat and Water Vapor Including the Molecular Constraints at the Interface. J. Atmos. Sci. 1979, 36, 1722–1735. [Google Scholar] [CrossRef]
- Miller, R.J.; Schrader, A.J.; Sampson, C.R.; Tsui, T.L. The Automated Tropical Cyclone Forecasting System (ATCF). Weather Forecast. 1990, 5, 653–660. [Google Scholar] [CrossRef]
- Bender, M.A.; Marchok, T.P.; Sampson, C.R.; Knaff, J.A.; Morin, M.J. Impact of Storm Size on Prediction of Storm Track and Intensity Using the 2016 Operational GDL Hurricane Model. Weather Forecast. 2017, 32, 1491–1508. [Google Scholar] [CrossRef]
- Sampson, C.R.; Fukada, E.M.; Knaff, J.A.; Strahl, B.R.; Brennan, M.; Marchok, T. Tropical Cyclone Gale Wind Radii Estimates for the Western North Pacific. Weather Forecast. 2017, 32, 1029–1040. [Google Scholar] [CrossRef]
Figure 1.
The design of the Named Storm Event Model (NSEM) framework (pre-decisional). The NSEM includes the ADvanced CIRCulation (ADCIRC; [
6]) model as the hydrodynamic component, the WAVEWATCH III (WW3; [
7,
8]) as the wave model, the Hurricane Weather Research Forecast (HWRF) model as the atmospheric component, and, in the future, the National Water Model (NWM) as the inland hydrological component. “Atmospheric Data” indicates that the atmospheric forcing fields are provided by the hurricane simulation with the HWRF model [
3].
Figure 2.
The HWRF model forecast domains are indicated by the 13.5 km parent domain (d01, blue region) and two nested vortex-following domains (d02 and d03, 4.5 and 1.5 km, and purple solid boxes), while the HWRF data assimilation domains are depicted by the ghost domains (ghost-d02 and ghost-d03, black dashed lines). The unified Atlantic Message Passing Interface Princeton Ocean Model for Tropical Cyclone (MPIPOM-TC) domain is denoted by the red box.
Figure 3.
The National Hurricane Center (NHC) best tracks for the four Atlantic hurricanes used in this study.
Figure 3.
The National Hurricane Center (NHC) best tracks for the four Atlantic hurricanes used in this study.
Figure 4.
The distribution of the land–sea masks for the innermost domain (d03) covering the state of Florida is shown in the Hurricane Irma (2017) case study before/after introducing the high-resolution land–sea mask into HWRF. The date for this simulation cycle is at 0000 UTC 11 September 2017. (a) The land–sea mask’s resolution in d03 is the same as the parent domain (d01, 13.5 km) in the FY18 HWRF. (b) The land–sea mask’s resolution in d03 is 1.5 km after applying the high-resolution land–sea mask method. The land–sea mask is dimensionless (0 = water; 1 = land).
Figure 5.
A comparison of 10 m U and V components of wind speed with/without the high-resolution land–sea masks within the innermost domain (d03) for Hurricane Irma (2017) at 0000 UTC, September 11, 2017. (a,c) U10 and V10 with the coarse resolution (13.5 km) of land–sea masks in the FY18 HWRF; (b,d) U10 and V10 with the high resolution (1.5 km) of land–sea masks.
Figure 6.
National Data Buoy Center (NDBC) observations near Hurricane Irma’s landfall, used for HWRF validation, are indicated by black dots. Magenta depicts Hurricane Irma’s best track.
Figure 6.
National Data Buoy Center (NDBC) observations near Hurricane Irma’s landfall, used for HWRF validation, are indicated by black dots. Magenta depicts Hurricane Irma’s best track.
Figure 7.
Performance comparison of 10 m winds relative to NDBC buoy measurements (shown in
Figure 6) during Hurricane Irma landfall in Florida. (
a) The absolute error, (
b) root-mean-square error (RMSE), and (
c) model skill as a function of the forecast lead time between control run and high-resolution land–sea mask.
Figure 8.
Performance comparison of track forecasts between CTRL (the first experiment, red) and HMSK (the second experiment, blue) from the four selected Atlantic hurricanes in 2017–2018. The number of cases for each lead time is provided at the bottom of each column. (a) Verification of track forecast errors from experiments with/without high-resolution land–sea mask. Absolute average error (lines) and standard deviation (vertical bars) are a function of forecast time and number of cases. The error bar represents the 95% confidence interval. (b) Track improvements (vs. CTRL) are shown for hurricane forecasts from HMSK.
Figure 9.
Performance comparison of along- and cross-track forecasts between CTRL (red) and HMSK (blue) from four selected Atlantic hurricanes in 2017–2018. (a) Along-track forecast error, (b) along-track bias; (c) cross-track forecast error, and (d) cross-track bias.
Figure 9.
Performance comparison of along- and cross-track forecasts between CTRL (red) and HMSK (blue) from four selected Atlantic hurricanes in 2017–2018. (a) Along-track forecast error, (b) along-track bias; (c) cross-track forecast error, and (d) cross-track bias.
Figure 10.
Performance comparison of intensity forecasts between CTRL (red) and HMSK (blue) from four selected Atlantic hurricanes in 2017–2018. (a) Intensity forecast error, (b) intensity forecast skill relative to CTRL, and (c) intensity forecast bias.
Figure 10.
Performance comparison of intensity forecasts between CTRL (red) and HMSK (blue) from four selected Atlantic hurricanes in 2017–2018. (a) Intensity forecast error, (b) intensity forecast skill relative to CTRL, and (c) intensity forecast bias.
Figure 11.
Storm size statistics between CTRL (red) and HMSK (blue) from four selected Atlantic hurricanes in 2017–2018. (a) 34 kt, (c), 50 kt (e), and 64 kt wind radii errors; (b) 34 kt, (d), 50 kt, and (f) 64 kt wind radii biases. (g) Radius of maximum wind (RMW) error and (h) bias. The error bar represents 95% confidence interval.
Table 1.
Summary of the selected hurricane cases in this study. More detailed information is available in the National Oceanic and Atmospheric Administration (NOAA) NHC’s Tropical Cyclone Reports. Intensity categories for hurricanes are listed according to the Saffir–Simpson scale. Cat indicates category. The kt indicates knot, which is a unit of speed equal to one nautical mile per hour (approximately 1.15 mph or 1.85 km/h).
| Storm Name | Period | Peak Intensity | Lowest Pressure | Highest Wind | Landfalling in US | Number of Verifiable Forecasts |
|---|
| Harvey |
17 August–01 September 2017
| Cat 4 | 937 hPa | 115 kt | Texas and Louisiana | 40 |
| Irma |
30 August–12 September 2017
| Cat 5 | 914 hPa | 155 kt | Florida | 40 |
| Florence |
31 August–September 17 2018
| Cat 4 | 950 hPa | 115 kt | Carolinas | 66 |
| Michael |
October 07–October 12 2018
| Cat 5 | 920 hPa | 135 kt | Florida | 20 |
© 2020 by the authors. Licensee MDPI, Basel, Switzerland. This article is an open access article distributed under the terms and conditions of the Creative Commons Attribution (CC BY) license (http://creativecommons.org/licenses/by/4.0/).


 ,
, 


