Article

An Asian Summer Monsoon-Related Relative Humidity Record from Tree-Ring δ18O in Gansu Province, North China

1
State Key Laboratory of Loess and Quaternary Geology, Institute of Earth Environment, Chinese Academy of Sciences, Xi’an 710061, China
2
University of Chinese Academy of Sciences, Beijing 100049, China
3
Center for Excellence in Quaternary Science and Global Change, Chinese Academy of Sciences, Xi’an 710061, China
4
Qingdao National Laboratory for Marine Science and Technology, Qingdao 266237, China
5
School of Human Settlements and Civil Engineering, Xi’an Jiaotong University, Xi’an 710049, China
*
Author to whom correspondence should be addressed.
Atmosphere 2020, 11(9), 984; https://doi.org/10.3390/atmos11090984
Submission received: 17 July 2020 / Revised: 11 September 2020 / Accepted: 12 September 2020 / Published: 15 September 2020
(This article belongs to the Special Issue Climate and the Oxygen Isotope Patterns from Trees)

Abstract

:
The monsoon fringe region in North China (NC) is also an ecologically fragile zone. Improving our comprehension of the paleoclimate variations and their driving mechanisms in this region has great significance for environmental protection and agricultural economic development. In order to provide more reliable data for future climate forecasting and reduce the effects of climatic disasters in NC, we established a 328-year stable oxygen isotope (δ18O) chronology based on four Pinus tabulaeformis Carr. from Mt. Hasi, Gansu Province, and found that the tree-ring δ18O inherited the signals of summer (July–August) monsoonal precipitation δ18O (δ18OP). Correlation function analysis indicated that the tree-ring δ18O series responded significantly to the observed local relative humidity from July to August (RHJA) with r = −0.65 (n = 55, p < 0.001). Based on the clear physiological mechanism, we reconstructed the RHJA variations from 1685 to 2012 using a transfer function. Our reconstruction was very stable and had strong spatial representativeness, it was significantly positively correlated with Asian summer monsoon (ASM) indices, indicating that our reconstruction reflected the variations of ASM to a large extent. The RHJA series successfully captured the weakening of the ASM since the 1930s. There was a close connection between the reconstructed sequence and the East Pacific sea surface temperature (SST). Further analyses revealed that El Niño–Southern Oscillation (ENSO) and Pacific Decadal Oscillation (PDO) may play important roles in the summer monsoon precipitation in NC.

1. Introduction

The Asian monsoon system is an active and complex part of the global climate system [1,2,3], influencing the agricultural production and economic development of nearly half the human population. Understanding its variation history, characteristics, and driving mechanisms is of considerable significance in solving various environmental problems in the context of global warming [4], such as frequent occurrence of floods and droughts, glacial ablation, and extreme climatic disasters. The Asian monsoon brings a lot of moisture to eastern and southern Asia in summer. During winter, the direction of air flow changes, leading to heavy rains over Indonesia, north Australia, and the southern Pacific zones. With the continuous progression of research on ASM, modern meteorological observations (most Chinese meteorological records begin in the 1950s) are too short to recognize the historical variations of the ASM [5,6]. Therefore, some new proxy indicators have been put forward, including tree-rings, stalagmites, and lake records [7]. Compared with other suggested proxies, tree-ring has the characteristics of accurate dating, high resolution, and wide distribution [8,9,10,11,12]. Tree-ring width, density, and stable isotopes are effective methods that can be used to study long-term climate changes [13,14]. Nowadays, with the development of analytical technology, tree-ring stable isotopes have become a reliable proxy for reconstructing paleoclimate variations with the advantages of precise physiological mechanisms [14], more reliable climate signals [15,16,17,18,19], and direct usability in climate reconstruction without detrending [20,21,22].
Almost all of China is affected by the Asian monsoon, and rapid changes in monsoon intensity are likely to cause climatic disasters. In particular, the frequent occurrence of extreme weather events in recent years has severely affected people’s living conditions and hindered the development of the social economy. A significant drought occurred in 2013 and 2014, and caused substantial economic losses in 13 provinces [23]. Massive flooding in 2016 led to serious damages in 28 provinces. In the autumn of 2016, an extended drought in Tianshui and Dingxi, Gansu Province, affected 6.28 million people, and 990,000 hectares of crops failed. Therefore, it is apparent that the study of the ASM in China is a pressing topic [7].
To date, several studies of hydroclimate variations in the monsoon fringe region have been carried out. For instance, June–August relative humidity (RH) variations over the past 205 years were reconstructed by tree-ring δ18O in Ordos [7], and the reconstruction significantly correlated with existing ASM indices. April–September RH variations on Mt. Yaoshan were reconstructed [24], which successfully detected the “Ding-Wu Disaster”. The July–August RH reconstruction in the Mt. Shimen region indicated that ENSO influenced the ASM and affected RH variations [25]. Additionally, the above studies captured the fact that NC has continued to be dry, and the ASM seemed to have weakened since the 1930s. Using ring-width records, it was found that this aridification trend can be related to the decreasing precipitation [17,26,27]. Mt. Hasi is located in the monsoon marginal region. It is located in a semi-arid climate zone, and the precipitation is the main limiting factor for tree growth [28]. A previous tree-ring study involved the reconstruction of a Standardized Precipitation Evapotranspiration Index (SPEI) based on ring width over the past 283 years. Tree growth responded positively to SPEI over long time scales, because it was capable of resisting water deficits but lacked a rapid reaction to drought. The10-month scale SPEI was selected to reconstruct hydroclimate variations, and some obvious drought events were captured, such as continuous drought from 1928 to 1930 and the significant aridification trend from the 1950s onwards [28]. However, for such a critical and sensitive area, these few hydroclimate results are not enough to give a deep understanding of regional climatic variations. Our principal objective was to verify whether the ASM has a weakening trend and to compare our results with published data to explore the large-scale oceanic–atmospheric coupling mechanisms affecting NC.

2. Materials and Methods

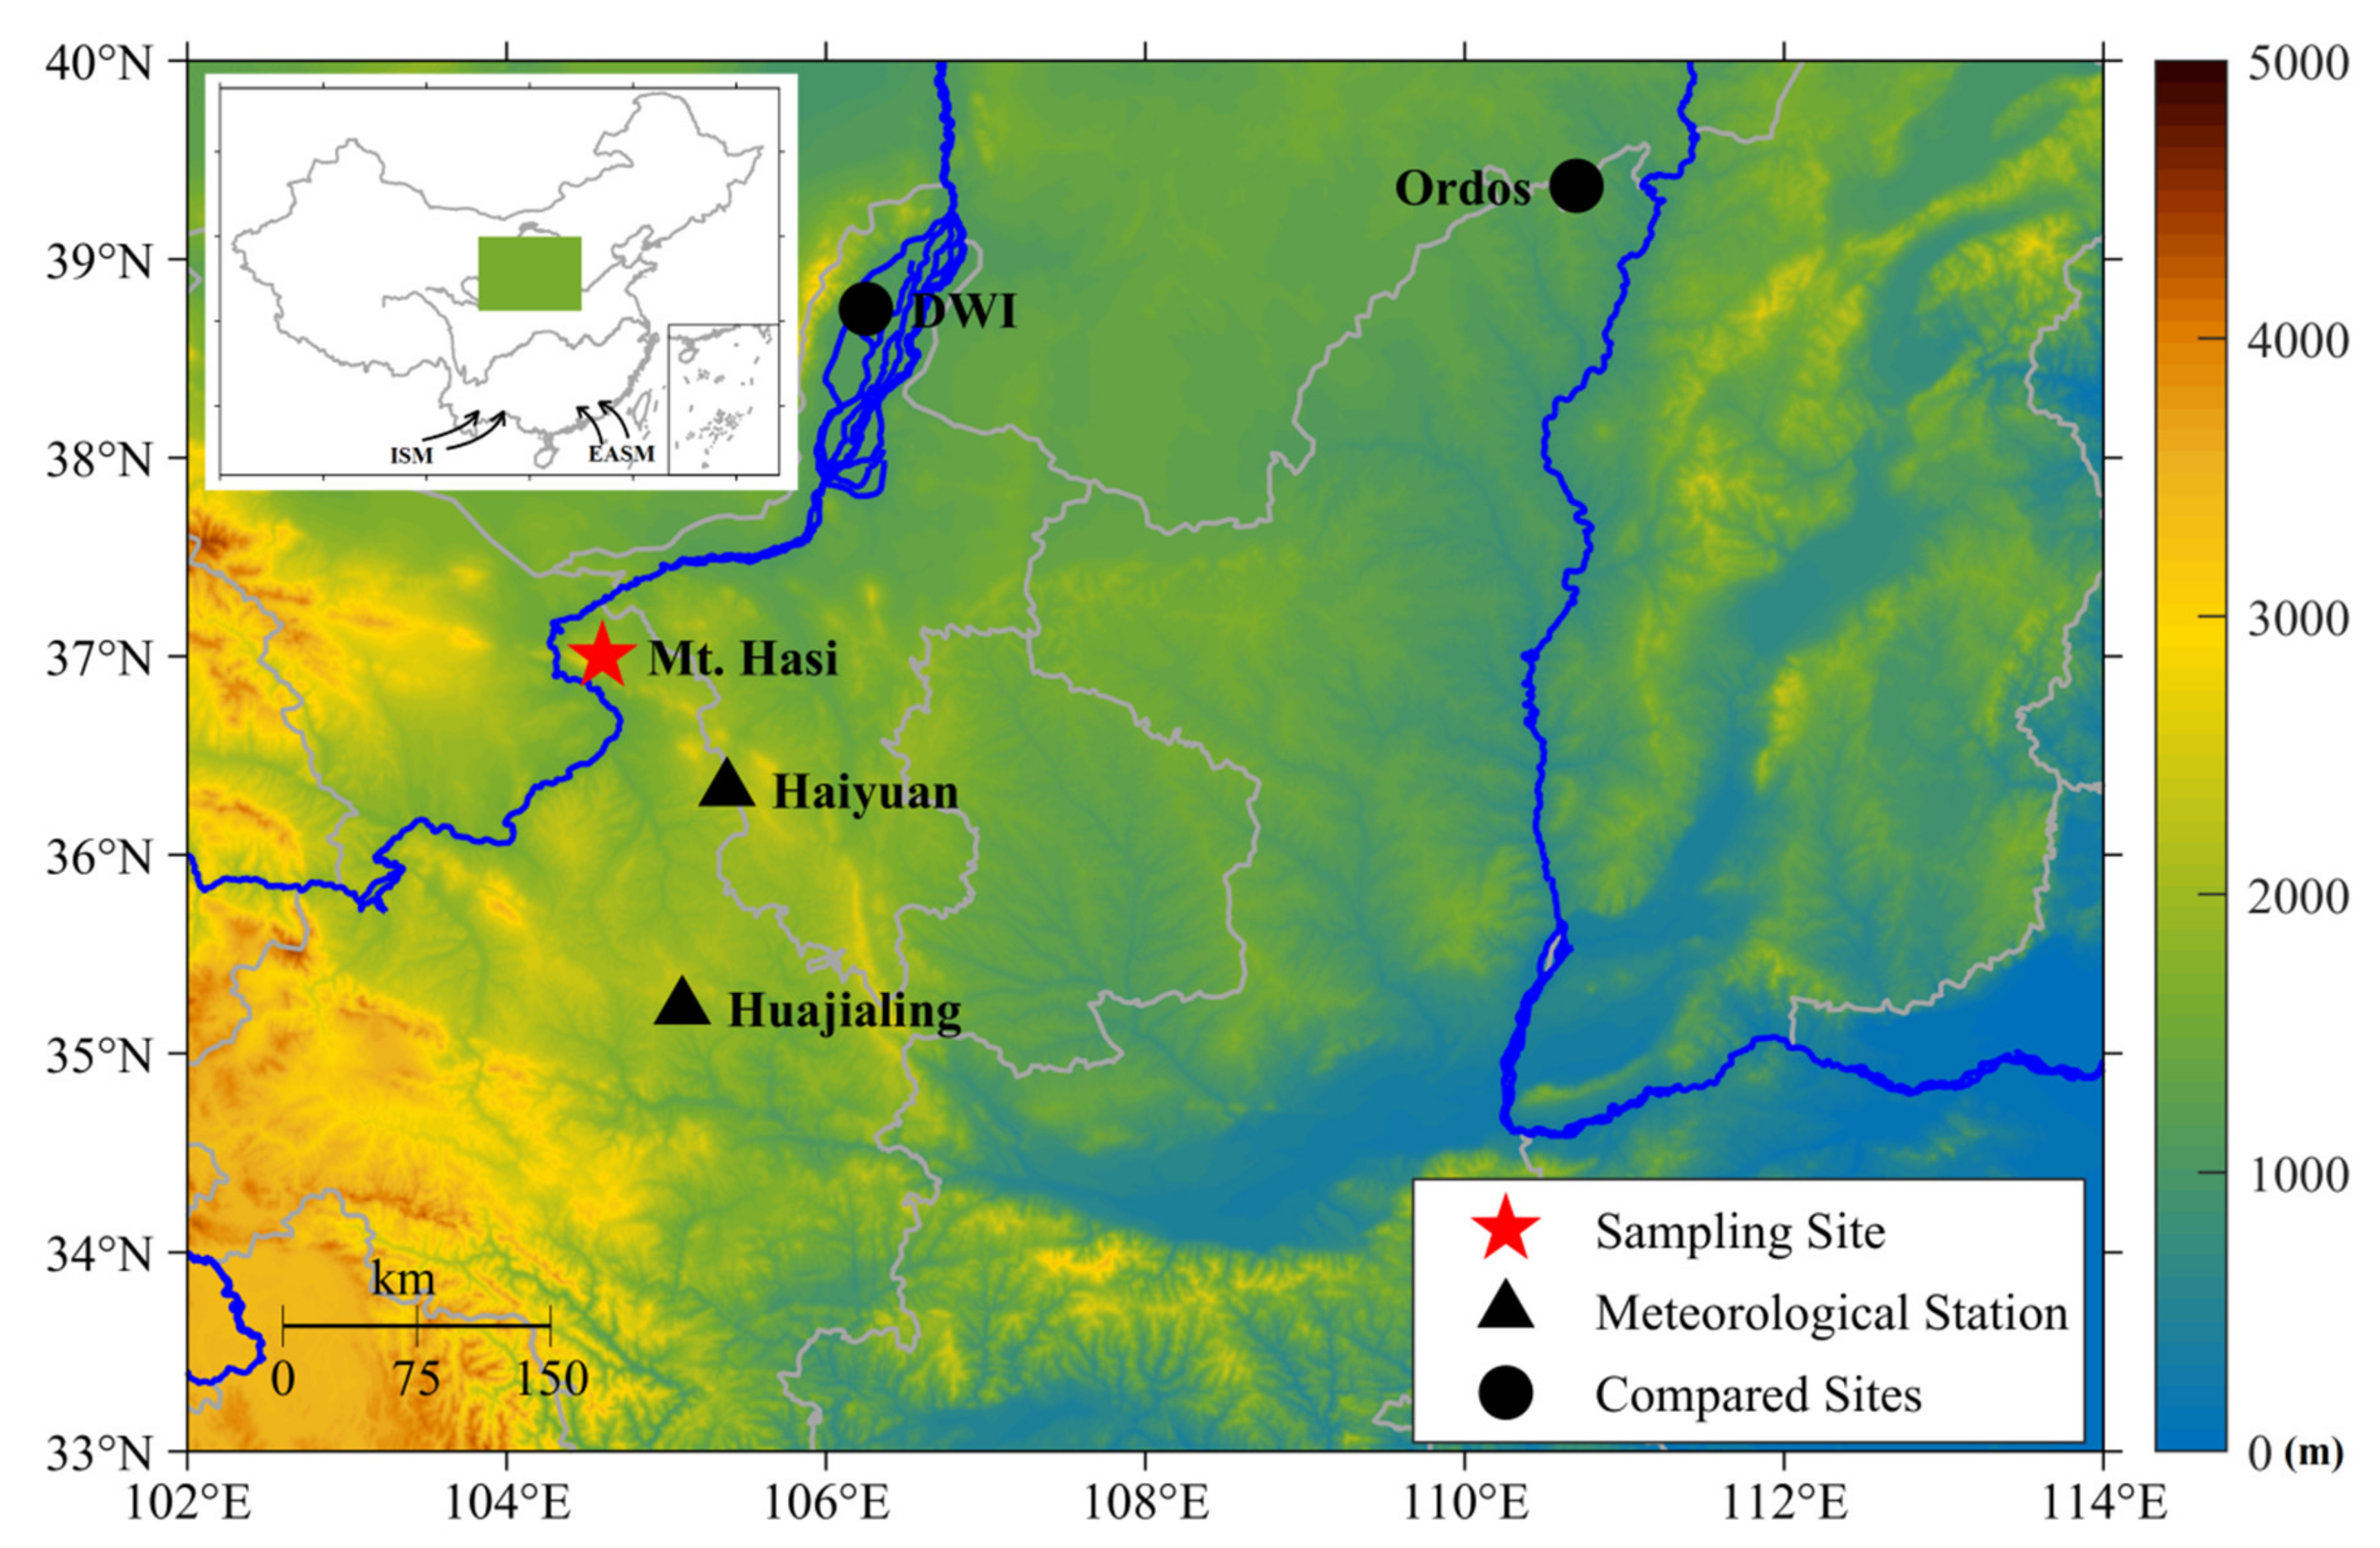
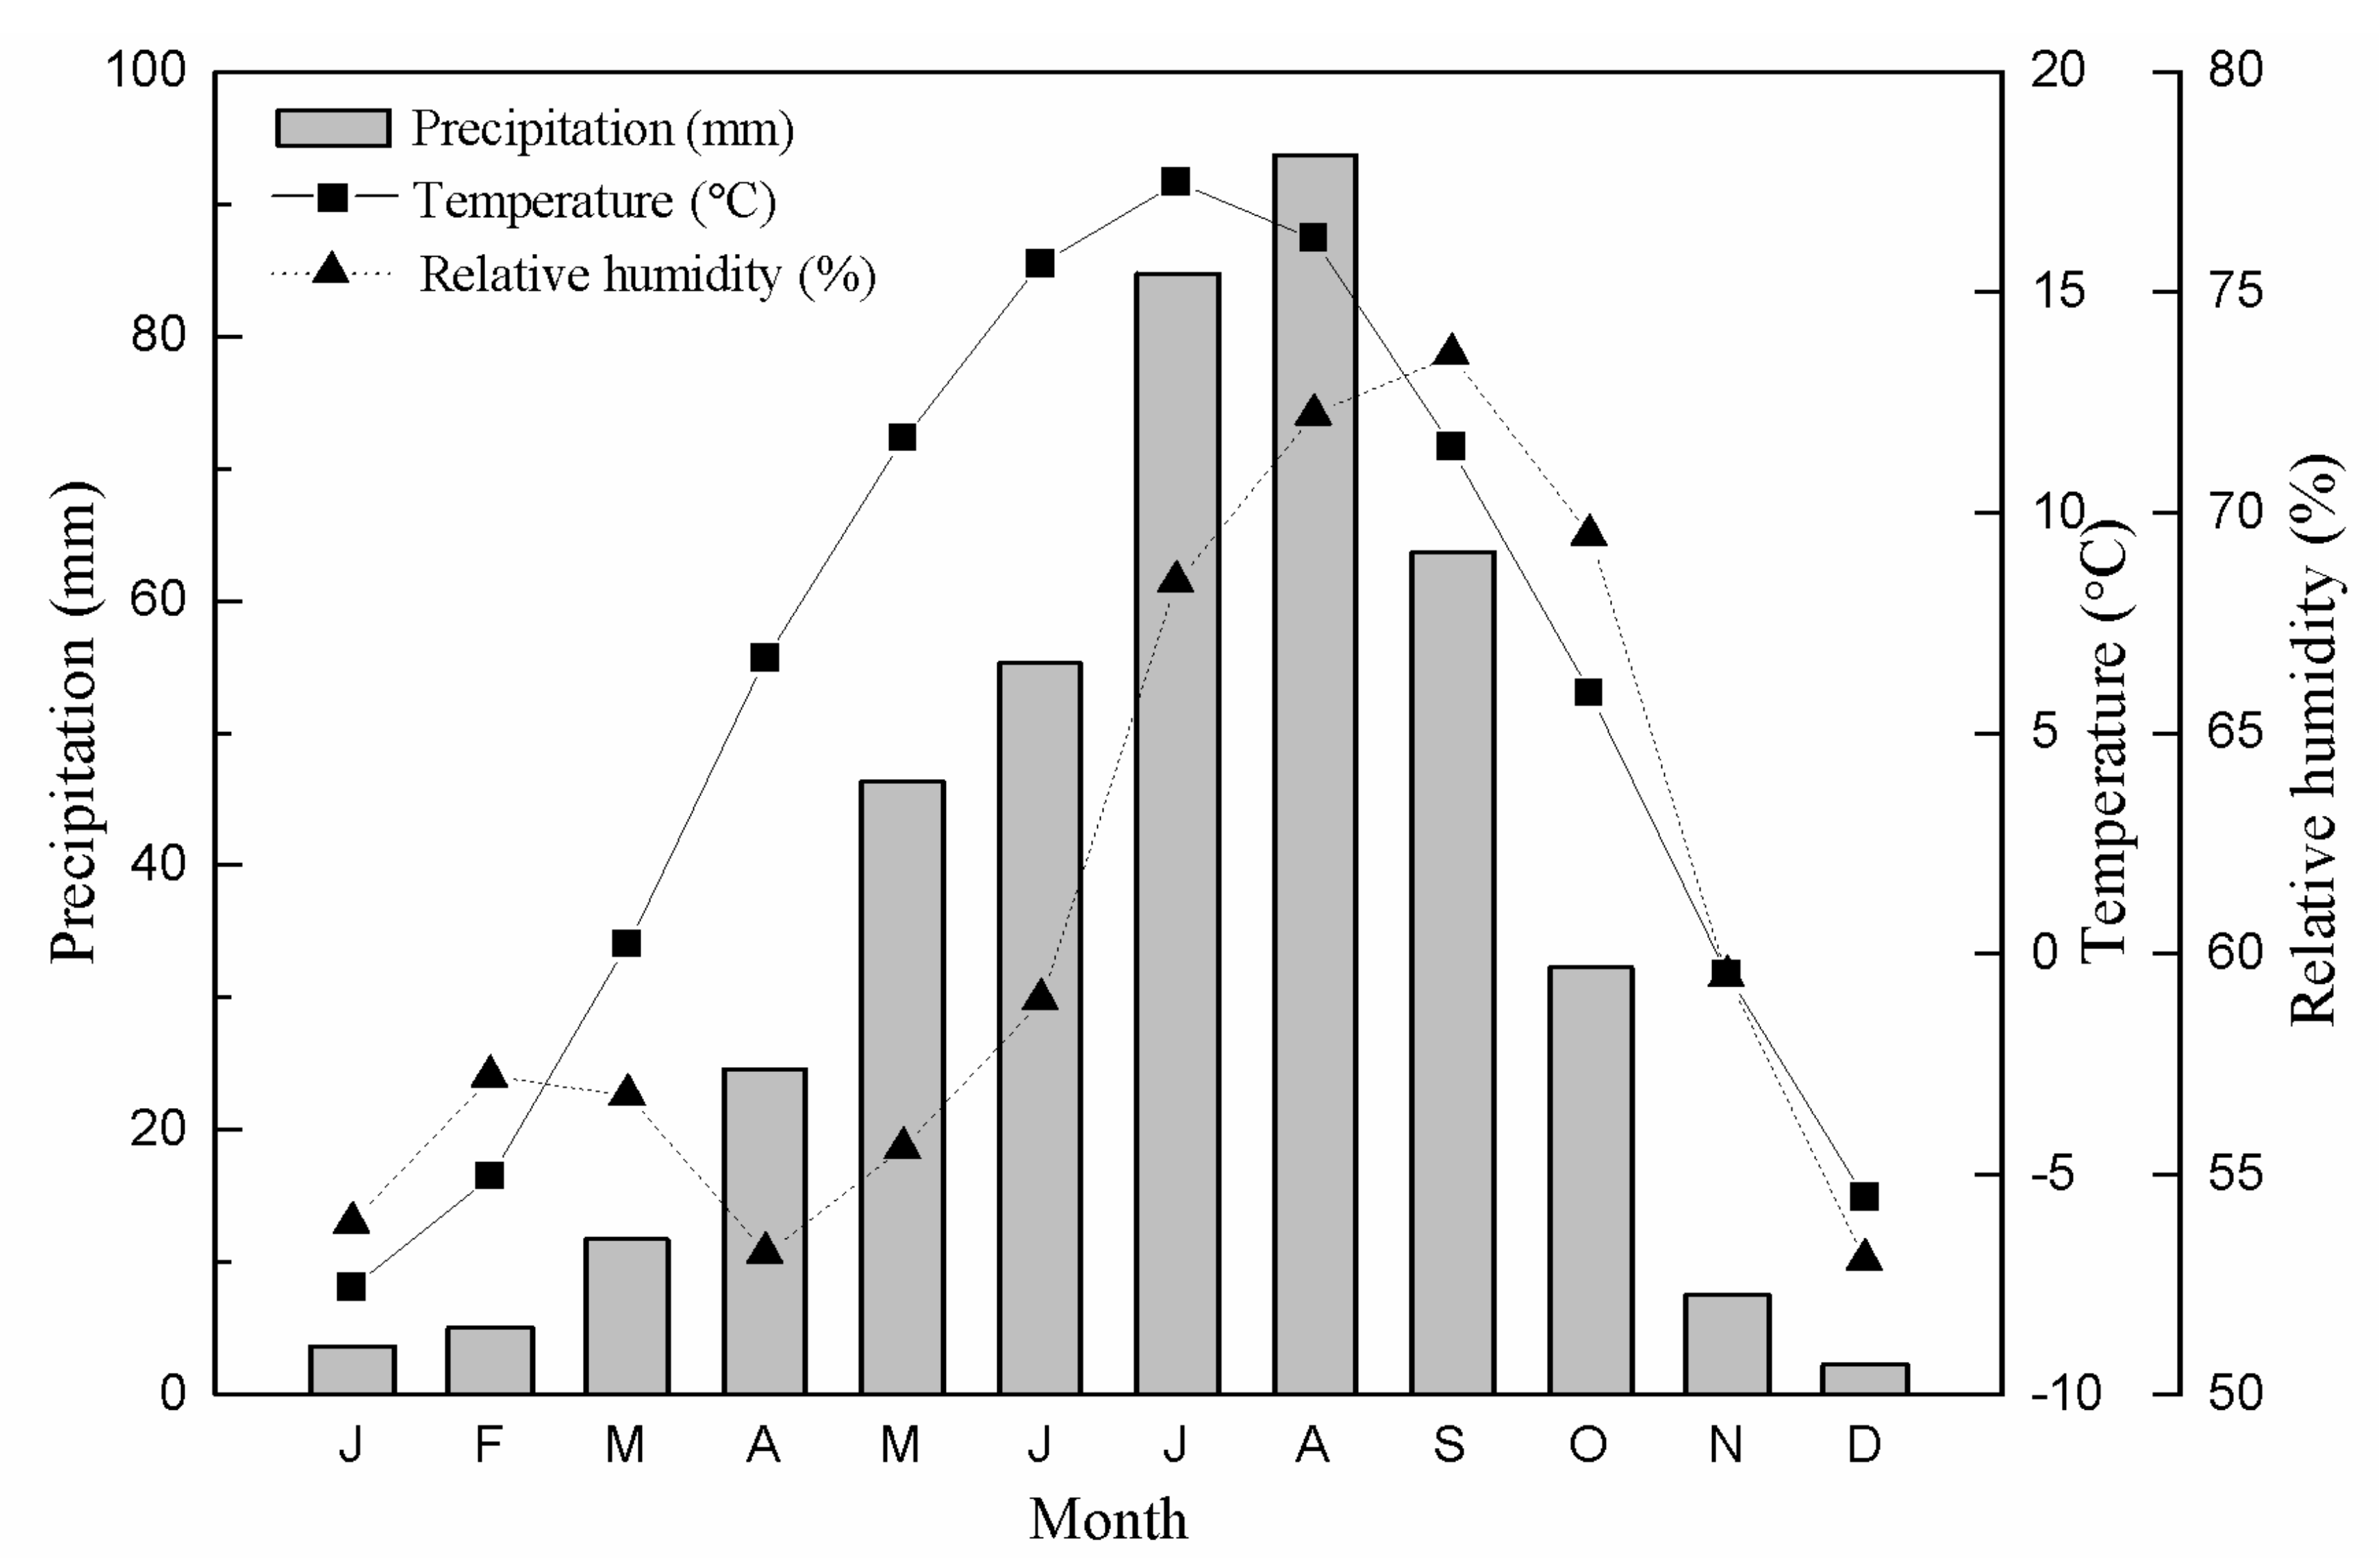
2.1. Study Area Situation

Our sampling site (37° N, 104°36′ E, 2400–2700 m a.s.l.) was located on Mt. Hasi, near the upper reaches of the Yellow River (Figure 1). The vegetation in this forest is complex and diverse, and Pinus tabulaeformis Carr. is the dominant local tree species, mostly growing on the shady slopes at an altitude of 2200–2700 m, with sparse distribution. The soil at the sampling site is thin dark brown soil mixed with some rocks, with a thickness of 20–40 cm. We collected 50 cores from 26 trees in September 2013. The distance between any two of the trees we sampled was approximately within 3 km, the purpose was to ensure that all samples came from the same climate condition, then we considered that the climate signals they contained were consistent.

2.2. Tree-Ring Stable Oxygen Isotopes Experimental Method

The width of each annual ring was measured by the LINTAB measuring table (Rinntech, Germany) with an accuracy of 0.01 mm, and the COFECHA program was used for quality control and to ensure accurate calendar years of each ring [29]. Based on the successfully cross-dated tree-ring series, we developed a ring-width chronology using the ARSTAN program [30]. When removing age-related signals, we used negative exponential curve, straight line of negative slope, or horizontal line to fit each measurement series [31]. In our study, four samples from different trees without missing rings (or few missing rings) were selected for tree-ring stable oxygen isotopes studies and named as HS18A (1705–2012 CE), HS10B (1696–2012 CE), HS28A (1685–2012 CE), and HS32B (1914–2012 CE). We put the core samples under a microscope and peeled the rings off year by year using a sharp knife. Because the boundaries between earlywood and latewood in the same year were difficult to separate, the ring samples were cut annually and put in glass tubes. The Jayme–Wise method was used to extract α-cellulose [14,32]: (1) the sample was bathed in a mixture of toluene and ethanol (2:1) at 60°C for 1 h; (2) the sample was bathed in acetone solution for 1 h at 60 °C; (3) the sample was exposed three times to a mixed solution (NaClO2 and acetic acid) water bath at 80 °C; (4) the sample was bathed in NaOH (17.5%) solution at 80 °C for 45 min and the reaction product was washed until a neutral pH was reached; (5) the cellulose was ultrasonically crushed and freeze-dried. Approximately 0.12–0.16 mg of α-cellulose was sealed into a silver capsule. We used a Delta V Advantage isotope ratio mass spectrometer connected to a high-temperature conversion elemental analyzer (TC/EA) to determine the δ18O in α-cellulose. We inserted a MERCK cellulose (27.7‰, Darmstadt, Germany) every eight samples to calibrate the experimental results. The δ18O was calculated as
δ18O = (Rsample/Rstandard − 1) × 1000
where Rsample and Rstandard are the 18O/16O ratios in the sample and standard, respectively. The measurement accuracy is 0.2‰.

2.3. Meteorological Data

Haiyuan (36°20′ N, 105°23′ E, 1854 m a.s.l., 1958–2012 CE) and Huajialing (35°14′ N, 105°6′ E, 2450 m a.s.l., 1958–2012 CE) meteorological stations are near our sampling site, and in the same climate zone. The meteorological data are complete and there is no record of relocation (Figure 1), so we average the climate data from the two stations to represent the regional climate. As shown in Figure 2, the annual total precipitation in the study area during 1958–2012 CE was 431.00 mm, and the maximum precipitation period was from July to September, accounting for 56.18% of the whole year precipitation. July (17.48 °C) was the warmest month, and the January (−7.56 °C) was the coldest. The mean RH of the total year is 60.99%, September was the wettest month with a humidity of 73.59%, and December was the driest month with a humidity of 53.05%. The meteorological data were downloaded from the China Meteorological Service Center (http://data.cma.cn/). We also obtained the δ18Op data of Xi’an and Shijiazhuang from the Global Network of Isotopes in Precipitation project (GNIP, http://www-naweb.iaea.org) to compare with our tree-ring δ18O sequence. Aiming to explore the spatial representativeness of our reconstruction, we also used global grid precipitation data (CRUTS 4.03, 1958–2012 CE). Additionally, the correlations between reconstructed series and ENSO-related indices were calculated, such as SST (NIÑO4, NIÑO3.4, NIÑO3, and NIÑO1+2 from ERSST, Kaplan and Hadley Center data sets), the Multivariate ENSO Index (MEI from ESR), and the Southern Oscillation Index (SOI from NCEP), the above data were all retrieved from the Royal Netherlands Meteorological Institute Climate Explorer (http://www.knmi.nl/).

2.4. Statistical Methods

We used Pearson’s correlation coefficient (r) and partial correlation to explore the response of tree-ring δ18O to climate factors in the study area. The mean interseries correlations (Rbar) and the expressed population signal (EPS) were calculated based on 30-year windows with a lag of 15 years over the period of 1685–2012 CE [33].The statistical parameters used to reconstruct the equation included explained variance (R2), explained variance after adjusting for degrees of freedom (R2adj), F value, p value, and Durbin–Watson value (D/W).The split calibration-verification model was used to test the stability of the regression equation [34,35]. Firstly, we calibrated the meteorological data for one subperiod (1958–1984 CE, 1986–2012 CE), and then validated the reconstruction model by the remaining data (1985–2012 CE, 1958–1985 CE). The statistical parameters used in this process were sign test (ST), reduction of error test (RE), coefficient efficiency (CE), and product means test (t).
A multi-taper method (MTM) spectral analysis was performed to detect the periodicities in the reconstructed series [36]. Ensemble empirical mode decomposition (EEMD) was employed to decompose the reconstruction series, and each series was named as an intrinsic mode function (IMF) [37].

3. Results

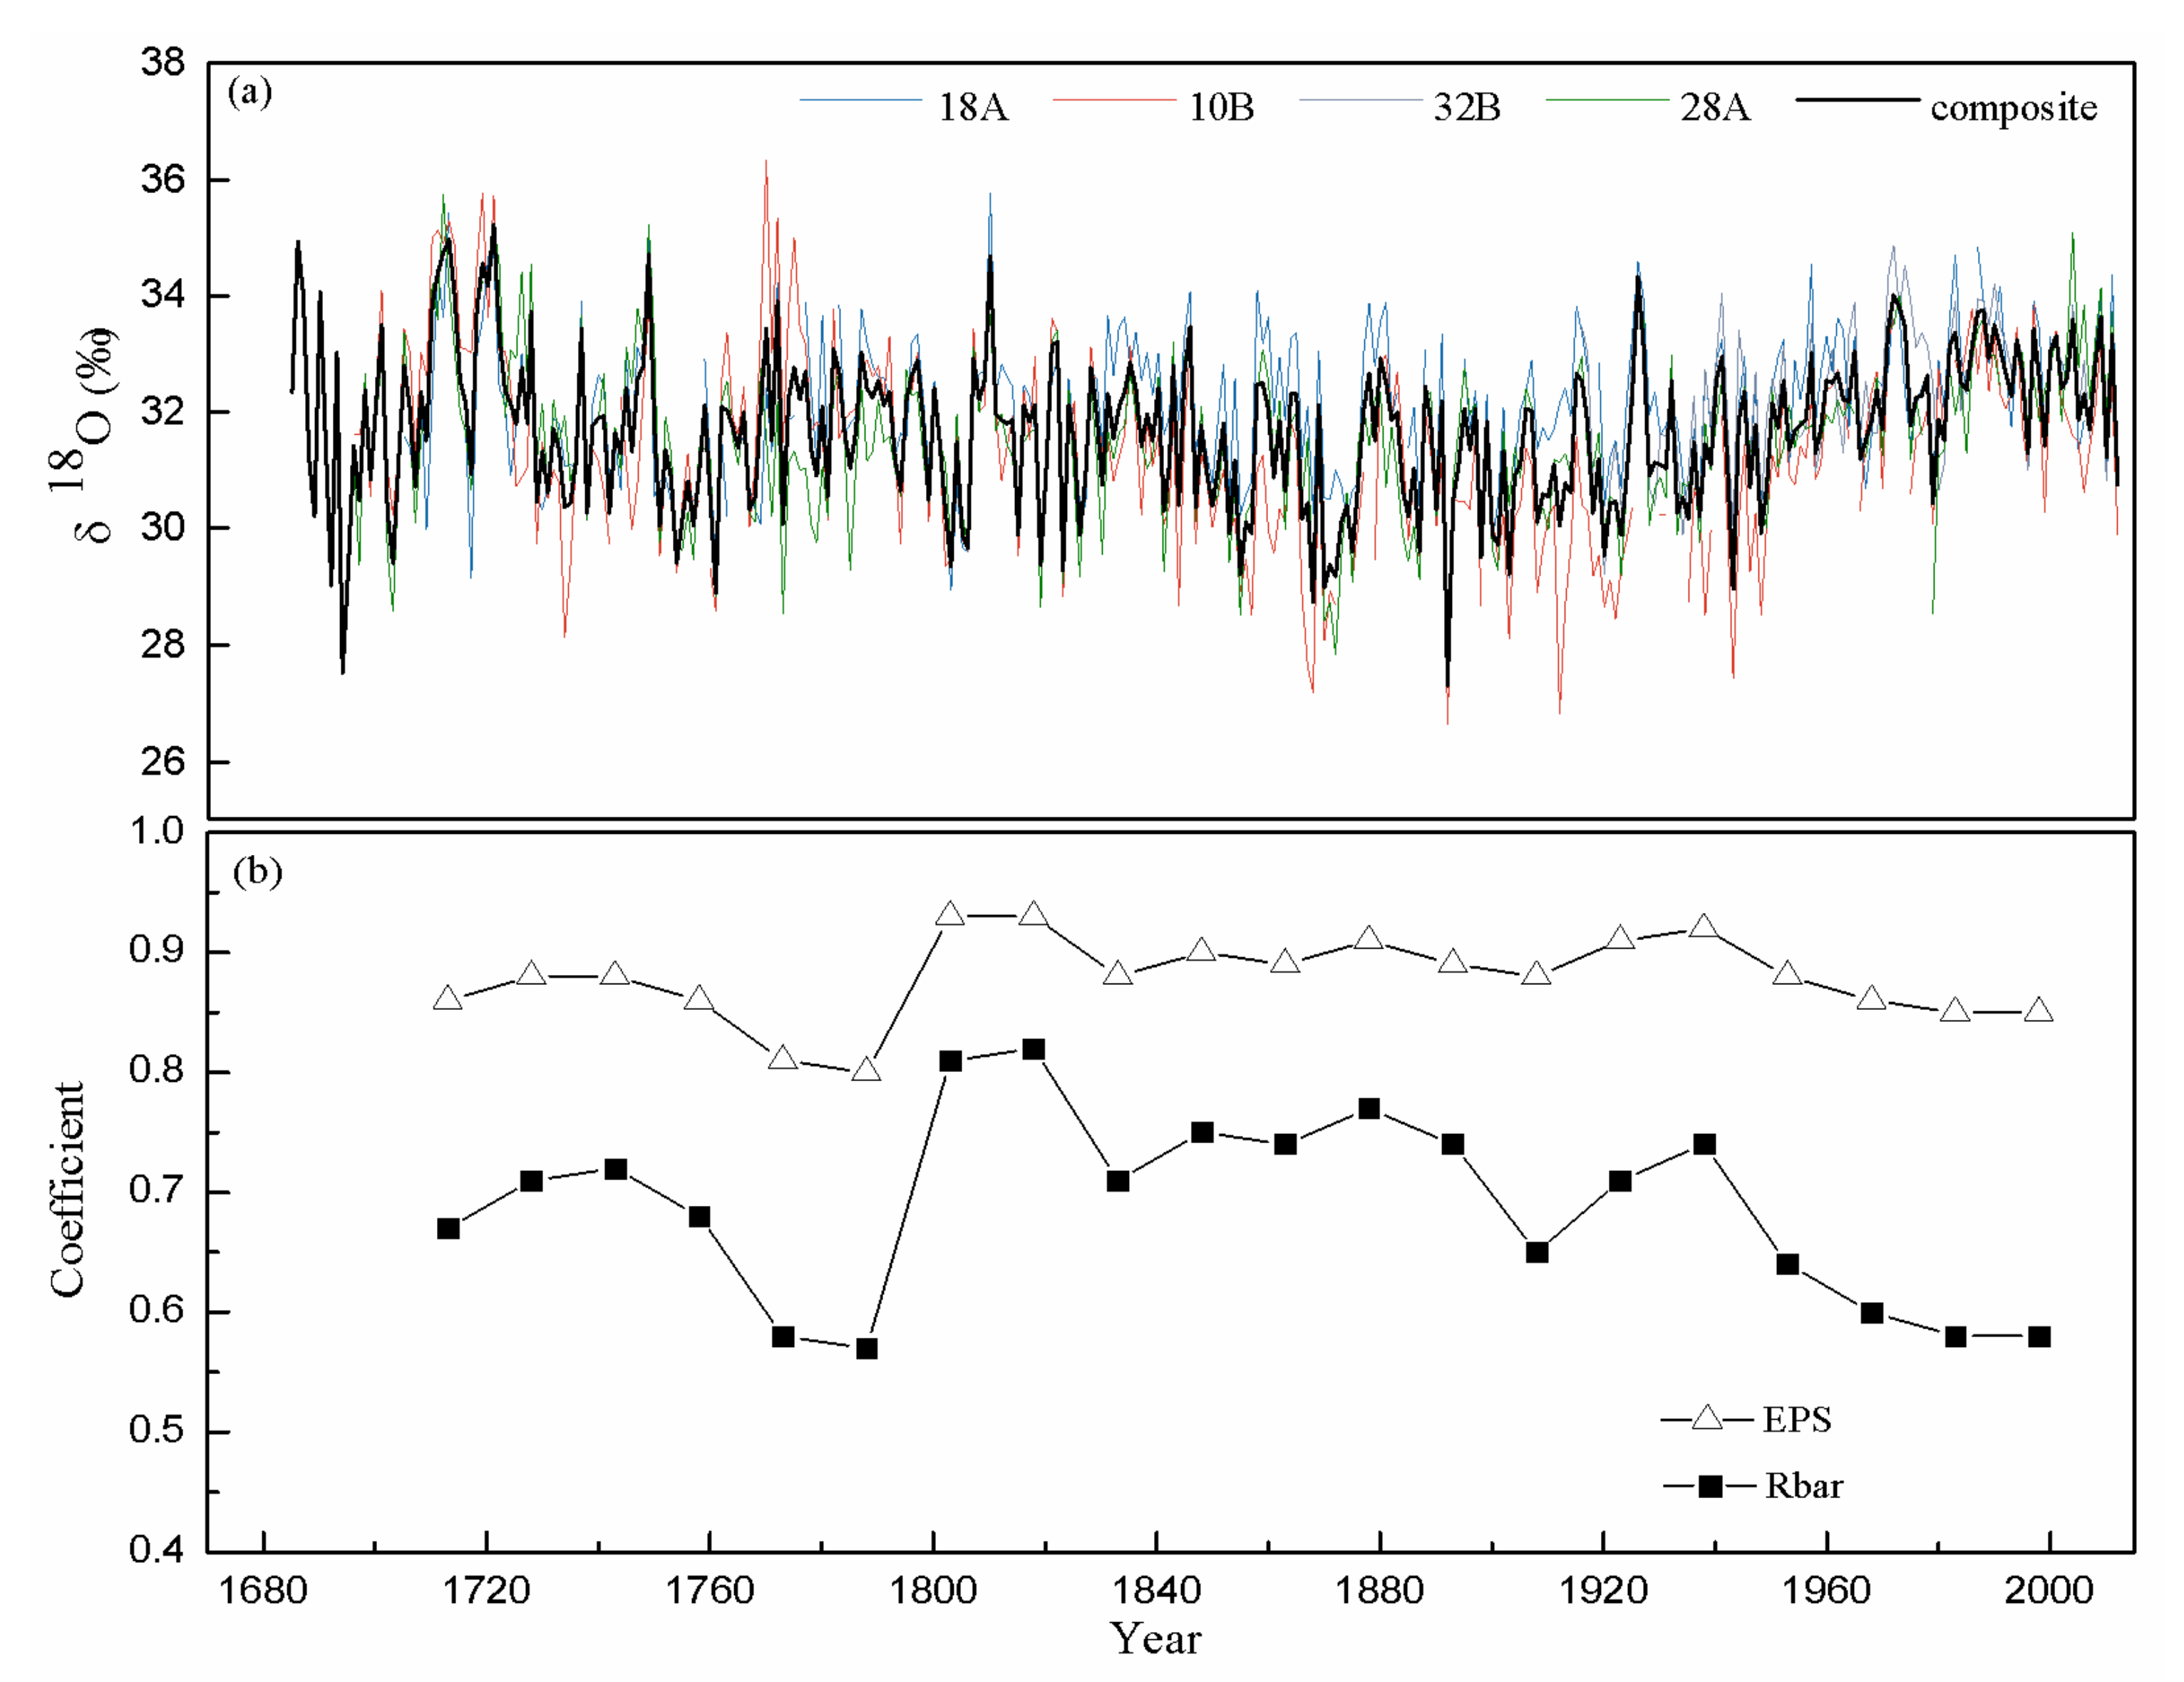
3.1. The Chronology of Tree-Ring δ18O

We used the numerical mix method (NMM) [15,24] to synthesize four individual δ18O series into a brand-new sequence. This method can be used to avoid the contingency of a single sample effectively [15]. The correlations between the four individual tree-ring δ18O series were very significant, and the composite sequence was significantly positively correlated with individual series, which represented the variations of the local tree-ring δ18O very well (Table 1 and Figure 3a). Rbar (0.57–0.82) and EPS (0.80–0.93) are shown in Figure 3b, where EPS indicates the degree of deviation of the chronology from infinitely replicable hypothetical chronology. EPS values greater than 0.80–0.85 are generally consider to capture conventional regional signals [33]. Statistical characteristics of all series are shown in Table 2.

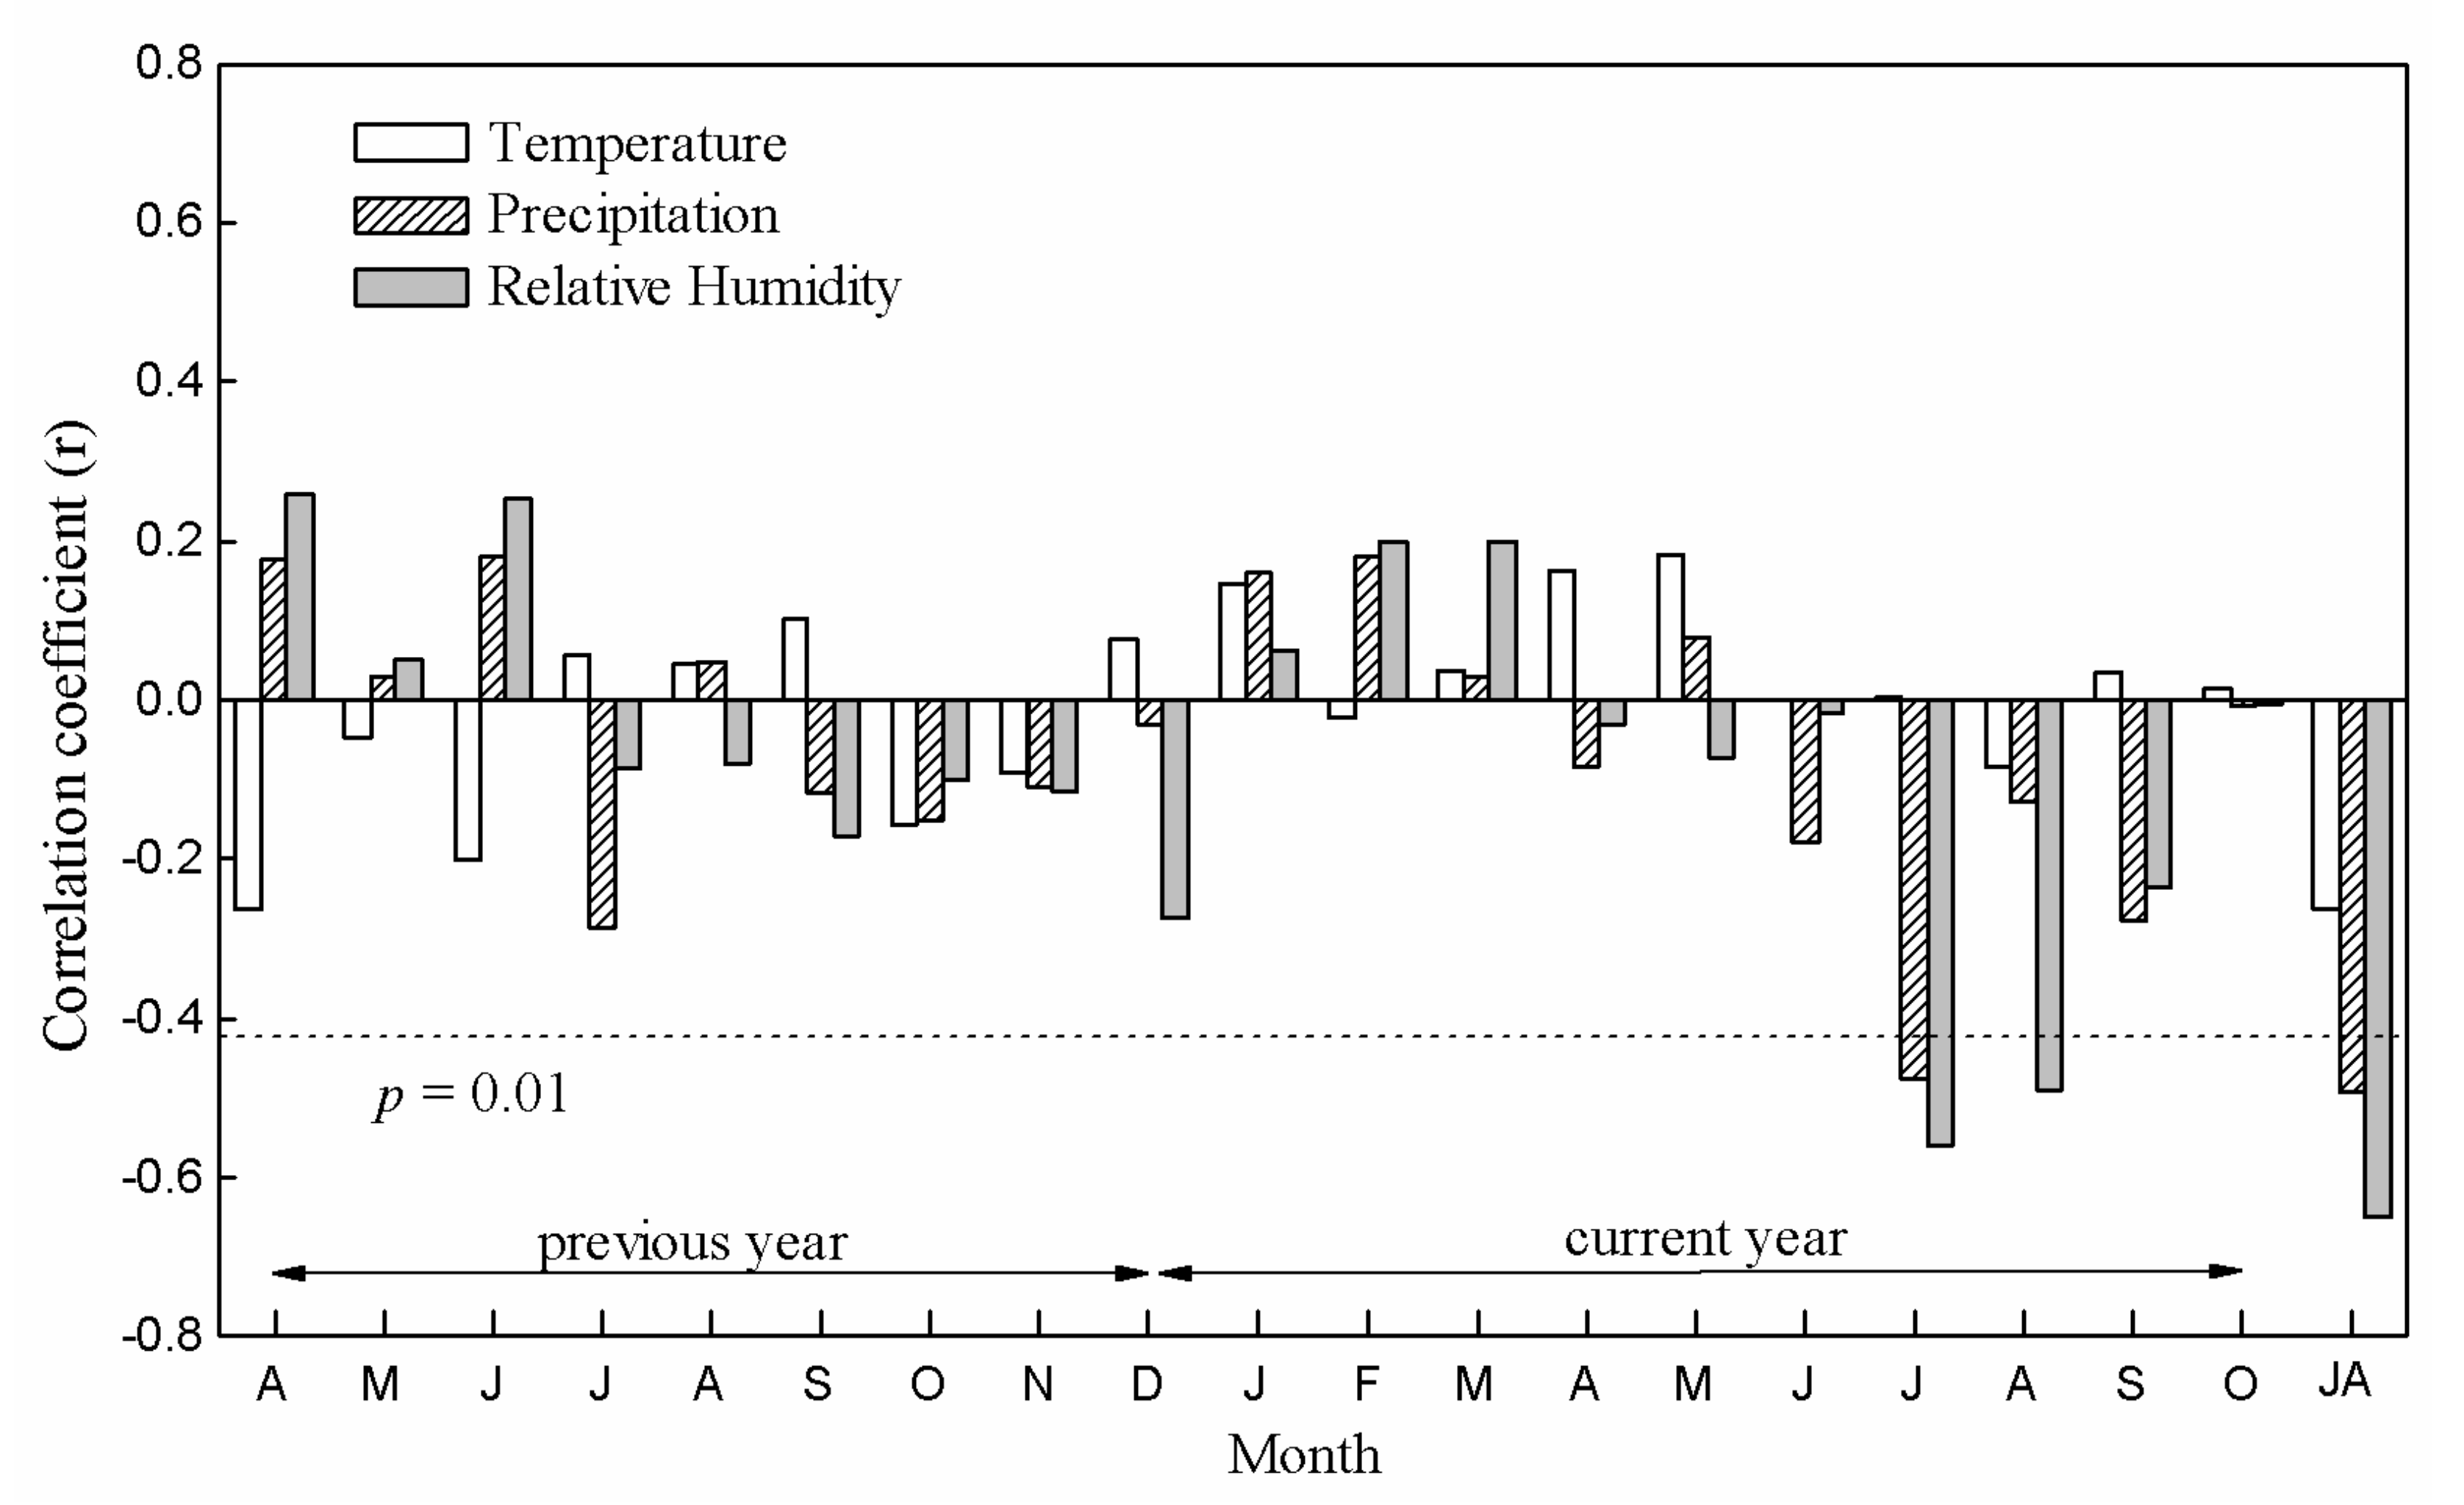
3.2. Climate Response

The correlation analysis indicated that the composite tree-ring δ18O was most significantly related to the RHJA values recorded by the Haiyuan and Huajialing meteorological stations (1958–2012 CE) with r = −0.65 (n = 55, p < 0.001). From April of the previous year to October of the current year, there was no correlation between composite δ18O sequence and temperature. The correlation between δ18O chronology and precipitation was not significant except July of the current year (Figure 4). These results indicate that RH is the dominant factor controlling the δ18O fractionation of trees in the Mt. Hasi region, rather than precipitation and temperature. In arid and semi-arid areas, δ18O incellulose can be regarded as an indicator of RH, because during δ18O fractionation, the amount of evaporation depends on stomatal conductance and the vapor pressure, which both have a close relationship with RH [14,19,25,38,39]. δ18O is more likely to be enriched under low-RH conditions; thus, a negative correlation exists between tree-ring δ18O and RH [18].
Since RH has a significant relationship with precipitation and temperature, we performed a partial correlation analysis between tree-ring δ18O and the observed climate factors. When the temperature and precipitation from July to August were fixed, tree-ring δ18O was negatively correlated with RHJA (r = −0.61, r = −0.56); when RHJA was fixed, tree-ring δ18O was not related to the temperature and precipitation from July to August (Table 3). The differences between RH and precipitation may explain these results, precipitation refers to the total amount of rainfall, snow, and hail that reaches the ground, which represents a gauge of weather phenomena. RH is the transfer of evaporation and the process of water vapor migration, representing a complicated environmental system [24]. Precipitation and temperature have an indirect effect on the fractionation of tree-ring δ18O through RH, which also explains why the RH is the dominant factor in δ18O fractionation.

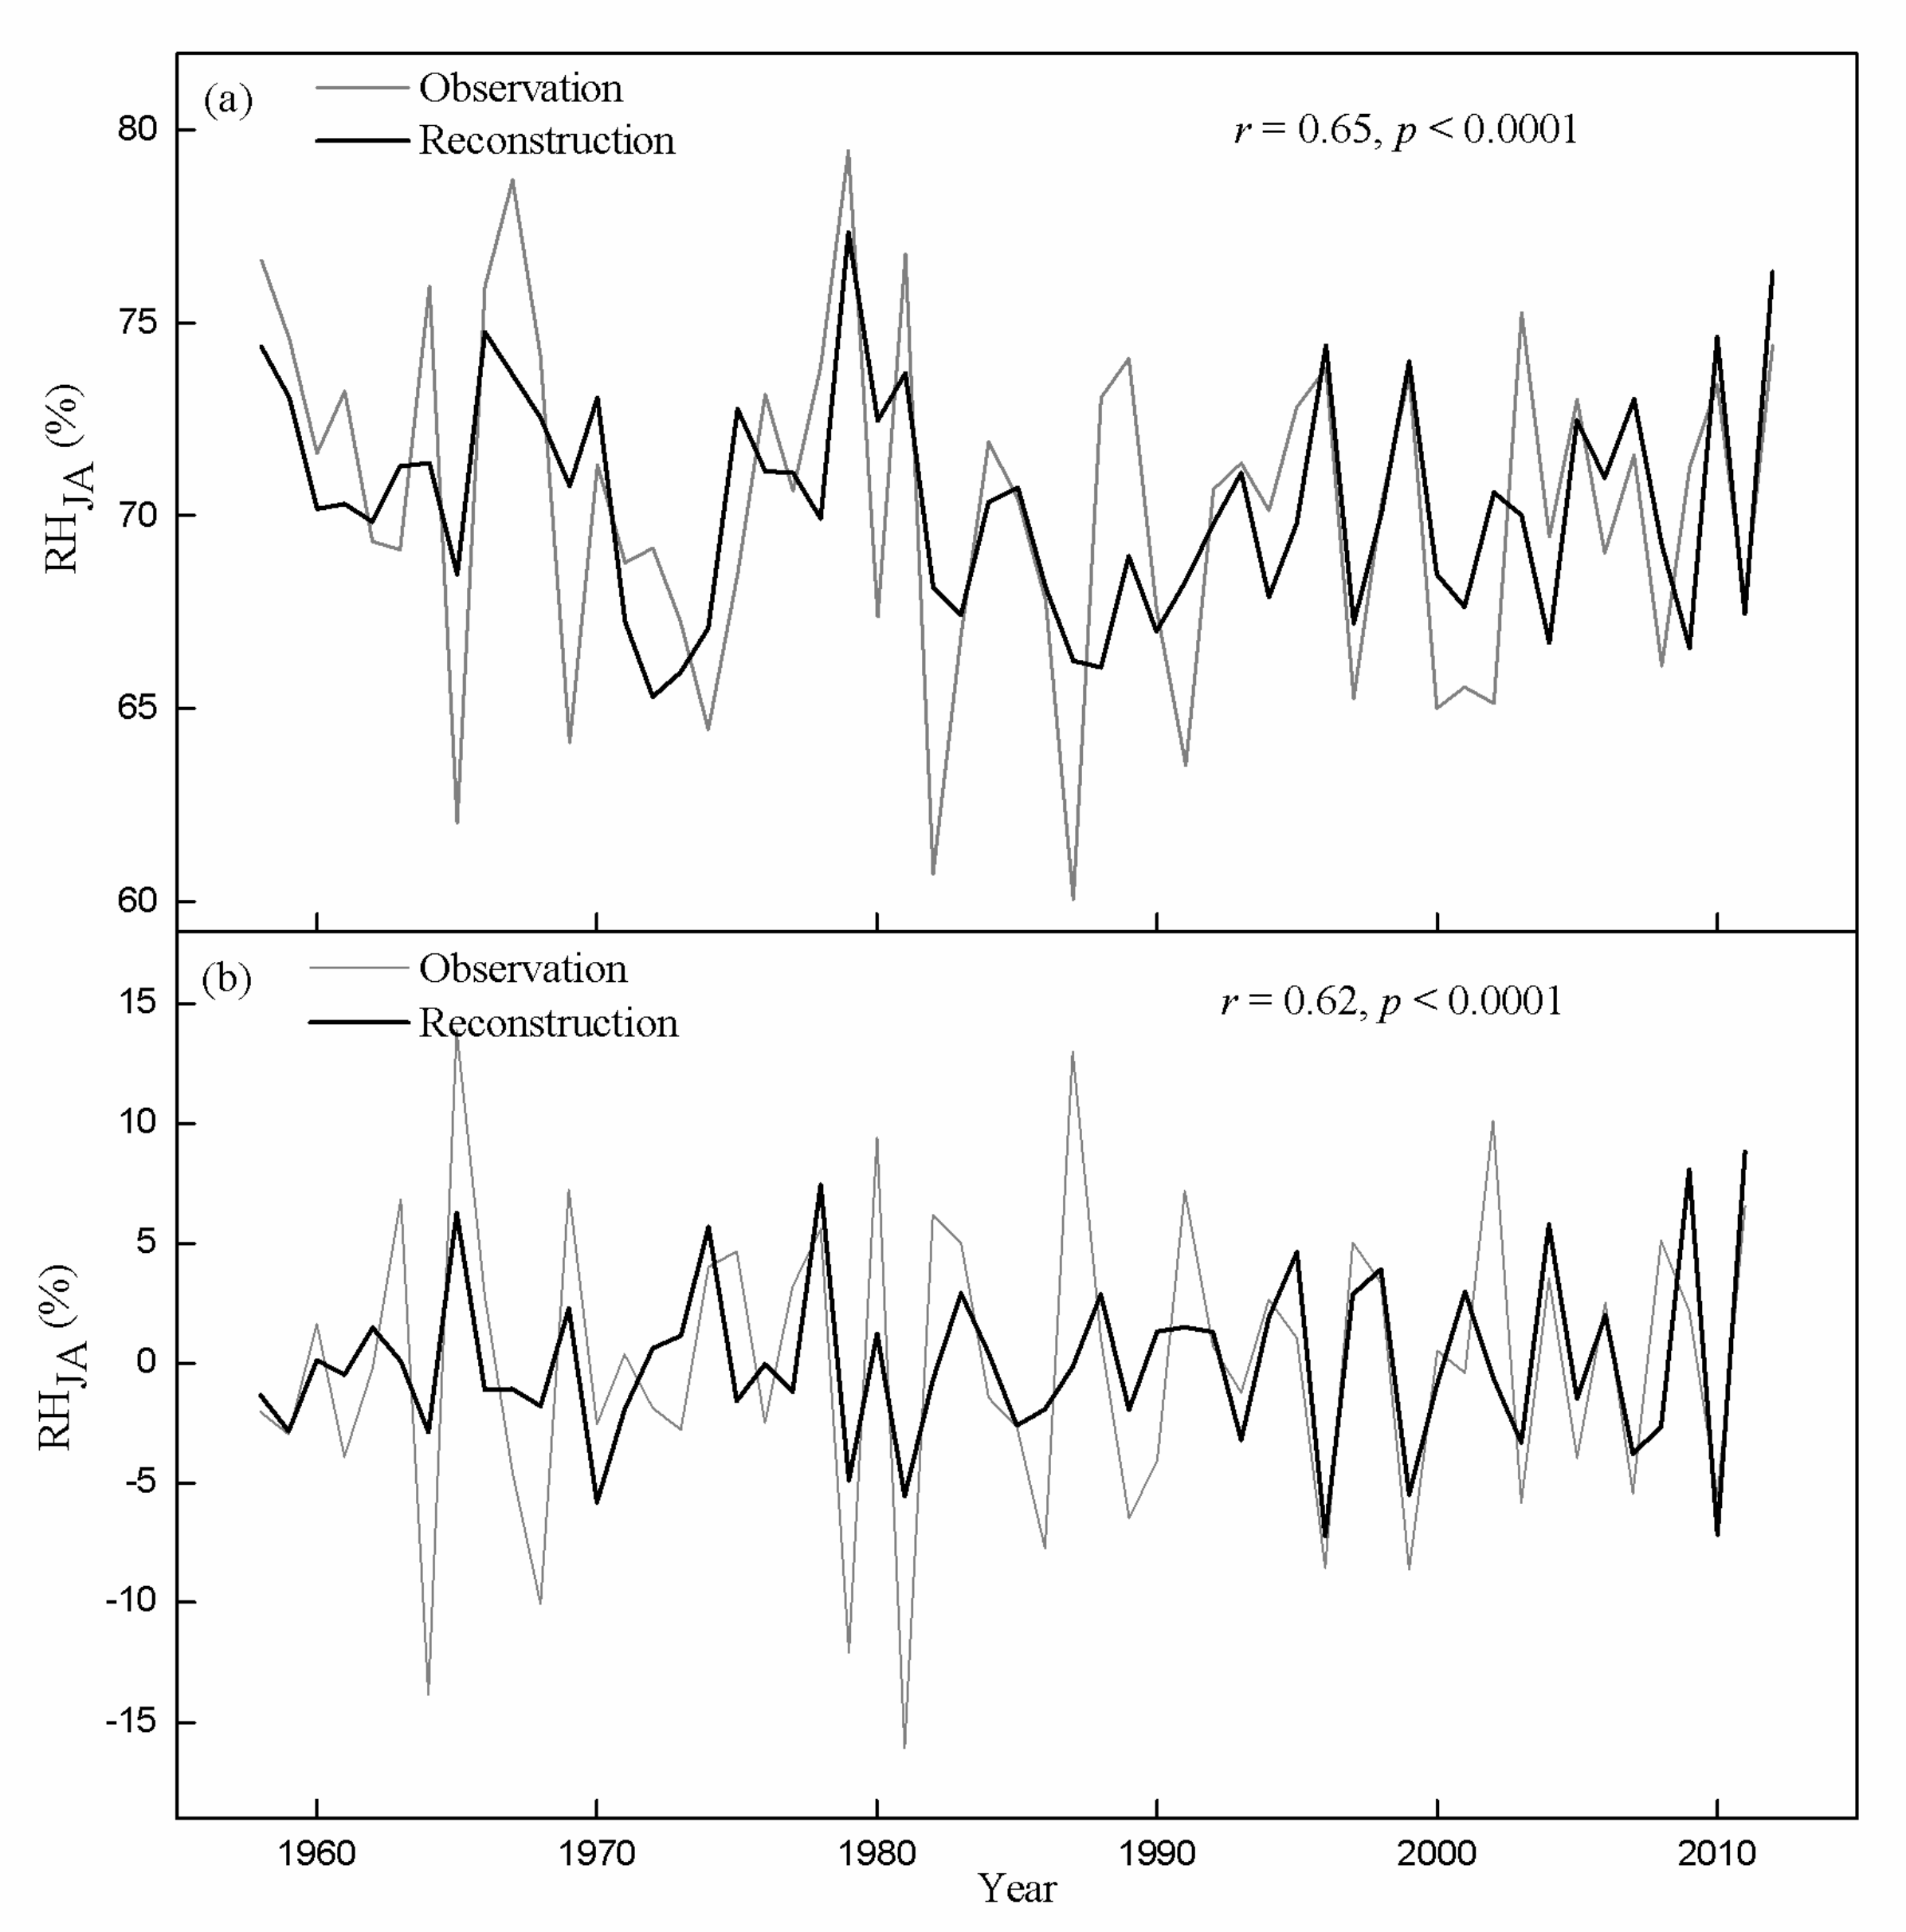
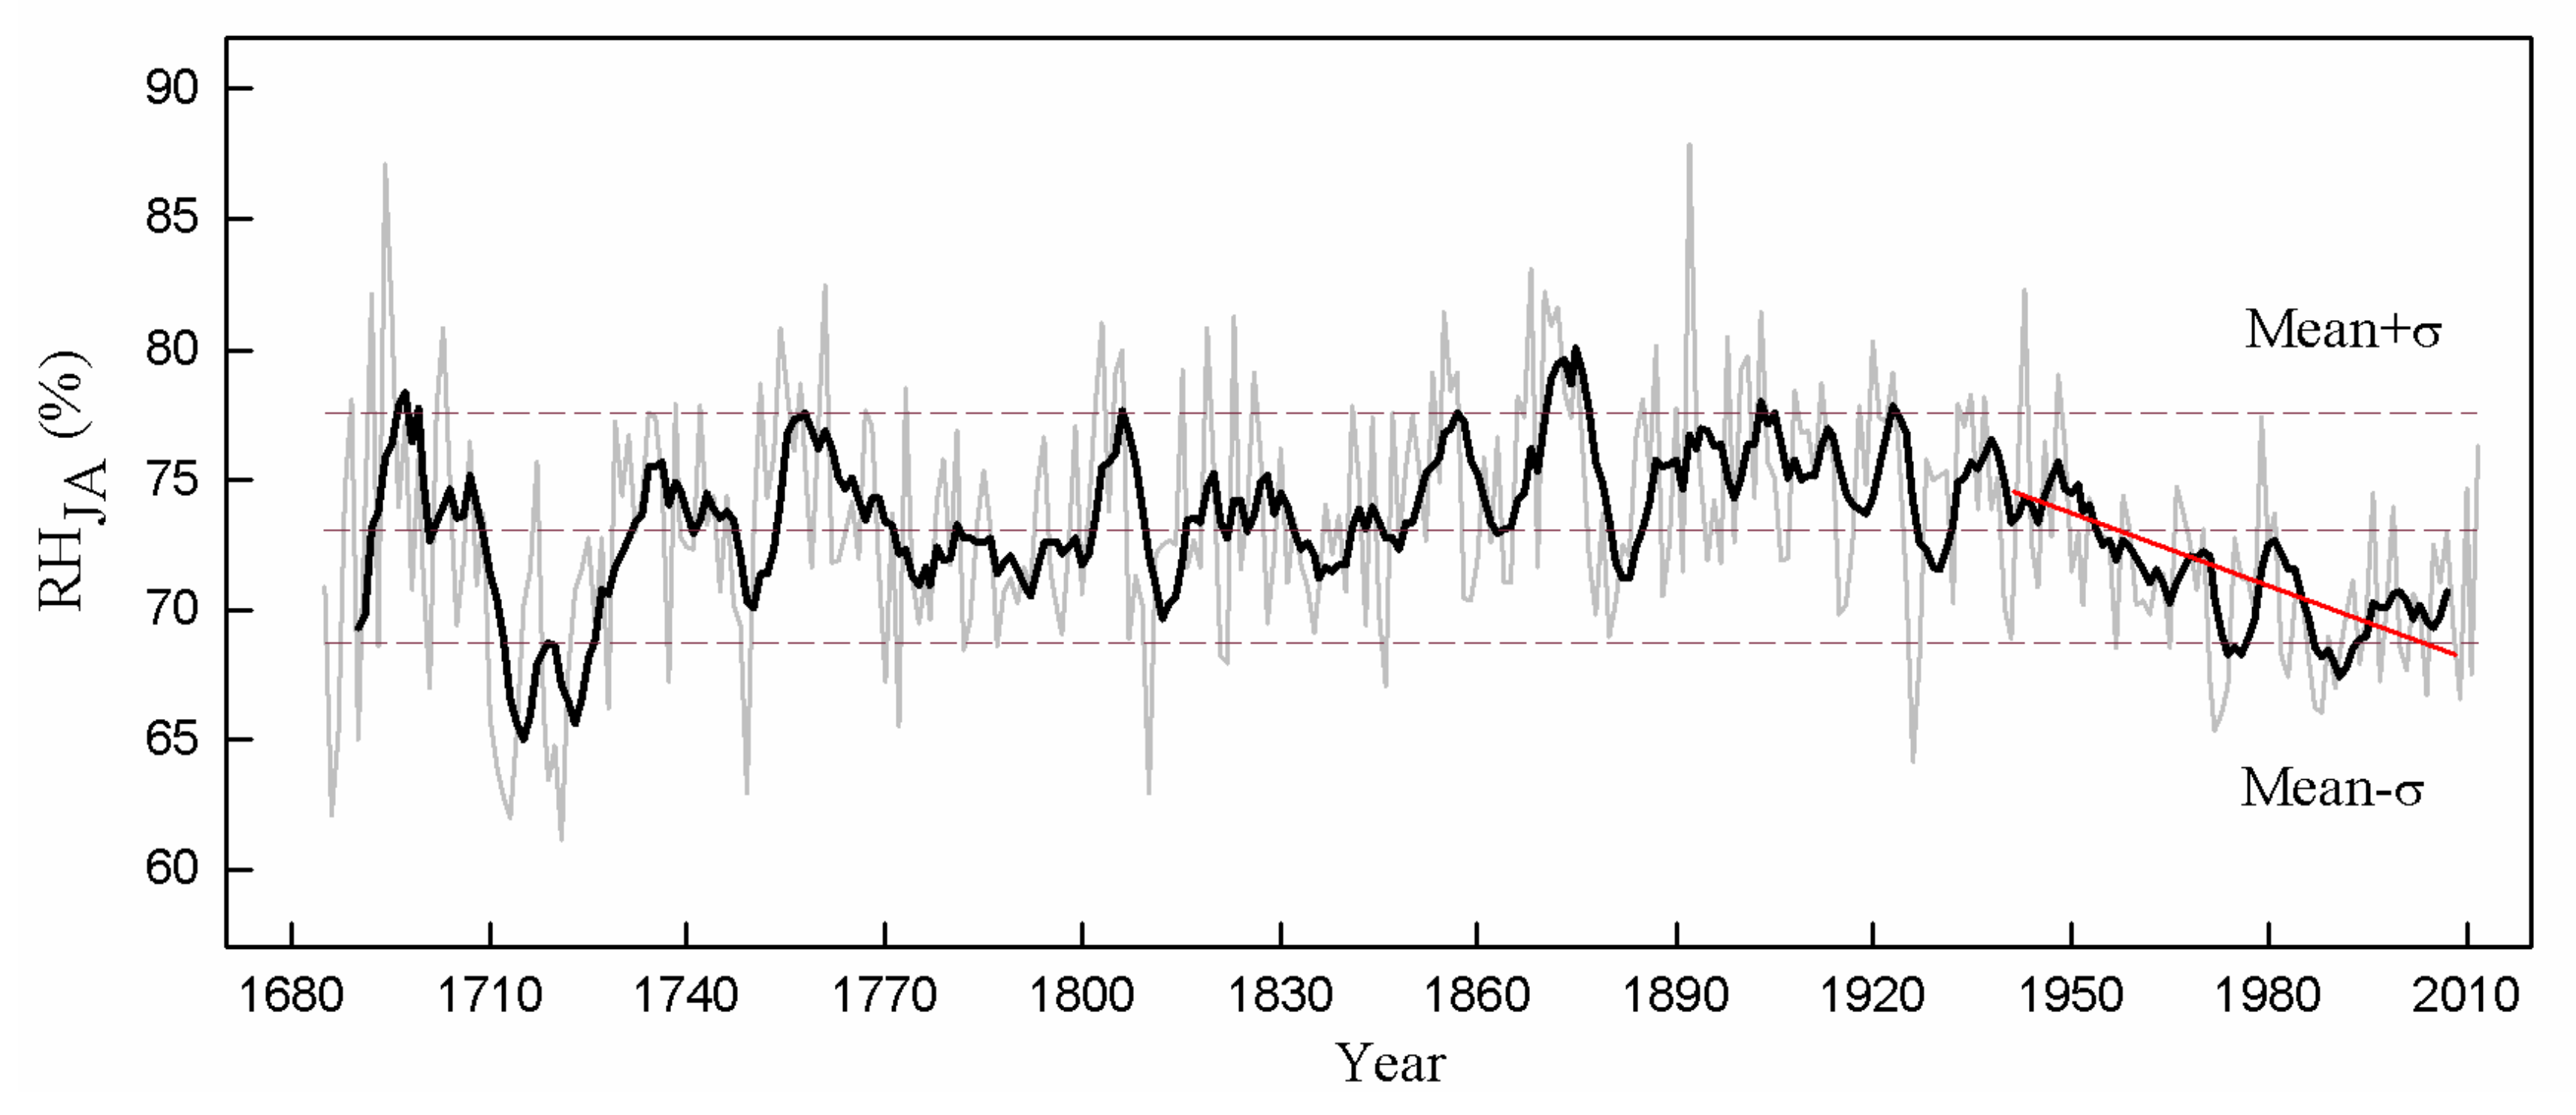
3.3. Reconstruction of RHJA during 1685–2012 CE on Mt. Hasi

According the above analyses, RHJA on Mt. Hasi was reconstructed by the following transfer function
RHJA = −3.38 × δ18O + 180.16
(n = 55, r = −0.65, R2 = 0.42, R2adj = 0.41, F = 38.81, p < 0.0001, D/W = 2.21)
where r is the correlation coefficient between RHJA and tree-ring δ18O, R2 is the explained variance, and R2adj is the explained variance after adjusting freedom degrees. The D/W value [40] is used to test the first-order autocorrelation in the reconstruction series. When n = 55, a D/W value between 1.59 and 2.41 indicates that there is no first-order autocorrelation. Furthermore, we used the split-sample method to examine Equation (2). Both RE and CE were positive, and RE was greater than CE (Table 4), indicating that our reconstruction was stable [35].
As shown in Figure 5, during the common period (1958–2012 CE), the reconstructed RHJA had an excellent consistency with the observed RHJA, and our reconstruction tracked the low (Figure 5a) and high (Figure 5b) frequencies of the original records very well. The reconstructed RHJA in the Mt. Hasi area over the past 328 years is shown in Figure 6.

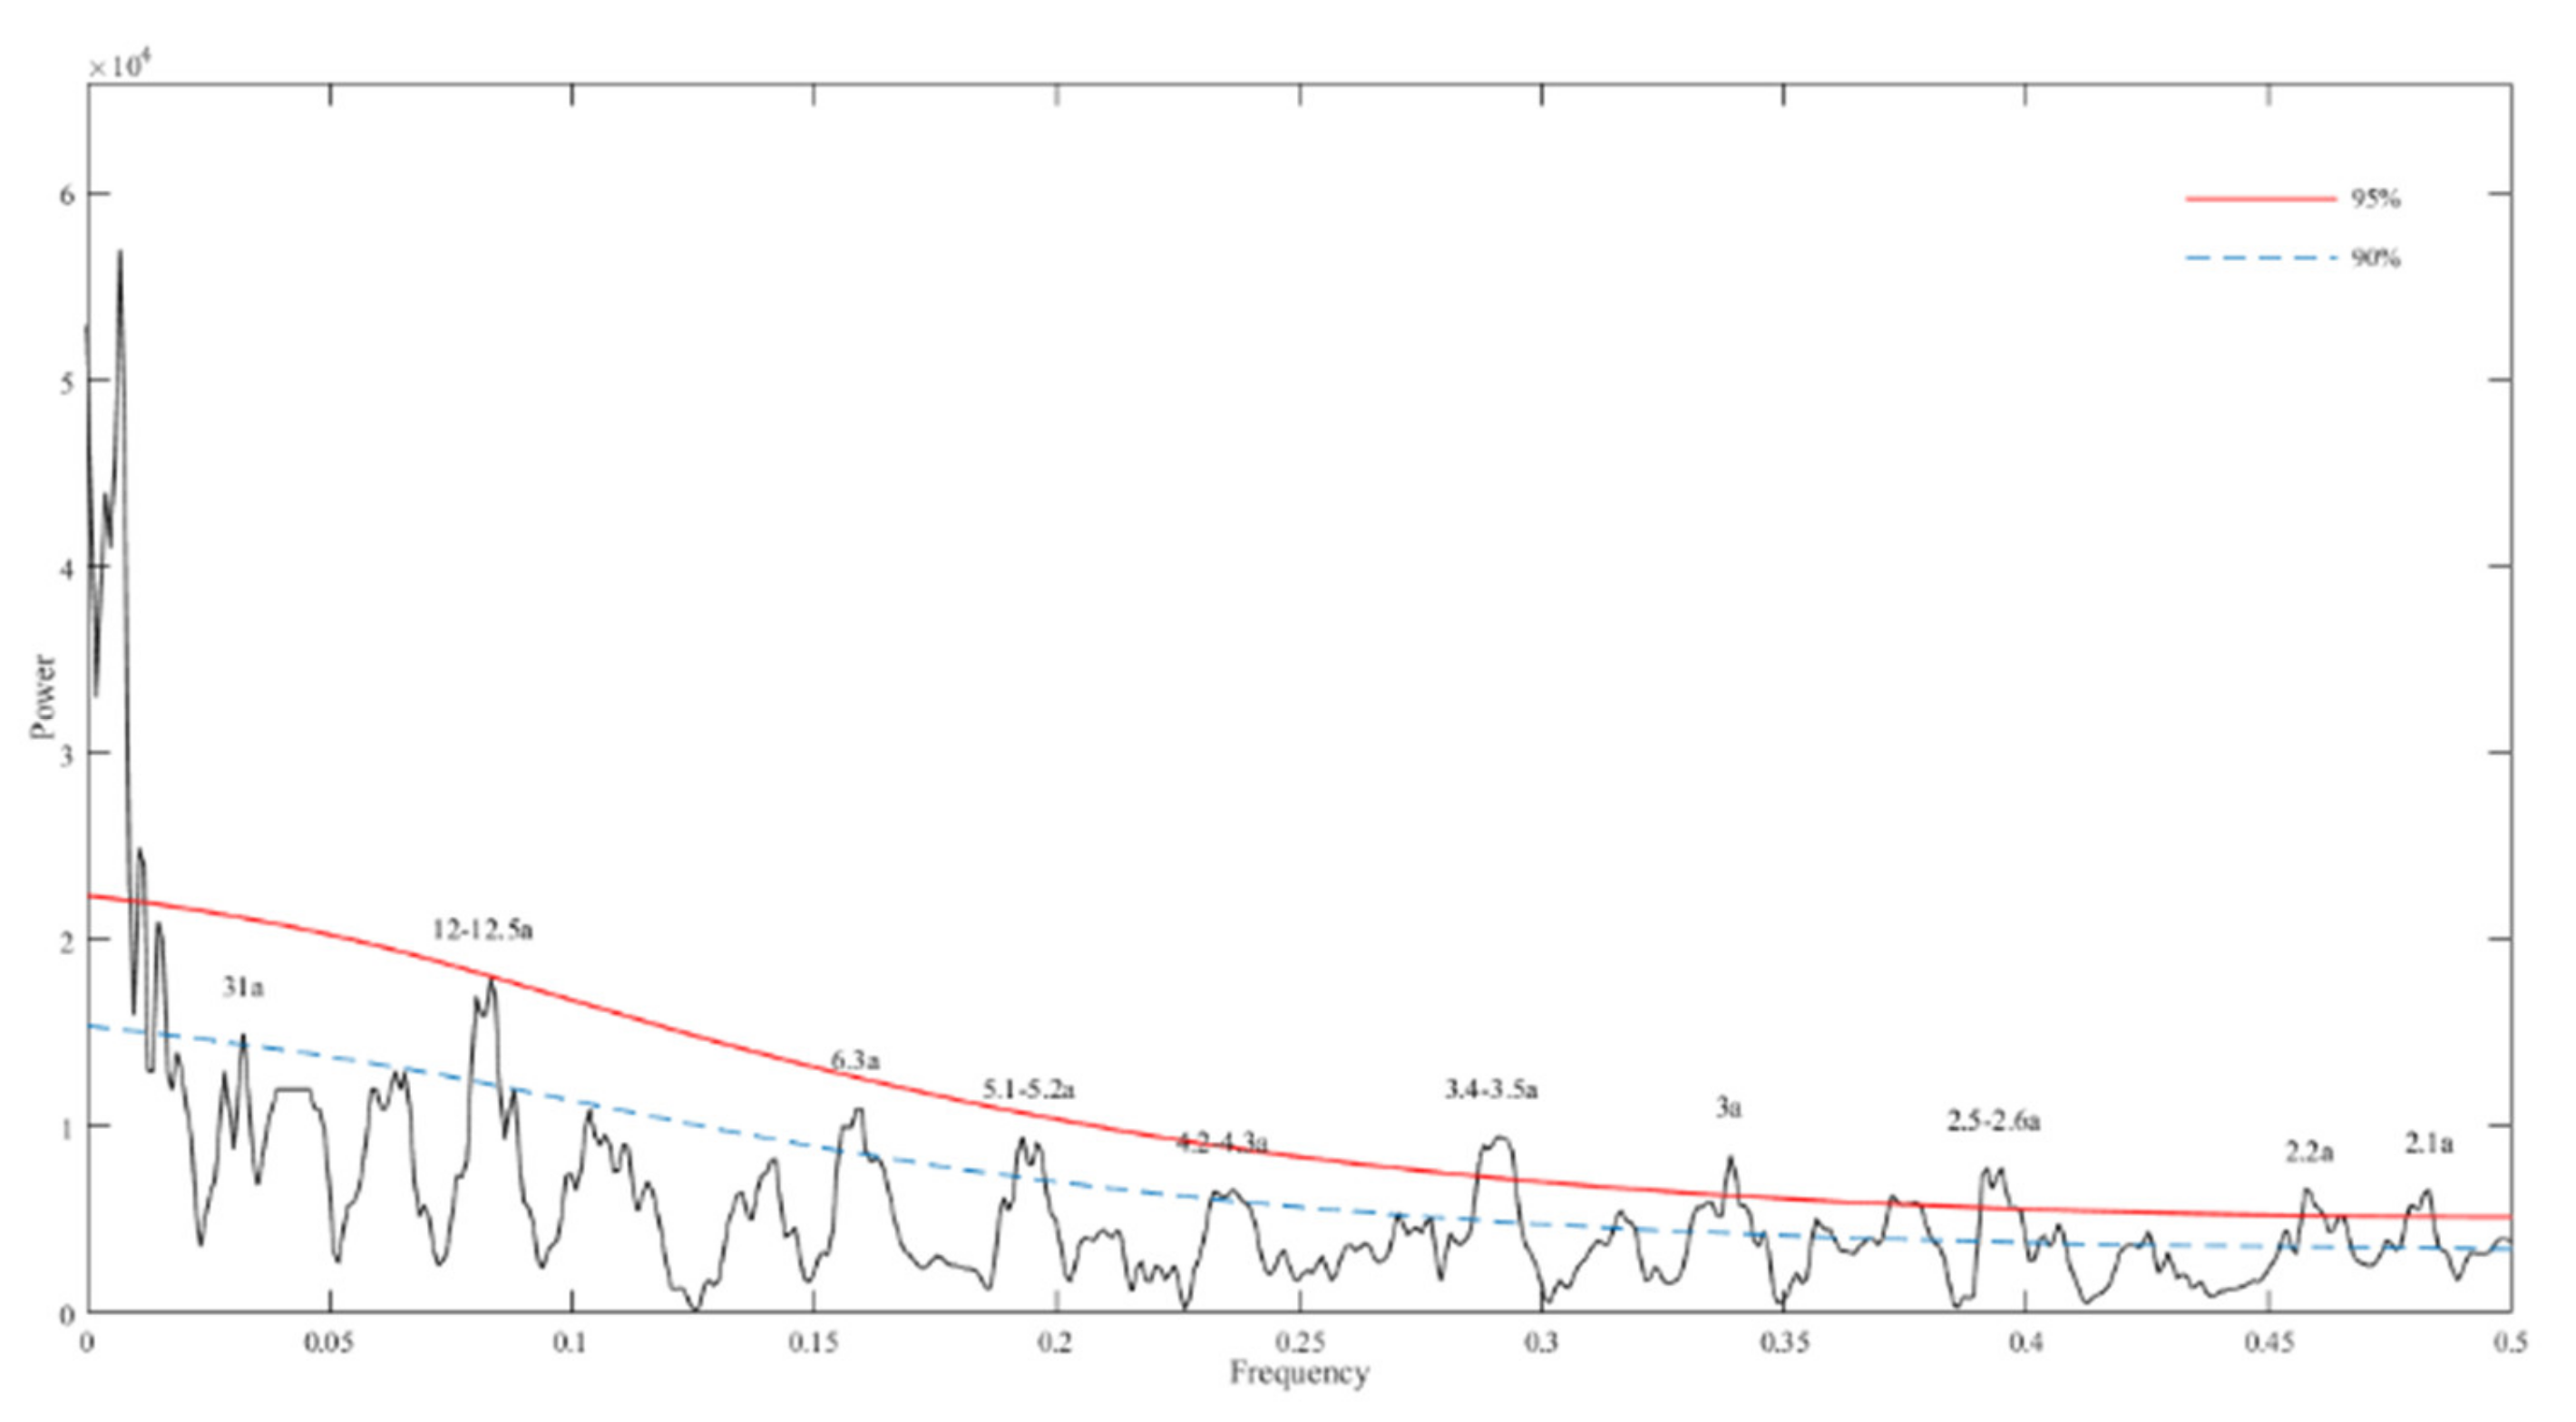
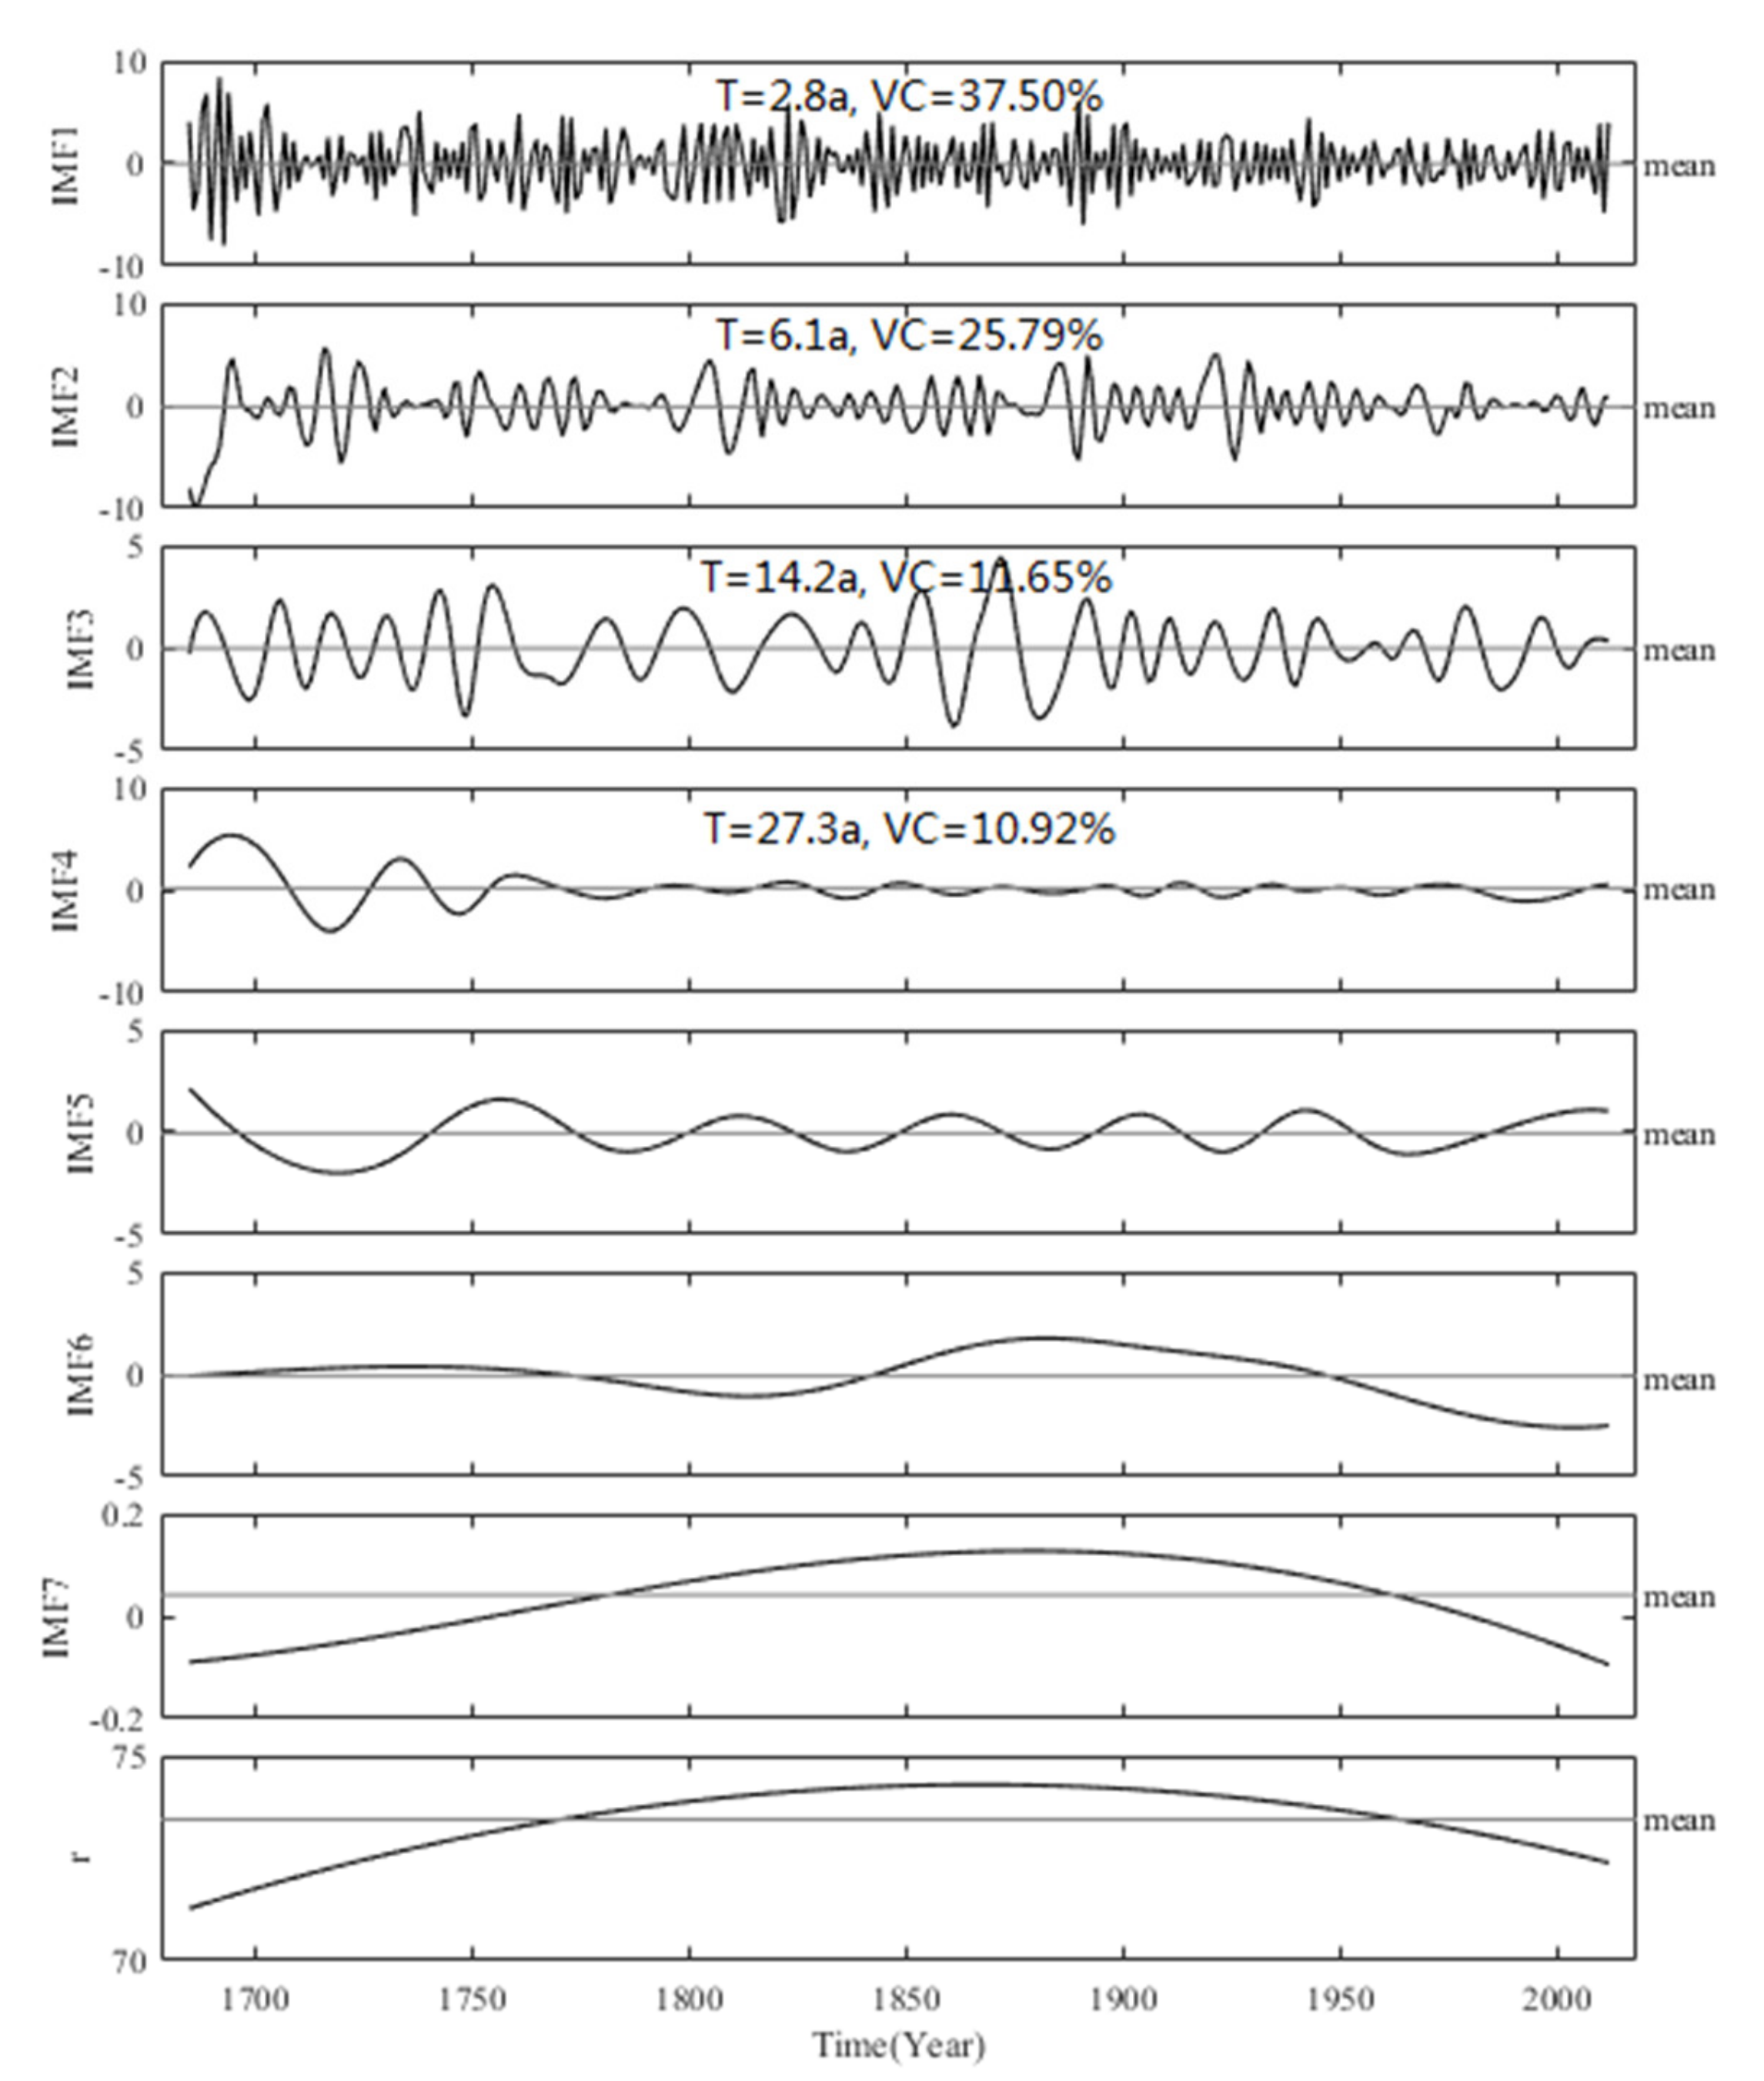
3.4. Periodicities of the RHJA Reconstruction

We used the MTM method to analyze the periodicities of the reconstructed sequence. The reconstruction displayed 31, 12–12.5, 6.3, 5.1–5.2, 4.2–4.3, 3.4–3.5, 3, 2.5–2.6, 2.2, and 2 years quasi-cycles at higher than 90% confidence level (Figure 7). In addition, the RHJA reconstruction was decomposed into seven IMFs by the EEMD method. As shown in Figure 8, IMF1 and IMF2 had the highest variance contributions, accounting for 63.29%, representing interannual changes. IMF3 and IMF4 accounted for 11.56% and 10.92% respectively, representing interdecadal changes.

4. Discussion

4.1. Connection between Tree-Ring δ18O and Precipitation δ18O

In China, ASM brings high amounts of water vapor from marine sources. As the water vapor moves inland, δ18O decreases via Rayleigh fractionation with continuous rain [24]. The water in trees comes from the soil, and the isotopic signals in trees come from the isotopic signals of rainfall [14]. The tree-ring δ18O inherits the δ18O of atmospheric precipitation and can reflect large-scale water vapor cycle processes [14]. In our study, we compared tree-ring δ18O on Mt. Hasi with data from two nearby stations (Xi’an and Shijiazhuang, data from GNIP). Because the records were limited (about 10 years) and there were some defects, we chose a reliable period for comparison, and the results were shown in Figure 9. Because of the amount effect (the negative relationship between the amount of precipitation and δ18Op) [41], although there were some differences in the δ18Op values of both stations, the variation patterns of δ18O and δ18Op during the observation period were similar, which indicated that the tree-ring δ18O on Mt. Hasi integrated the δ18O signal of precipitation on a large scale [25].

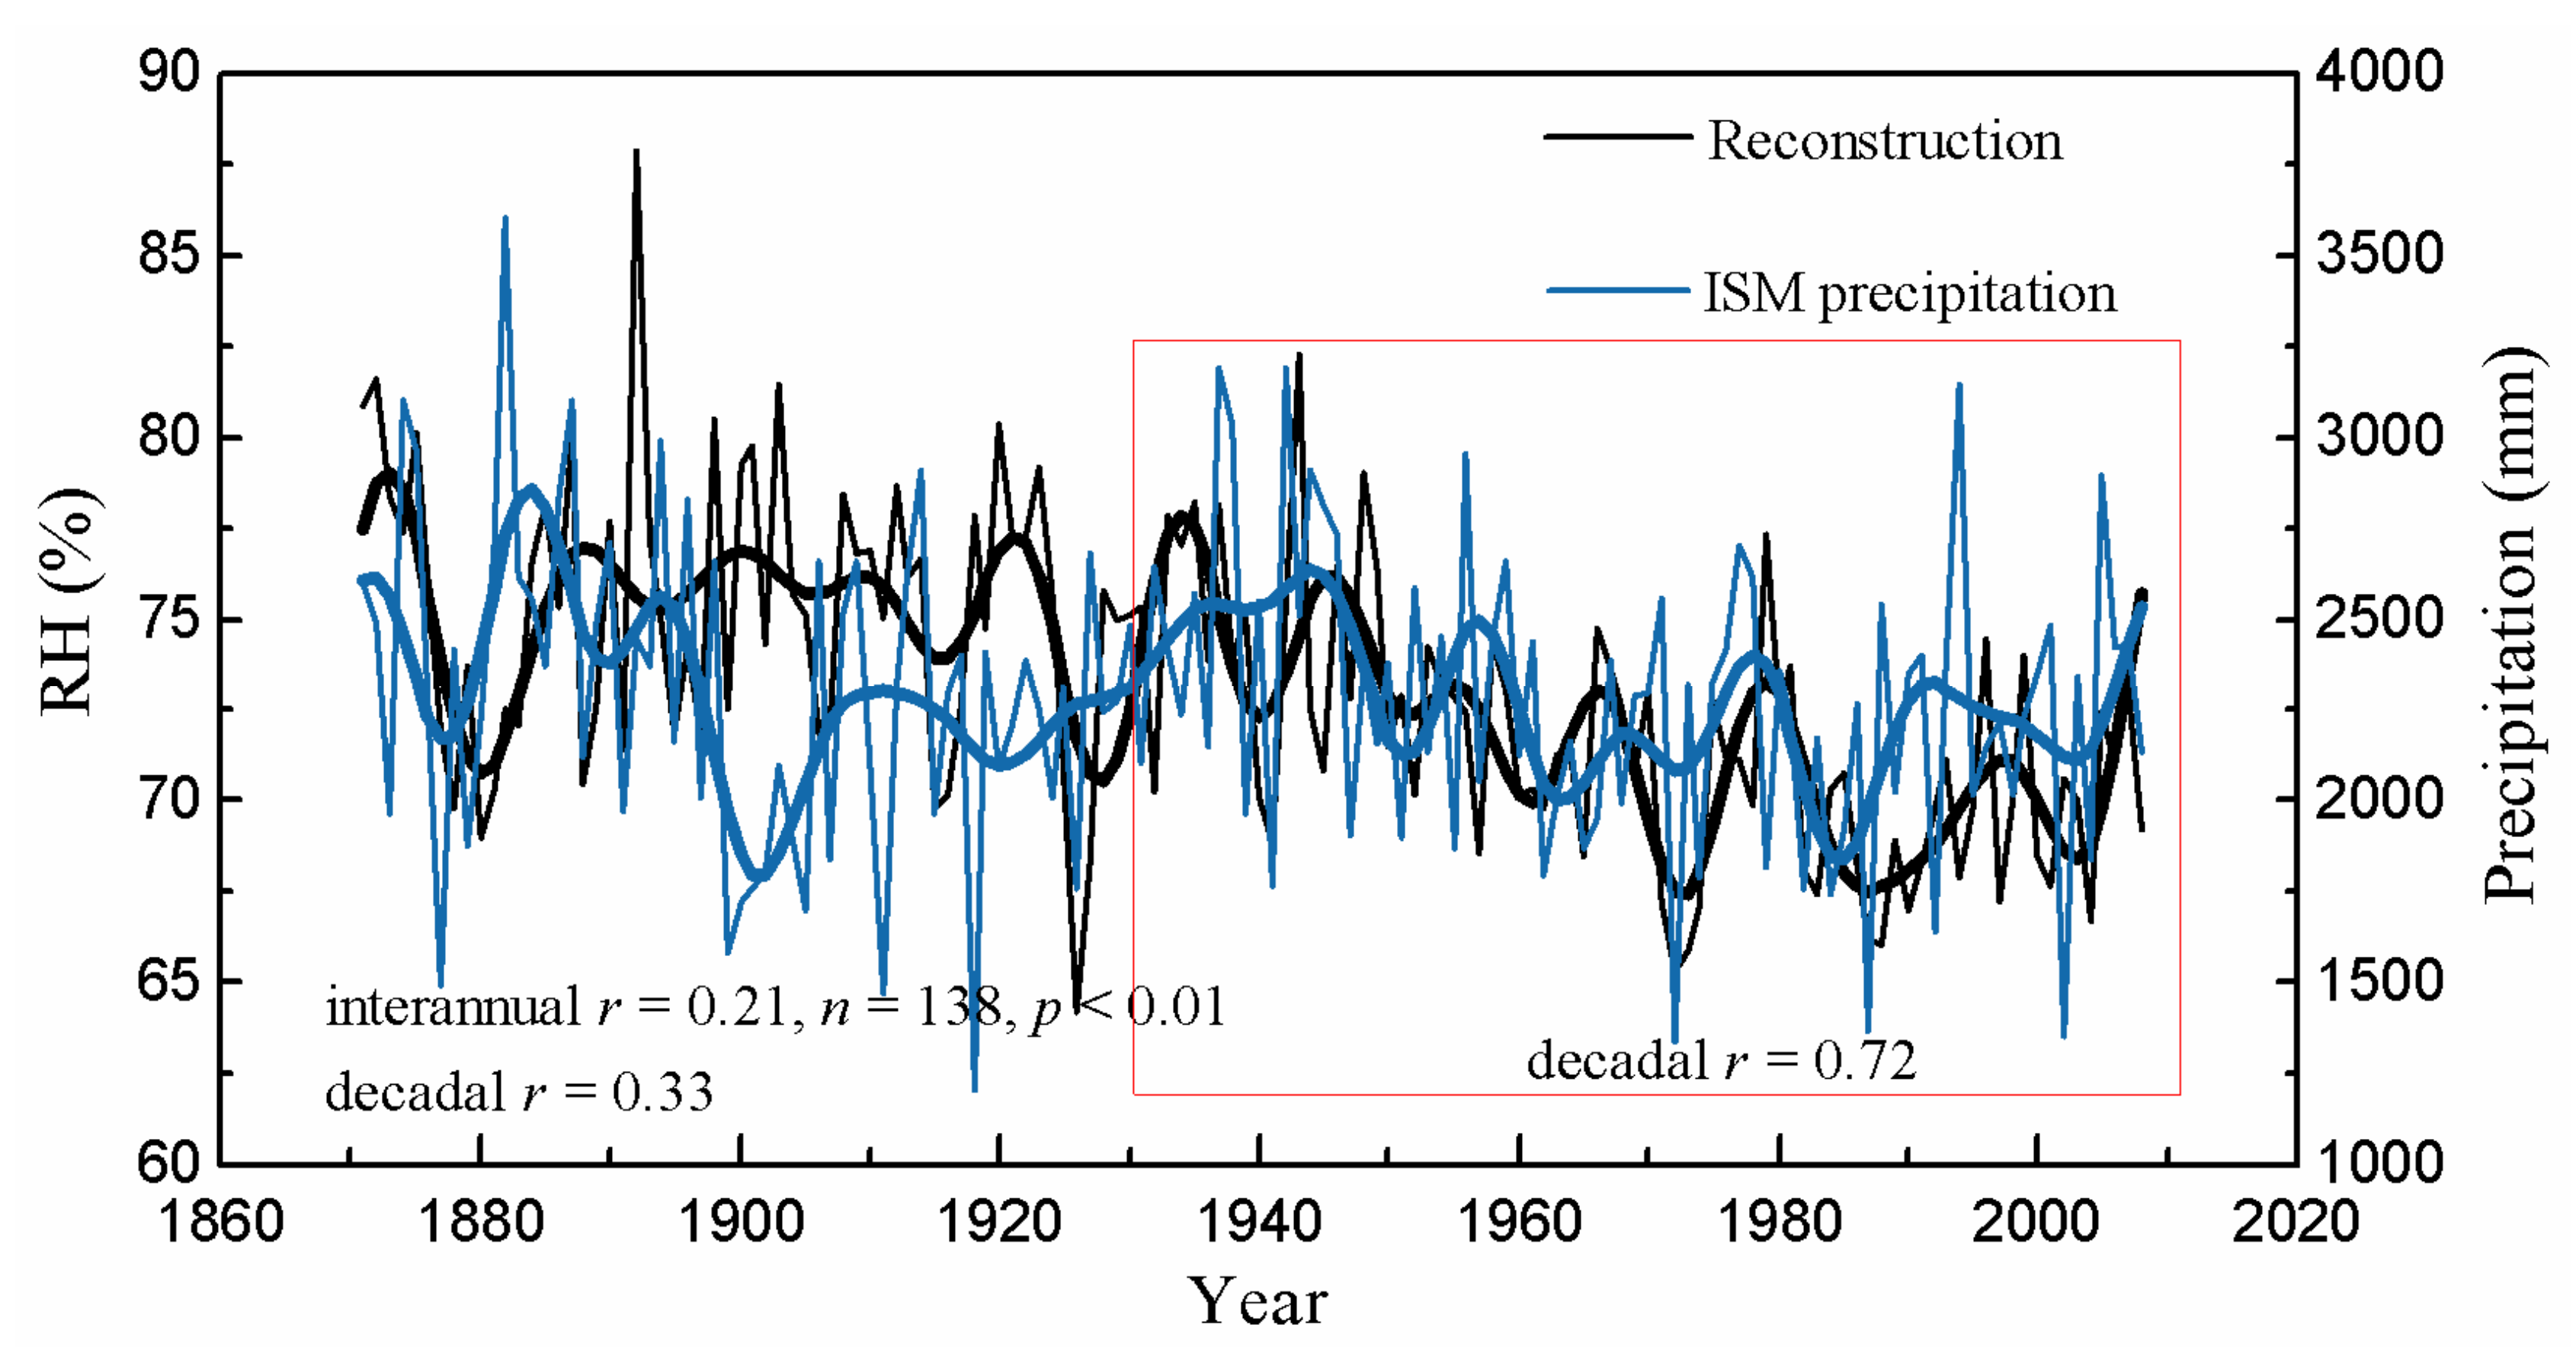
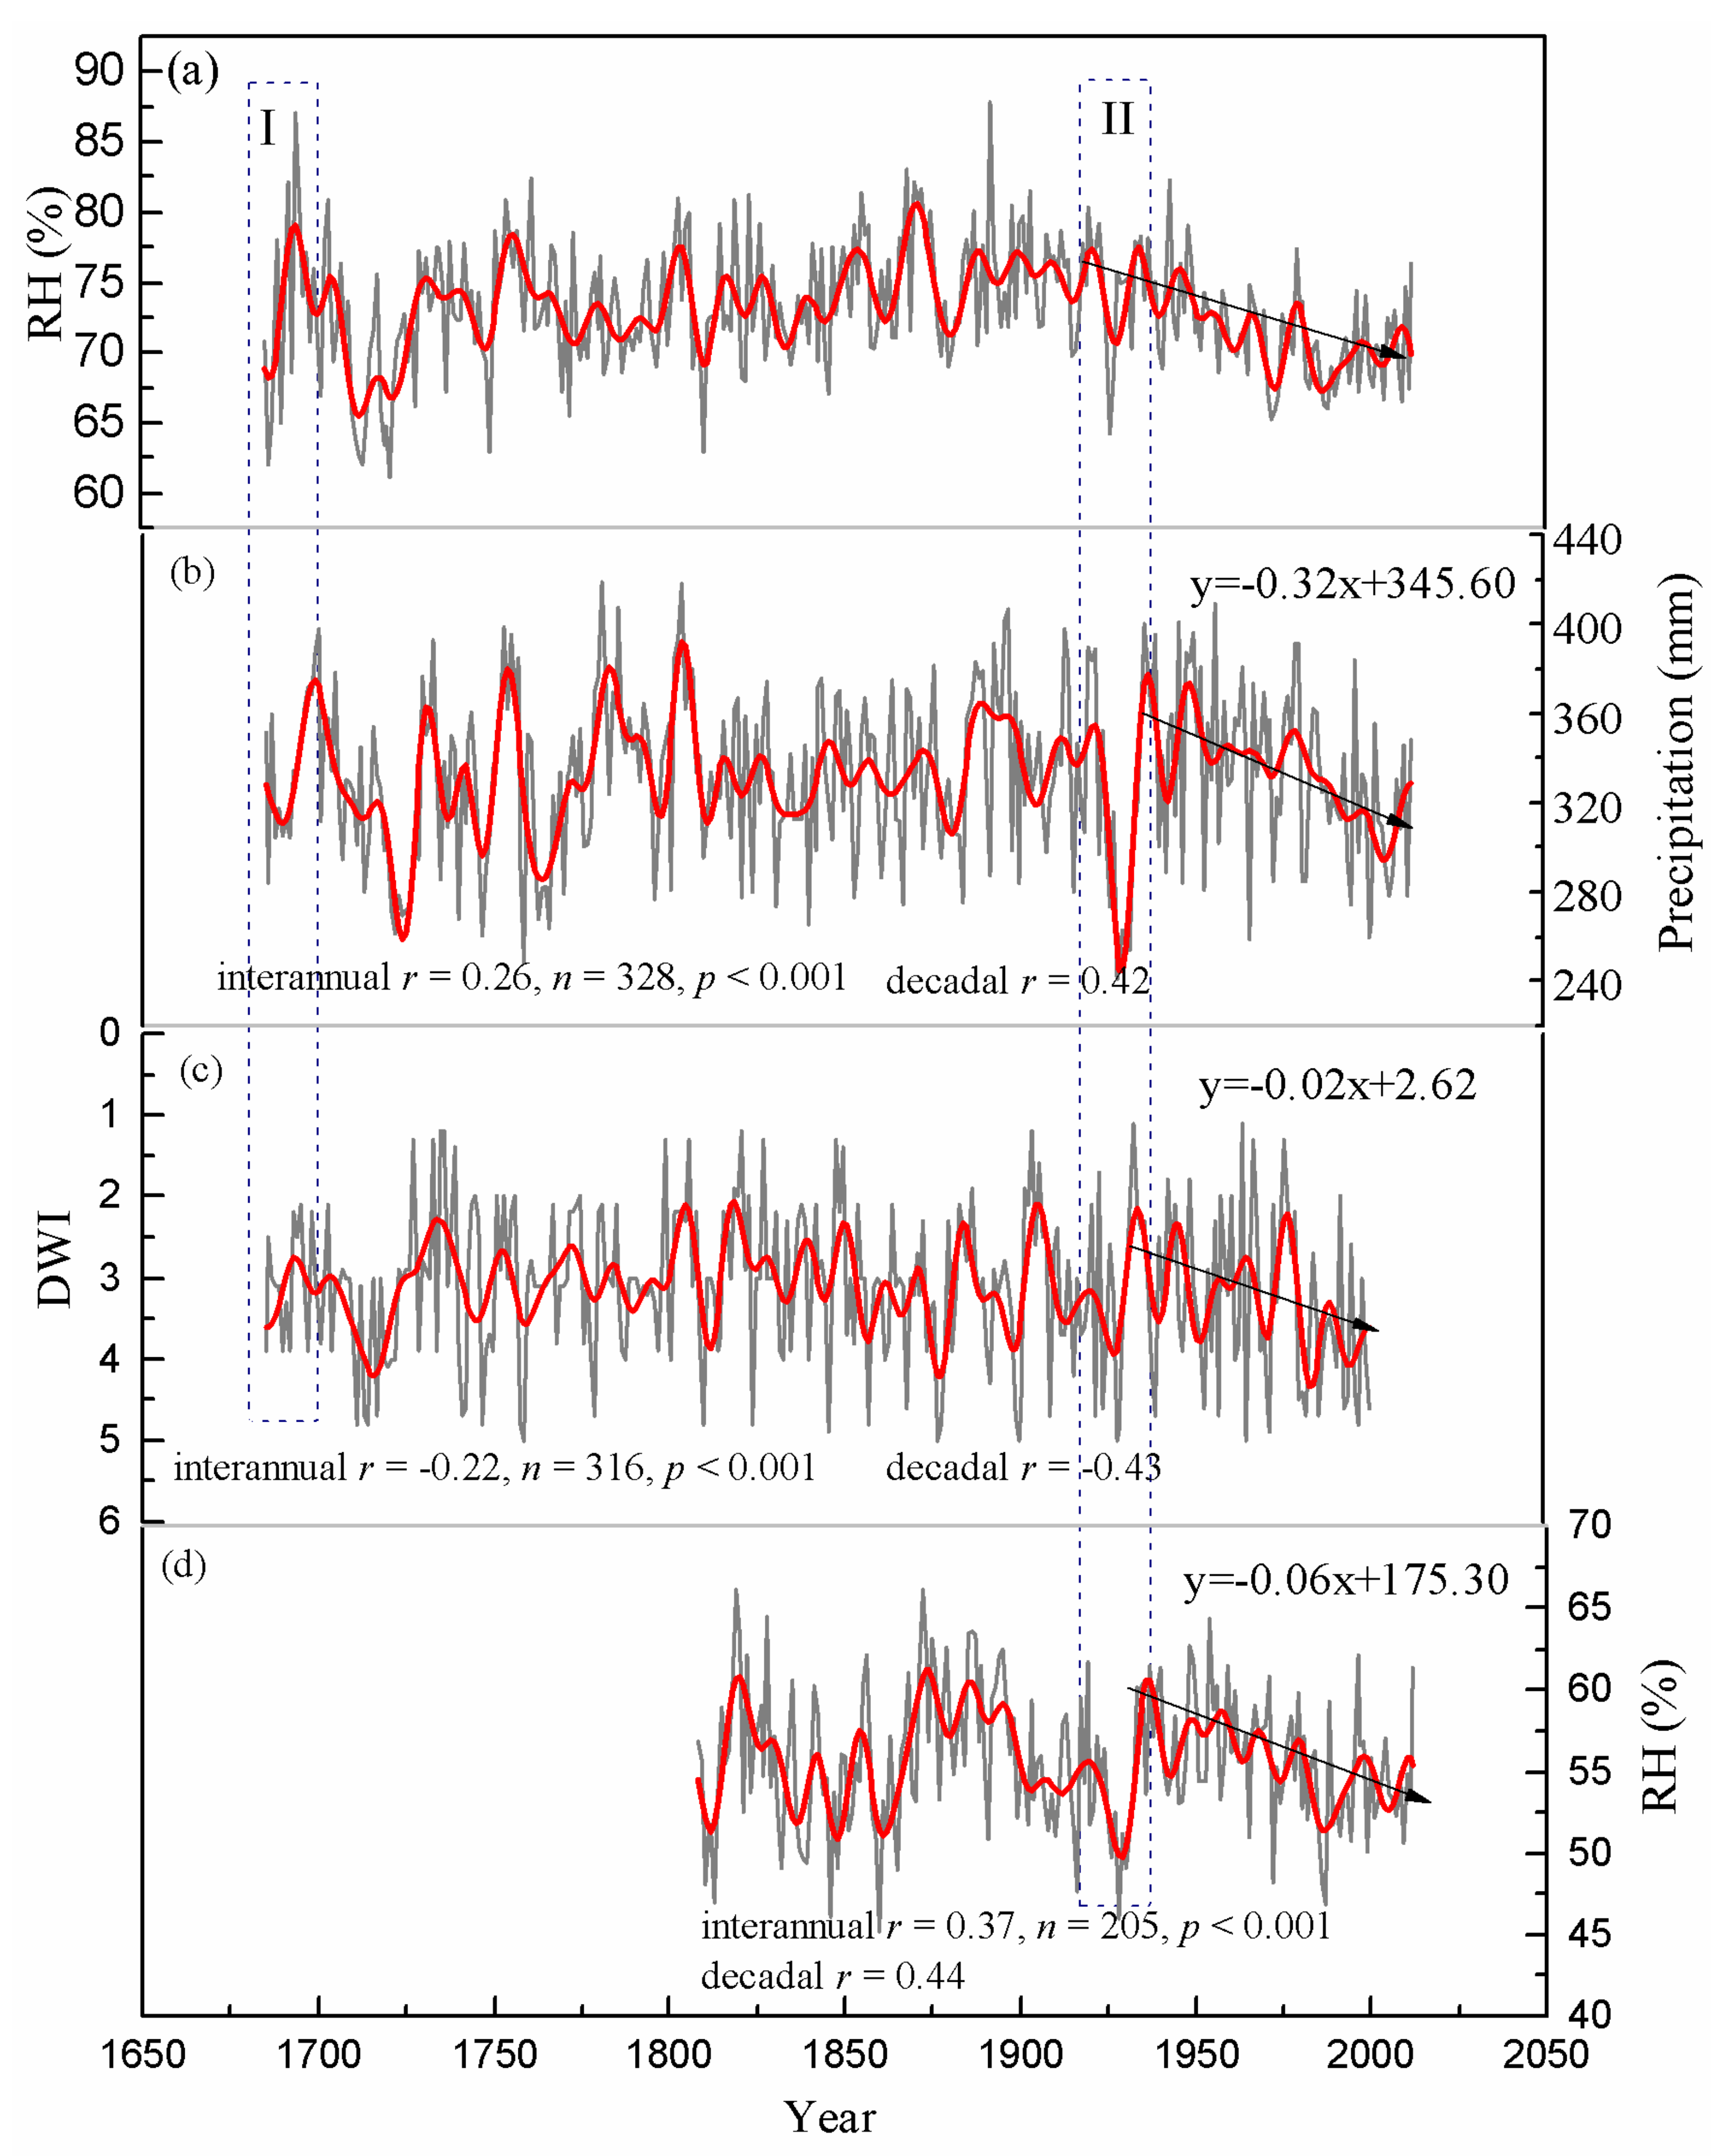
4.2. Variation Features of RH Reconstruction in the Mt. Hasi Region and Its Relationship with ASM

Our reconstruction is shown in Figure 6. The mean RHJA was 73.10% and the standard deviation (σ) was 4.41%. Anextremely dry year was defined as one with a humidity value lower than the mean − 1σ (68.69%), and an extremely wet year as having a value higher than the mean + 1σ (77.51%). In the past 328 years, there were 48 extremely dry years and 55 extremely wet years. From 1930 to 2012, there were only 5 extremely wet years, but 20 extremely dry years, accounting for 24.10% of the period, indicating the trend of aridification. This trend was also evident in Mt. Xinglong precipitation reconstruction [18], Mt. Yaoshan and Mt. Shimen RH reconstruction [24,25]. All these results suggest that the aridification tendency is widespread in NC.
Although Mt. Hasi is located in northwest China, it is still within the monsoon area. The ASM system contains the East Asian summer monsoon (EASM) and the South Asian summer monsoon (SASM, Indian summer monsoon), which are independent but interplay with each other [7]. The ASM usually affects the coast of southern China in early March, and then moves northward in two ways: gradual and rapid. It reaches the north of the Yellow River in July, which is the peak period of the ASM. In early September, it begins to retreat from north to south and wholly withdrawn in mid-October. The precipitation from July to August in NC is mostly affected by the strength of the ASM. Considering that the mean precipitation controls RHJA in this region, RHJA should have a connection with the ASMs. We calculated the correlations between RHJA and several representative EASM indices [42,43] and SASM indices [44,45]. The results showed that the reconstructed sequence was significantly positively correlated with the ASMs (Table 5).
Next, we focused on SASM as an example for further analysis. Although the seasonal precipitation over South Asia shows complicated patterns, the Indian summer monsoon rainfall time series can represent the index of Indian Summer Monsoon (ISM) intensity on interannual timescales [46]. Therefore, we selected the summer core-monsoon Indian rainfall (1871–2008 CE) data to represent the ISM intensity variations and compare with the reconstructed RHJA sequence (Figure 10).
The two series were significantly positively correlated with r = 0.21 (n = 138, p < 0.01), and the decadal correlation coefficient was 0.33. In particular, for the 1930–2008 CE period (the red border area in Figure 10), the decadal correlation coefficient was 0.72. A possible reason for this is that the relation between water transport from the ISM and that over East Asia in NC is an antiphase relationship [47]. Since the 1930s, ASM seems to have been weakening, ISM water vapor transmission is weak and more ISM moisture reaches East Asia, meaning that the correlation between NC monsoon precipitation and ISM will increase. There is a close relationship between the ISM water vapor transport and the intensity of the western Pacific subtropical high in its southwestern part; the weaker (stronger) the ISM water vapor transport, the stronger (weaker) the western Pacific subtropical high in its southwestern part, which leads to more (less) water vapor being transported to East Asia [47]. We demonstrated that the reconstructed RHJA series had a significant positive correlation with ASM from multiple angles (Table 5 and Figure 10), and it represented the intensity variations of ASM on a large time scale. This relationship could be explained by the strong monsoon bringing more precipitation and thus high humidity, and vice versa [7].
The extremely dry period in the last three centuries was 1710–1720 CE, and 1713 (reconstructed RHJA was 62.03%) was the driest year. According to the historical records, Jiuquan, Ganzhou, and Dongle experienced a drought in summer and autumn in 1713. Pingliang, Jingzhou, and Huating were extremely dry, crops were not harvested, and the people starved to death. Jingyuan suffered drought, the government exempted people from taxation and distributed food [48]. The wettest period was from 1865 to 1870. Two flood events were recorded in1867 (reconstructed RHJA was 77.35%) and 1868 (reconstructed RHJA was 83.03%). According to the literature, “In the summer of 1868, heavy rain from July to mid-August, and the Yellow River flooded many houses and farmland” [48].
Since the mean precipitation from July to August controls RHJA in the study area, we calculated the spatial correlation between RHJA and global grid precipitation CRUTS 4.03 in 1958–2012 CE (Figure 11). The significant spatial correlation covered central Gansu Province, northern Ningxia, northern Shaanxi, and central Inner Mongolia. This result indicated that our reconstruction was able to represent the summer hydrological climate variations over a vast region in NC. Additionally, several paleoclimate reconstructions have been published near our study area, which provided an excellent opportunity to verify our reconstruction sequence and obtain more information about climate changes. The reconstructed RHJA was in reasonable agreement with the tree-ring-based reconstruction of precipitation from previous-year July to current-year June on the western Loess Plateau (r = 0.26, n = 328, p < 0.001) [49], and the decadal correlation coefficient was 0.42 (Figure 12b). We also compared our reconstruction with the nearest dryness/wetness index (DWI, 38°45′ N, 106°15′ E) [50] from 1685 to 2000 (Figure 12c), and the two series were significantly negatively correlated with r = −0.22 (n = 316, p < 0.001). Moreover, our reconstruction was significantly positively correlated with the tree-ring δ18O-based RHJJA reconstruction in Ordos [7] with r = 0.37 (n = 205, p < 0.001). After a 10-year low-pass filtering process, these correlations all increased. We noted the drying trends in all sequences since 1930, which also existed in other hydroclimate records in NC [51] and South China [52]. All these results indicate that the weakening of the ASM since the 1930s is a widespread climate phenomenon, which can be attributed to anthropogenic aerosol [53]. The aerosol emissions from Asia alone can affect the intensity of the global summer monsoon, mainly limited to the East Asia because of its proximity to the emission source. Liu [49] reconstructed the regional precipitation on the Loess Plateau and based on modeling results, put forward the suggestion that the weakening trend of ASM from 1934–2013 was mainly caused by increasing anthropogenic aerosol emissions.

4.3. Exploration of the Juvenile Effect

Studies on the juvenile effect of tree-ring stable isotope series have been mostly based on empirical analyses, and the mechanism is still being explored [54]. It is known that tree-ring width series can be influenced by the juvenile effect, because the growth of a tree is not only affected by external climate changes, but also controlled by its genetic characteristics. Therefore, the ring-width sequence also contains physiological information about the tree. The ring width is relatively narrow when the tree is young, and then increases rapidly with tree age, until it declines again after a maximum. As for whether the juvenile effect affects δ18O series, this remains unclear. There was no juvenile effect found in the oak cellulose δ18O in western France, but there was a pronounced juvenile effect in its δ13C and width series [55,56]. Leavitt [57] found that the tree-ring δ13C exhibited a downward trend in the early period of tree growth, but cellulose δ18O did not. The tree-ring δ18O values of young juniper trees exhibited a juvenile effect in northern Pakistan [20]. Labuhn [58] reported that the δ18O of young oak trees in southwestern France showed a 2‰ upward trend during the first 30 years. In contrast, the δ18O values of pines in Spain changed by −0.089‰ every 10 years in the first 100 years [21]. In NC, most results to date show that cellulose δ18O values have no noticeable juvenile effect [7,51,59]. We found a downward trend (−0.07‰/year) in the first 20 years (1685–1705 CE); whether this was the effect of climate signals or the existence of the juvenile effect, it was important to differentiate this for accurate climate research.
We hypothesized that the downward trend of cellulose δ18O was caused by actual climate changes, and that from 1685 to 1705, there must have been a process of RH increase in the study area, because the tree-ring δ18O was significantly negatively correlated with RH (Figure 4). This wetting process was captured by the surrounding paleoclimate reconstructions (area I in Figure 12). For example, the ring width-based reconstruction on the western Loess Plateau exhibited a 2.75 mm/year increase from 1685 to 1705 (Figure 12b). The nearest grid point of DWI (38°45′ N, 106°15′ E) showed a downward trend of 0.005/year (Figure 12c). We also prepared a short sample (32B) to verify whether there was a juvenile effect in the tree-ring cellulose δ18O in this study (Figure 3). As shown in Table 1, 32B and the other three cores showed similar variations at the common interval (1914–2012 CE), the correlation coefficients were between 0.65 and 0.69. This was a further evidence indicating that our δ18O chronology was not affected by the juvenile effect. Additionally, during the young period (1914–1934 CE) of the short core (32B), the RH of the study area followed a pattern of slowly becoming wet first, then rapidly drying, and then quickly becoming wet again. All surrounding reconstructions captured this process (area II in Figure 12). The same dry and wet changes also appeared in the precipitation reconstructionseries of Mt. Helan [26] and Ningwu areas [60]. The above comparisons indicated that the tree-ring δ18O series in this region was not affected by the juvenile effect.

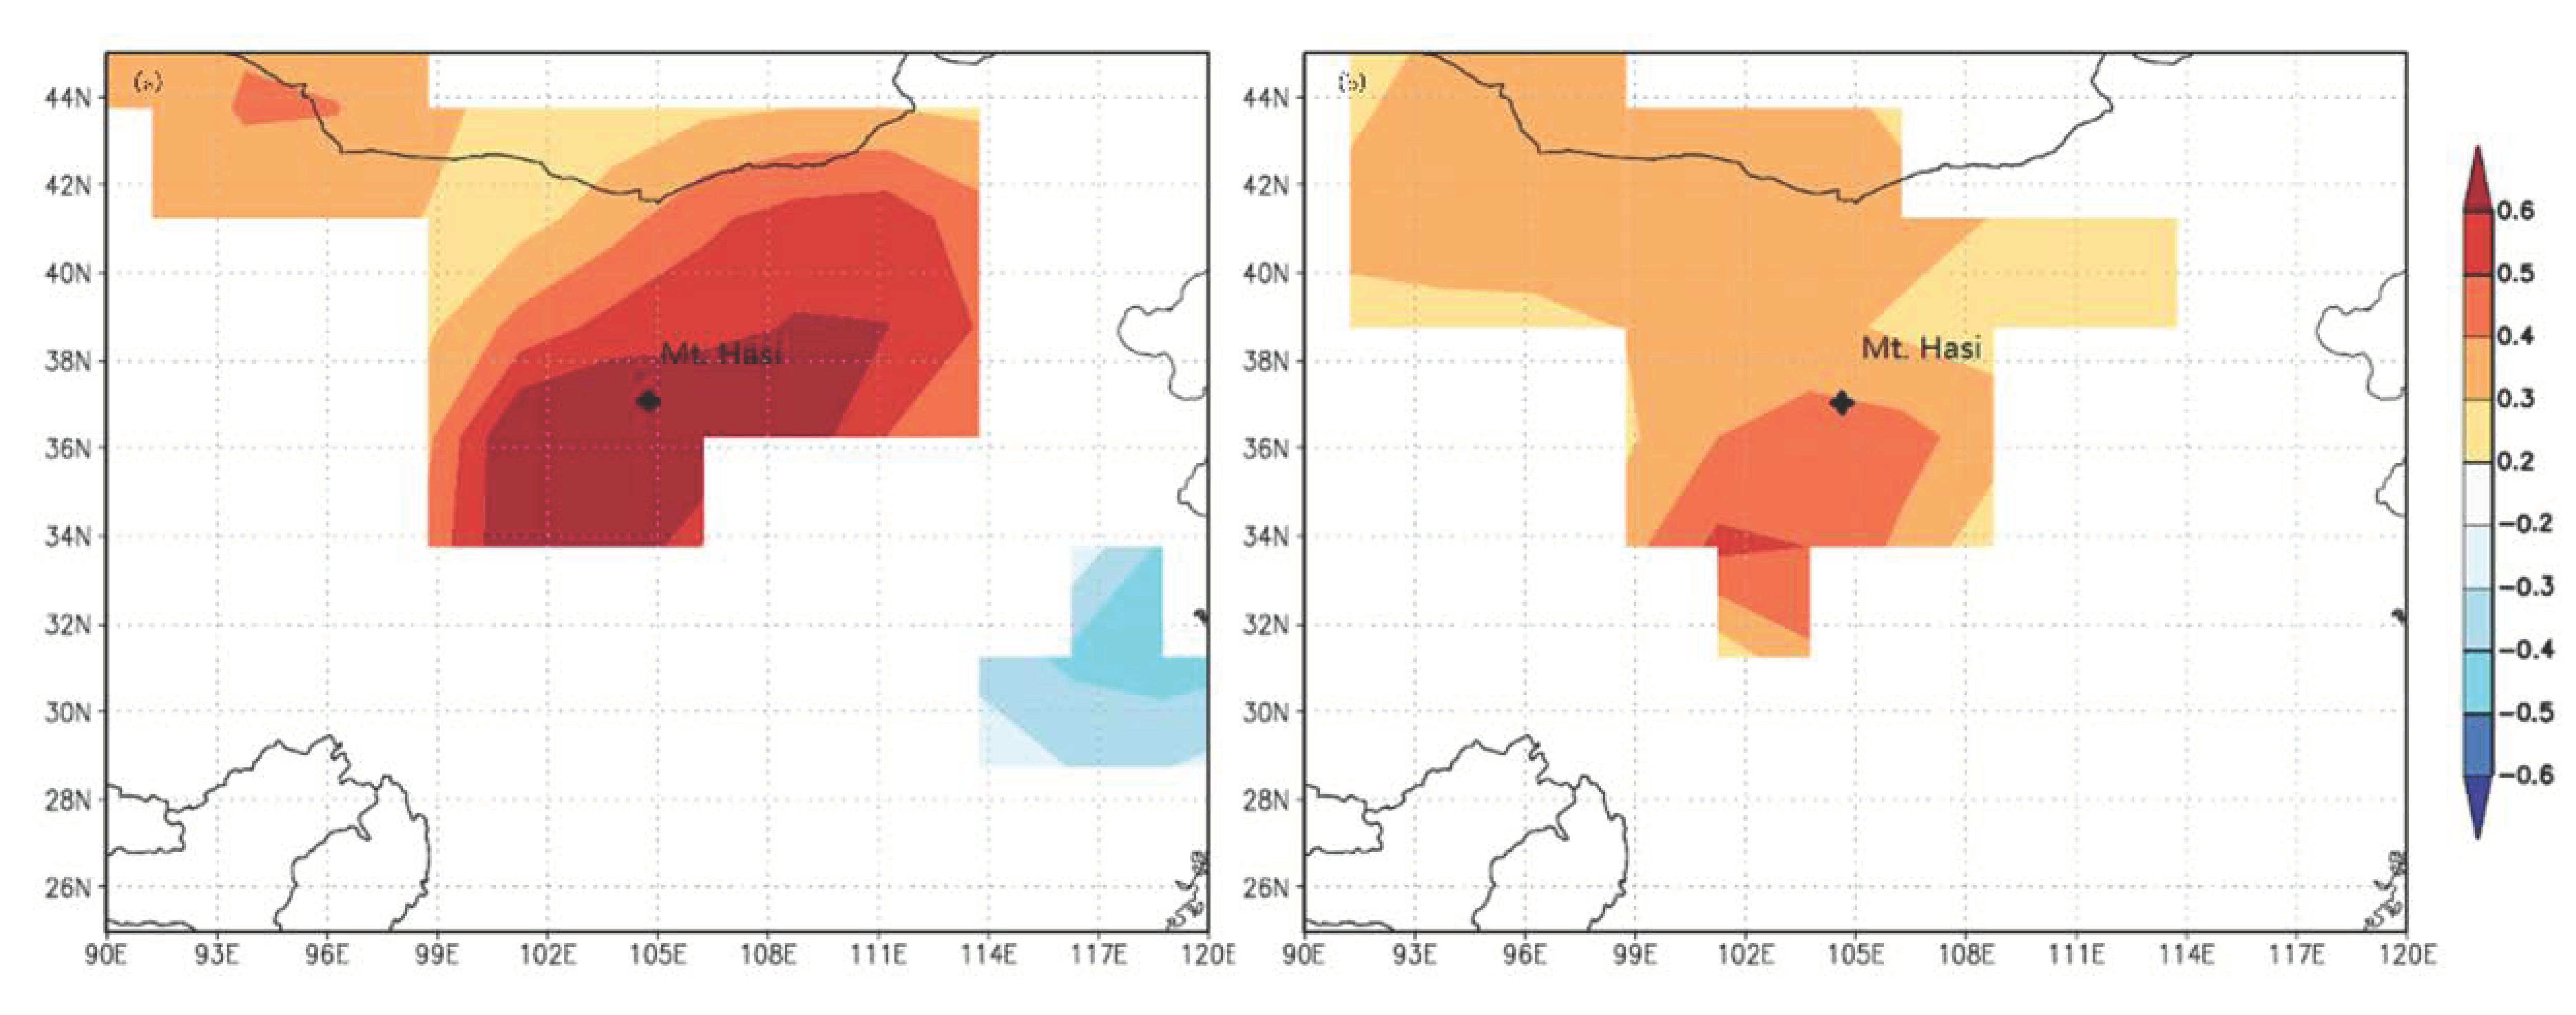
4.4. Possible Factors Affecting RH Changes in the Mt. Hasi Region

We analyzed the periodicities of the reconstructed sequence by MTM method (Figure 7), the 6.3, 5.1–5.2, 4.2–4.3, 3.4–3.5, 3, and 2.5–2.6 quasi-cycles belonged to the ENSO cycle (2–7 years) [61,62,63]. Previous studies have described the evolution of precipitation anomalies influenced by the two action centers of ENSO during the outbreak and recession processes. One of the significant negative correlations affects summer and autumn precipitation in NC. In the developing phase of the El Niño event, convection around the Philippines weakened, and the subtropical high was more southwest, leading to more monsoonal precipitation over the Yangtze–Huaihe River Basin in China, Japan, and South Korea, while the precipitation in NC decreased and the climate was dry. During the attenuation phase of the El Niño, the opposite occurred [64].
ASM and ENSO are inextricably linked [65], and the SST is an indicator of ENSO. We considered that the observed SST data after 1950 was more reliable [66], so we calculated the correlation coefficients between the RHJA sequence and SST, MEI, and SOI (Table 6). Our reconstruction was significantly negatively correlated with NIÑO1+2 and NIÑO3 SST, while the correlations with the NIÑO3.4 and NIÑO4 regions were not as good as East Pacific (EP) regions obviously. Additionally, the 2.8–6.1 cycle in IMF1 and IMF2 (Figure 8, the variance contribution to the RHJA series accounted for 63.29%) also corresponded to the ENSO cycle. All of these results indicate that the ENSO strongly affects the RHJA variations in the Mt. Hasi area. Previous studies used instrumental data to explain the significant negative correlation between NC precipitation and SST in the EP region [1,67], and the key to connect them was a barotropic cyclone over northeast Asia, which comprised two tropical heat sources: one was over South Asia, and another one was over the west of the North Pacific. Anomalous South Asia heating caused a zonal wave pattern over mid-latitude Asia [1], and anomalous western North Pacific heating caused a meridional teleconnection pattern [67]. During the developing phase of ENSO, the cyclone over northeast Asian displaced southwestward, while the anomalies on the west side of the cyclone reduced the water vapor supply to NC, triggering precipitation below the normal level [68].
Although long-term Pacific SST records are not obtainable for the last three centuries, a number of El Niño and La Niña events have been reported [62]. As shown in Table 7, extremely dry years were quite matched with El Niño events, and most of the extremely dry years in NC followed El Niño events that occurred in the previous or current year. In particular, some extreme (E) and very strong (VS) events seemed to influence the climate of NC for the preceding 2 years [68], such as El Niñoin 1718 (E) and 1719 (S) matched with the extremely dry year 1719, and El Niño in 1926 (E) led to the drought in 1926 and 1927. A possible reason for this is that the ENSO events generally last 18–24 months [62]. The relationships between extremely wet years and La Niña events are shown in Table 8. All the above results suggest that ENSO has a considerable influence on hydroclimate variations in NC.
Furthermore, the inter-decadal period of 20–30 years found by MTM and IMF4 (27.3 year, the variance contribution to the reconstructed series is 10.92%) was very close to the PDO cycle. There is a clear relationship between PDO and ENSO in both time and space scales, and the PDO can be regarded as the inter-decadal climate variability of ENSO [69]. PDO is a robust recurring pattern of ocean-atmosphere climate variability with multi-decadal cycles centered over the mid-latitude North Pacific basin [70]. Many studies have reported that the observed PDO has great impacts on climate changes in NC [71,72,73,74]. A comparison between our reconstruction and reconstructed PDO series by MacDonald and Case [75] indicated that there was a close connection over the past three centuries (Figure 13). The correlation was significantly high (r = 0.61, n = 288, p < 0.001) at the inter-decadal scale by using a 25-year moving average because of the 20–30 cycle of PDO [76]. Although the comparison was not very good in some years such as 1920 and 1970, this may be caused by regime shifts of PDO. Overall, PDO has a significant impact on our study area. During the warm phase, the middle and northwest Pacific become cool and EP warms, leading to NC precipitation decrease. During the cool phase, the opposite situation occurs [77,78]. However, the mechanism of this connection is still unclear, which requires more comprehensive observed data for climate simulation and diagnostic analysis.

5. Conclusions

In this study, we reconstructed RHJA variations on Mt. Hasi since 1685 based on tree-ring δ18O. The spatial analysis between RHJA and global grid precipitation data showed that our reconstruction was reliable and able to represent the hydroclimate variations of NC.
Additionally, there was a close link between the RHJA and ASM indices. The results suggested that the RHJA reconstruction on Mt. Hasi reflected the variations of ASM to a large extent. After comparison with surrounding reconstructions, we found that the current aridification trend has been widespread in NC since the 1930s, which characterized the fact that the ASM continues to weaken. The period 1710–1720 CE was the driest period in the last three centuries, and people suffered from droughts, all of which were recorded in historical documents.
ENSO had a certain influence on the climate variations in the monsoon fringe region. Furthermore, EP ENSO had a more profound impact on our study area. PDO could be regarded as the inter-decadal climate variability of ENSO, and the significant positive correlation between RHJA and reconstructed PDO sequence (r = 0.61, n = 288, p < 0.001, smoothed by 25-year moving average) indicated that large-scale atmospheric circulations influenced hydroclimate variations in NC.

Author Contributions

Data curation, Y.W., Y.L., and Q.L.; Formal analysis, Y.W., and C.F.; Methodology, Y.W., H.S., and C.S.; Writing—original draft, Y.W., Y.L., and Q.L.; Writing—review and editing, Y.L. All authors have read and agreed to the published version of the manuscript.

Funding

This study was supported by National Natural Science Foundation of China (41630531), Chinese Academy of Sciences (QYZDJ–SSW–DQC021, XDB40010300, XDA23070202, 2019QZKK0101, and GJHZ1777), State Key Laboratory of Loess and Quaternary Geology, Institute of Earth Environment, CAS (SKLLQG1833).

Conflicts of Interest

The authors declare no conflict of interest.

References

  1. Wu, R.G.; Wang, B. A contrast of the East Asian Summer Monsoon-ENSO relationship between 1962–77 and 1978–93. J. Clim. 2002, 15, 3266–3279. [Google Scholar] [CrossRef] [Green Version]
  2. Ding, Q.H.; Wang, B. Intraseasonal teleconnection between the summer Eurasian Wave Train and the Indian Monsoon. J. Clim. 2007, 20, 3751–3767. [Google Scholar] [CrossRef]
  3. Zhou, M.; Tian, F.; Lall, U.; Hu, H. Insight from a joint analysis of Indian and Chinese monsoon rainfall data. Hydrol. Earth Syst. Sci. 2011, 15, 2709–2715. [Google Scholar] [CrossRef] [Green Version]
  4. An, Z.S. The history and variability of the East Asian paleomonsoon climate. Quat. Sci. Rev. 2000, 19, 171–187. [Google Scholar] [CrossRef]
  5. Li, H.M.; Dai, A.G.; Zhou, T.J.; Lu, J. Responses of east Asian summer monsoon to historical SST and atmospheric forcing during 1950–2000. Clim. Dyn. 2010, 34, 501–514. [Google Scholar] [CrossRef] [Green Version]
  6. Zhao, P.; Zhou, Z.J.; Liu, J.P. Variability of Tibetan spring snow and its associations with the hemispheric extratropical circulation and East Asian summer monsoon rainfall: An observational investigation. J. Clim. 2007, 20, 3942–3955. [Google Scholar] [CrossRef]
  7. Liu, Y.; Wang, L.; Li, Q.; Cai, Q.F.; Song, H.M.; Sun, C.F.; Liu, R.S.; Mei, R.C. Asian summer monsoon-related relative humidity recorded by tree ring δ18O during last 205 years. J. Geophys. Res. Atmos. 2019, 124, 9824–9838. [Google Scholar] [CrossRef]
  8. Shao, X.M.; Xu, Y.; Yin, Z.Y.; Liang, E.Y.; Zhu, H.; Wang, S. Climatic implications of a 3585-year tree-ring width chronology from the northeastern Qinghai-Tibetan Plateau. Quat. Sci. Rev. 2010, 29, 2111–2122. [Google Scholar] [CrossRef]
  9. Liu, Y.; Wang, C.Y.; Hao, W.J.; Song, H.M.; Cai, Q.F.; Tian, H.; Sun, B.; Linderholm, H.W. Tree-ring-based annual precipitation reconstruction in Kalaqin, Inner Mongolia for the last 238 years. Chin. Sci. Bull. 2011, 56, 2995–3002. [Google Scholar] [CrossRef] [Green Version]
  10. Mann, M.E.; Fuentes, J.D.; Rutherford, S. Underestimation of volcanic cooling in tree-ring-based reconstructions of hemispheric temperatures. Nat. Geosci. 2012, 5, 202–205. [Google Scholar] [CrossRef]
  11. Cook, E.R.; Krusic, P.J.; Anchukaitis, K.J.; Buckley, B.M.; Nakatsuka, T.; Sano, M. Tree-ring reconstructed summer temperature anomalies for temperate East Asia since 800 CE. Clim. Dyn. 2013, 41, 2957–2972. [Google Scholar] [CrossRef] [Green Version]
  12. Gou, X.H.; Deng, Y.; Gao, L.L.; Chen, F.H.; Cook, E.; Yang, M.X.; Zhang, F. Millennium tree-ring reconstruction of drought variability in the eastern Qilian Mountains, north-west China. Clim. Dyn. 2015, 45, 1761–1770. [Google Scholar] [CrossRef] [Green Version]
  13. Liang, E.Y.; Shao, X.M.; Qin, N.S. Tree-ring based summer temperature reconstruction for the source region of the Yangtze river on the Tibetan plateau. Glob. Planet. Chang. 2008, 61, 313–320. [Google Scholar] [CrossRef]
  14. McCarroll, D.; Loader, N.J. Stable isotopes in tree rings. Quat. Sci. Rev. 2004, 23, 771–801. [Google Scholar] [CrossRef]
  15. Liu, Y.; Wang, R.Y.; Leavitt, S.W.; Song, H.M.; Linderholm, H.W.; Li, Q.; An, Z.S. Individual and pooled tree-ring stable-carbon isotope series in Chinese pine from the Nan Wutai region, China: Common signal and climate relationships. Chem. Geol. 2012, 330, 17–26. [Google Scholar] [CrossRef]
  16. Liu, X.H.; Zeng, X.M.; Leavitt, S.W.; Wang, W.; An, W.; Xu, G.; Sun, W.; Yang, Y.; Qin, D.; Ren, J. A 400-year tree-ring δ18O chronology for the southeastern Tibetan Plateau: Implications for inferring variations of the regional hydroclimate. Glob. Planet. Chang. 2013, 104, 23–33. [Google Scholar] [CrossRef]
  17. Liu, Y.; Lei, Y.; Sun, B.; Song, H.M.; Li, Q. Annual precipitation variability inferred from tree-ring width chronologies in the Changling-Shoulu region, China, during AD 1853–2007. Dendrochronologia 2013, 31, 290–296. [Google Scholar] [CrossRef]
  18. Liu, Y.; Sun, B.; Song, H.M.; Lei, Y.; Wang, C.Y. Tree-ring based precipitation reconstruction for Mt. Xinglong, China, since AD 1679. Quat. Int. 2003, 283, 46–54. [Google Scholar] [CrossRef]
  19. Qin, C.; Yang, B.; Brauning, A.; Griessginger, J.; Wernicke, J. Drought signals in tree-ring stable oxygen isotope series of Qilian juniper from the arid northeastern Tibetan Plateau. Glob. Planet. Chang. 2015, 125, 48–59. [Google Scholar] [CrossRef]
  20. Treydte, K.S.; Schleser, G.H.; Helle, G.; Frank, D.C.; Winiger, M.; Haug, G.H.; Esper, J. The twentieth century was the wettest period in the northern Pakistan over the past millennium. Nature 2006, 440, 1179–1182. [Google Scholar] [CrossRef] [PubMed]
  21. Esper, J.; Frank, D.C.; Battipaglia, G.; Buntgen, U.; Holert, C.; Treydte, K.; Siegwolf, R.; Saurer, M. Low-frequency noise in δ13C and δ18O tree ring data: A case study of Pinusuncinata in Spanish Pyrenees. Glob. Biogeochem. Cycles 2010, 24, 1–11. [Google Scholar] [CrossRef] [Green Version]
  22. Szymczak, S.; Joachimski, M.M.; Bräuning, A.; Hetzer, T.; Kuhlemann, J. Are pooled tree ring δ13C and δ18O series reliable climate archives? A case study of Pinusnigraspp. laricio. Chem. Geol. 2012, 308, 40–49. [Google Scholar] [CrossRef]
  23. Wang, B.; Liu, J.; Kim, H.J.; Webster, P.J.; Yim, S.Y.; Xiang, B.Q. Northern hemisphere summer monsoon intensified by mega-El Niño/Southern Oscillation and Atlantic multidecadal oscillation. Proc. Natl. Acad. Sci. USA 2013, 110, 5347–5352. [Google Scholar] [CrossRef] [PubMed] [Green Version]
  24. Liu, Y.; Liu, H.; Song, H.M.; Li, Q.; Burr, G.S.; Wang, L.; Hu, S.L. A monsoon-related 174-year relative humidity record from tree-ring δ18O in the Yaoshan region, eastern central China. Sci. Total Environ. 2017, 593, 523–534. [Google Scholar] [CrossRef]
  25. Liu, Y.; Ren, M.; Li, Q.; Song, H.M.; Liu, R.S. Tree-ring δ18O-based July–August relative humidity reconstruction on Mt. Shimen, China, for the last 400 years. Atmos. Res. 2020, 243, 105024. [Google Scholar] [CrossRef]
  26. Liu, Y.; Cai, Q.F.; Shi, J.F.; Hughes, M.K.; Kutzbach, J.E.; Liu, Z.Y.; Ni, F.; An, Z. Seasonal precipitation in the south-central Helan Mountain region, China, reconstructed from tree-ring width for the past 224 years. Can. J. For. Res. 2005, 35, 2403–2412. [Google Scholar] [CrossRef]
  27. Liu, Y.; Sun, J.Y.; Song, H.M.; Cai, Q.F.; Bao, G.; Li, X.X. Tree-ring hydrologic reconstructions for the Heihe river watershed, western China since AD 1430. Water Res. 2010, 44, 2781–2792. [Google Scholar] [CrossRef]
  28. Ma, Y.Y.; Liu, Y.; Song, H.M.; Sun, J.Y.; Lei, Y.; Wang, Y.C. A standardized precipitation evapotranspiration index reconstruction in the Taihe mountains using tree-ring widths for the last 283 years. PLoS ONE 2015, 10, 7. [Google Scholar] [CrossRef]
  29. Holmes, R.L. Computer-assisted quality control in tree-ring dating and measurement. Tree-Ring Bull. 1983, 43, 69–75. [Google Scholar]
  30. Cook, E.R. A Time-Series Analysis Approach to Tree-Ring Standardization. Ph.D. Thesis, The University of Arizona, Tucson, AZ, USA, 1985. [Google Scholar]
  31. Cai, Q.F.; Liu, Y.; Qian, H.J.; Liu, R.S. Inverse effects of recent warming on trees growing at the low and high altitudes of the Dabie Mountains, subtropical China. Dendrochronologia 2020, 59, 125649. [Google Scholar] [CrossRef]
  32. Loader, N.J.; Robertson, I.; McCarroll, D. Comparison of stable carbon isotope ratios in the whole wood, cellulose and lignin of oak tree-rings. Palaeogeogr. Palaeoclimatol. Palaeoecol. 2003, 196, 395–407. [Google Scholar] [CrossRef]
  33. Wigley, T.M.L.; Briffa, K.R.; Jones, P.D. On the average of correlated time series, with applications in dendroclimatology and hydrometeorology. J. Appl. Meteorol. Climatol. 1984, 23, 201–213. [Google Scholar] [CrossRef]
  34. Fritts, H.C. Tree Rings and Climate; Academic Press: London, UK, 1976; pp. 1–529. ISBN 978-0-12-268450-0. [Google Scholar]
  35. Cook, E.R.; Meko, D.M.; Stahle, D.W.; Cleaveland, M.K. Drought reconstruction for the continental United States. J. Clim. 1999, 12, 1145–1162. [Google Scholar] [CrossRef] [Green Version]
  36. Thomson, D.J. Spectrum estimation and harmonic-analysis. Proc. IEEE 1982, 70, 1055–1096. [Google Scholar] [CrossRef] [Green Version]
  37. Huang, N.E.; Shen, Z.; Long, S.R.; Wu, M.L.C.; Shi, H.H.; Zheng, Q.N.; Yen, N.-C.; Tung, C.C.; Liu, H.H. The empirical mode decomposition and the Hilbert spectrum for nonlinear and non-stationary time series analysis. Proc. R. Soc. Lond. 1998, 454, 903–995. [Google Scholar] [CrossRef]
  38. Roden, J.S.; Lin, G.H.; Ehleringer, J.R. A mechanistic model for interpretation of hydrogen and oxygen isotope ratios in tree-ring cellulose. Geochim. Cosmochim. Acta 2000, 64, 21–35. [Google Scholar] [CrossRef]
  39. Xu, G.B.; Liu, X.H.; Trouet, V.; Treydte, K.; Wu, G.; Chen, T.; Sun, W.; An, W.; Wang, W.; Zeng, X.; et al. Regional drought shift (1710–2010) in East Central Asia and linkages with atmospheric circulation recorded in tree-ring δ18O. Clim. Dyn. 2019, 52, 713–727. [Google Scholar] [CrossRef] [Green Version]
  40. Durbin, J.; Watson, G.S. Testing for serial correlation in least squares regression. Biometrika 1951, 58, 1–19. [Google Scholar]
  41. Dansgaard, W. Stable isotopes in precipitation. Tellus 1964, 16, 436–468. [Google Scholar] [CrossRef]
  42. Zhu, C.W.; He, J.H.; Wu, G.X. East Asian monsoon index and its interannual relationship with largescale thermal dynamic circulation. Acta Meteorol. Sin. 2000, 58, 4. [Google Scholar]
  43. Huang, G.; Yan, Z.W. The East Asian summer monsoon circulation anomaly index and its interannual variations. Chin. Sci. Bull. 1999, 44, 1325–1329. [Google Scholar] [CrossRef]
  44. Webster, P.J.; Yang, S. Monsoon and ENSO: Selectively Interactive Systems. Q. J. R. Meteorol. Soc. 1992, 118, 877–926. [Google Scholar] [CrossRef]
  45. Li, J.P.; Zeng, Q.C. A unified monsoon index. Geophys. Res. Lett. 2002, 29, 1274. [Google Scholar] [CrossRef]
  46. Sinha, A.; Kathayat, G.; Cheng, H.; Breitenbach, S.F.; Berkelhammer, M.; Mudelsee, M.; Biswas, J.; Edwards, R.L. Trends and oscillations in Indian summer monsoon rainfall over the last two millennia. Nat. Commun. 2015, 6, 6309. [Google Scholar] [CrossRef] [PubMed] [Green Version]
  47. Zhang, R.H. Relations of water vapor transport from Indian monsoon with that over East Asia and the summer rainfall in China. Adv. Atmos. Sci. 2001, 18, 1005–1017. [Google Scholar]
  48. Dong, A.X. The Compilation of China Meteorological Disaster Canon; China Meteorological Press: Beijing, China, 2005; pp. 109–110. ISBN 7-5029-3939-3. (In Chinese) [Google Scholar]
  49. Liu, Y.; Cai, W.J.; Sun, C.F.; Song, H.M.; Cobb, K.M.; Li, J.; Leavitt, S.W.; Wu, L.; Cai, Q.; Liu, R.; et al. Anthropogenic aerosols cause recent pronounced weakening of Asian Summer Monsoon relative to last four Centuries. Geophys. Res. Lett. 2019, 46, 5469–5479. [Google Scholar] [CrossRef] [Green Version]
  50. Shen, C.M.; Wang, W.C.; Hao, Z.X.; Gong, W. Characteristics of anomalous precipitation events over eastern China during the past five centuries. Clim. Dyn. 2008, 31, 463–476. [Google Scholar] [CrossRef]
  51. Liu, Y.; Cai, Q.F.; Liu, W.G.; Yang, Y.K.; Sun, J.Y.; Song, H.M.; Li, X.X. Monsoon precipitation variation recorded by tree-ring δ18O in arid northwest China since 1878. Chem. Geol. 2008, 252, 56–61. [Google Scholar] [CrossRef]
  52. Liu, Y.; Cobb, K.M.; Song, H.M.; Li, Q.; Li, C.Y.; Nakatsuka, T.; An, Z.S.; Zhou, W.J.; Cai, Q.F.; Liu, J.; et al. Recent enhancement of central Pacific El Niño variability relative to last eight centuries. Nat. Commun. 2017, 8, 15386. [Google Scholar] [CrossRef] [Green Version]
  53. Cowan, T.; Cai, W. The impact of Asian and non-Asian anthropogenic aerosols on 20th century Asian summer monsoon. Geophys. Res. Lett. 2011, 38, L11703. [Google Scholar] [CrossRef]
  54. Lipp, J.; Trimbron, P.; Fritz, P.; Moser, H.; Becker, B.; Frenzel, B. Stable isotopes in tree ring cellulose and climatic change. Tellus B 1991, 43, 322–330. [Google Scholar] [CrossRef] [Green Version]
  55. Raffalli-Delerce, G.; Masson-Delmotte, V.; Dupouey, J.L.; Stievenard, M.; Breda, N.; Moisselin, J.M. Reconstruction of summer droughts using tree-ring cellulose isotopes: A calibration study with living oaks from Brittany (western France). Tellus B 2004, 56, 160–174. [Google Scholar] [CrossRef]
  56. Masson-Delmotte, V.; Raffalli-Delerce, G.; Danis, P.A.; Yiou, P.; Stievenard, M.; Guibal, F.; Mestre, O.; Bernard, V.; Goosse, H.; Hoffmann, G.; et al. Changes in European precipitation seasonality and in drought frequencies revealed by a four-century-long tree-ring isotopic record from Brittany, western France. Clim. Dyn. 2005, 24, 57–69. [Google Scholar] [CrossRef]
  57. Leavitt, S.W. Tree-ring C-H-O isotope variability and sampling. Sci. Total Environ. 2010, 408, 5244–5253. [Google Scholar] [CrossRef] [PubMed]
  58. Labuhn, I.; Daux, V.; Pierre, M.; Stievenard, M.; Girardclos, O.; Féron, A.; Genty, D.; Masson-Delmotte, V.; Mestre, O. Tree age, site and climate controls on tree ring cellulose δ18O: A case study on oak trees from south-western France. Dendrochronologia 2014, 32, 78–89. [Google Scholar] [CrossRef]
  59. Shi, C.M.; Masson-Delmotte, V.; Risi, C.; Eglin, T.; Stievenard, M.; Pierre, M.; Wang, X.; Gao, J.; Bréon, F.-M.; Zhang, Q.; et al. Sampling strategy and climatic implications of tree-ring stable isotopes on the southeast Tibetan Plateau. Earth Planet. Sci. Lett. 2011, 301, 307–316. [Google Scholar] [CrossRef]
  60. Li, Q.; Liu, Y.; Nakatsuka, T.; Song, H.M.; McCarroll, D.; Yang, Y.K.; Qi, J. The 225-year precipitation variability inferred from tree-ring record in Shanxi Province, the North China, and its teleconnection with Indian summer monsoon. Glob. Planet. Chang. 2015, 132, 11–19. [Google Scholar] [CrossRef] [Green Version]
  61. Enfield, D.B.; Cid, L.S. Low-frequency changes in El-Nino southern oscillation. J. Clim. 1991, 4, 1137–1146. [Google Scholar] [CrossRef]
  62. Gergis, J.L.; Fowler, A.M. A history of ENSO events since AD 1525: Implications for future climate change. Clim. Chang. 2009, 92, 343–387. [Google Scholar] [CrossRef]
  63. Kirtman, B.P. Oceanic Rossby wave dynamics and the ENSO period in a coupled modle. J. Clim. 1997, 10, 1690–1704. [Google Scholar] [CrossRef]
  64. Huang, R.H.; Wu, Y.F. The influence of ENSO on the summer climate change in China and its mechanism. Adv. Atmos. Sci. 1989, 6, 21–32. [Google Scholar]
  65. Wang, B.; Wu, R.G.; Fu, X.H. Pacific-East Asian teleconnection: How does ENSO affect East Asian climate? J. Clim. 2000, 13, 1517–1536. [Google Scholar] [CrossRef]
  66. Tokinaga, H.; Xie, S.P.; Deser, C.; Kosaka, Y.; Okumura, Y.M. Slowdown of the Walker circulation driven by tropical Indo-Pacific warming. Nature 2012, 491, 439–443. [Google Scholar] [CrossRef]
  67. Wu, R.G.; Hu, Z.Z.; Kirtman, B.P. Evolution of ENSO-Related rainfall anomalies in East Asia. J. Clim. 2003, 16, 3742–3758. [Google Scholar] [CrossRef]
  68. Li, Q.; Nakatsuka, T.; Kawamura, K.; Liu, Y.; Song, H.M. Hydroclimate variability in the North China Plain and its link withEl Niño–Southern Oscillation since 1784 A.D.: Insights from tree-ring cellulose δ18O. J. Geophys. Res. 2011, 116, D22106. [Google Scholar] [CrossRef] [Green Version]
  69. Tanimoto, Y.; Iwasaka, N.; Hanawa, K.; Toba, Y. Characteristic variations of sea surface temperature with multiple time scales in the North Pacific. J. Clim. 1993, 6, 1153–1160. [Google Scholar] [CrossRef] [Green Version]
  70. Mantua, N.J.; Hare, S.R.; Zhang, Y.; Wallace, J.M.; Francis, R.C. A Pacific interdecadal climate oscillation with impacts on salmon production. Bull. Am. Meteorol. Soc. 1997, 78, 1069–1080. [Google Scholar] [CrossRef]
  71. D’Arrigo, R.; Wilson, R. On the Asian expression of the PDO. Int. J. Climatol. 2006, 26, 1607–1617. [Google Scholar] [CrossRef]
  72. Ma, Z.G.; Shao, L.J. Relationship between dry/wet variation and the Pacific Decade Oscillation (PDO) in Northern China during the past 100 years. Chin. J. Atmos. Sic. 2006, 30, 464–474. [Google Scholar]
  73. Sano, M.; Buckley, B.M.; Sweda, T. Tree-ring based hydroclimate reconstruction over northern Vietnam from Fokieniahodginsii: Eighteenth century mega-drought and tropical Pacific influence. Clim. Dyn. 2009, 33, 331–340. [Google Scholar] [CrossRef]
  74. Fang, K.Y.; Gou, X.H.; Chen, F.H.; Li, J.B.; D’Arrigo, R.; Cook, E.; Yang, T.; Davi, N. Reconstruction droughts for the southeastern Tibetan Plateau over the past 568 years and its linkages to the Pacific and Atlantic Ocean climate variability. Clim. Dyn. 2010, 35, 577–585. [Google Scholar] [CrossRef]
  75. MacDonald, G.M.; Case, R.A. Variations in the Pacific Decadal Oscillation over the past millennium. Geophys. Res. Lett. 2005, 32, L08703. [Google Scholar] [CrossRef] [Green Version]
  76. Li, Q.; Liu, Y.; Song, H.M.; Cai, Q.F.; Yang, Y. Long-term variation of temperature over North China and its links with large-scale atmospheric circulation. Quat. Int. 2013, 283, 11–20. [Google Scholar] [CrossRef]
  77. Zhao, S.R.; Song, Z.S. Heating effect of the Tibetan plateau on rainfall anomalies over North China during rainy season. Chin. J. Atmos. Sci. 2003, 27, 881–893. [Google Scholar]
  78. Ma, Z.G. The interdecadal trend and shift of dry/wet over the central part of North China and their relationship to the Pacific Decadal Oscillation (PDO). Chin. Sci. Bull. 2007, 52, 2130–2139. [Google Scholar] [CrossRef]
Figure 1. Sampling site, nearby meteorological stations, and compared sites.
Atmosphere 11 00984 g001
Figure 2. Distributions of precipitation, temperature and RH from Haiyuan and Huajialing meteorological stations from 1958 to 2012 as monthly averages.
Atmosphere 11 00984 g002
Figure 3. (a) The four individual and the composite tree-ring δ18O time series. (b) The mean interseries correlations (Rbar) and the running expressed population signal (EPS) were calculated using 30-year windows with a lag of 15 years.
Atmosphere 11 00984 g003
Figure 4. Correlation analysis of tree-ring δ18O chronology and the climatic factors during 1958–2012 CE.
Atmosphere 11 00984 g004
Figure 5. Comparisons between RHJA of observation and reconstruction in 1958–2012 CE: (a) original data, (b) first-order difference data.
Atmosphere 11 00984 g005
Figure 6. RHJA reconstruction during 1685–2012 CE. The black curve was smoothed with a 10-year low pass filter. The red line indicated the decreasing RHJA (drying) tendency in the Mt. Hasi study region since the 1930s.
Atmosphere 11 00984 g006
Figure 7. Multi-taper method spectrum analysis results of RHJA from 1685 to 2012. The red solid line and blue dashed line indicate the 95% and 90% confidence levels respectively.
Atmosphere 11 00984 g007
Figure 8. Results of the EEMD on RHJA reconstruction. T represents the periodicities, VC represents variance contributions, IMF represents intrinsic mode function.
Atmosphere 11 00984 g008
Figure 9. Comparison between tree-ring δ18O and GNIP δ18Op (July–August): (a) Xian, (b) Shijiazhuang.
Atmosphere 11 00984 g009
Figure 10. Comparison between reconstructed RHJA and ISM precipitation during 1871–2008 CE. The black and blue thick lines were smoothed with a 10-year low-pass filter.
Atmosphere 11 00984 g010
Figure 11. Spatial correlation between RHJA and CRUTS 4.03 (July–August) during 1958–2012 CE: (a) observed RHJA, (b) reconstructed RHJA. Mt. Hasi was the sampling site in this study.
Atmosphere 11 00984 g011
Figure 12. Comparisons of tree-ring based hydroclimate reconstructions. (a) The RHJA reconstruction in this study, (b) a tree-ring width-based precipitation reconstruction on the western Loess Plateau [49], (c) a dryness/wetness index (DWI) [50] near the sampling site (38°45′ N, 106°15′ E), (d) a tree-ring δ18O-based RHJJA reconstruction in Ordos [7]. The red lines were smoothed with a 10-year low-pass filter. The arrow lines indicated the trend of aridification since the 1930s.
Atmosphere 11 00984 g012
Figure 13. Comparison between reconstructed PDO series [75] and reconstructed RHJA over the period of 1697–1984 CE (smoothed by 25-year moving average).
Atmosphere 11 00984 g013
Table 1. Correlations between the individual and composite δ18O series (r, n).
Series18A10B32B28A
10B0.59, 308---
32B0.69, 990.65, 99--
28A0.69, 3080.64, 3170.68, 99-
composite0.86, 3080.86, 3170.87, 990.90, 328
n represents the number of samples. All p < 0.001.
Table 2. Statistical characteristics of δ18O time series.
Statistical Parameters18A10B32B28AComposite
Length (years)30831799328328
Maximum (‰)35.7636.3334.8735.7435.23
Minimum (‰)27.9726.6329.2127.3127.31
Mean (‰)32.0731.3132.3131.5431.68
AR10.280.520.380.320.36
Standard deviation (‰)1.291.651.221.411.30
Skewness−0.060.09−0.27−0.07−0.1
Kurtosis−0.170.21−0.710.270.16
AR1 represents the first-order autocorrelation.
Table 3. Partial correlation analysis of composite δ18O time series and meteorological data from July to August (1958–2012 CE).
Controlled Variableδ18O VS Mean TJAδ18O VS PJAδ18O VS RHJA
Mean TJA-−0.31−0.61 *
PJA0.12-−0.56 *
RHJA−0.080.03-
Mean TJA represents July–August temperature, PJA represents July–August precipitation, RHJA represents July–August relative humidity. * represents p < 0.01.
Table 4. Characteristics of calibration and verificationfor RHJA reconstruction on Mt. Hasi.
Calibration---Verification-----
PeriodrSTtPeriodrRECESTt
1958–19840.707 **19+/8− *5.285 **1985–20120.566 **0.2980.22120+/8− *4.818 **
1986–20120.565 **21+/6− **4.87 **1958–19850.707 **0.4670.4321+/7− **5.154 **
1958–20120.65 **41+/14− **6.902 **------
* represents p < 0.05, ** represents p < 0.01.
Table 5. Correlations between RHJA and ASM indices (r, p).
Monsoon IndicesRHJA (1958–2012)
SASMI [44] a0.39, 0.01
EASMI [42] b0.30, 0.05
EASMI [43] c0.32, 0.01
SASMI [45] d0.27, 0.05
a SASMI is considered to represent a broad measure of the South and Southeast Asian (0–20° N, 40–110° E) monsoon intensity, based on differences between the zonal wind fields at the 850 and 200 hPa levels [44]. b EASMI is defined as the zonal wind shear (U850–U200) of 850 and 200 hPa in the region (0–10° N, 100–130° E) and the average monthly 160° E sea level pressure within 10–50° N minus the 110° E sea level pressure difference and normalized separately, with the two indexes added to indicate the East Asian monsoon [42]. c IEAP = Nor (−0.25 Zs [20° N, 125° E] + 0.50 Zs [40° N, 125° E] −0.25 Zs [60° N, 125° E]), where Z means the seasonal-mean 500 hPa geopotential height in summer minus climatological-mean geopotential height, Zs = Z sin45°/sinλ, λ is the latitude. Nor (X) means the normalization of X [43]. d SASMI is defined as areally-averaged seasonally dynamical normalized seasonality (DNS) index at 850 hPa within the South Asian domain (5–22.5° N, 35–97.5° E) [45].
Table 6. Correlations between reconstructed RHJA and July to August NIÑO4, NIÑO3.4, NIÑO3, and NIÑO1+2 sea surface temperature indices from different datasets (r, n).
SST RegionData Set1958–2012 CEFirst Difference
1958–2012 CE
NIÑO4ERSST−0.20, 55−0.21
Hadley Center−0.15, 55−0.10
Kaplan−0.16, 55−0.25
NIÑO3.4ERSST−0.26, 55 *−0.31 *
Hadley Center−0.22, 55−0.31 *
Kaplan−0.23, 55−0.33 **
NIÑO3ERSST−0.28, 55 *−0.29 *
Hadley Center−0.24, 55−0.30 *
Kaplan−0.27, 55 *−0.30 *
NIÑO1+2ERSST−0.32, 55 *−0.29 *
Hadley Center−0.25, 55−0.26 *
Kaplan−0.31, 55 *−0.30 *
MEI-−0.34, 55 **−0.44 **
SOI-0.28, 55 *0.37 **
* represents 95% confidence level, ** represents 99% confidence level.
Table 7. Extremely dry years in the reconstructed RHJA series and the El Niño events defined by Gergis and Fowler [62].
Extremely Dry Years (RHJA)El Niño Events (Classify)
1687 (65.20%)1687 (VS)
1693 (68.61%)1992 (W)
1701 (66.97%)1700 (W)
1713 (62.03%)1713 (M)
1719 (63.45%)1718 (E); 1719 (S)
1728 (66.21%)1728 (S)
1737 (67.23%)1737 (E)
1749 (62.90%)1748 (M)
1770 (67.20%)1770 (VS)
1846 (67.10%)1845 (VS)
1926 (64.17%)1926 (E)
1927 (68.29%)1926 (E)
1957 (68.55%)1957 (S)
1965 (68.48%)1965 (S)
1972 (65.30%)1972 (M)
1982 (68.14%)1982 (E)
1983 (67.44%)1982 (E)
1987 (66.23%)1987 (VS)
1988 (66.07%)1987 (VS)
1991 (68.30%)1991 (VS)
E: extreme. VS: very strong. S: strong. M: moderate. W: weak.
Table 8. Extremely wetyears in the reconstructed RHJA series and the La Niña events defined by Gergis and Fowler [62].
Extremely Wet Years (RHJA)La Niña Events (Classify)
1702 (77.74%)1702 (M)
1734 (77.52%)1733 (VS)
1742 (77.84%)1742 (E)
1751 (78.65%)1750 (S); 1751 (M)
1754 (80.83%)1753 (S)
1761 (82.48%)1761 (M)
1773 (78.54%)1773 (W)
1802 (77.91%)1802 (VS)
1803 (80.99%)1802 (VS)
1805 (79.13%)1805 (VS)
1806 (79.96%)1805 (VS)
1870 (82.16%)1870 (VS)
1875 (80.10%)1875 (S)
1908 (78.44%)1908 (S)
1918 (77.83%)1917 (VS)
1943 (82.29%)1943 (W)
E: extreme. VS: very strong. S: strong. M: moderate. W: weak.

