Estimation of Damage Cost to Building Façades per kilo Emission of Air Pollution in Norway


Abstract
1. Introduction
2. Method
2.1. Exposure-Response Functions and Marginal Maintenance Cost Estimations
2.2. Important Considerations for the Application of the Exposure Response Equations
3. Input Parameter Values
4. Results
Damage Cost to Norwegian Façades per kilo Emission of Air Pollution
5. Discussion
5.1. The Separate Pollution Effects on Rendering
5.2. The Representation of the Pollution Impact on Painted Façades
5.3. The Façades Inventory in Oslo
5.4. A Tentative Validation, Biases, and Uncertainty
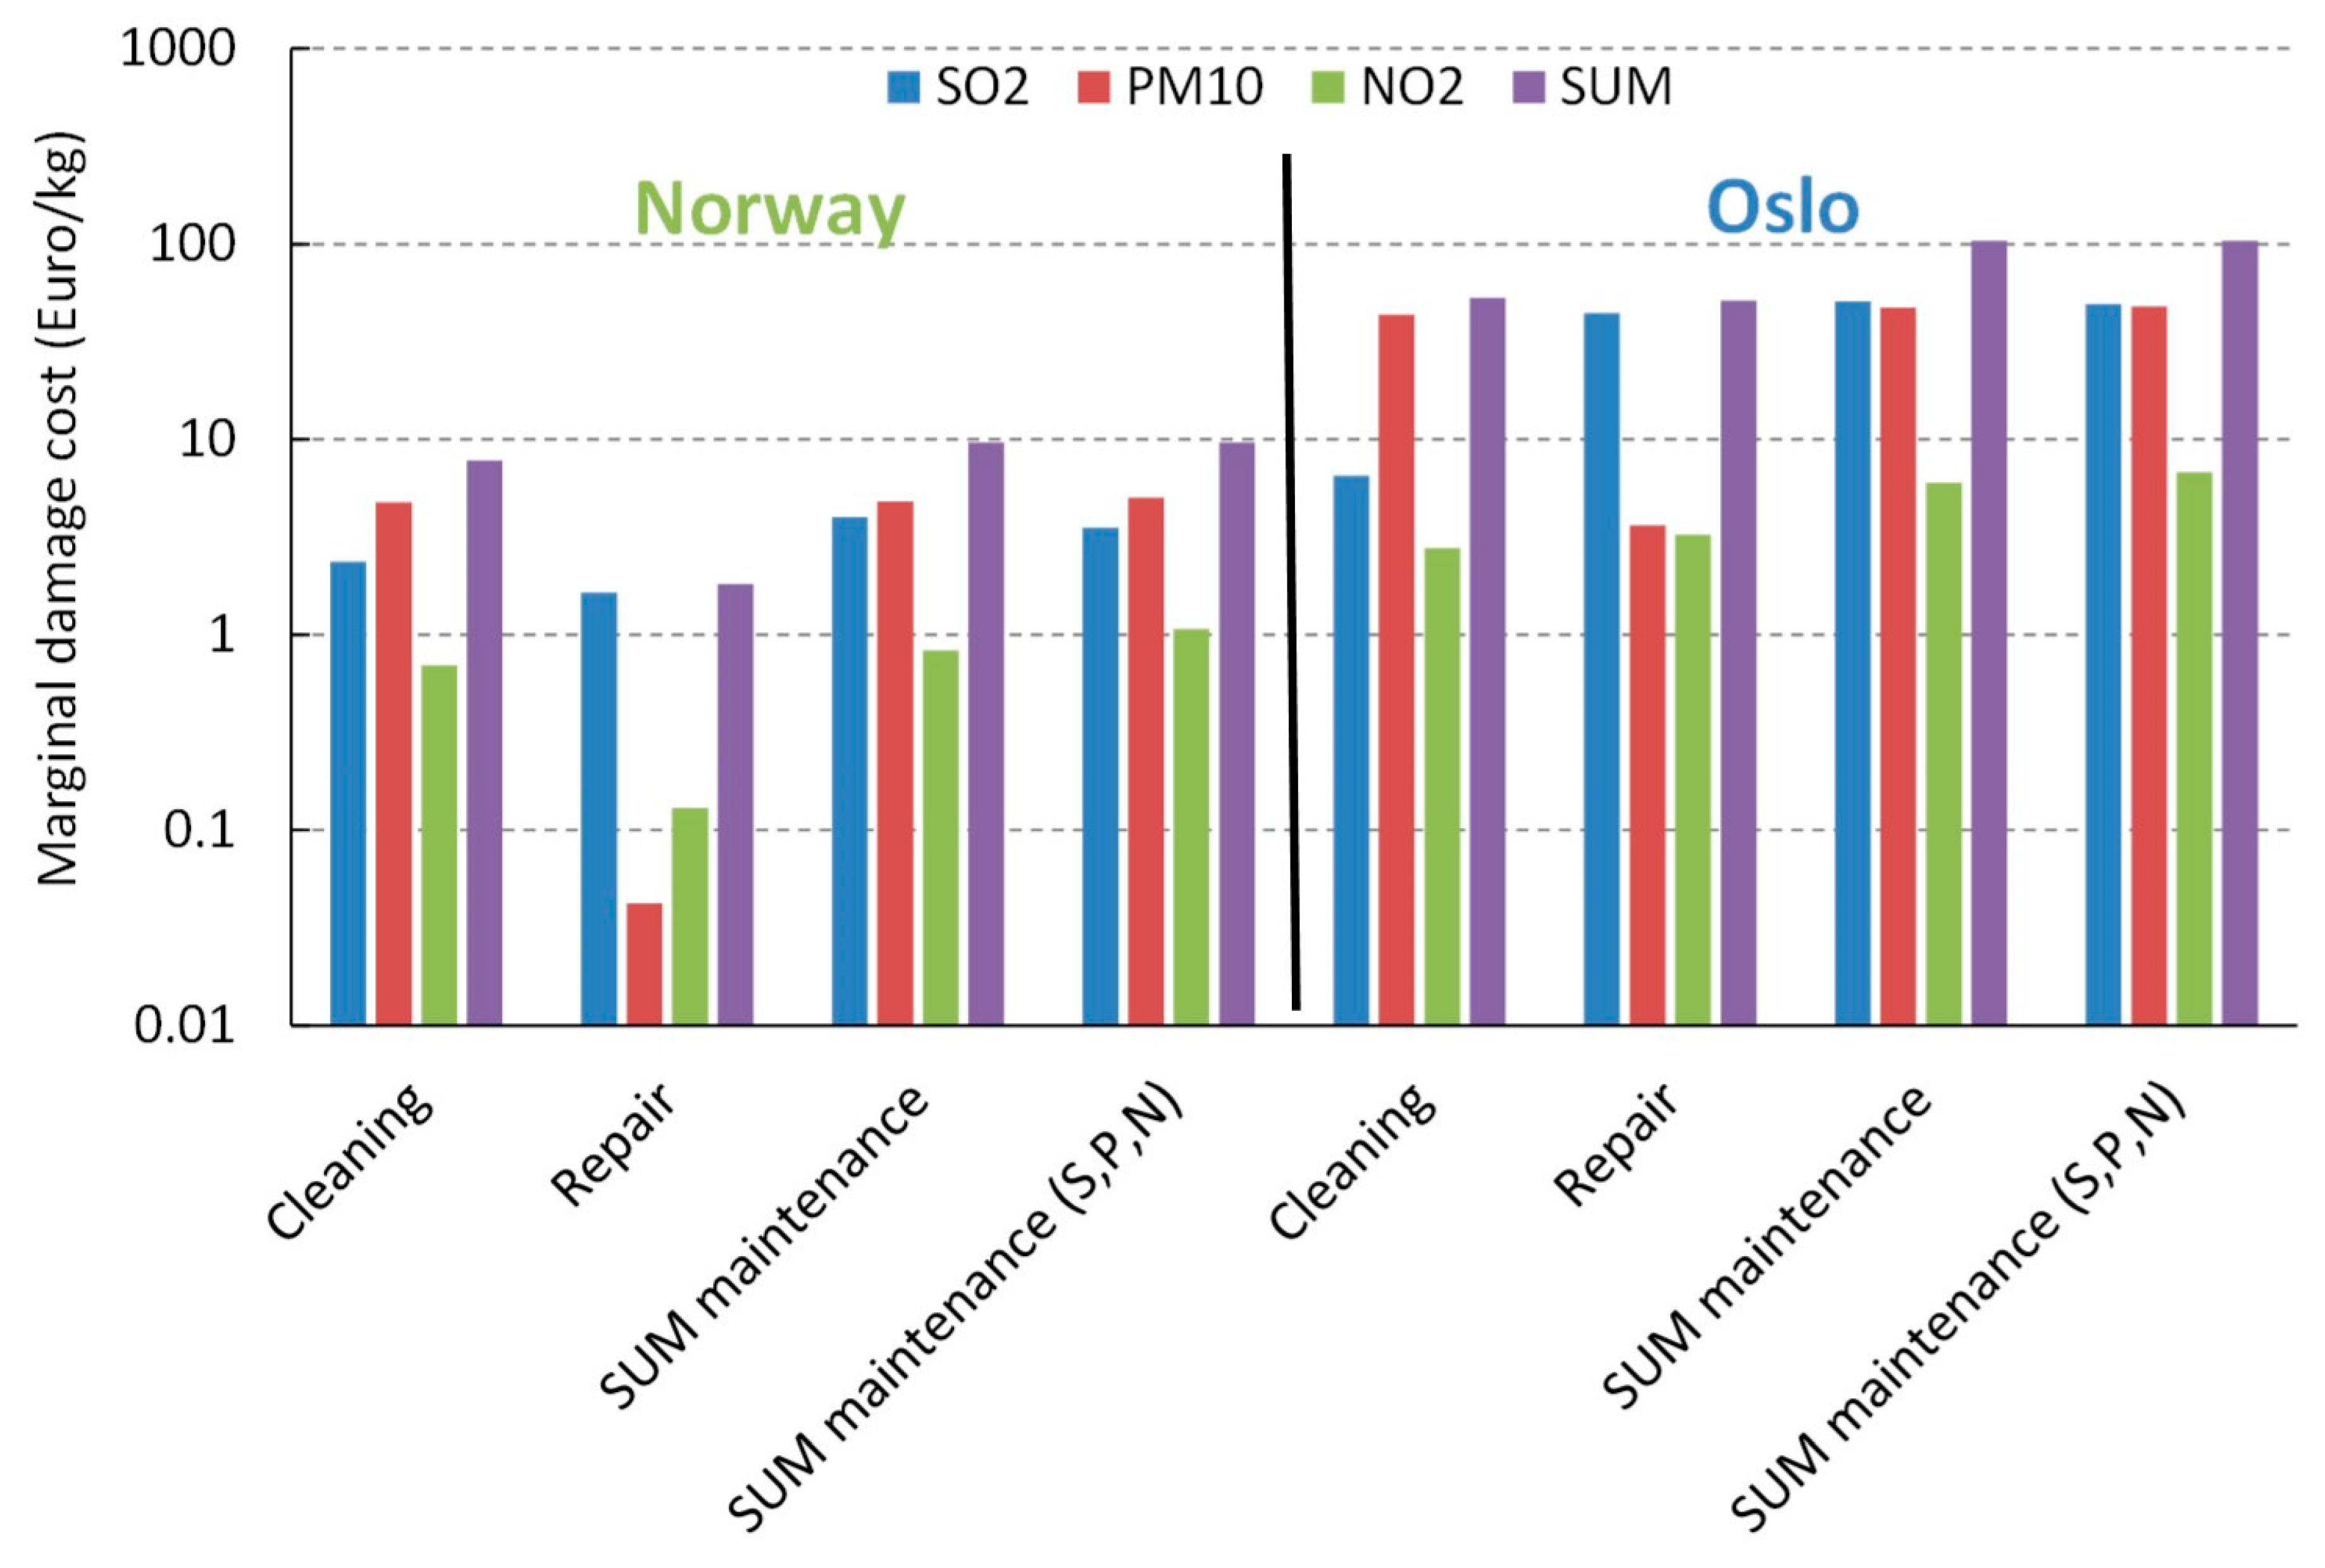
- Direct comparisons of marginal cost estimates for Norway should be for the same selection of the building stock. One reason for present higher costs would be the considerably larger total stock of Norwegian building façades today than in the 1990s. In addition, the values reported in the 1990s were for the ”regional stock of towns and villages with more than 15000 people,” while the present values were obtained as the area averaged, and thus, as the “regional” costs for the total Norwegian building stock. This it not a direct comparison. Clearly, the value for the building density (funi, Equation (3)) is important for the results. It may be as relevant to do a regional estimation for Norway for the building stock outside of the cities, as in the earlier report for Norway. The statistics in Norway for areas covered by buildings [33] is by county and municipality and do not distinguish between more or less building-dense areas. However, the statistics [34] show that 82% of the population live in urban settlements, also described as “densly” as opposed to “sparsly” populated areas. If assuming that the distributon of the built surface area reflect the population density, the background façade density, funi (Table 2), would be 0.0052 m2 façade area/m2 land area. This would imply a redution to 18% of the cost values in Table 6. The marginal cost for the façade renovation due to air pollution in Norway, outside of the cities and towns, would then be 1.7 Euro/kg, about equally divided beween the effect of SO2 (0.72 Euro/kg) and PM10 (0.86 Euro/kg). These values are closer to the range of the earlier reporting (of 0.2–0.5 Euro/kg SO2), but seem to include less of the buildings than the inventory for “towns and villages with more than 15000 people” used in the 1990s. This may, however, be more or less “compenesated” by the total increased stock. This suggests that a lower building density could have been used in the estimations for Norway. For Oslo the difference is less: the higher repair value, of 51 Euro per kg SO2 estimated in this work as opposed to 13 Euro per kg SO2 reported for the 1990s, is, again, probably related to the definition of the building stock. The Oslo municipality area is considerably larger and with a lower average building surface density than the central area with a unity building surface density used in this work. (+, ↑ in Norway)
- The uncertainty in the UWM modelling may be different for the special case of Norway and Europe. The dispersion and deposition of the air pollution relative to the distribution of the building stock in the Norwegian geography could influence the overall impact of the air pollution differently than asssumed in the UWM modelling, and give an undetermined bias in the results estimated in this work. (−)
- Higher values for the marginal costs are expected at the present lower concentration of air pollution in Norway than the French case, as can be seen from the expressions for the impact slopes in Appendix A. The average concentration of PM13 was 32.4 µg/m3 in the French case, and an SO2 concentration of 19 µg/m3 was reported for the “study of the cost of building renovation due to air pollution in Paris” in the 1990s [1]. In the ICP materials project, an annual average concentration of NO2 of 70 µg/m3 was measured in Paris in 1997 [35]. For the present Norwegian situation, an increase in the air pollution to these values (for Paris in the 1990s), in an elsewise similar 2020 environment (Table 3), would imply a reduction in the total marginal cost (per unit air pollution) of 44%, of which 90% would be due to a reduction in the marginal cleaning cost for windows (Equation (A4)) and none due to the cleaning of façades due to the applied simple linear Equation (A2). The reduction in the marginal cleaning costs due to PM10, SO2, and NO2, would be 25%, 61%, and 84%. One could hypothesize that a further development of the ERF for façade soiling would include a non-linear dependence on the air pollution also in this case. (+)
- The top-down estimates for France in 1994 seem not, in general, to include window cleaning, which constituted 13% of the calculated marginal cleaning cost in Oslo and 45% in Norway (Table 5). (+)
- It may be that the ERFs and maintenance tolerances suggested in the literature and used in this work for the cleaning and repair do not represent the real situation in Norway. The cleaning was supposed to happen as soon as a white painted façade had been soiled to a 35% loss of its original light reflection. Clearly, only few façades are originally white and smooth, and consistently cleaned to remain so. For darker façades, the maintenance tolerance may be higher. (↑)
- Painted façades are a large fraction of the stock at risk (Table 4). It is a question how well the ERFs (Equations (A14), (A17), (A18) and (A20)), which were developed more than 20 years ago in a situation with higher SO2 concentrations than today and for typical paint systems used at that time, represent the present situation. With the present relatively higher photo-oxidizing impacts of O3 and NO2, as compared to the historically higher acidic impact of SO2, and with expected improved paint systems, it may be that the marginal cost of the air pollution is lower than 20 years ago. This is especially relevant for the ERF for painted steel (Equation (A17)), which includes a reported minimal initial lifetime before cracking (see Section 5.2). (↑)
- The materials inventory is important for the result, as is seen by comparing the cost for the maintenance of the single façade materials for the two Oslo scenarios in Table 5. The definition of the maintenance tolerances, and the renovation works and their pricing, is also important. (−)
- A final consideration is that recorded expenses are not a direct validation of costs. Budgetary constraints may reduce the spending. Whatever the maintenance tolerance is, it may be that the cleaning is in reality less frequent, due to priorities in budgets. For France in 1994 [1] it was reported that about 25% of the recorded renovation expenditure per measured concentration unit of PM13 could be attributed to particle pollution, and was thus included in the reported cost values, of 0.1 Euro per person × year × µg/m3 (1994 value). Income differences explained much of the remaining variation in the cleaning expenses, between 0.1 and 0.4 Euro per person × year × µg/m3. Thus, ~75% of the variation in the cleaning expenses were explained by different factors than the PM concentration. One the one hand, this shows the need in top-down studies to control for other influencing factors on the spending, than air pollution. On the other hand, it is a suggestive indication of the possible difference between bottom-up estimated marginal damage costs due to atmospheric wear, and the expenses it may explain. This is because the air pollution is usually “only” one reason for the wear and the spending, and the price paid for actual renovation include the cost for all other impacts and concerns, which may more or less substitute, and not simply add to, the effect of air pollution. (−)
6. Final Remarks and Conclusions
Author Contributions
Funding
Acknowledgments
Conflicts of Interest
Appendix A
Exposure-Response Functions (ERFs) and Marginal Effect Slopes

| Parameter | Explanation | Unit |
|---|---|---|
| A | Urban conurbation area | m2 |
| DR | Dilution rate for a ground level sources | m2/s |
| Damage cost rate on material, i, due to pollutant, p | Euro/year | |
| Damage cost rate of ground level sources in cities | Euro/year | |
| Dp,i | Marginal damage cost on material, i, due to pollutant, p | Euro/kg |
| Dtot | Marginal damage cost on the façade inventory | Euro/kg |
| fec | Empirical correction factor for cleaning responses | fraction |
| Fi | Fraction of façade material, i, to the total façade area | m2/m2 |
| funi | Background façade density | m2 material area/m2 ground area |
| H | Haze | % |
| H+ | Concentration of H+ ions (acidity, pH) in precipitation | mg/L |
| [HNO3] | Nitic acid concentration in air | µg/m3 |
| k | Deposition velocity | cm/s |
| LFD | Linear façade density | m2 façade area/m |
| Emission rate | kg/year | |
| ML | Mass loss | g/m2 |
| N | Number of receptors, i.e., façade square meters | m2 |
| [NO2] | Nitrogen dioxide concentration in air | µg/m3 |
| [O3] | Ozone concentration in air | µg/m3 |
| p | Pollution species | |
| pH | Acidity | |
| Pi | Renovation price for material, i | |
| [PM10] | Concentration in air of particle matter with aerodynamic diameter < 10 µm | µg/m3 |
| [PM13] | Concentration in air of particle matter with aerodynamic diameter < 13 µm | µg/m3 |
| R | Deterioration response | %, g/m2 or µm |
| R2 | Explanatory power of equation | |
| R0 | Reflectance of a non-soiled surface | % |
| ∆R | Loss of reflectance | % |
| Rain | Annual precipitation amount | mm |
| Rh | Relative humidity | % |
| Rh60 | (Rh-60) when Rh > 60, otherwise 0 | % |
| Seg | Adjustment factor for ground level sources | |
| SERF,p,i | Slope of the exposure response functions for pollutant, p, and material, i | 1/year × µg/m3 |
| [SO2] | Sulfur dioxide concentration in air | µg/m3 |
| T | Temperature | °C |
| t | Time | years or days |
| tinitial | Time before cracking of paint | years |
References
- Rabl, A.; Spadaro, J.V.; Holland, M. How Much is Clean Air Worth? Calculating the Benefits of Pollution Control; Cambridge University Press: Cambridge, UK, 2014. [Google Scholar]
- ICP. Available online: http://www.corr-institute.se/ICP-Materials/ (accessed on 26 May 2020).
- Tidblad, J.; Faller, M.; Grøntoft, T.; Kreislova, K.; Varotsos, C.; De la Fuente, D.; Lombardo, T.; Doytchinov, S.; Brüggerhof, S.; Yates, T. Economic Assessment of Corrosion and Soiling of Materials Including Cultural Heritage. UN/ECE International Co-Operative Programme on Effects on Materials, Including Historic and Cultural Monuments. Report no. 65. 2010. Available online: http://www.corr-institute.se/icp-materials/web/page.aspx?refid=18 (accessed on 25 June 2020).
- EEA. Air Quality in Europe—2018 Report. EEA Report No 12. 2018. Available online: https://www.eea.europa.eu/publications/air-quality-in-europe-2018 (accessed on 26 May 2020).
- WHO. Review of Evidence on Health Aspects of air Pollution—REVIHAAP Project Technical Report; The WHO European Centre for Environment and Health, WHO Regional Office for Europe: Bonn, Germany, 2013; Available online: http://www.euro.who.int/__data/assets/pdf_file/0004/193108/REVIHAAP-Final-technical-report-final-version.pdf?ua=1 (accessed on 26 May 2020).
- WHO. Air Quality Guidelines Global Update 2005. Particulate Matter, Ozone, Nitrogen Dioxide and Sulfur Dioxide. 2005. Available online: http://www.euro.who.int/en/health-topics/environment-and-health/air-quality/publications/pre2009/air-quality-guidelines.-global-update-2005.-particulate-matter,-ozone,-nitrogen-dioxide-and-sulfur-dioxide (accessed on 26 May 2020).
- Maas, R.; Grennfelt, P. (Eds.) Towards Cleaner Air. Scientific Assessment Report 2016; EMEP Steering Body and Working Group on Effects of the Convention on Long-Range Transboundary Air Pollution: Oslo, Norway, 2016; 50p, Available online: https://www.unece.org/index.php?id=42861 (accessed on 26 May 2020).
- Mills, G.; Pleijel, H.; Malley, C.S.; Sinha, B.; Cooper, O.R.; Schultz, M.G.; Neufeld, H.; Simpson, D.; Sharps, K.; Feng, Z.; et al. Tropospheric Ozone Assessment Report: Present-day tropospheric ozone distribution and trends relevant to vegetation. Elem. Sci. Anthr. 2018, 6, 47. Available online: https://www.elementascience.org/articles/10.1525/elementa.302/ (accessed on 26 May 2020). [CrossRef]
- Harmens, H.; Mills, G.; Hayes, F.; Sharps, K.; Frontasyeva, M. The Participants of the ICP Vegetation. Air Pollution and Vegetation; ICP Vegetation Annual Report 2015/2016; ICP Vegetation Programme Coordination Centre, Centre for Ecology & Hydrology, Environment Centre Wales: Bangor, Gwynedd, UK, 2016; Available online: http://nora.nerc.ac.uk/id/eprint/515466/ (accessed on 26 May 2020).
- Watt, J.; Tidblad, J.; Kucera, V.; Hamilton, R. (Eds.) The Effects of Air Pollution on Cultural Heritage; Springer: New York, NY, USA, 2009; pp. 105–127. [Google Scholar]
- Brimblecombe, P. The Effects of Air Pollution on the Built Environment; Air Pollution Reviews—Volume 2; Imperial College Press: London, UK, 2003; Available online: https://archive.org/details/PeterBrimblecombeTheEffectsOfAirPollutionOnTheBluit (accessed on 26 May 2020).
- Söderqvist, T.; Barregård, L.; Johansson, N.; Molnár, P.; Nordänger, S.; Staaf, H.; Svensson, M.; Tidblad, J.; Wallström, J. Effektkedjor och Skadekostnader som Underlag för Revidering av ASEK-Värden för Luftföroreningar, Trafikverket, TRV 2016/2932. 2017. Available online: https://www.trafikverket.se/contentassets/773857bcf506430a880a79f76195a080/forskningsresultat/effektkedjor3.pdf (accessed on 26 May 2020). (In Swedish).
- Söderqvist, T.; Bennet, C.; Kriit, H.K.; Tidblad, J.; Andersson, J.; Jansson, S.-A.; Svensson, M.; Wallström, J.; Andersson, C.; Orru, H.; et al. Underlag för Reviderade ASEK-Värden för Luftföroreningar. Slutrapport från Projektet REVSEK, Trafikverket. 2019. Available online: https://www.trafikverket.se/contentassets/773857bcf506430a880a79f76195a080/forskningsresultat/effektkedjor3.pdf (accessed on 9 June 2020). (In Swedish).
- SFT. Marginale Miljøkostnader ved Luftforurensning: Skadekostnader og Tiltakskostnader. 2005. Available online: https://www.miljodirektoratet.no/globalassets/publikasjoner/klif2/publikasjoner/luft/2100/ta2100.pdf (accessed on 26 May 2020). (In Norwegian).
- Sabbioni, C.; Brimblecombe, P.; Cassar, M. The Atlas of Climate Change Impact on European Cultural Heritage: Scientific Analysis and Management Strategies; Anthem Press: London, UK, 2010. [Google Scholar]
- Grøntoft, T. Conservation-restoration costs for limestone façades due to air pollution in Krakow, Poland, meeting European target values and expected climate change. Sustain. Cities Soc. 2017, 29, 169–177. [Google Scholar] [CrossRef]
- Kucera, V.; Tidblad, J.; Kreislova, K.; Knotkova, D.; Faller, M.; Reiss, D.; Snethlage, R.; Yates, T.; Henriksen, J.; Schreiner, M. UN/ECE ICP-materials Dose-response Functions for the Multi-pollutant Situation. Water Air Soil Pollut. Focus 2007, 7, 249–258. [Google Scholar] [CrossRef]
- Henriksen, J.F.; Anda, O.; Ofstad, T. Case Study of «Kristiania Kvadraturen» in Oslo. EU Project ENV4-CT98 0708 Reach Rationlized Economic Appraisal of Cultural Heritage; NILU OR 26/2001; Norwegian Institute for Air Research: Kjeller, Norway, 2001; Available online: https://www.nilu.no/wp-content/uploads/dnn/26-2001-jfh.pdf (accessed on 26 May 2020).
- Grøntoft, T. Recent Trends in Maintenance Costs for Façades due to Air Pollution in the Oslo Quadrature, Norway. Atmosphere 2019, 10, 529. [Google Scholar] [CrossRef]
- Tidblad, J.; Kucera, V.; Mikhailov, A.A.; Henriksen, J.; Kreislova, K.; Yates, T.; Stöckle, B.; Schreiner, M. UN ECE ICP Materials. Dose-response functions on dry and wet acid deposition effects after 8 years of exposure. Water Air Soil Pollut. 2001, 130, 1457–1462. [Google Scholar] [CrossRef]
- Tidblad, J.; Kucera, V.; Mikhailov, A.A. Statistical Analysis of 8 Year Materials Exposure and Acceptable Deterioration and Pollution Levels. UN/ECE International Co-Operative Programme on Effects on Materials, Including Historic and Cultural Monuments. Report no. 30. 1998. Available online: http://www.corr-institute.se/icp-materials/web/page.aspx?refid=18 (accessed on 25 June 2020).
- Henriksen, J.F.; Anda, O.; Bartonova, A.; Arnesen, K.; Elvedal, U. Evaluation of Decay of Painted Systems for Wood, Steel and Galvanized Steel after 8 Years Exposure. UN/ECE International Co-Operative Programme on Effects on Materials, Including Historic and Cultural Monuments. Report no. 25. 1998. Available online: http://www.corr-institute.se/icp-materials/web/page.aspx?refid=18 (accessed on 25 June 2020).
- ICP. Oral Communication within ICP-Materials. In Proceedings of the Minutes of the Annual ICP-Materials Meeting, Hämeenlinna, Finland, 10–12 May 2017; Available online: http://www.corr-institute.se (accessed on 26 May 2020).
- Grøntoft, T.; Verney-Carron, A.; Tidblad, J. Cleaning Costs for European Sheltered White Painted Steel and Modern Glass Surfaces Due to Air Pollution Since the Year 2000. Atmosphere 2019, 10, 167. [Google Scholar] [CrossRef]
- Statsitics Norway. Index of Labour Costs. 2020. Available online: https://www.ssb.no/en/statbank/table/07251/ (accessed on 26 May 2020).
- Kucera, V.; EU project Multi Assess. Deliverable 0.2, Publishable Final Report. 2005. Available online: http://www.corr-institute.se/icp-materials/web/page.aspx?refid=35 (accessed on 26 May 2020).
- Grøntoft, T. Maintenance costs for European zinc and Portland limestone surfaces due to air pollution since the 1980s. Sustain. Cities Soc. 2018, 39, 1–15. [Google Scholar] [CrossRef]
- Statistics Norway Land Use and Land Cover, 1 January 2016. 2020. Available online: https://www.ssb.no/en/natur-og-miljo/statistikker/arealstat/aar/2016-09-12 (accessed on 26 May 2020).
- Watt, J.; Jarrett, D.; Hamilton, R. Dose-Response functions for the soiling of heritage materials due to air pollution exposure. Sci. Total Environ. 2008, 400, 415–424. [Google Scholar] [CrossRef] [PubMed]
- Reichert, T.; Pohsner, U.; Ziegahn, K.-F.; Fitz, S.; Anshelm, F.; Gauger, T.; Schuster, H.; Droste-Franke, B.; Friedrich, R.; Tidblad, J. Effect of Modern Environments on materials—Polymers, Paints and Coatings. In Cultural Heritage in the City of Tomorrow. Developing Policies to Manage the Continuing Risks from Air Pollution. Proceedings of a UNECE Workshop, Bulletin 110E, ISBN 91-87400-12-X, London, UK, 10–12 June 2004; Kucera, V., Tidblad, J., Hamilton, R., Eds.; Swedish Corrosion Institute: Stockholm, Sweden, 2004; ISBN 91-87400-12-X. [Google Scholar]
- Reichert, T.; Pohsner, U.; Natural Weathering of Polymers. Dose-Response-Functions of Air Pollution Effects for Service Life Prediction. 2006. Available online: http://www.ceees.org/downloads/workshops/pdf/SEE_CEEES_Workshop_2006_Reichert.pdf (accessed on 26 May 2020).
- OECD. Stat. Organisation for Economic Co-operation and Development. 2020. Available online: https://stats.oecd.org/# (accessed on 26 May 2020).
- Statistics Norway. Land Use and Land Cover. 2020. Available online: https://www.ssb.no/en/statbank/table/10781/ (accessed on 26 May 2020).
- Statistics Norway. Population and Land Area in Urban Settlements. 2020. Available online: https://www.ssb.no/en/befolkning/statistikker/beftett (accessed on 26 May 2020).
- Tidblad, J.; Grøntoft, T.; Kreislová, K.; Faller, M.; De la Fuente, D.; Yates, T.; Verney-Carron, A. Trends in Pollution, Corrosion and Soiling 1987–2012. UN/ECE International Co-Operative Programme on Effects on Materials, Including Historic and Cultural Monuments. Report no. 76. 2014. Available online: http://www.corr-institute.se/icp-materials/web/page.aspx?refid=18 (accessed on 25 June 2020).
- Lombardo, T.; Ionescu, A.; Chabas, A.; Lefèvre, R.-A.; Ausset, P.; Candau, Y. Dose–response function for the soiling of silica–soda–lime glass due to dry deposition. Sci. Total Environ. 2010, 408, 976–984. Available online: https://www.sciencedirect.com/journal/science-of-the-total-environment/vol/408/issue/4 (accessed on 26 May 2020). [CrossRef] [PubMed]
- CLRTAP. Mapping of Effects on Materials, Chapter IV of Manual on Methodologies and Criteria for Modelling and Mapping Critical Loads and Levels and Air Pollution Effects, Risks and Trends. UNECE Convention on Long-range Transboundary Air Pollution. 2014. Available online: https://www.umweltbundesamt.de/sites/default/files/medien/4292/dokumente/ch4-mapman-2016-05-03.pdf (accessed on 26 May 2020).


| Marginal Cost, Dtot = | Façade Material, i. | |
|---|---|---|
| 1. | [(1 − Fr − Fw) × DP,fc] | fc = general façades, cleaning |
| 2. | + [Fw × (DS,wc + DN,wc + DP,wc)] | wc = window glass, cleaning |
| 3. | + [Fr × (DS,r + DN,r + DP,r)] | r = renderings |
| 4. | + [Fl × (DS,l + DN,l + DP,l)] | l = limestone |
| 5. | + [Fps × DS,ps] | ps = painted steel |
| 6 | + [Fpom × DS,pom] | pom = painted materials other than steel |
| 7. | + [Fpw × DS,pw] | pw = painted wood |
| 8. | + [Fc × DS,c] | c = copper |
| 9. | + [Fz × DS,z] | z = zinc including galvanizing |
| 10. | + [Fb × DS,b] | b = brick, tile and concrete |
| Parameter | Value |
|---|---|
| Background façade density, funi (m2 façade area/m2 land area) | 0.029 |
| Linear façade density, LFD (Oslo, m2 façade area/m) (Equation (5)) | 14142 |
| Deposition velocity of SO2, kSO2 (Norway, cm/s) 1 | 1.27 |
| Deposition velocity of PM10, kPM10 (Norway, cm/s) 1 | 1.34 |
| Deposition velocity of NO2, kNO2 (Norway, cm/s) 1 | 1.83 |
| Dilution rate for a ground level sources, DR (Oslo, m2/s) 2 | 210 |
| Adjustment factor for ground level sources of SO2 in cities, Seg,SO2 (Equation (4)) | 16.6 |
| Adjustment factor for ground level sources of PM10 in cities,Seg,PM10 (Equation (4)) | 17.6 |
| Adjustment factor for ground level sources of NO2 in cities,Seg,NO2 (Equation (4)) | 24.0 |
| Scenario | 1. Norway Suggested Average | 2. Oslo Traffic Situation 1 | Reference: Oslo Rural Background 1 |
|---|---|---|---|
| Pollutants, annual average concentration (µg/m3) | |||
| SO2 | 1 | 2 | 0.25 |
| NO2 | 5 | 40 | 1.3 |
| O3 | 50 | 35 | 60 |
| PM10 | 10 | 21.3 | 6 |
| Climate, annual averages | |||
| Rh (%) | 80 | 73 | 73 |
| T (°C) | 4 | 7.2 | 7.2 |
| Precipitation (mm) | 1000 | 750 | 750 |
| pH | 5.3 | 5 | 5.3 |
| Façade Material | Fraction | Wear Parameter, Maintenance Tolerance | Maintenance Action | Maintenance Price, in 2020 (Euro/m2) 3 | Empirical Adjustment by: Fraction, fo 4, or: Added Lifetime (Years) | |
|---|---|---|---|---|---|---|
| Norway 1 | Oslo 2 | |||||
| Cleaning | ||||||
| Façades that are cleaned (fc) | 65 | 44 | Soiling, 35% loss of reflection | Cleaning | 32 | 0.7 |
| Window glass (w) | 15 | 12 | Haze, 3% | Cleaning | 2.6 | 0.5 |
| Atmospheric wear (corrosion) | ||||||
| Painted rendering (r) | 18 | 44 | Lifetime 5 | Replacement | 120 | |
| Limestone (l) | 0 | 0 | Recession, 5 mm 6 | Repair | 120 | |
| Painted metal (other than steel) (pom) | 18 | 5 | Lifetime 5 | Repainting | 55 | |
| Painted steel (ps) | 5 | 1 | Lifetime, ASTM standard 7 | Repainting | 105 | 10 years |
| Painted wood (pw) | 18 | 3 | Lifetime 5 | Repainting | 25 | |
| Copper (c) | 1 | 8 | Recession, 100 µm 6 | Replacement | 150 | |
| Zinc (metal and galvanized) (z) | 1 | 1 | Recession, 50 µm 6,8 | Maintenance, replacement | 95 | |
| Brick masonry, tile (unglazed) and concrete (b) | 18 | 20 | Lifetime 5 | Maintenance | 140 | |
| Mainly inert 9 | 6 | 6 | - | - | - | |
| SUM 10 | 100 | 100 | ||||
| Façade Material | Maintenance Price (Euro/m2) | SERF(p,i)1 Norway, Oslo (1/year × kg/m3) | SERF(p,i) × P 2 Norway, Oslo (Euro/m2 × Year × µg/m3) | Fraction of Materials—Norway, Oslo (%) | Dp,i, Norway 3, Oslo (OsloN) 4 (Euro/kg) |
|---|---|---|---|---|---|
| Cleaning | |||||
| Façades that are cleaned 5 | 32 | 2.3 × 10⁻³ (P) | 0.075 | 65, 44 | 3.5, 39.8 (60.7) |
| Window glass | 2.6 | 8.3 × 10⁻², 1.7 × 10⁻² (S) | 0.22, 0.045 | 15, 12 | 2.4, 6.5 (8.2) |
| 4.8 × 10⁻², 1.0 × 10⁻² (P) | 0.13, 0.026 | 1.3, 3.8 (4.8) | |||
| 3.5 × 10⁻², 7.3 × 10⁻³ (N) | 0.093, 0.019 | 0.70, 2.8 (3.5) | |||
| Atmospheric wear (corrosion) | |||||
| Rendering | 120 | 1.3 × 10⁻⁴, 1.7 × 10⁻⁴ (S) | 0.016, 0.020 | 18, 44 | 0.20, 10.8 (4.4) |
| 2.8 × 10⁻⁵, 5.7 × 10⁻⁵ (P) | 0.0034, 0.0069 | 0.042, 3.6 (1.5) | |||
| 1.2 × 10⁻⁴, 5.1 × 10⁻⁵ (N) | 0.014, 0.0061 | 0.13, 3.2 (1.3) | |||
| Limestone | 120 | 2.4 × 10⁻⁴, 1.5 × 10⁻⁵ (S) | 0.0028, 0.0018 | 0, 0 | 0 |
| 5.2 × 10⁻⁶ (P) | 0.0006 | 0 | |||
| 2.2 × 10⁻⁵, 4.6 × 10⁻⁶ (N) | 0.0026, 0.0006 | 0 | |||
| Painted metal (other than steel) | 55 | 1.1 × 10⁻⁴ (S) | 0.0059 | 18, 5 | 0.077, 0.35 (1.3) |
| Painted steel | 105 | 8.4 × 10⁻⁴ (S) | 0.088 | 5, 1 | 0.32, 1.1 (5.3) |
| Painted wood | 25 | 1.0 × 10⁻³ (S) | 0.026 | 18, 3 | 0.34, 0.93 (5.6) |
| Copper | 150 | 3.7 × 10⁻³, 1.8 × 10⁻³ (S) | 0.55, 0.27 | 1, 8 | 0.40, 25.7 (3.2) |
| Zinc (metal and galvanized) | 95 | 5.0 × 10⁻⁴, 4.2 × 10⁻⁴ (S) | 0.048, 0.040 | 1, 1 | 0.034, 0.48 (0.48) |
| Brick masonry, tile (unglazed) and concrete | 140 | 1.5 × 10⁻⁴ (S) | 0.021 | 18, 20 | 0.28, 5.1 (4.6) |
| Mainly inert | - | - | - | 6, 6 | - |
| SUM (SO2) | 4.0, 51.0 (33.1) | ||||
| SUM (PM10) | 4.8, 47.3 (66.9) | ||||
| SUM (NO2) | 0.8, 6.0 (4.8) | ||||
| SUM (total) | 100, 100 | 9.6, 104.3 (104.8) |
| Norway | Oslo | |||||
|---|---|---|---|---|---|---|
| Maintenance Operation: | Cleaning | Repair | SUM Maintenance | Cleaning | Repair | SUM Maintenance |
| Pollutant | ||||||
| SO2 | 2.4 {0.95–5.9} | 1.6 (1.2) {0.56–3.5} | 4.0 (3.5) {1.5–9.4} | 6.5 {2.6–16.3} | 44.4 (42.9) {17.5–109} | 51.0 (49.4) {20–125} |
| PM10 | 4.8 {1.9–12} | 0.04 (0.29) {0.065–0.41} | 4.8 (5.0) {2.0–12} | 43.6 {17.5–109} | 3.6 (4.4) {1.6–10.1} | 47.3 (48.0) {19–119} |
| NO2 | 0.7 {0.28–1.8} | 0.13 (0.37) {0.10–0.63} | 0.8 (1.1) {0.38–2.4} | 2.8 {1.1–7.0} | 3.2 (4.0) {1.5–9.1} | 6.0 (6.8) {2.6–16} |
| SUM | 7.8 {3.1–20} | 1.8 {0.73–4.5} | 9.6 {3.9–24} | 52.9 {21–132} | 51.3 {20–128} | 104.3 {42–261} |
| OsloN | |||
|---|---|---|---|
| Maintenance Operation: | Cleaning | Repair | SUM Maintenance |
| Pollutant | |||
| SO2 | 8.2 {3.3–20} | 24.9 (16.8) {10–62} | 33.1 (25.0) {13–88} |
| PM10 | 65.4 {26–164} | 1.5 (5.5) {0.6–3.7} | 66.9 (71.0) {27–167} |
| NO2 | 3.5 {1.4–8.7} | 1.3 (5.4) {0.5–3.3} | 4.8 (8.9) {1.9–12} |
| SUM | 77.0 {31–193} | 27.7 {11–69} | 104.8 {42–262} |
© 2020 by the author. Licensee MDPI, Basel, Switzerland. This article is an open access article distributed under the terms and conditions of the Creative Commons Attribution (CC BY) license (http://creativecommons.org/licenses/by/4.0/).
Share and Cite
Grøntoft, T. Estimation of Damage Cost to Building Façades per kilo Emission of Air Pollution in Norway. Atmosphere 2020, 11, 686. https://doi.org/10.3390/atmos11070686
Grøntoft T. Estimation of Damage Cost to Building Façades per kilo Emission of Air Pollution in Norway. Atmosphere. 2020; 11(7):686. https://doi.org/10.3390/atmos11070686
Chicago/Turabian StyleGrøntoft, Terje. 2020. "Estimation of Damage Cost to Building Façades per kilo Emission of Air Pollution in Norway" Atmosphere 11, no. 7: 686. https://doi.org/10.3390/atmos11070686
APA StyleGrøntoft, T. (2020). Estimation of Damage Cost to Building Façades per kilo Emission of Air Pollution in Norway. Atmosphere, 11(7), 686. https://doi.org/10.3390/atmos11070686