Characteristics of Carbonaceous Matter in Aerosol from Selected Urban and Rural Areas of Southern Poland


Abstract
1. Introduction
2. Methodology
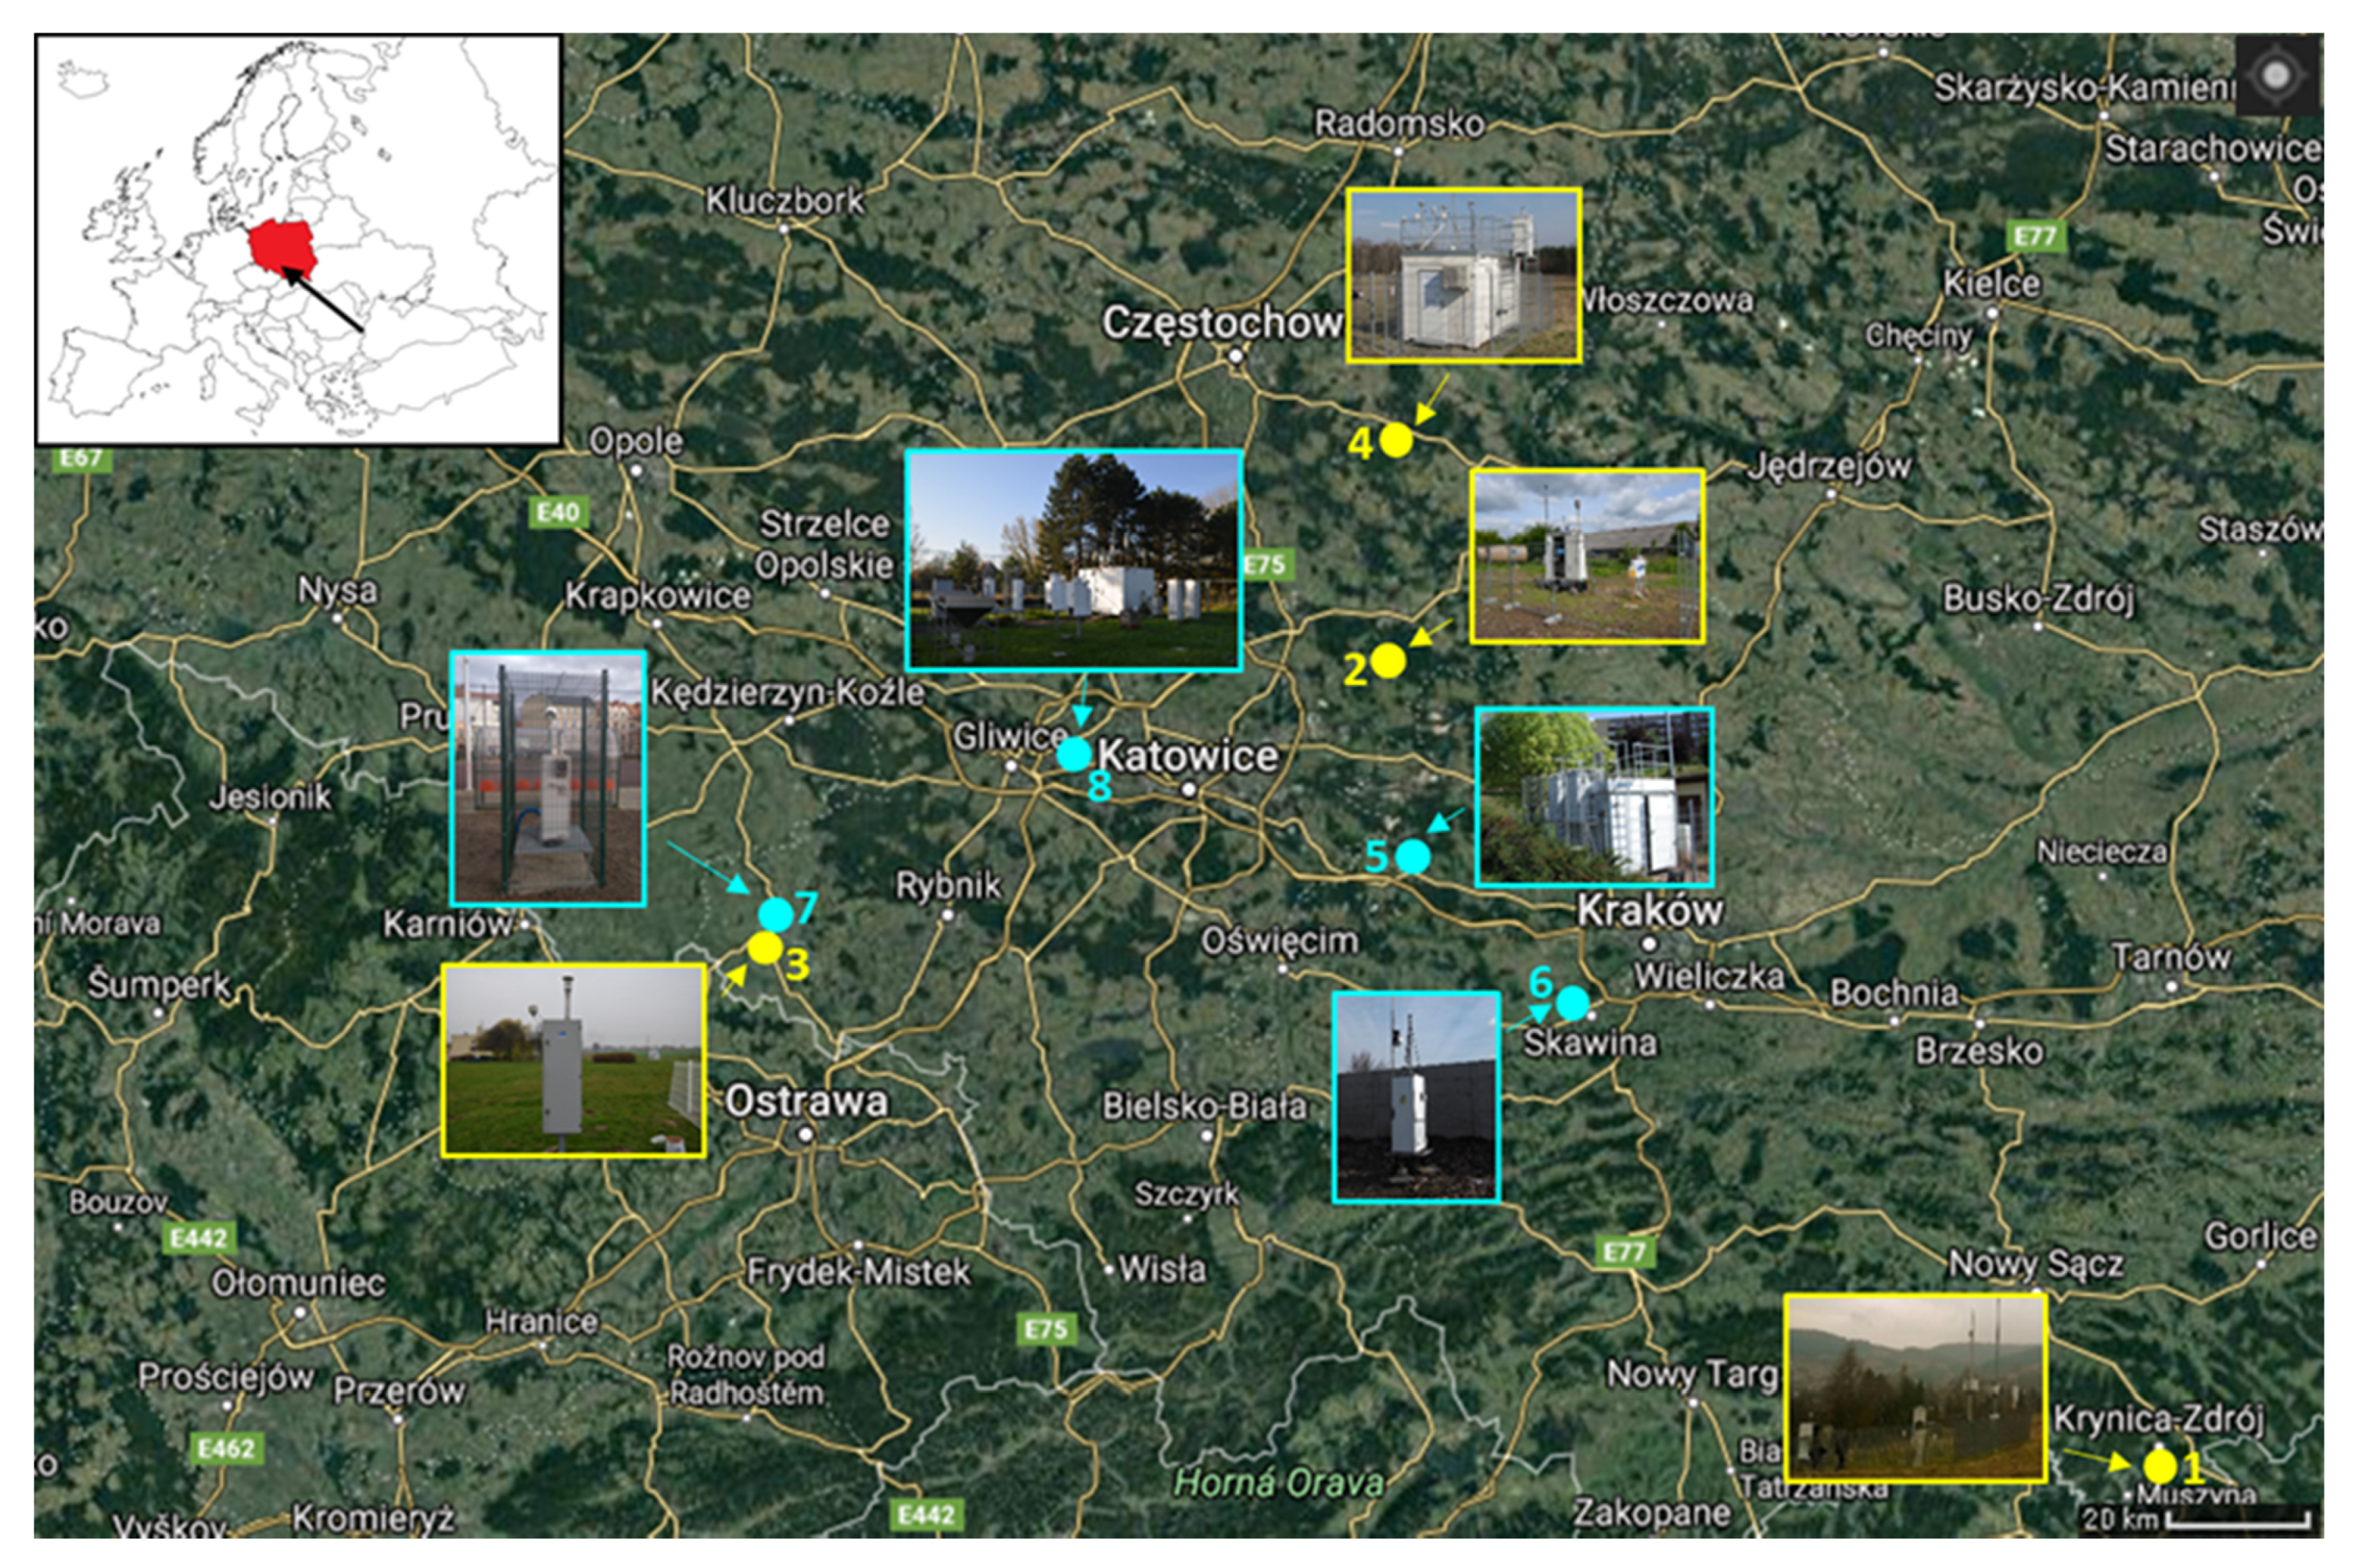
2.1. Study Area
2.2. Analytical Procedures
3. Results and Discussion
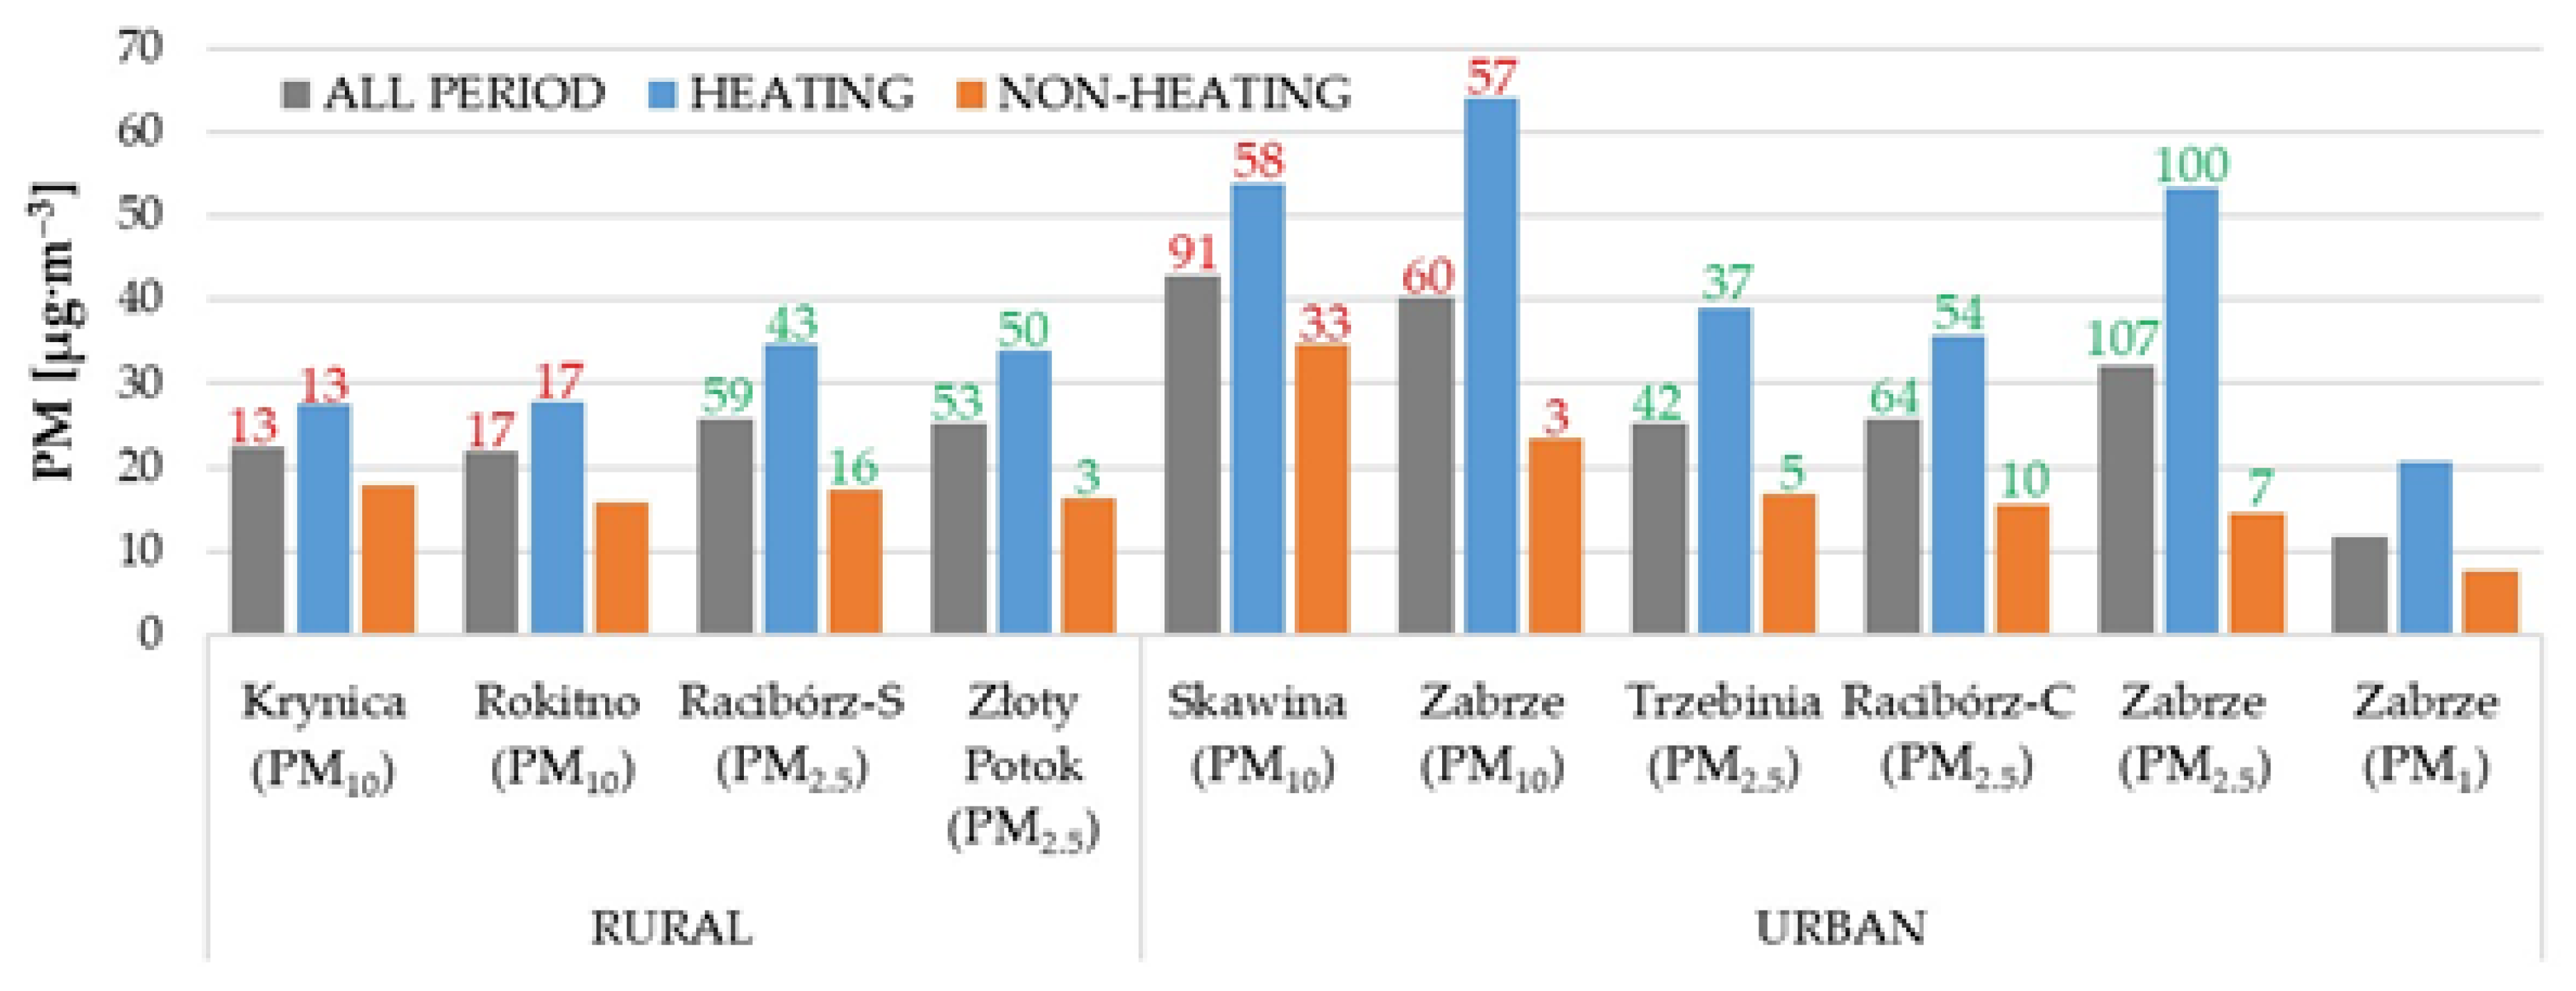
3.1. Spatiotemporal Variations of the PM Mass Concentrations
3.2. Concentrations and Contributions of OC and EC
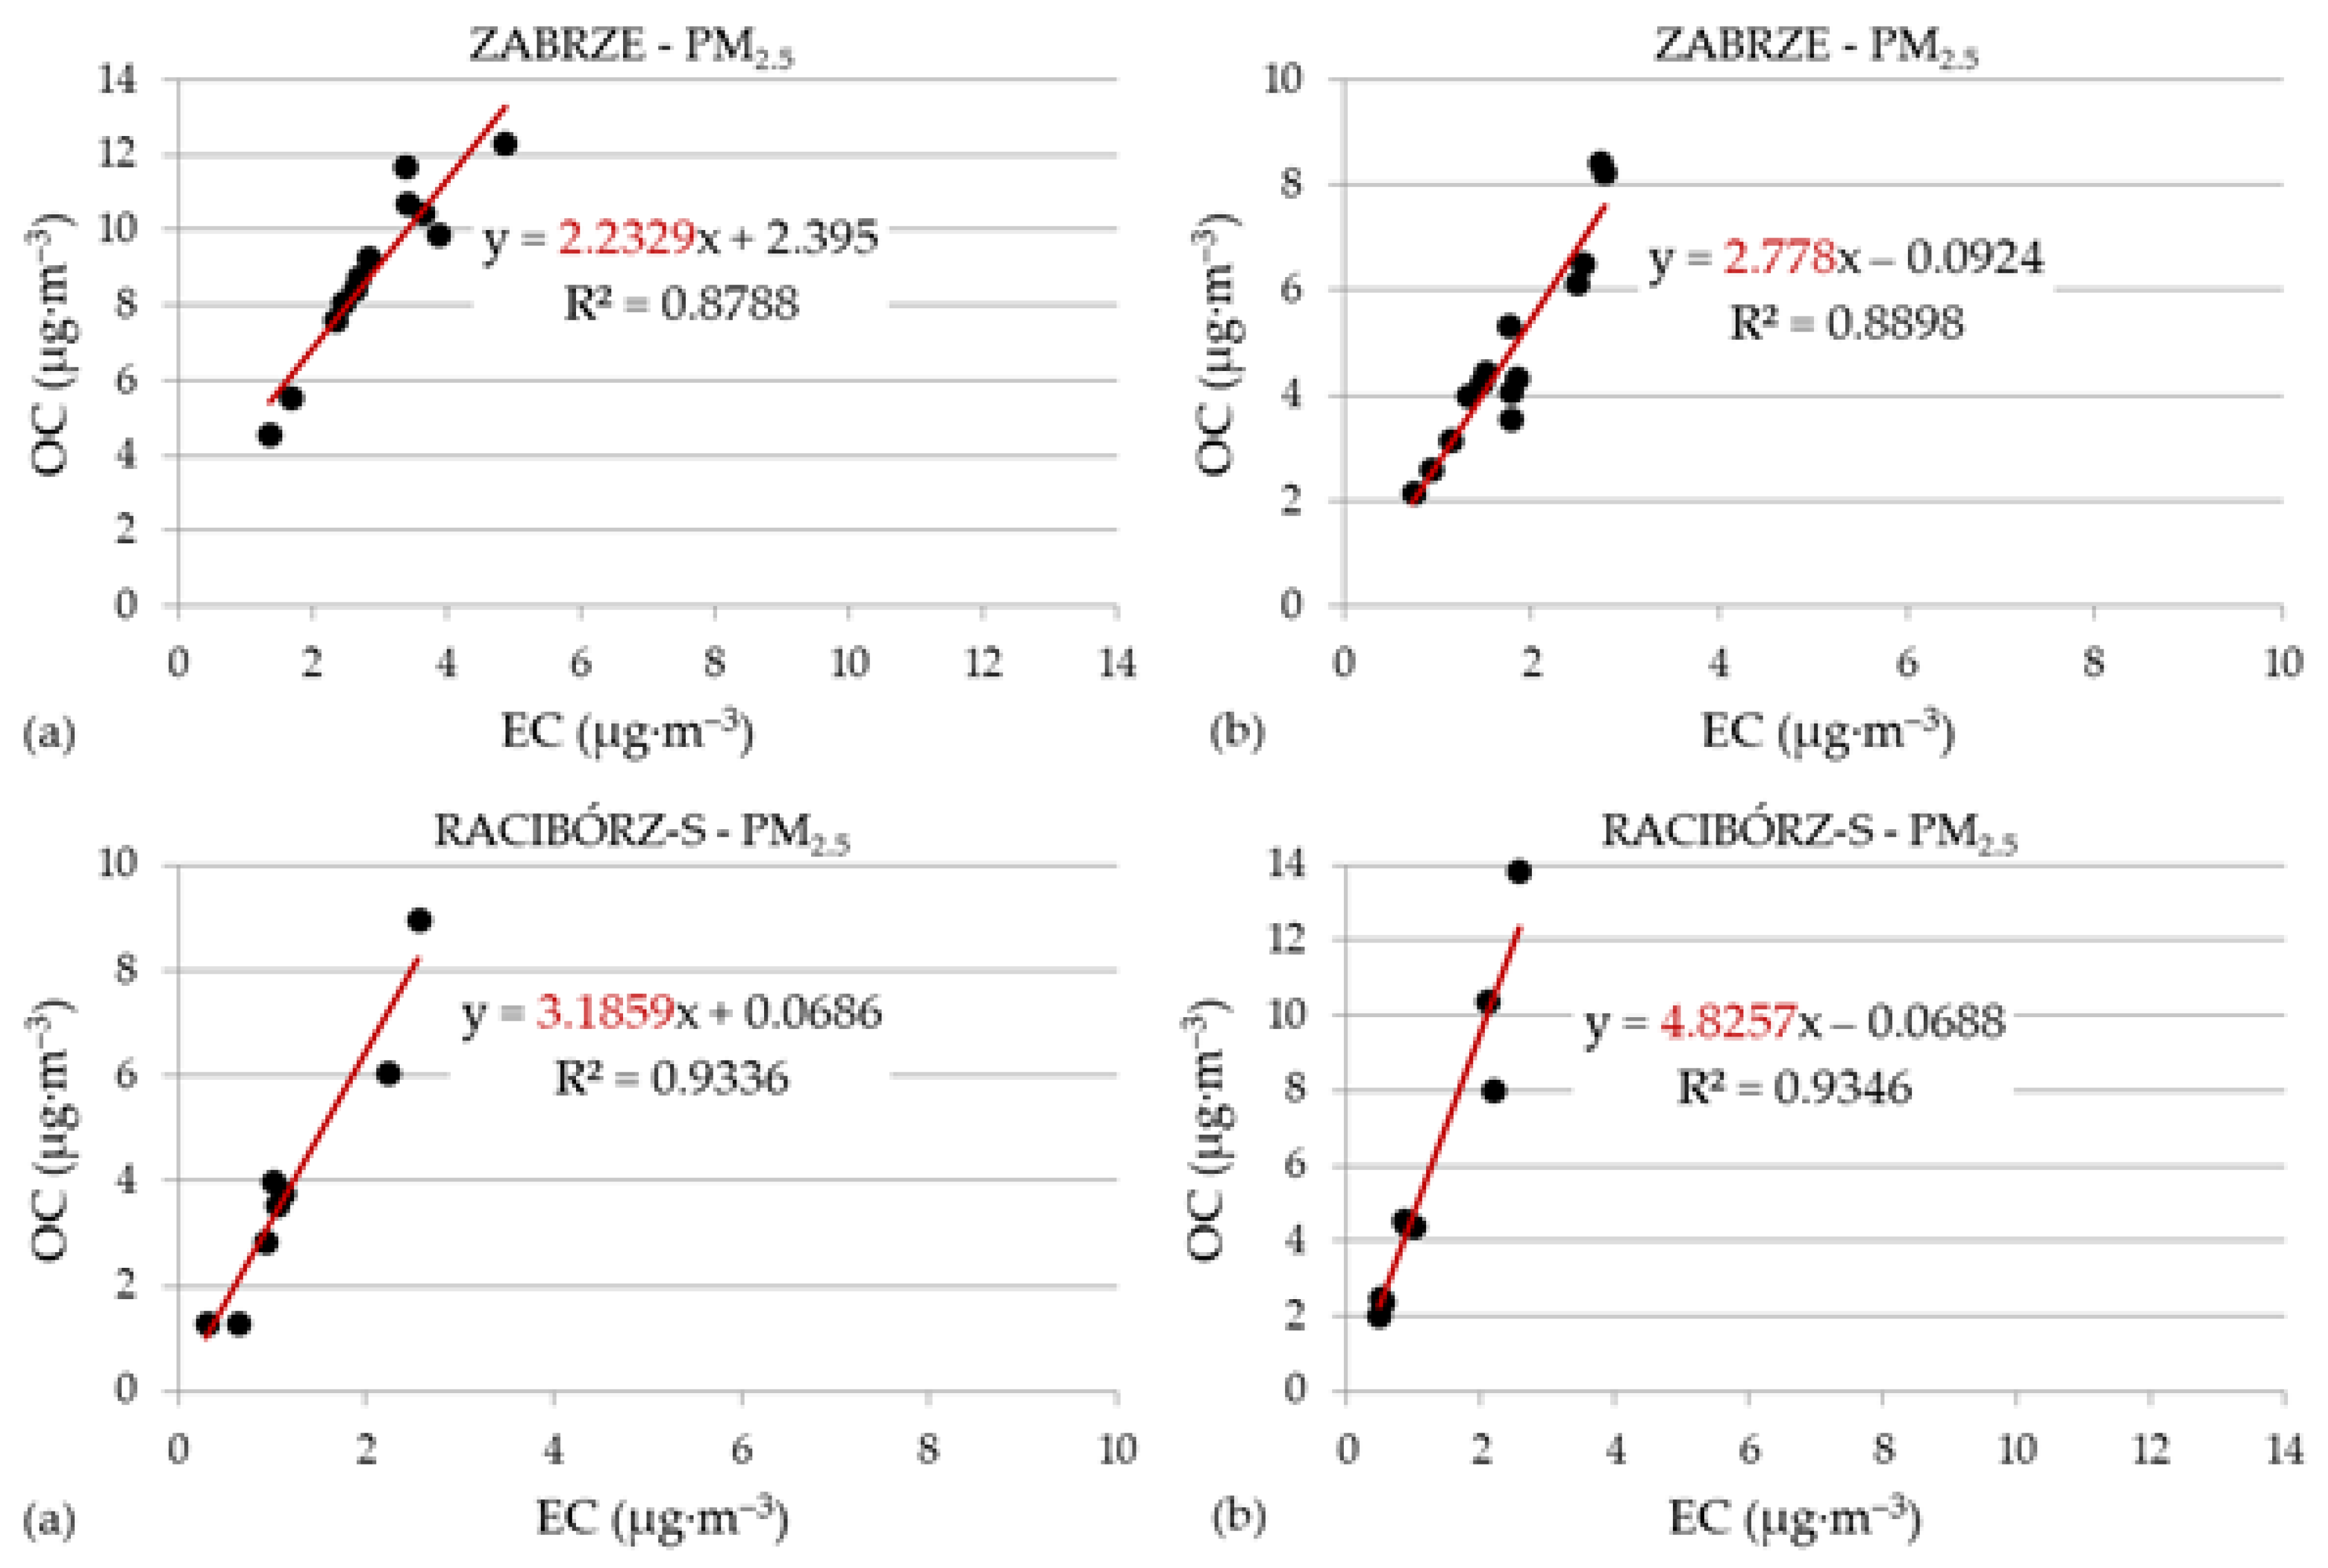
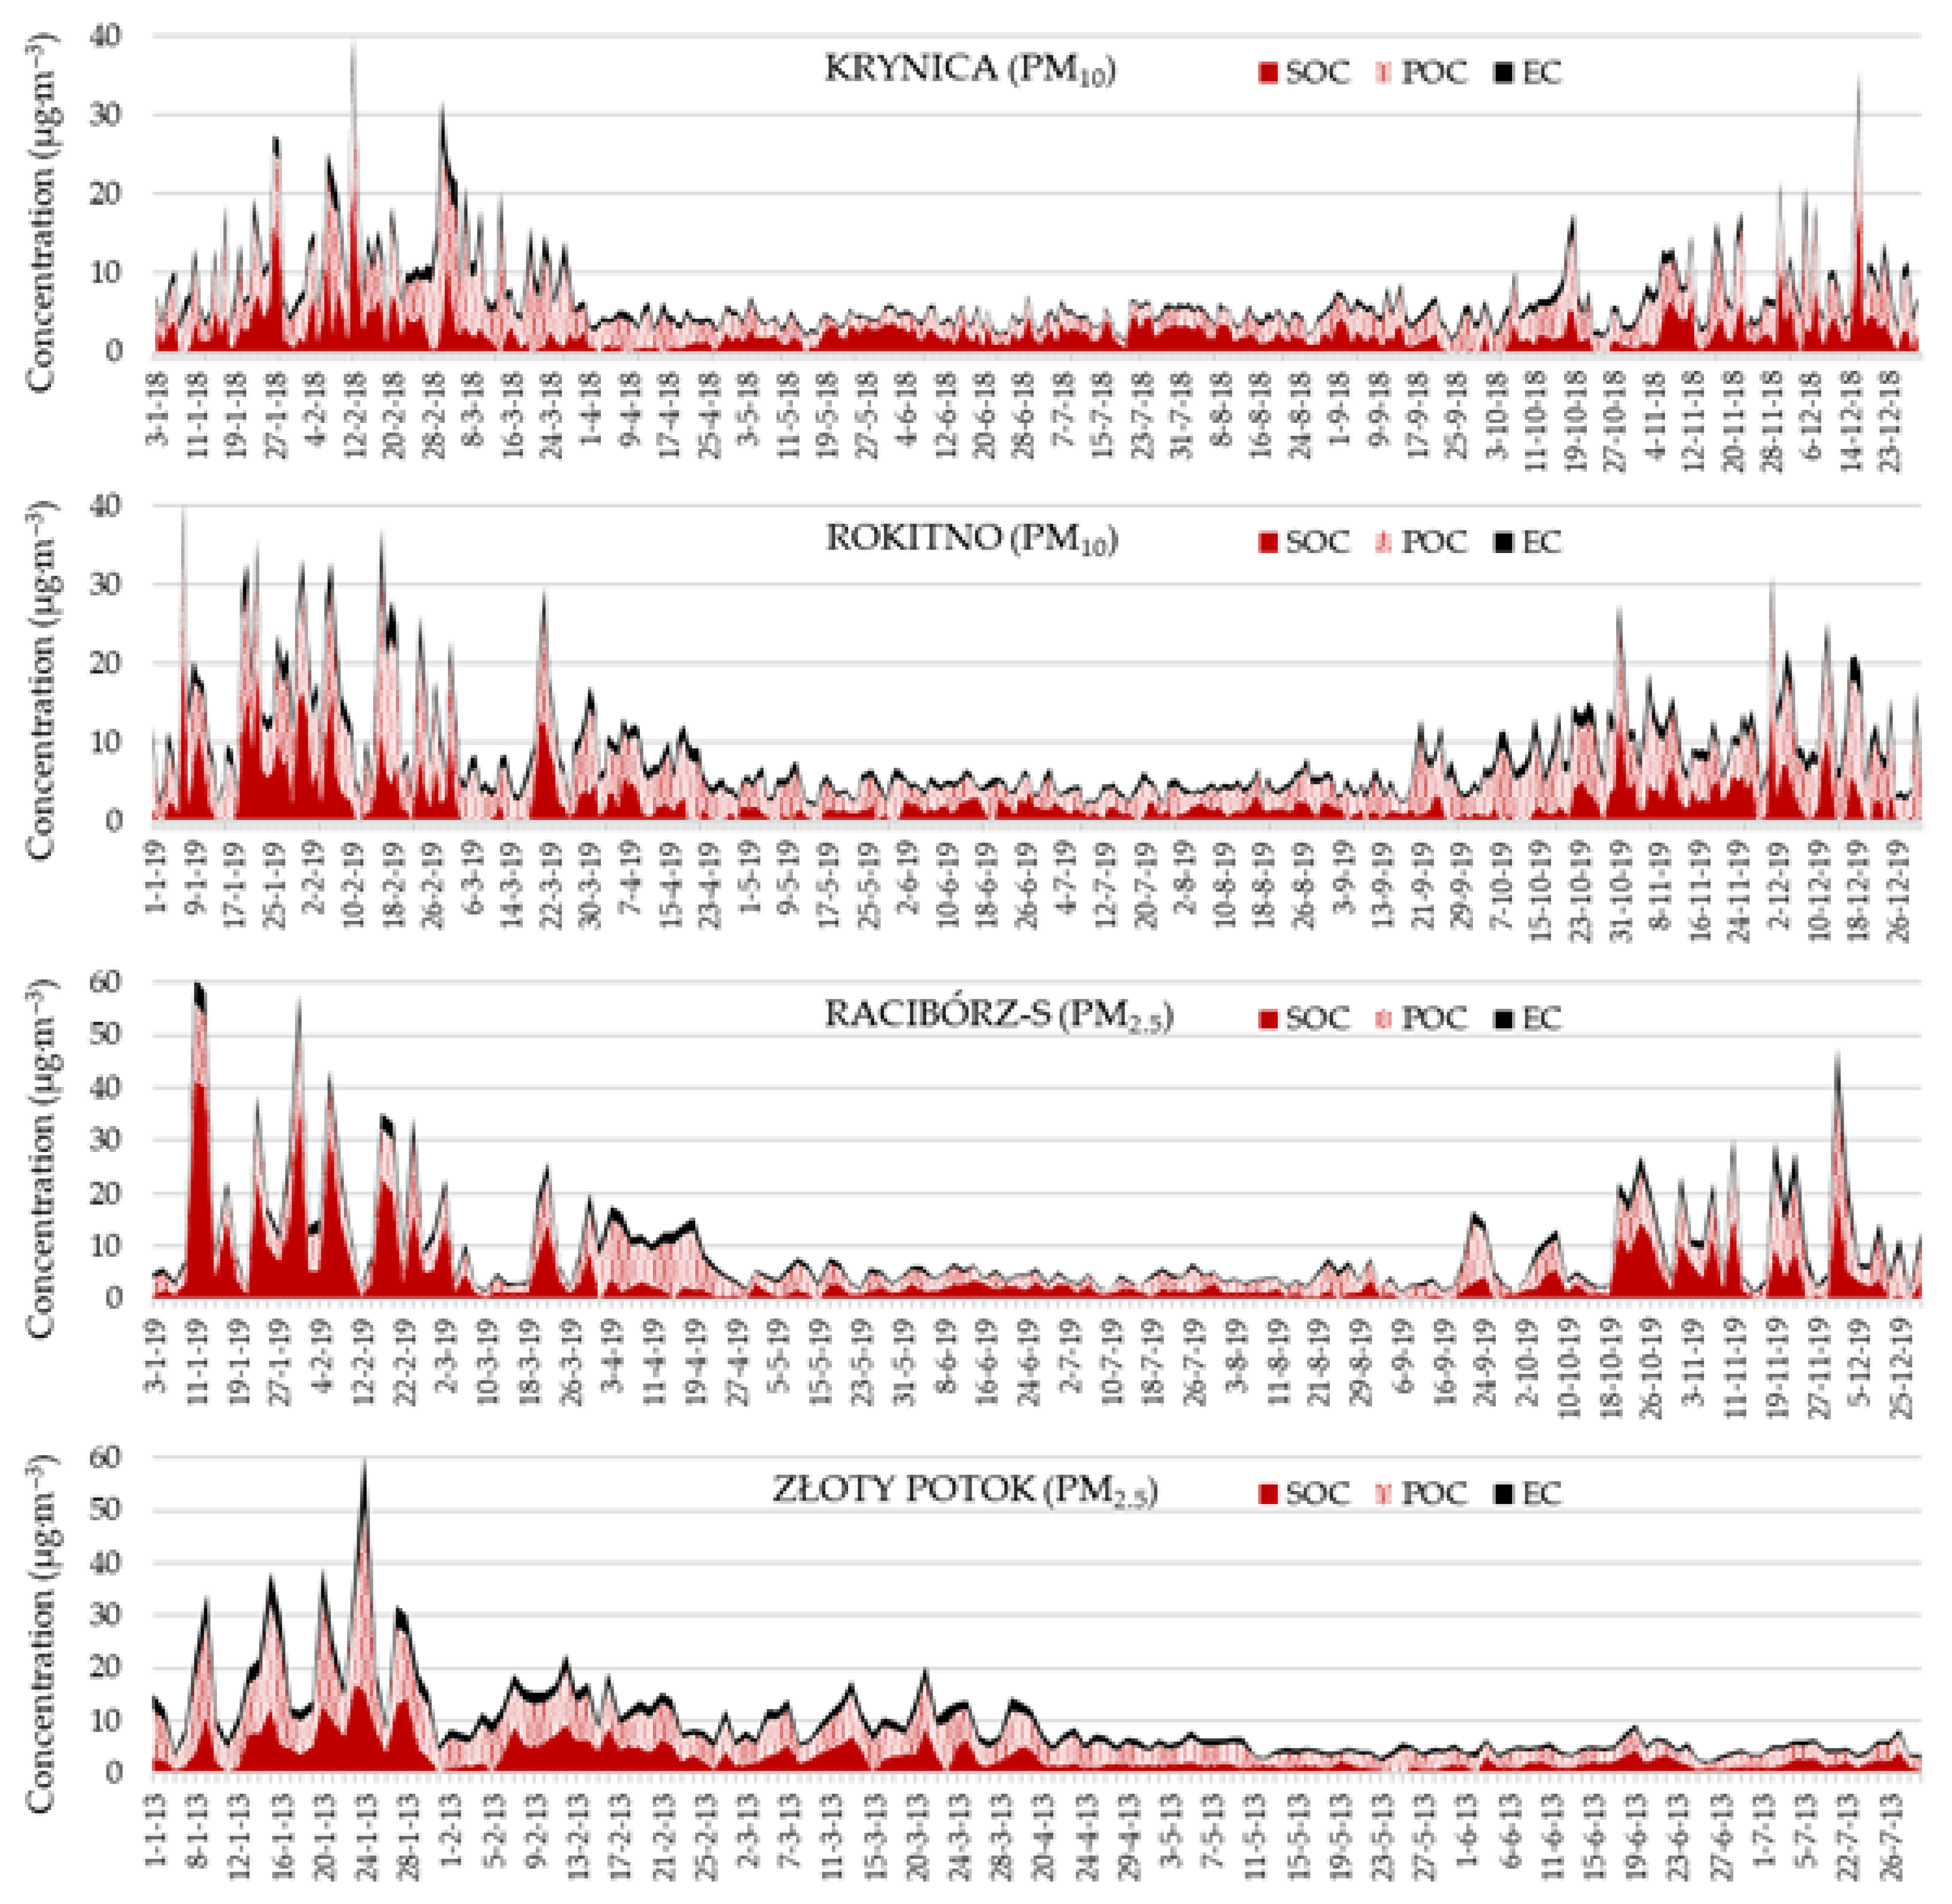
3.3. Assessment of Secondary and Primary Carbon Content
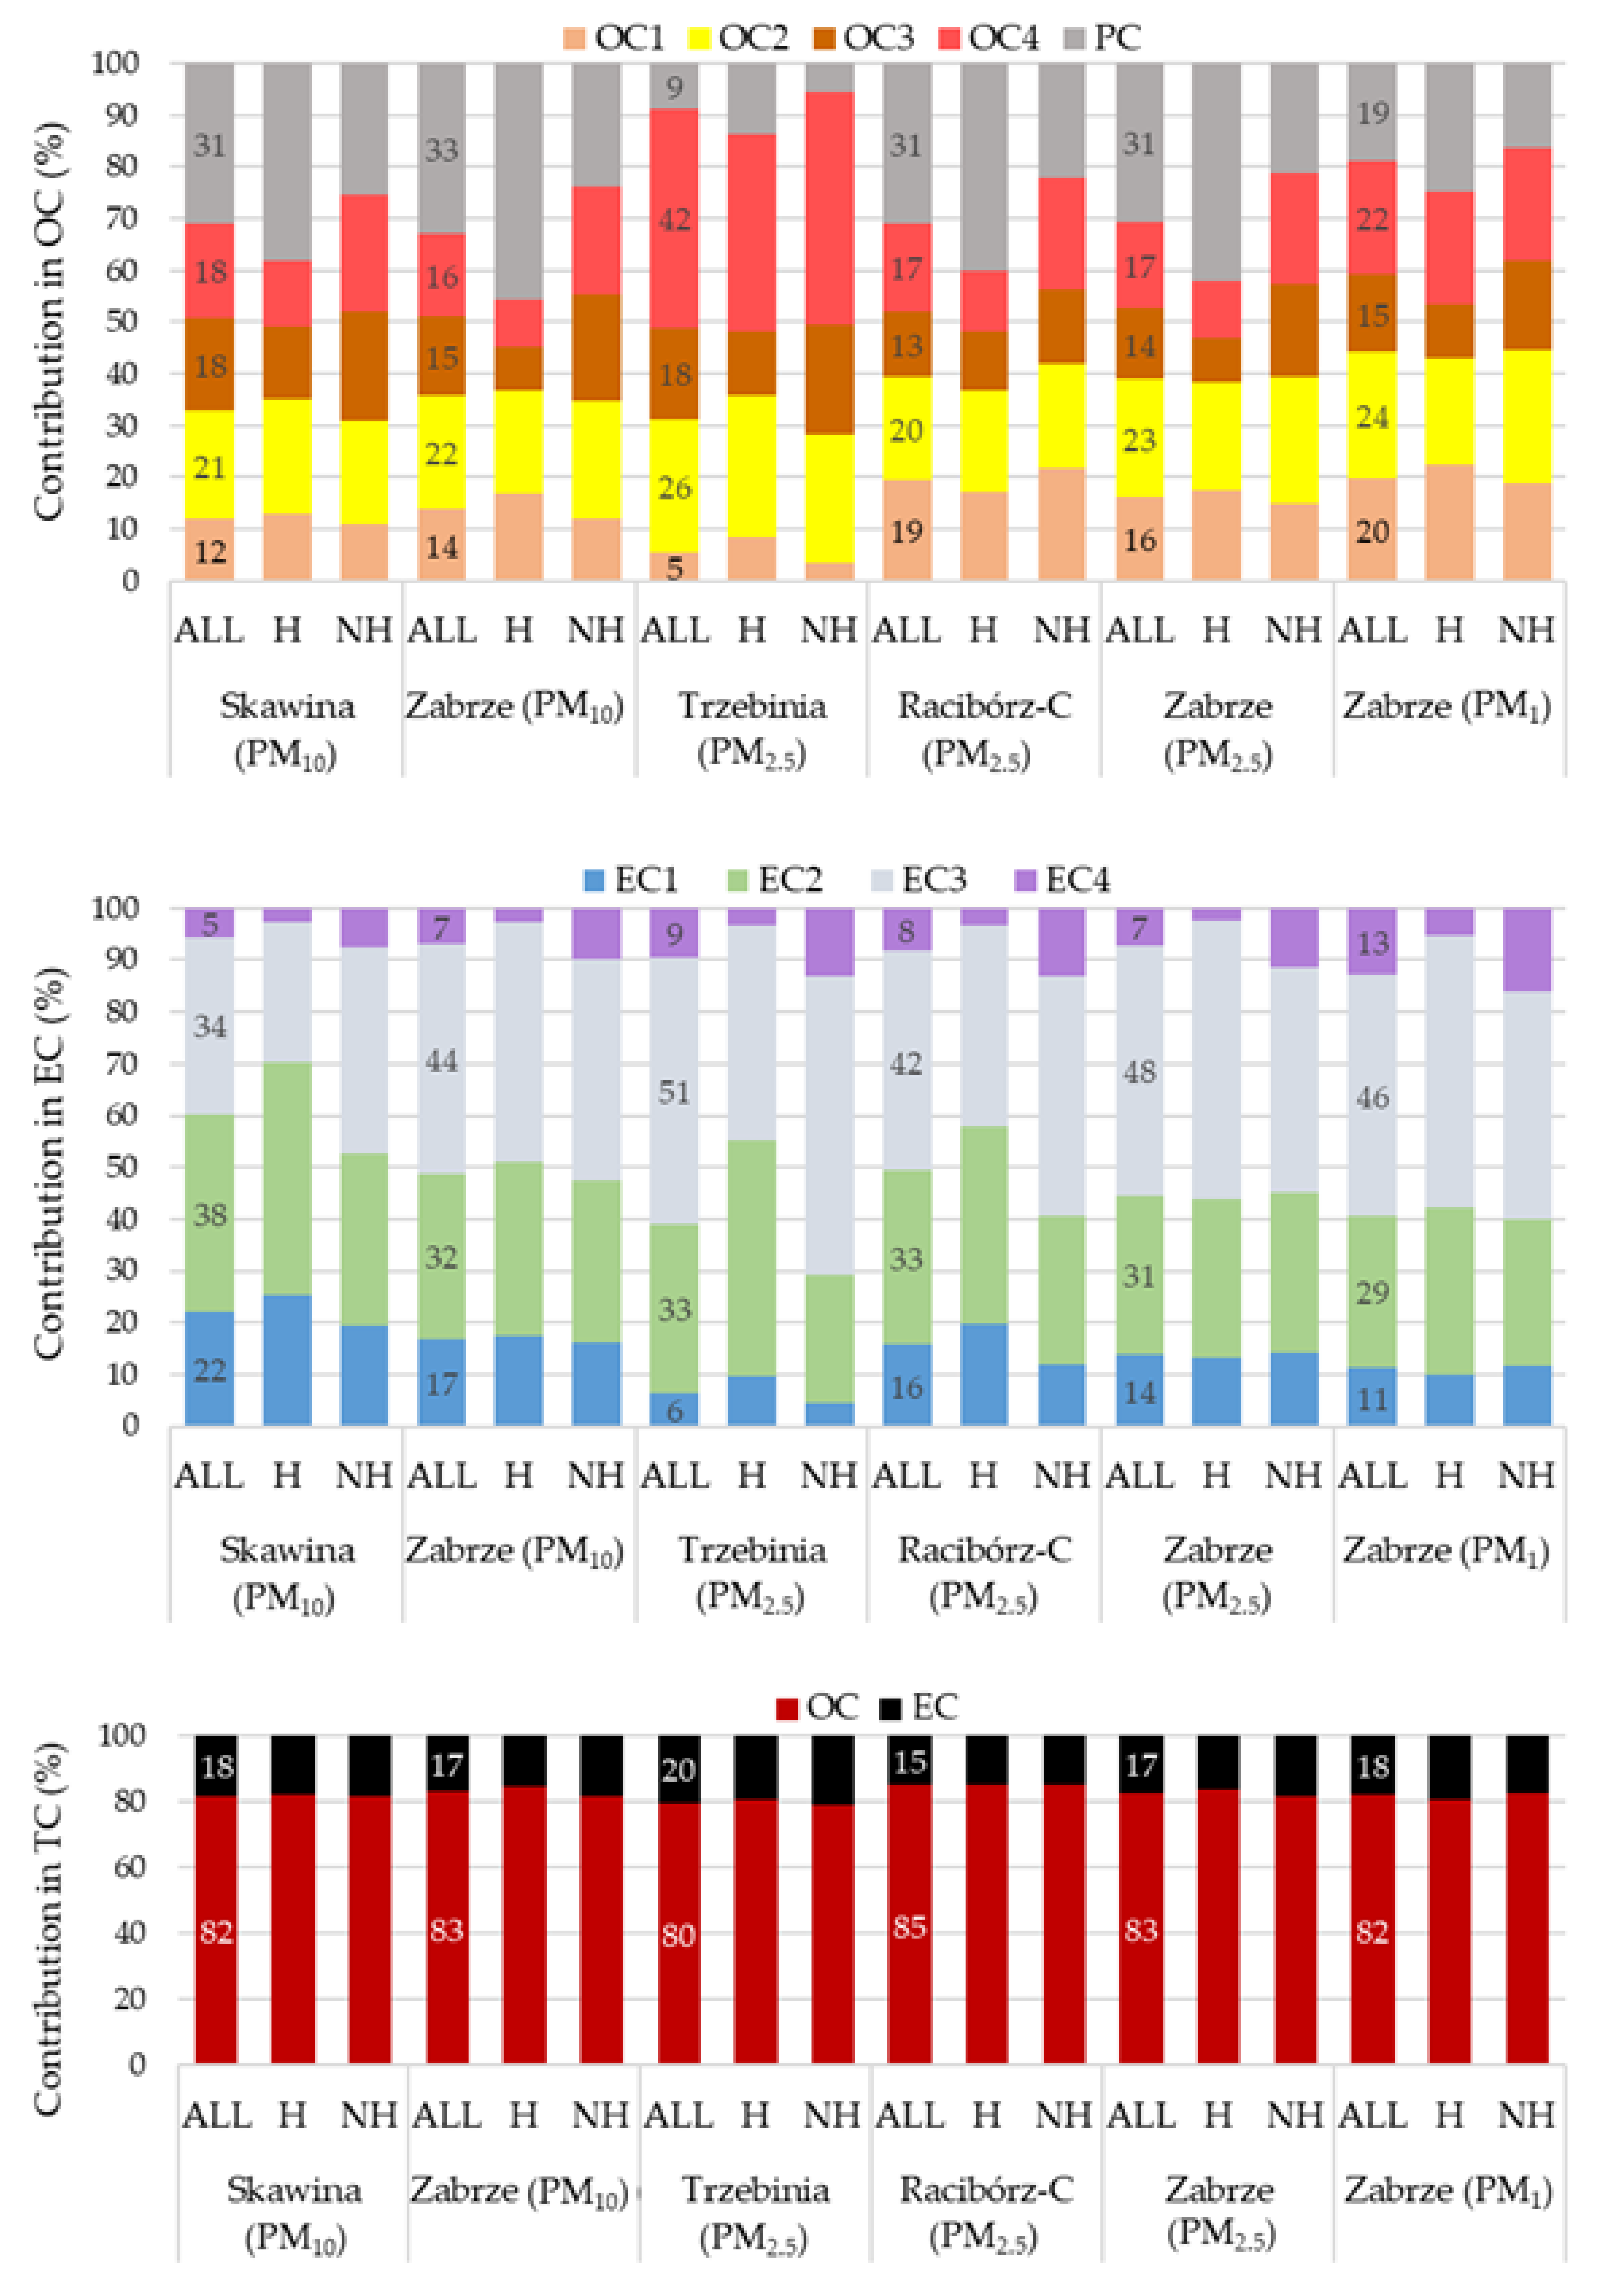
3.4. The Profile of the Carbon Fractions
4. Conclusions
Supplementary Materials
Author Contributions
Funding
Acknowledgments
Conflicts of Interest
References
- Rodríguez, S.; Querol, X.; Alastuey, A.; Viana, M.M.; Alcorcón, M.; Mantila, E.; Ruiz, C.R. Comparative PM10-PM2.5 source contribution study at rural urban and industrial sites during PM episodes in Eastern Spain. Sci. Total Environ. 2004, 328, 95–113. [Google Scholar] [CrossRef]
- Juda-Rezler, K.; Reizer, M.; Oudinet, J.P. Determination and analysis of PM10 source apportionment during episodes of air pollution in Central Eastern European urban areas: The case of wintertime 2006. Atmos. Environ. 2011, 45, 6557–6566. [Google Scholar] [CrossRef]
- Błaszczak, B.; Widziewicz-Rzońca, K.; Zioła, N.; Klejnowski, K.; Juda-Rezler, K. Chemical Characteristics of Fine Particulate Matter in Poland in Relation with Data from Selected Rural and Urban Background Stations in Europe. Appl. Sci. 2019, 9, 98. [Google Scholar] [CrossRef]
- Chow, J.C.; Lowenthal, D.H.; Chen, L.W.A.; Wang, X.; Watson, J.G. Mass reconstruction methods for PM2.5: A review. Air Qual. Atmos. Health 2015, 8, 243–263. [Google Scholar] [CrossRef]
- Rogula-Kozłowska, W.; Majewski, G.; Widziewicz, K.; Rogula-Kopiec, P.; Tytła, M.; Mathews, B.; Ciuka-Witrylak, M. Seaasonal variations of PM1-bound water Concentration in urban areas in Poland. Atmos. Pollut. Res. 2019, 10, 267–273. [Google Scholar] [CrossRef]
- Putaud, J.P.; Van Dingenen, R.; Alastuey, A.; Bauer, H.; Birmili, W.; Cyrys, J.; Flentje, H.; Fuzzi, S.; Gehrig, R.; Hansson, H.C.; et al. A European aerosol phenomenology 3: Physical and chemical characteristics of particulate matter from 60 rural, urban, and kerbside sites across Europe. Atmos. Environ. 2010, 44, 1308–1320. [Google Scholar] [CrossRef]
- Sandrini, S.; Fuzzi, S.; Piazzalunga, A.; Prati, P.; Bonasoni, P.; Cavalli, F.; Bove, M.C.; Calvello, M.; Cappelletti, D.; Colombi, C.; et al. Spatial and seasonal variability of carbonaceous aerosol across Italy. Atmos. Environ. 2014, 99, 587–598. [Google Scholar] [CrossRef]
- Godec, R.; Čačković, M.; Šega, K. Winter Mass Concentrations of Carbon Species in PM10, PM2.5 and PM1 in Zagreb Air, Croatia. Bull. Environ. Contam. Toxicol. 2012, 89, 1087–1090. [Google Scholar] [CrossRef] [PubMed]
- Reizer, M.; Juda-Rezler, K. Explaining the high PM10 concentrations observed in Polish urban areas. Air Qual. Atmos. Health 2016, 9, 517–531. [Google Scholar] [CrossRef] [PubMed]
- Zhu, C.S.; Cao, J.J.; Tsai, C.J.; Shen, Z.X.; Liu, S.X.; Huang, R.J.; Zhang, N.N.; Wang, P. The rural carbonaceous aerosols in coarse, fine, and ultrafine particles during haze pollution in northwestern China. Environ. Sci. Pollut. Res. 2016, 23, 4569–4575. [Google Scholar] [CrossRef]
- Li, X.; Jiang, L.; Bai, Y.; Yang, Y.; Liu, S.; Chen, X.; Xu, J.; Liu, Y.; Wang, Y.; Guo, X.; et al. Wintertime aerosol chemistry in Beijing during haze period: Significant contribution from secondary formation and biomass burning emission. Atmos. Res. 2019, 218, 25–33. [Google Scholar] [CrossRef]
- Vodička, P.; Schwarz, J.; Ždímal, V. Analysis of one year’s OC/EC data at a Prague suburban site with 2-h time resolution. Atmos. Environ. 2013, 77, 865–872. [Google Scholar] [CrossRef]
- Kucbel, M.; Sýkorová, M.; Růžičková, J. Carbonaceous particles in the air of the Moravian-Silesian Region, Czech Republic. Perspect. Sci. 2016, 7, 333–336. [Google Scholar] [CrossRef]
- Watson, J.G.; Chow, J.C.; Chen, L.W.A. Summary of organic and elemental carbon / black carbon analysis methods and intercomparisons. Aerosol Air Qual. Res. 2005, 5, 65–102. [Google Scholar] [CrossRef]
- Karanasiou, A.; Minguillón, M.C.; Alastuey, A.; Putaud, J.P.; Maenhaut, W.; Panteliadis, P.; Močnik, G.; Favez, O.; Kuhlbusch, T.A.J. Thermal-optical analysis for the measurement of elemental carbon (EC) and organic carbon (OC) in ambient air a literature review. Atmos. Meas. Tech. Disciss. 2015, 8, 9649–9712. [Google Scholar] [CrossRef]
- Fuzzi, S.; Andreae, M.O.; Huebert, B.J.; Kulmala, M.; Bond, T.C.; Boy, M.; Doherty, S.J.; Guenther, A.; Kanakidou, M.; Kawamura, K.; et al. Critical assessment of the current state of scientific knowledge, terminology, and research needs concerning the role of organic aerosols in the atmosphere, climate, and global change. Atmos. Chem. Phys. 2006, 6, 2017–2038. [Google Scholar] [CrossRef]
- Zhang, F.; Wang, Z.W.; Cheng, H.R.; Lv, X.P.; Gong, W.; Wang, X.M.; Zhang, G. Seasonal variations and chemical characteristics of PM2.5 in Wuhan, central China. Sci. Total Environ. 2015, 518, 97–105. [Google Scholar] [CrossRef] [PubMed]
- Qi, M.; Jiang, L.; Liu, Y.; Xiong, Q.; Sun, C.; Li, X.; Zhao, W.; Yang, X. Analysis of the Characteristics and Sources of Carbonaceous Aerosols in PM2.5 in the Beijing, Tianjin, and Langfang Region, China. Int. J. Environ. Res. Public Health 2018, 15, 1483. [Google Scholar] [CrossRef]
- Li, X.; Wang, L.; Wang, Y.; Wen, T.; Yang, Y.; Zhao, Y.; Wang, Y. Chemical composition and size distribution of airborne particulate matters in Beijing during the 2008 Olympics. Atmos. Environ. 2012, 50, 278–286. [Google Scholar] [CrossRef]
- Directive 2008/50/EC of the European Parliament and of the Council of 21 May 2008 on Ambient Air Quality and Cleaner Air for Europe. Available online: http://eur-lex.europa.eu/legal-content/en/ALL/?uri=CELEX:32008L0050 (accessed on 11 June 2008).
- Cavalli, F.; Viana, M.; Yttri, K.E.; Genberg, J.; Putaud, J.P. Toward a standarised thermal-optical protocol for measuring atmospheric organic and elemental carbon: The EUSAAR protocol. Atmos. Meas. Tech. 2010, 3, 79–89. [Google Scholar] [CrossRef]
- Bautista VII, A.T.; Pabroa, P.C.B.; Santos, F.L.; Quirit, L.L.; Asis, J.L.B.; Dy, M.A.K.; Martinez, J.P.G. Intercomparison between NIOSH, IMPROVE_A, and EUSAAR_2 protocols: Finding an optimal thermal-optical protocol for Philippines OC/EC samples. Atmos. Pollut. Res. 2015, 6, 334–342. [Google Scholar] [CrossRef]
- Vodička, P.; Schwarz, J.; Cusack, M.; Ždímal, V. Detailed comparison of OC/EC aerosol at an urban and a rural Czech background site during summer and winter. Sci. Total Environ. 2015, 518, 424–433. [Google Scholar] [CrossRef]
- dos Santos, D.A.M.; Brito, J.F.; Godoy, J.M.; Artaxo, P. Ambient concentrations and insights on organic and elemental carbon dynamics in São Paulo, Brazil. Atmos. Environ. 2016, 144, 226–233. [Google Scholar] [CrossRef]
- Merico, E.; Cesari, D.; Dinoi, A.; Gambaro, A.; Barbaro, E.; Guascito, M.R.; Giannossa, L.C.; Mangone, A.; Cintini, D. Inter-comparison of carbon content in PM10 and PM2.5 measured with two thermo-optical protocols on samples collected in a Mediterranean site. Environ. Sci. Pollut. Res. 2019, 26, 29334–29350. [Google Scholar] [CrossRef] [PubMed]
- Satsangi, A.; Pachauri, T.; Singla, V.; Lakhani, A.; Kumari, K.M. Carbonaceous aerosols at a suburban site in Indo-Gangetic plain. Indian J. Radio Space Phys. 2010, 39, 218–222. [Google Scholar]
- Mancilla, Y.; Herckes, P.; Fraser, M.P.; Mendoza, A. Secondary organic aerosol contributions to PM2.5 in Monterrey, Mexico: Temporal and seasonal variation. Atmos. Res. 2015, 153, 348–359. [Google Scholar] [CrossRef]
- Bond, T.C.; Doherty, S.J.; Fahey, D.W.; Forster, P.M.; Bernsten, T.; DeAngelo, B.J.; Flanner, M.G.; Ghan, S.; Kärcher, B.; Koch, D.; et al. Bounding the role of black carbon in the climate system: A scientific assessment. J. Geophys. Res. Atmos. 2013, 118, 5380–5552. [Google Scholar] [CrossRef]
- Magalhaes, S.; Baumgartner, J.; Weichenthal, S. Impacts of exposure to black carbon, elemental carbon, and ultrafine particles from indoor and outdoor sources on blood pressure in adults: A review of epidemiological evidence. Environ. Res. 2018, 161, 345–353. [Google Scholar] [CrossRef]
- Bond, T.C.; Bergstrom, R.W. Light absorption by carbonaceous particles: An investigative review. Aerosol Sci. Technol. 2006, 40, 27–67. [Google Scholar] [CrossRef]
- Xiang, P.; Zhou, X.; Duan, J.; Tan, J.; He, K.; Yuan, C.; Ma, Y.; Zhang, Y. Chemical characteristics of water-soluble organic compounds (WSOC) in PM2.5 in Beijing, China: 2011–2012. Atmos. Res. 2017, 183, 104–112. [Google Scholar] [CrossRef]
- Zhu, C.S.; Chen, C.C.; Vao, J.J.; Tsai, C.J.; Chou, C.C.-K.; Liu, S.C.; Roam, G.D. Characterization of carbon fractions for atmospheric fine particles and nanoparticles in a highway tunnel. Atmos. Environ. 2010, 44, 2668–2673. [Google Scholar] [CrossRef]
- Mikuška, P.; Křúmal, K.; Večeřa, Z. Characterization of organic compounds in the PM2.5 aerosols in winter in an industrial urban area. Atmos. Environ. 2015, 105, 97–108. [Google Scholar] [CrossRef]
- Khan, M.B.; Masiol, M.; Formenton, G.; Di Gilio, A.; de Gennaro, G.; Agostinelli, C.; Pavoni, B. Carbonaceous PM2.5 and secondary organic aerosol across the Veneto region (NE Italy). Sci. Total Environ. 2016, 542, 172–181. [Google Scholar] [CrossRef] [PubMed]
- Zhan, C.; Zhang, J.; Zheng, J.; Yao, R.; Wang, P.; Liu, H.; Xiao, W.; Liu, X.; Cao, J. Characterization of carbonaceous fractions in PM2.5 and PM10 over a typical industrial city in central China. Environ. Sci. Pollut. Res. 2019, 26, 16855–16867. [Google Scholar] [CrossRef] [PubMed]
- Rogula-Kozłowska, W.; Klejnowski, K.; Rogula-Kopiec, P.; Ośródka, L.; Krajny, E.; Błaszczak, B.; Mathews, B. Spatial and seasonal variability of the mass concentrations and chemical composition of PM2.5 in Poland. Air Qual. Atmos. Health 2014, 7, 41–58. [Google Scholar] [CrossRef]
- Błaszczak, B.; Rogula-Kozłowska, W.; Mathews, B.; Juda-Rezler, K.; Klejnowski, K.; Rogula-Kopiec, P. Chemical Compositions of PM2.5 at Two Non-Urban Sites from the Polluted Region in Europe. Aerosol Air Qual. Res. 2016, 16, 2333–2348. [Google Scholar] [CrossRef]
- Wawroś, A.; Talik, E.; Żelechower, M.; Pastuszka, J.S.; Skrzypek, D.; Ujma, Z. Seasonal Variation in the Chemical Composition and Morphology of Aerosol Particles in the Centre of Katowice, Poland. Pol. J. Environ. Stud. 2003, 12, 619–627. [Google Scholar]
- Klejnowski, K.; Pastuszka, J.S.; Rogula-Kozłowska, W.; Talik, E.; Krasa, A. Mass Size Distribution and Chemical Composition of the Surface Layer of Summer and Winter Airborne Particles in Zabrze, Poland. Bull. Environ. Contam. Toxicol. 2012, 88, 255–259. [Google Scholar] [CrossRef]
- Guerreiro, C. Air Quality in Europe–2013 Report; EEA Report No 9/2013; Publication office of the European Union: Luxembourg, 2013; ISBN 978-92-9213-406-8. [Google Scholar]
- Chief Inspectorate of Environmental Protection. Air Quality Portal. Available online: http://powietrze.gios.gov.pl/pjp/current?lang=en (accessed on 14 April 2020).
- Rogula-Kozłowska, W.; Sówka, I.; Mathews, B.; Klejnowski, K.; Zwoździak, A.; Kwiecińska, K. Size-Resolved Water-Soluble Ionic Composition of Ambient Particles in an Urban Area in Southern Poland. J. Environ. Prot. 2013, 4, 371–379. [Google Scholar] [CrossRef]
- PN-EN 14907:2006. Ambient Air Quality—Standard Gravimetric Measurement Method for the Determination of the PM2.5 Mass Fraction of Suspended Particulate Matter; The National Standards Authority of Ireland (NSAI): Dublin, Ireland, 2006.
- PN-EN 12341:2014-07. Ambient Air–Standard Gravimetric Measurement Method to Determine the Concentration of Mass Fractions PM10 or PM2.5 Particulate Matter; The National Standards Authority of Ireland (NSAI): Dublin, Ireland, 2014. [Google Scholar]
- Duan, J.; Tan, J.; Cheng, D.; Bi, X.; Deng, W.; Sheng, G.; Fu, J.; Wong, M.H. Sources and characteristics of carbonaceous aerosol in two largest cities in Pearl River Delta Region, China. Atmos. Environ. 2007, 41, 2895–2903. [Google Scholar] [CrossRef]
- Pio, C.; Cerqueira, M.; Harrison, R.M.; Nunes, T.; Mirante, F.; Alves, C.; Oliveira, C.; de la Campa, A.S.; Artíñano, B.; Matos, M. OC/EC ratio observations in Europe: Re-thinking the approach for apportionment between primary and secondary organic carbon. Atmos. Environ. 2011, 45, 6121–6132. [Google Scholar] [CrossRef]
- Castro, L.M.; Pio, C.A.; Harrison, R.M.; Smith, D.J.T. Carbonaceous aerosol in urban and rural European atmospheres: Estimation of secondary organic carbon concentrations. Atmos. Environ. 1999, 33, 2771–2781. [Google Scholar] [CrossRef]
- Błaszczak, B.; Juda-Rezler, K.; Rogula-Kozłowska, W.; Reizer, M.; Mathews, B.; Maciejewska, K.; Klejnowski, K. Ionic Composition of Fine Particulate Matter from Urban and Regional Background Sites in Poland. Environ. Eng. Sci. 2017, 34, 236–250. [Google Scholar] [CrossRef]
- Juda-Rezler, K.; Reizer, M.; Maciejewska, K.; Błaszczak, B.; Klejnowski, K. Characterization of atmospheric PM2.5 sources at a Central European urban background site. Sci. Total Environ. 2020, 713, 136729. [Google Scholar] [CrossRef] [PubMed]
- Strader, R.; Lurmann, F.; Pandis, S.N. Evaluation of secondary organic aerosol formation in winter. Atmos. Environ. 1999, 33, 4849–4863. [Google Scholar] [CrossRef]
- Pavuluri, C.M.; Kawamura, K.; Aggarwal, S.G.; Swaminathan, T. Characteristics, seasonality and sources of carbonaceous and ionic components in the tropical aerosols from Indian region. Atmos. Chem. Phys. 2011, 11, 8215–8230. [Google Scholar] [CrossRef]
- World Health Organization. Health Effects of Particulate Matter. Policy Implications for Countries in Eastern Europe, Caucasus and Central Asia; WHO Regional Office for Europe: Copenhagen, Denmark, 2013; ISBN 978-92-890-0001-7. [Google Scholar]
- Behera, S.N.; Sharma, M.; Dikshit, O.; Shukla, S.P. GIS-Based Emission Inventory, Dispersion Modeling, and Assessment for Source Contributions of Particulate Matter in an Urban Environment. Water Air Soil Pollut. 2011, 218, 423–436. [Google Scholar] [CrossRef]
- Carpentieri, M. Pollutant dispersion in the urban environment. Rev. Environ. Sci. Bio 2013, 12, 5–8. [Google Scholar] [CrossRef]
- Chen, R.; Hu, B.; Liu, Y.; Xu, J.; Yang, G.; Xu, D.; Chen, C. Beyond PM2.5: The role of ultrafine particles on adverse health effects of air pollution. Biochim. Biophys. Acta 2016, 1860, 2844–2855. [Google Scholar] [CrossRef]
- Landkocz, Y.; Ledoux, F.; André, V.; Cazier, F.; Genevray, P.; Dewaele, D.; Martin, P.J.; Lepers, C.; Verdin, A.; Courcot, L.; et al. Fine and ultrafine atmospheric particulate matter at a multi-influenced urban site: Physicochemical characterization, mutagenicity and cytotoxicity. Environ. Pollut. 2017, 221, 130–140. [Google Scholar] [CrossRef]
- Freney, E.J.; Sellegri, K.; Canonaco, F.; Boulon, J.; Hervo, M.; Weigel, R.; Pichon, J.M.; Colomb, A.; Prévôt, A.S.H.; Laj, P. Seasonal variations in aerosol particle composition at the Puy-de-Dôme research station in France. Atmos. Chem. Phys. 2011, 11, 13047–13059. [Google Scholar] [CrossRef]
- Pikridas, M.; Bougiatioti, A.; Hildebrandt, L.; Engelhart, G.J.; Kostenidou, E.; Mohr, C.; Prévǒt, A.S.H.; Kouvarakis, G.; Zarmpas, P.; Burkhart, J.F.; et al. The Finokalia aerosol measurement experiment 2008 (FAME-08): An overview. Atmos. Chem. Phys. 2010, 10, 6793–6806. [Google Scholar] [CrossRef]
- Bressi, M.; Sciare, J.; Ghersi, V.; Bonnaire, N.; Nicolas, J.B.; Petit, J.E.; Moukhtar, S.; Rosso, A.; Mihalopoulos, N.; Féron, A. A one-year comprehensive chemical characterisation of fine aerosol (PM2.5) at urban, suburban and rural background sites in the region of Paris (France). Atmos. Chem. Phys. 2013, 13, 7825–7844. [Google Scholar] [CrossRef]
- Temesi, D.; Molnár, A.; Mészáros, E.; Feczkó, T.; Gelencsér, A.; Kiss, G.; Krivácsy, Z. Size resolved chemical mass balance of aerosol particles over rural Hungary. Atmos. Environ. 2001, 35, 4347–4355. [Google Scholar] [CrossRef]
- Szigeti, T.; Óvári, M.; Dunster, C.; Kelly, F.J.; Lucarelli, F.; Záray, G. Changes in chemical composition and oxidative potential of urban PM2.5 between 2010 and 2013 in Hungary. Sci. Total Environ. 2015, 518, 534–544. [Google Scholar] [CrossRef]
- Salameh, D.; Detournay, A.; Pey, J.; Pérez, N.; Liguori, F.; Saraga, D.; Bove, M.C.; Brotto, P.; Cassola, F.; Massabò, D.; et al. PM2.5 chemical composition in five European Mediterranean cities: A 1-year study. Atmos. Res. 2015, 155, 102–117. [Google Scholar] [CrossRef]
- Moroni, B.; Castellini, S.; Crocchianti, S.; Piazzalunga, A.; Fermo, P.; Scardazza, F.; Cappelletti, D. Ground-based measurements of long-range transported aerosol at the rural regional background site of Monte Martano (Central Italy). Atmos. Res. 2015, 155, 26–36. [Google Scholar] [CrossRef]
- Braniš, M.; Domasová, M.; Řezáčová, P. Particulate air pollution in a small settlement: The effect of local heating. Appl. Geochem. 2007, 22, 1255–1264. [Google Scholar] [CrossRef]
- Samek, L.; Zwoździak, A.; Sówka, I. Chemical characterization and source identification of particulate matter PM10 in a rural and urban site in Poland. Environ. Prot. Eng. 2013, 39, 91–103. [Google Scholar] [CrossRef]
- Kumar, P.; Kumar, S.; Yadav, S. Seasonal variations in size distribution, water-soluble ions, and carbon content of size-segregated aerosols over New Delhi. Environ. Sci. Pollut. Res. 2018, 25, 6061–6078. [Google Scholar] [CrossRef]
- Mirante, F.; Salvador, P.; Pio, C.; Alves, C.; Artiñano, B.; Caseiro, A.; Revuelta, M.A. Size fractionated aerosol composition at roadside and background environments in the Madrid urban atmosphere. Atmos. Res. 2014, 138, 278–292. [Google Scholar] [CrossRef]
- Waked, A.; Afif, C.; Formenti, P.; Chevallier, S.; El-Haddad, I.; Doussin, J.F.; Borbon, A.; Seigneur, C. Characterization of organic tracer compounds in PM2.5 at a semi-urban site in Beirut, Lebanon. Atmos. Res. 2014, 143, 85–94. [Google Scholar] [CrossRef]
- Liu, Z.; Gao, W.; Yu, Y.; Hu, B.; Xin, J.; Sun, Y.; Wang, L.; Wang, G.; Bi, X.; Zhang, G.; et al. Characteristics of PM2.5 mass concentrations and chemical species in urban and background areas of China: Emerging results from the CARE-China network. Atmos. Chem. Phys. 2018, 18, 8849–8871. [Google Scholar] [CrossRef]
- Zhao, M.; Huang, Z.; Qiao, T.; Zhang, Y.; Xiu, G.; Yu, J. Chemical characterization, the transport pathways and potential sources of PM2.5 in Shanghai: Seasonal variations. Atmos. Res. 2015, 158, 66–78. [Google Scholar] [CrossRef]
- Golly, B.; Waked, A.; Weber, S.; Samake, A.; Jacob, V.; Conil, S.; Rangognio, J.; Chrétien, E.; Vagnot, M.P.; Robic, P.Y.; et al. Organic markers and OC source apportionment for seasonal variations of PM2.5 at 5 rural sites in France. Atmos. Environ. 2019, 198, 142–157. [Google Scholar] [CrossRef]
- Zheng, M.; Salmon, L.G.; Schauer, J.J.; Zeng, L.; Kiang, C.S.; Zhang, Y.; Cass, G.R. Seasonal Trends in PM2.5 Source Contributions in Beijing, China. Atmos. Environ. 2005, 39, 3967–4166. [Google Scholar] [CrossRef]
- Pio, C.A.; Legrand, M.; Oliveira, T.; Alfonso, J.; Santos, C.; Caseiro, A.; Fialho, P.; Barata, F.; Puxbaum, H.; Sanchez-Ochoa, A.; et al. Climatology of aerosol composition (organic versus inorganic) at nonurban sites on a west-east transect across Europe. J. Geophys. Res. 2007, 112, D23S02. [Google Scholar] [CrossRef]
- Satsangi, A.; Pachauri, T.; Singla, V.; Lakhani, A.; Kumari, K.M. Organic and elemental carbon aerosols at a suburban site. Atmos. Res. 2012, 113, 13–21. [Google Scholar] [CrossRef]
- Plaza, J.; Artíñano, B.; Salvador, P.; Gómez-Moreno, F.J.; Pujadas, M.; Pio, C.A. Short-term secondary organic carbon estimations with a modified OC/EC promary ratio method at a suburban site in Madrid (Spain). Atmos. Environ. 2011, 45, 2496–2506. [Google Scholar] [CrossRef]
- Yang, F.; Huang, L.; Duan, F.; Zhang, W.; He, K.; Ma, Y.; Brook, J.R.; Tan, J.; Zhao, Q.; Cheng, Y. Carbonaceous species in PM2.5 at a pair of rural/urban sites in Beijing, 2005–2008. Atmos. Chem. Phys. 2011, 11, 7893–7903. [Google Scholar] [CrossRef]
- Cavalli, F.; Alastuey, A.; Areskoug, H.; Ceburnis, D.; Čech, J.; Genberg, J.; Harrison, R.M.; Jaffrezo, J.L.; Kiss, G.; Laj, P.; et al. A European aerosol phenomenology 4: Harmonized concentrations of carbonaceous aerosol at 10 regional background sites across Europe. Atmos. Environ. 2016, 144, 133–145. [Google Scholar] [CrossRef]
- Murillo, J.H.; Marin, J.F.R.; Roman, S.R.; Guerrero, V.H.B.; Arias, D.S.; Ramos, A.C.; Gonzalez, B.C.; Baumgardner, D.G. Temporal and spatial variations in organic and elemental carbon concentrations in PM10/PM2.5 in the metropolitan area of Costa Rica, Central America. Atmos. Pollut. Res. 2013, 4, 53–63. [Google Scholar] [CrossRef]
- Zhu, C.S.; Cao, J.J.; Tsai, C.J.; Shen, Z.X.; Han, Y.M.; Liu, S.X.; Zhao, Z.Z. Comparison and implications of PM2.5 carbon fractions in different environments. Sci. Total Environ. 2014, 466, 203–209. [Google Scholar] [CrossRef]
- Sillanpää, M.; Frey, A.; Hillamo, R.; Pennanen, A.S.; Salonen, R.O. Organic, elemental and inorganic carbon in particulate matter of six urban environments in Europe. Atmos. Chem. Phys. 2005, 5, 2869–2879. [Google Scholar] [CrossRef]
- Zhao, W.; Hopke, P.K. Source identification for fine aerosols in Mammoth Cave National Parl. Atmos. Res. 2006, 80, 309–322. [Google Scholar] [CrossRef]
- Ma, L.; Yu, Y.; Wang, B.; Zhao, S.; Li, G. Day-night variation and source apportionment of carbonaceous aerosols in PM10 during spring and summer of Lanzhou. Environ. Sci. 2017, 38, 1289–1297. [Google Scholar]
- Yan, C.; Zheng, M.; Shen, G.; Ma, S.; Sun, J.; Cui, M.; Zhang, F.; Han, Y.; Chen, Y. Characterization of carbon fractions in carbonaceous aerosols from typical fossil fuel combustion sources. Fuel 2019, 254, 115620. [Google Scholar] [CrossRef]
- Kim, K.H.; Sekiguchi, K.; Furuuchi, M.; Sakamoto, K. Seasonal variation of carbonaceous and ionic components in ultrafine and fine particles in an urban area of Japan. Atmos. Environ. 2011, 45, 1581–1590. [Google Scholar] [CrossRef]
- Kim, E.; Hopke, P.K. Source apportionment of fine particles in Washington, DC, utilizing temperature-resolved carbon fractions. J. Air Waste Manag. Assoc. 2004, 54, 773–785. [Google Scholar] [CrossRef]
- Watson, J.G.; Chow, J.C.; Lowenthal, D.H. Differences in the carbon composition of source profiles for diesel-and gasoline- powered vehicles. Atmos. Environ. 1994, 28, 2493–2505. [Google Scholar] [CrossRef]
- Cao, J.J.; Lee, S.C.; Ho, K.F.; Fung, K.; Chow, J.C.; Watson, J.G. Characterization of roadside fine particulate carbon and its eight fractions in Hong Kong. Aerosol Air Qual. Res. 2006, 6, 106–122. [Google Scholar] [CrossRef]
- Kassomenos, P.A.; Vardoulakis, S.; Chaloulakou, A.; Pschalidou, A.K.; Grivas, G.; Borge, R.; Lumbreras, J. Study of PM10 and PM2.5 levels in three European cities: Analysis of intra and inter urban variations. Atmos. Environ. 2014, 87, 153–163. [Google Scholar] [CrossRef]


| No | Station Name | Coordinates (Latitude, Longitude, Altitude (h)) | Type of Station | Measurement Period (n—Number of Samples) | Sampling Equipment | Measured PM Fraction |
|---|---|---|---|---|---|---|
| 1 | Krynica | 49°24′28′’ N 20°57′39′’ E h = 582 m a.s.l. | rural background | 02 January–29 December 2018 (n = 359) | low-volume sampler PNS-15 (Atmoservice) | PM10 |
| 2 | Rokitno | 50°26′9′’ N 19°25′29′’ E h = 344 m a.s.l. | rural background | 01 January–31 December 2019 (n = 358) | high-volume sampler DHA-80 (Digitel) | PM10 |
| 3 | Racibórz-S | 50°3′39′’ N 18°11′27′’ E h = 203 m a.s.l. | near-city background | 01 January–29 December 2019 (n = 171) | low-volume sampler PNS-15 (Atmoservice) | PM2.5 |
| 4 | Złoty Potok | 50°42′39′’ N 19°27′32′’ E h = 291 m a.s.l. | rural background | 01 January–31 March 2013 and 20 April–31 July 2019 (n = 171) | low-volume sampler PNS-15 (Atmoservice) | PM2.5 |
| 5 | Trzebinia | 50°9′4′’ N 19°28′39′’ E h = 340 m a.s.l. | urban background | 01 February–31 March 2013 and 01 May–31 July 2019 (n = 135) | low-volume sampler µPNS LVS15 (Umwelttechnik MCZ) | PM2.5 |
| 6 | Skawina | 49°58′36′’ N 19°48′49′’ E h = 210 m a.s.l. | urban background | 23 February 2019–11 January 2020 (n = 179) | low-volume sampler µPNS LVS16 (Umwelttechnik MCZ) | PM10 |
| 7 | Racibórz-C | 50°5′24′’ N 18°12′58′’ E h = 190 m a.s.l. | urban background | 01 January–31 December 2019 (n = 179) | low-volume sampler PNS-15 (Atmoservice) | PM2.5 |
| 8 | Zabrze | 50°18′53′’ N 18°46′17′’ E h = 254 m a.s.l. | urban background | 01 December 2017–31 March 2018 and 07 May–30 September 2019 (n = 207 (PM1); n = 257 (PM2.5); n = 227 (PM10)) | high-volume sampler DHA-80 (Digitel) * | PM1, PM2.5, PM10 |
| Phase/Gas Stream | Temperature (°C) | Time (s) | Carbon Fraction |
|---|---|---|---|
| He | 200 | 120 | OC1 |
| He | 300 | 150 | OC2 |
| He | 450 | 180 | OC3 |
| He | 650 | 180 | OC4 |
| He/O2 | 500 | 120 | EC1 |
| He/O2 | 550 | 120 | EC2 |
| He/O2 | 700 | 70 | EC3 |
| He/O2 | 850 | 80 | EC4 |
| Period | Measurement Site | OC | EC | TC | OC/EC | SOC | POC |
|---|---|---|---|---|---|---|---|
| All period | Krynica (PM10) | 6.51 ± 4.69 | 0.94 ± 0.74 | 7.45 ± 5.34 | 7.90 ± 3.68 | 2.54 ± 2.54 | 3.97 ± 2.99 |
| Rokitno (PM10) | 7.89 ± 5.96 | 1.28 ± 0.82 | 9.17 ± 6.71 | 6.30 ± 1.92 | 2.70 ± 3.37 | 5.19 ± 3.28 | |
| Racibórz-S (PM2.5) | 8.96 ± 9.84 | 1.25 ± 1.15 | 10.20 ± 10.88 | 7.50 ± 3.12 | 4.40 ± 6.96 | 4.56 ± 3.74 | |
| Złoty Potok (PM2.5) | 8.59 ± 6.97 | 1.48 ± 1.19 | 10.07 ± 8.12 | 5.88 ± 1.15 | 3.30 ± 3.06 | 5.29 ± 4.28 | |
| Heating season | Krynica (PM10) | 8.85 ± 5.70 | 1.39 ± 0.83 | 10.23 ± 6.41 | 6.38 ± 1.60 | 3.16 ± 3.31 | 5.69 ± 3.39 |
| Rokitno (PM10) | 10.95 ± 6.90 | 1.77 ± 0.83 | 12.71 ± 7.63 | 5.98 ± 1.80 | 3.86 ± 4.32 | 7.09 ± 3.37 | |
| Racibórz-S (PM2.5) | 13.16 ± 12.59 | 1.81 ± 1.34 | 14.98 ± 13.77 | 6.67 ± 2.43 | 7.41 ± 9.10 | 5.76 ± 4.29 | |
| Złoty Potok (PM2.5) | 12.69 ± 7.88 | 2.17 ± 1.35 | 14.86 ± 9.18 | 5.85 ± 1.06 | 4.90 ± 3.60 | 7.78 ± 4.85 | |
| Non-heating season | Krynica (PM10) | 4.24 ± 1.18 | 0.51 ± 0.20 | 4.75 ± 1.27 | 9.37 ± 4.46 | 1.94 ± 1.17 | 2.30 ± 0.88 |
| Rokitno (PM10) | 4.73 ± 1.88 | 0.78 ± 0.40 | 5.51 ± 2.22 | 6.63 ± 1.99 | 1.50 ± 1.01 | 3.24 ± 1.61 | |
| Racibórz-S (PM2.5) | 5.08 ± 3.11 | 0.72 ± 0.58 | 5.80 ± 3.66 | 8.26 ± 3.49 | 1.62 ± 1.04 | 3.46 ± 2.74 | |
| Złoty Potok (PM2.5) | 4.49 ± 1.23 | 0.79 ± 0.26 | 5.27 ± 1.42 | 5.92 ± 1.23 | 1.69 ± 0.82 | 2.80 ± 0.89 |
| Period | Measurement Site | OC | EC | TC | OC/EC | SOC | POC |
|---|---|---|---|---|---|---|---|
| All period | Skawina (PM10) | 12.09 ± 10.50 | 2.43 ± 1.51 | 14.52 ± 11.80 | 4.87 ± 1.66 | 5.60 ± 7.32 | 6.49 ± 4.08 |
| Zabrze (PM10) | 15.57 ± 17.76 | 2.62 ± 1.96 | 18.19 ± 19.46 | 5.50 ± 2.35 | 8.88 ± 14.00 | 6.69 ± 4.71 | |
| Trzebinia (PM2.5) | 8.60 ± 6.73 | 2.21 ± 2.90 | 10.81 ± 8.60 | 4.37 ± 1.35 | 7.12 ± 5.96 | 1.48 ± 1.93 | |
| Racibórz-C (PM2.5) | 10.62 ± 10.36 | 1.61 ± 1.20 | 12.23 ± 11.36 | 6.51 ± 3.06 | 5.94 ± 7.72 | 4.67 ± 3.57 | |
| Zabrze (PM2.5) | 13.19 ± 13.78 | 2.38 ± 1.89 | 15.57 ± 15.47 | 5.29 ± 2.06 | 7.59 ± 10.41 | 5.60 ± 4.07 | |
| Zabrze (PM1) | 4.60 ± 4.23 | 1.05 ± 0.93 | 5.64 ± 5.09 | 4.91 ± 1.74 | 1.73 ± 2.13 | 2.87 ± 2.51 | |
| Heating season | Skawina (PM10) | 18.14 ± 13.24 | 3.28 ± 1.52 | 21.43 ± 14.58 | 5.10 ± 1.94 | 9.26 ± 9.86 | 8.88 ± 4.15 |
| Zabrze (PM10) | 28.85 ± 21.03 | 4.31 ± 1.81 | 33.16 ± 22.47 | 6.27 ± 2.62 | 18.28 ± 17.75 | 10.57 ± 4.44 | |
| Trzebinia (PM2.5) | 15.39 ± 6.53 | 3.97 ± 4.15 | 19.35 ± 8.61 | 4.82 ± 1.35 | 12.74 ± 6.39 | 2.65 ± 2.77 | |
| Racibórz-C (PM2.5) | 15.84 ± 12.32 | 2.27 ± 1.30 | 18.11 ± 13.30 | 6.84 ± 3.75 | 9.15 ± 9.78 | 6.69 ± 3.86 | |
| Zabrze (PM2.5) | 23.63 ± 14.61 | 3.98 ± 1.64 | 27.61 ± 15.92 | 5.74 ± 2.28 | 14.75 ± 11.98 | 8.89 ± 3.66 | |
| Zabrze (PM1) | 8.62 ± 5.86 | 1.96 ± 1.14 | 10.59 ± 6.90 | 4.37 ± 1.08 | 3.29 ± 3.33 | 5.34 ± 3.09 | |
| Non-heating season | Skawina (PM10) | 7.46 ± 3.34 | 1.77 ± 1.13 | 9.23 ± 4.37 | 4.69 ± 1.39 | 2.79 ± 1.49 | 4.66 ± 2.93 |
| Zabrze (PM10) | 6.01 ± 2.64 | 1.41 ± 0.84 | 7.41 ± 3.40 | 4.94 ± 1.96 | 2.10 ± 1.20 | 3.90 ± 2.33 | |
| Trzebinia (PM2.5) | 4.48 ± 1.40 | 1.15 ± 0.38 | 5.63 ± 1.64 | 4.09 ± 1.28 | 3.71 ± 1.27 | 0.77 ± 0.25 | |
| Racibórz-C (PM2.5) | 5.33 ± 2.76 | 0.94 ± 0.55 | 6.27 ± 3.24 | 6.19 ± 2.14 | 2.70 ± 1.64 | 2.63 ± 1.52 | |
| Zabrze (PM2.5) | 4.47 ± 1.82 | 1.04 ± 0.60 | 5.50 ± 2.33 | 4.90 ± 1.79 | 1.62 ± 1.01 | 2.85 ± 1.63 | |
| Zabrze (PM1) | 2.88 ± 1.03 | 0.65 ± 0.40 | 3.53 ± 1.39 | 5.14 ± 1.91 | 1.06 ± 0.56 | 1.82 ± 1.11 |
| Specification | Krynica | Rokitno | |||||||||
|---|---|---|---|---|---|---|---|---|---|---|---|
| OC1 | OC2 | OC3 | OC4 | PC | OC1 | OC2 | OC3 | OC4 | PC | ||
| Heating | SOC | 0.72 | 0.73 | 0.65 | 0.58 | 0.79 | 0.82 | 0.83 | 0.71 | 0.40 | 0.85 |
| EC | 0.89 | 0.89 | 0.84 | 0.79 | 0.87 | 0.84 | 0.88 | 0.78 | 0.55 | 0.80 | |
| Non-heating | SOC | 0.60 | 0.83 | 0.73 | 0.53 | 0.40 | |||||
| EC | 0.68 | 0.70 | 0.51 | 0.66 | 0.64 | ||||||
| Specification | Racibórz-S | Złoty Potok | |||||||||
| OC1 | OC2 | OC3 | OC4 | PC | OC1 | OC2 | OC3 | OC4 | PC | ||
| Heating | SOC | 0.94 | 0.90 | 0.90 | 0.83 | 0.92 | 0.85 | 0.84 | 0.84 | 0.82 | 0.85 |
| EC | 0.91 | 0.95 | 0.92 | 0.75 | 0.92 | 0.88 | 0.93 | 0.90 | 0.66 | 0.82 | |
| Non-heating | SOC | 0.66 | 0.64 | 0.59 | 0.40 | 0.45 | 0.47 | 0.72 | 0.64 | 0.50 | |
| EC | 0.71 | 0.69 | 0.67 | 0.81 | 0.87 | 0.63 | 0.50 | 0.84 | 0.45 | ||
| Specification | Skawina | Zabrze (PM10) | |||||||||
| OC1 | OC2 | OC3 | OC4 | PC | OC1 | OC2 | OC3 | OC4 | PC | ||
| Heating | SOC | 0.91 | 0.95 | 0.91 | 0.56 | 0.96 | 0.95 | 0.93 | 0.94 | 0.64 | 0.95 |
| EC | 0.85 | 0.89 | 0.88 | 0.63 | 0.87 | 0.85 | 0.90 | 0.97 | 0.47 | 0.84 | |
| Non-heating | SOC | 0.49 | 0.52 | 0.53 | 0.42 | 0.44 | 0.48 | ||||
| EC | 0.59 | 0.79 | 0.59 | 0.72 | 0.57 | 0.69 | 0.77 | 0.62 | 0.51 | 0.64 | |
| Specification | Trzebinia | Racibórz-C | |||||||||
| OC1 | OC2 | OC3 | OC4 | PC | OC1 | OC2 | OC3 | OC4 | PC | ||
| Heating | SOC | 0.83 | 0.74 | 0.83 | 0.81 | 0.86 | 0.93 | 0.88 | 0.86 | 0.73 | 0.89 |
| EC | 0.51 | 0.90 | 0.75 | 0.76 | 0.75 | 0.87 | 0.81 | 0.49 | 0.78 | ||
| Non-heating | SOC | 0.85 | 0.81 | 0.60 | 0.74 | 0.79 | 0.81 | 0.63 | 0.65 | ||
| EC | 0.74 | 0.64 | 0.70 | 0.59 | 0.61 | 0.81 | |||||
| Specification | Zabrze (PM2.5) | Zabrze (PM1) | |||||||||
| OC1 | OC2 | OC3 | OC4 | PC | OC1 | OC2 | OC3 | OC4 | PC | ||
| Heating | SOC | 0.92 | 0.94 | 0.96 | 0.62 | 0.97 | 0.76 | 0.74 | 0.80 | 0.80 | 0.74 |
| EC | 0.83 | 0.89 | 0.87 | 0.47 | 0.82 | 0.88 | 0.93 | 0.87 | 0.78 | 0.80 | |
| Non-heating | SOC | 0.48 | 0.47 | 0.50 | 0.42 | 0.43 | |||||
| EC | 0.53 | 0.70 | 0.59 | 0.45 | 0.69 | 0.49 | 0.66 | 0.66 | 0.49 | 0.79 | |
| Specification | Krynica | Rokitno | |||||||
|---|---|---|---|---|---|---|---|---|---|
| EC1 | EC2 | EC3 | EC4 | EC1 | EC2 | EC3 | EC4 | ||
| Heating | OC | 0.94 | 0.98 | 0.95 | 0.51 | 0.93 | 0.94 | 0.93 | 0.72 |
| NO | 0.46 | 0.47 | |||||||
| Non-heating | OC | 0.68 | 0.74 | 0.78 | 0.42 | 0.85 | 0.85 | 0.86 | 0.45 |
| NO | |||||||||
| Specification | Racibórz-S | Złoty Potok | |||||||
| EC1 | EC2 | EC3 | EC4 | EC1 | EC2 | EC3 | EC4 | ||
| Heating | OC | 0.97 | 0.97 | 0.96 | 0.80 | 0.93 | 0.94 | 0.94 | |
| NO | 0.58 | 0.58 | 0.52 | 0.62 | |||||
| Non-heating | OC | 0.92 | 0.92 | 0.91 | 0.71 | 0.64 | 0.65 | 0.67 | 0.55 |
| NO | 0.52 | 0.61 | |||||||
| Specification | Skawina | Zabrze (PM10) | |||||||
| EC1 | EC2 | EC3 | EC4 | EC1 | EC2 | EC3 | EC4 | ||
| Heating | OC | 0.95 | 0.97 | 0.78 | 0.86 | 0.93 | 0.88 | 0.45 | |
| NO | 0.72 | 0.69 | 0.58 | 0.79 | 0.79 | 0.75 | 0.52 | ||
| Non-heating | OC | 0.66 | 0.80 | 0.88 | 0.67 | 0.46 | 0.66 | 0.87 | 0.49 |
| NO | 0.43 | 0.45 | 0.57 | 0.57 | |||||
| Specification | Trzebinia | Racibórz-C | |||||||
| EC1 | EC2 | EC3 | EC4 | EC1 | EC2 | EC3 | EC4 | ||
| Heating | OC | 0.86 | 0.88 | 0.83 | 0.47 | 0.95 | 0.92 | 0.89 | 0.51 |
| NO | 0.72 | 0.73 | 0.75 | 0.54 | 0.85 | 0.80 | 0.83 | 0.40 | |
| Non-heating | OC | 0.56 | 0.69 | 0.88 | 0.89 | 0.88 | |||
| NO | 0.42 | 0.43 | 0.46 | 0.47 | 0.41 | ||||
| Specification | Zabrze (PM2.5) | Zabrze (PM1) | |||||||
| EC1 | EC2 | EC3 | EC4 | EC1 | EC2 | EC3 | EC4 | ||
| Heating | OC | 0.95 | 0.96 | 0.91 | 0.88 | 0.93 | 0.94 | 0.54 | |
| NO | 0.78 | 0.77 | 0.69 | 0.40 | 0.63 | 0.65 | 0.68 | 0.55 | |
| Non-heating | OC | 0.53 | 0.70 | 0.83 | 0.57 | 0.69 | 0.82 | ||
| NO | 0.51 | 0.60 | 0.65 | 0.48 | 0.54 | 0.59 | |||
© 2020 by the authors. Licensee MDPI, Basel, Switzerland. This article is an open access article distributed under the terms and conditions of the Creative Commons Attribution (CC BY) license (http://creativecommons.org/licenses/by/4.0/).
Share and Cite
Błaszczak, B.; Mathews, B. Characteristics of Carbonaceous Matter in Aerosol from Selected Urban and Rural Areas of Southern Poland. Atmosphere 2020, 11, 687. https://doi.org/10.3390/atmos11070687
Błaszczak B, Mathews B. Characteristics of Carbonaceous Matter in Aerosol from Selected Urban and Rural Areas of Southern Poland. Atmosphere. 2020; 11(7):687. https://doi.org/10.3390/atmos11070687
Chicago/Turabian StyleBłaszczak, Barbara, and Barbara Mathews. 2020. "Characteristics of Carbonaceous Matter in Aerosol from Selected Urban and Rural Areas of Southern Poland" Atmosphere 11, no. 7: 687. https://doi.org/10.3390/atmos11070687
APA StyleBłaszczak, B., & Mathews, B. (2020). Characteristics of Carbonaceous Matter in Aerosol from Selected Urban and Rural Areas of Southern Poland. Atmosphere, 11(7), 687. https://doi.org/10.3390/atmos11070687