Article

Long-Term Variation of Black Carbon Aerosol in China Based on Revised Aethalometer Monitoring Data

1
State Key Laboratory of Severe Weather & Key Laboratory of Atmospheric Chemistry of CMA, Chinese Academy of Meteorological Sciences, 46 Zhong Guan Cun S. Ave., Beijing 100081, China
2
Beacon Science & Consulting, Doncaster East, VIC 3109, Australia
*
Author to whom correspondence should be addressed.
Atmosphere 2020, 11(7), 684; https://doi.org/10.3390/atmos11070684
Submission received: 3 June 2020 / Revised: 24 June 2020 / Accepted: 26 June 2020 / Published: 29 June 2020
(This article belongs to the Special Issue Interaction of Air Pollution with Snow and Seasonality Effects)

Abstract

:
Black carbon (BC) aerosol, as a typical optical absorption aerosol, is of great significance to the study of climate and radiation. The China Atmosphere Watch Network (CAWNET), established by the China Meteorological Administration (CMA), contains 35 BC-monitored stations, which have been collecting data using commercial Aethalometer instruments (AEs) since 2006. Element carbon (EC) data measured from the thermal/optical reflectance (TOR) method was used to correct the BC monitoring data from the AEs, which are affected by various sampling and analytical artifacts. The average difference before and after the revision was about 17.3% (±11.5%). Furthermore, we analyzed the variations of BC in China from 2006 to 2017 using a revised dataset. The ten-year averaged concentration of BC would have been applicable for climate analysis, and can be a comparison sample in future research. The concentrations of BC across the stations in China showed a general downward trend, with occasional fluctuations, and the concentrations at urban sites decreased more significantly. The average concentrations of BC in urban sites are higher than rural and remote sites. The 10-year averaged concentration of BC ranges from 11.13 μg m−3 in Gucheng to 0.19 μg m−3 in Shangri-La, showing a strong spatial variation; the proportion of BC aerosol in PM2.5 is generally less than 20%. The BC showed obvious seasonal and diurnal variation; and the highest concentration occurred in winter, with more dramatic diurnal variation, followed by autumn and spring. There was a significant increase in concentration between local time 7:00–9:00 and 18:00–0:00. The distribution and trend of BC concentration in China showed a consistency with emissions of BC.

1. Introduction

Carbonaceous aerosols in the atmosphere are mainly divided into organic carbon aerosols and inorganic carbon aerosols (black carbon and carbonate etc.). Among them, black carbon (BC), is a typical primary aerosol in the atmosphere. Its particle diameter is small, and its chemical properties are relatively stable, with an atmospheric lifetime of 4–12 days [1]. It is mainly produced by the insufficient combustion of fossil fuels, biomass and other materials, and is the primary aerosol tracer of high-temperature combustion emissions [2]. Black carbon aerosols have an absorption effect on solar radiation, which can lead to positive radiation forcing and cause a strong greenhouse effect [3]. BC particles deposited on snow have been calculated to have significant effects on radiative forcing and global climate, while it is twice as effective as CO2 in altering global surface air temperature [4,5,6]. Black carbon aerosols are suspending in the atmosphere, which further affects the process of air pollution through its radiation effect [7,8], and its promotion to some certain chemical processes [9].
Black carbon aerosols have attracted more and more scholars’ attention, due to its characteristics, and it is of great significance to formulate policies to reduce BC emissions to mitigate global warming [10,11,12]. The acquisition of accurate and long-term BC concentration data with high spatial and temporal resolution is particularly important for its research. However, there is generally a lack of long-term continuous observation of BC concentration. Some studies are dominated by short discontinuous BC observations [13,14], or obtain BC concentration distribution through satellite data inversion [15,16]. At present, the observation methods of BC concentration are mainly the optical absorption method and the thermal oxidation method. The optical absorption method is widely used, such as with a Scanning Mobility Particle Sizer (SMPS), a Single Particle Soot Photometer (SP2), a Particle Soot Absorption Photometer (PSAP), and a Multi-angle Absorption Photometer (MAAP), an Aethalometer and some other common instruments [17,18,19,20]. An Aethalometer is widely used as the primary instrument for long-term observation of atmospheric BC concentration, due to its strong absorbency in the visible and near-infrared bands, lack of substantive response to OC, high sensitivity, high temporal resolution, and moderate price [21].
The network of BC concentrations monitoring stations in various countries is continuously developing and improving. Currently, the China Atmosphere Watch Network (CAWNET) is taking shape, which covers most areas of China. A total of 35 monitoring stations have more than 10 years of continuous observation data, with Aethalometer (AE-31) as the primary instrument. It also has a strong value of analysis and application for the research into BC. However, it is important to note that the Aethalometer observations have certain errors, which mainly come from three aspects: firstly, the optical absorptive aerosol in the atmosphere is not only black carbon, but also the influence of aerosols such as dust, leading to an overestimation of BC concentration [22]; secondly, the loading effect or the shadow effect of the aerosol on the filter is another cause, as a result of optical absorption saturation at a certain point, the concentration of BC was underestimated [23]; thirdly, the overestimation of black carbon concentration, due to the existence of optical scattering matter in aerosols [24].
In view of the above factors, the attenuation detected by Aethalometer does not accurately reflect BC concentration in the atmosphere. Studies have shown that, under the influence of the loading effect, the detection signal of pure soot particles increased by 1.6 times, which can be neglected for the aged BC aerosol [23]. In actual indoor observations (in the city, at an indoor office next to the road), the loading effect causes a concentration deviation of about 10% at 880nm [25]. In the case of multiple scattering, the absorption cross section of 532 nm is about three times that of the theoretical result [24]. In addition, the detection of BC will be greatly affected in cities with severe dust pollution. Therefore, the accurate acquisition of BC concentration is closely related to the optical and component characteristics of local aerosols. In this case, it is particularly important to obtain the corresponding correction factors for different regional characteristics.
For this reason, many scholars have proposed empirical formulas and revised factor algorithms to revise the observation data of Aethalometer, taking into account the loading effect and the scattering effect [23,24,26,27]. For example, Arnott et al. [24] proposed to conduct a real-time observation of aerosol scattering characteristics during observation, in order to correct the data of the Aethalometer. Weingartner et al. [23] proposed an empirical correction RW for the filter-loading, and determined the calibration constant Cref for different aerosol types to correct for the multiple scattering in the filter matrix. Schmid et al. [27] made improvements on the basis of the two method, and proposed new algorithms, which adds a term Cscat to Cref, and both the multiple scattering and the scattering corrections were taken in to account. Based on these previously published methods, Coen et al. [28] developed a new correction scheme, which accounts for the optical properties of the aerosol particles embedded in the filter. For other absorbing aerosols, such as dust, Zhang et al. [22] obtained a reasonable absorption cross section by comparing with the thermal/optical reflectance (TOR) method to correct the data obtained by the Aethalometer at 880nm, and obtained the BC concentration of different sites in China. Cao et al. [29] also used element carbon (EC) data to revise the light absorption cross section of BC to study the seasonal variations of BC in the Xi’an area.
Zhang et al. [30] analyzed the spatial and temporal variation characteristics of BC concentration in China with the 12 years of observation data from 2006 to 2017. However, it is worth mentioning that the BC concentration data is not corrected in that paper, and the BC absorption cross section used manufacturer’s default value. As mentioned above, the unrevised data may exist errors, due to the scattering effect, loading effect and other factors, and the research of Park et al. [25] showed that the error of BC concentration measured by Aethalometer may reach 10–23% in indoor office and urban sites. In other areas, this error value may be even larger. In an area as vast as China, aerosol composition and optical characteristics vary significantly, it is very important to obtain appropriate correction factors to correct BC concentration data for promoting BC research.
In addition to BC observation, aerosol samples were collected in several sites of CAWNET, and EC concentration data were obtained through the TOR method, which can be good reference data for BC data correction [22]. In this paper, we correct BC concentration data of 35 CAWNET sites in China from 2006 to 2017. Then, their temporal and spatial changes are analyzed. Additionally, the ratios of BC to PM2.5 and their variation are presented.

2. Data and Methods

The 35 BC monitoring sites of CAWNET are divided into urban sites, rural sites, and remote sites (Figure 1). The commercial Aethalometer (AE-31) instruments were used for continuous observation of BC concentration data at the above sites. According to their location, they were classified as urban sites, rural sites, and remote sites. Most of them were located in east China, in order to obtain the BC samples from unnatural emissions. Meanwhile, several remote sites were set up, to monitor natural emissions and the long-range transport of BC aerosol, which were far away from the areas with strong emissions and human activities. The monitoring points of urban sites are usually 50–100 m higher than the underlying surface of the city to obtain the representative samples in this area. The rural stations were located in representative areas with the sampling point distant from local sources and usually 100 km away from the city or a typical emission source. These sites basically cover most of China, and can reflect the distribution of BC concentration.
The Aethalometer uses the ‘Standard Wavelength Set’ optical source (370 nm, 470 nm, 520 nm, 590 nm, 660 nm, 880 nm, 950 nm). They are used to detect the information of aerosols, such as size and chemical composition. The detection data of 880 nm is considered to represent BC concentration. This paper mainly analyzes the observed data of 880 nm channel. The Aethalometer calculates the concentration of BC by detecting the attenuation of incident light through a filter membrane that collects aerosols. The principle is as follows:
ATN = 100 × ln ( I 0 / I ) ,
ATN ( λ ) = σ ( 1 λ ) × [ B C ] ,
where ATN represents the attenuation of light, I0 represents the light intensity when passing through the clean filter membrane, and I represents the light intensity of the filter membrane after collecting aerosols. The σ represents the absorption cross section (relative to wavelength), and [BC] represents the BC concentration. The above formulas can be used to calculate the BC concentration. The EC absorption cross section of the 880 nm channel provided by the manufacturer is 12.6 m2/g, which is obviously not applicable to the whole area of China. The absorption cross sections of different sites in the China need to be determined, in order to more accurately reflect the BC aerosol concentration.
Aerosol samples were collected at some sites and the EC content was measured by TOR method, which is an optical and thermal method to measure OC and EC according to the Interagency Monitoring of Protected Visual Environment (IMPROVE) protocol. In the pure He gas atmosphere without oxygen, the sample filter membrane was heated at 120 °C (OC1), 250 °C (OC2), 450 °C (OC3), and 550 °C (OC4), respectively, to convert the carbon in the sample into CO2. Under the environment of He gas containing 2% oxygen, filter membrane was heated at 550 °C (EC1), 700 °C (EC2) and 800 °C (EC3), respectively, to convert EC into CO2. The CO2 produced at the above temperatures is converted into CH4, which can be detected by instruments through the catalytic reduction process. During the measurement process, He-Ne laser detection filter paper of 633 nm was used and monitored the reflected light of the filter paper, the change of light intensity was used to clearly indicate the starting point of EC oxidation process, so as to ensure the scientific distinction between OC and EC.
The EC concentration of some sites is obtained according to the TOR method (Figure 1). The EC data of these sites are fitted with the absorption coefficient obtained by the Aethalometer, and obtain the EC absorption cross section from the slope of fitting, this method has been used in many researches to obtain the absorption cross section [29,32,33]. Then, the Aethalometer monitoring data is revised by the absorption cross section (Figure 2). However, in sites without the TOR method to measure EC concentration, the absorption cross section of each site was determined by the principle of partition proximity (Table 1). In areas without sampling observation and where the principle of partition proximity could not be adopted, the average value (14.4 m2/g) of the absorption cross section in China was approximately assigned to these sites [22]. The scheme of region division came from the study of Zhang et al. [31], which divided the region according to the similarity of aerosol components and the optical characteristics of these sites.
It shows that the light absorption of the Aethalometer has a good correlation with the EC concentration measured by the TOR method. The slope represents the BC absorption cross section of these stations. The average value of absorption cross section obtained by these sites is 14.4 m2/g. It is larger than that given in the instruction manual, indicating that there are other substances causing optical absorption in the atmosphere, and the loading effect will also cause certain errors. Therefore, a reasonable absorption cross section σ* is a very important parameter for BC observations in different regions.
The table shows the basic geographic information of each site, its type, absorption cross section, ten-year averaged BC concentration, and the averaged BC concentration of 2016 and 2017. The vacant value in Table 1 is because there were many missing measurements in the monitoring data of that year.
The data of each site is revised according to the absorption cross section, which is given in the table above. The BC absorption cross section of each site was obtained by above method, and the BC concentration was recalculated by formula (2).
In addition to the BC monitoring data, PM2.5 was also monitored at 24 CAWNET sites from 2006, using GRIMM EDM 180 environmental dust monitor instruments, with 31 different size channels [34]. Based on the revised data, the spatial and temporal variation characteristics of BC concentration and its proportion in PM2.5 were analyzed.
BC emission inventory data generated from the Multi-resolution Emission Inventory for China (MEIC) [35], which is a bottom-up model of China’s emission inventory of air pollutants and greenhouse gases covering more than 700 anthropogenic emissions sources, developed and maintained by Tsinghua university. Currently, the MEIC model includes emission data of 10 air pollutants and greenhouse gases in mainland China. The MEIC model website provides an online calculation and download of grid emission inventory [36].
In addition, abbreviations that appeared in the introduction and method can be found in Appendix A.

3. Results

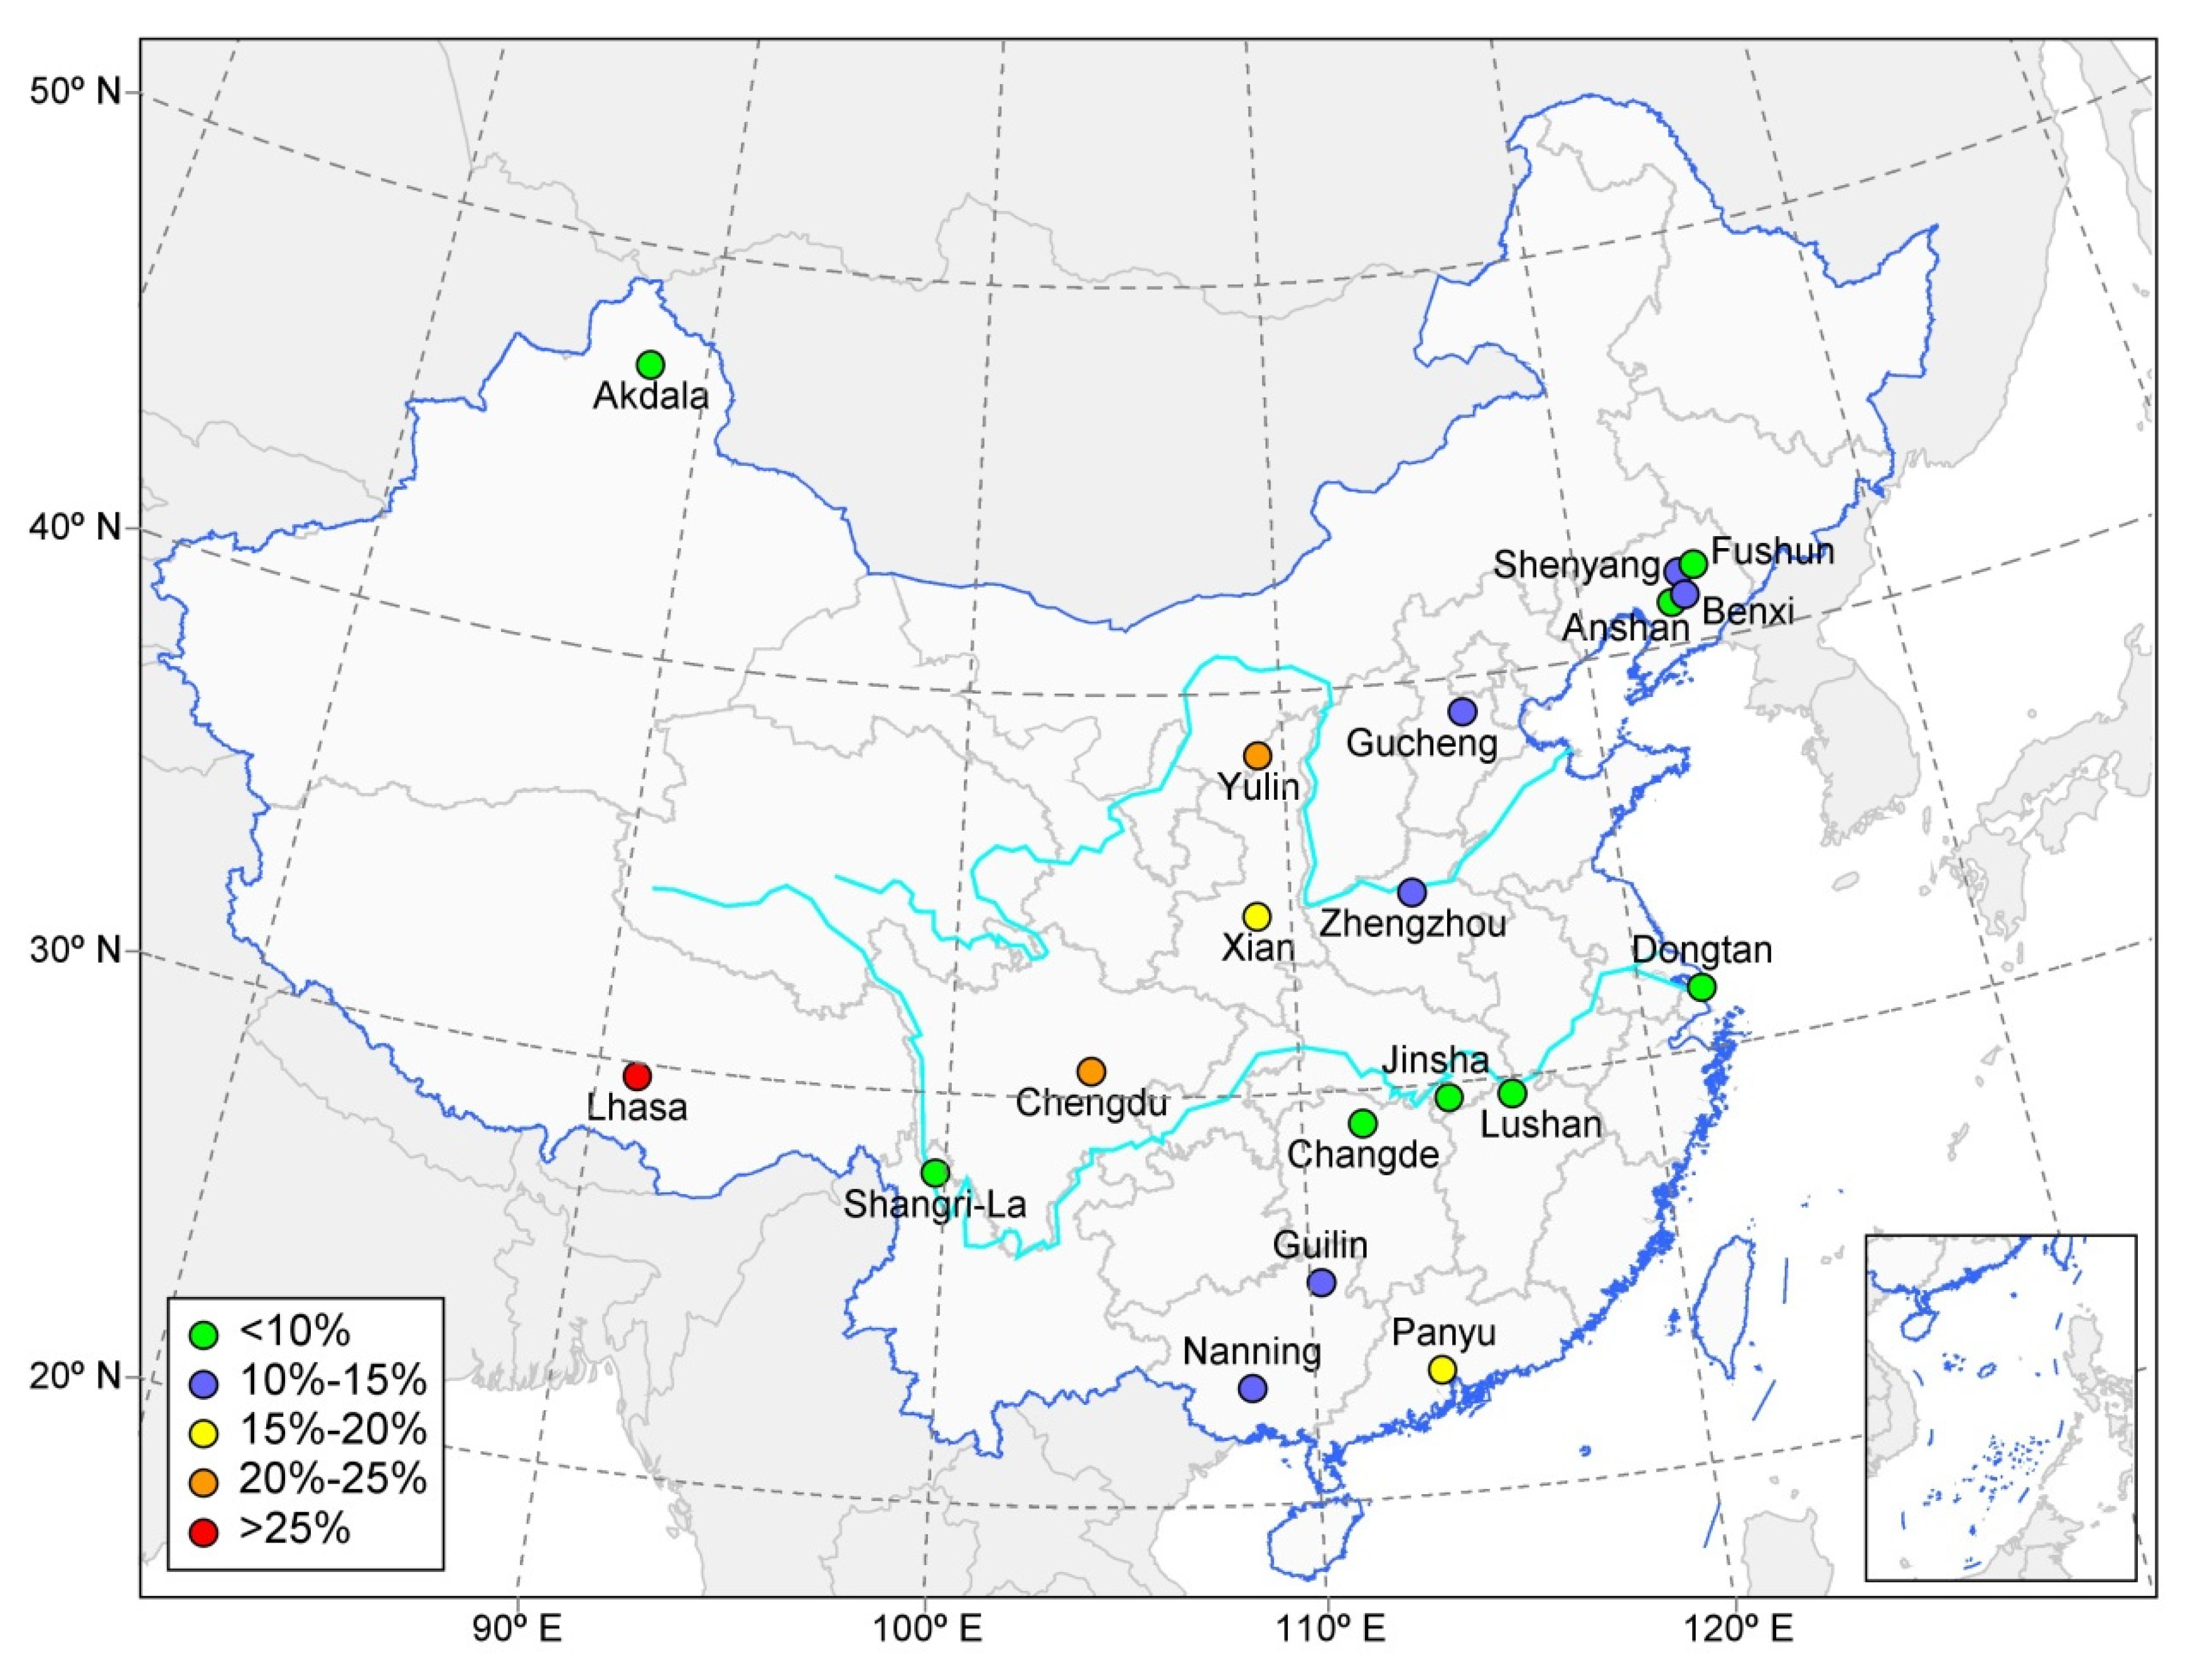
3.1. Average BC Concentration and its Proportion in PM2.5

The average BC concentration distribution for 10 years is shown in Figure 3. The 10-year averaged concentration of BC is also provided in Table 1. The high concentration of BC is mainly distributed in the North China Plain, Central China Plain, Sichuan Basin. In the urban sites, Chengdu, Xi’an and other densely populated cities have relatively high concentrations, which usually above 8 μg m−3, while the concentration of Nanning, Lhasa and other cities is relatively between 2 to 4 μg m−3. This is related to the population and the level of economic development between cities; a smaller population usually means lower BC emissions. Among the 35 sites, the site with the highest BC average concentration was Gucheng, which reached 11.13 μg m−3, and the minimum value is 0.19 μg m−3 in Shangri-La. Moreover, the average concentration of Yulin and Huimin was also relatively high among the rural stations, which is between 4–8 μg m−3, indicating that the emissions caused by incomplete combustion of straw and wood accounted for a relatively high proportion of BC emissions. Taken as a whole, the 10-year average BC concentration of urban sites is relatively higher than that of rural sites, due to the huge emissions from human activities such as vehicle transportation. The average BC concentration of four remote sites is below 0.5 μg m−3, except for Longfengshan, so they could be approximately representative of the atmospheric background concentration for rare human activities. The ten-year average BC concentration has already acquired the application value of climate analysis, and it can provide a comparison for the future analysis of the climatic effects of black carbon aerosols.
In addition to BC concentration observation, some sites also obtained PM2.5 concentration. The 10-year proportion was calculated at sites with both BC and PM2.5 monitoring data. The proportion of BC aerosol in PM2.5 is generally low, mostly below 20%, even though sites such as Gucheng and Zhengzhou have relatively high BC concentrations. This represents the proportion of local BC emissions in total particulate matter emissions, to some extent. The proportion of Chengdu, Lhasa and Yulin exceeds 20%, among which Lhasa is the highest, reaching 28% (Figure 4). This indicates that the BC emission in the above-mentioned cities accounts for a large proportion, which is closely related to the characteristics of local human activities. Studies have shown that candles combustion emit a significant amount of BC particles [37]. Therefore, we suspect that the high proportion in Lhasa is due to the huge emissions caused by religious combustion activities. The proportion of BC in the Yangtze River basin and the southern region is relatively low, with the exception of Panyu, below 15%. This is because the BC emissions from local combustion are relatively low, and the humid and redundant environment is prone to the wet deposition of BC. In remote sites, the proportion of BC in PM2.5 is usually around 5%, which can represent the atmospheric background characteristics.

3.2. Seasonal Variation of BC Aerosol

Except for several sites, such as Lhasa, Hami, and Dunhuang, the average BC concentration showed a consistent trend, that is, the highest concentration occurred in winter, followed by autumn and spring, and the lowest concentration was in summer (Figure 5). The difference between BC concentration in spring and autumn was not obvious in most sites, but in Xi’an, Zhengzhou, Gucheng, and other sites, the BC concentration in autumn was significantly higher than that in spring, but did not exceed that in winter. In Southern China sites, such as Panyu and Guilin, the BC concentration in spring is similar to winter. The seasonal distribution characteristics may be due to the heating measures in winter in the north of China, resulting in the increase of BC emissions. The weather system in winter is relatively stable; the boundary layer height is usually low, which is not conducive to the diffusion and deposition of BC aerosol. However, the summer emissions are relatively lower, and the summer precipitation is more conducive to the removal of BC aerosol from the atmosphere.
In addition, in some northern sites, such as Dunhuang, Benxi, Fushun, Gucheng, and Yulin, the diurnal variation of BC concentration is more drastic in autumn and winter. However, such characteristics are not obvious in southern stations, the daily fluctuations between the seasons are similar, which may be related to the more obvious temperature difference between day and night; meanwhile, the more regular human activities in northern areas in autumn and winter may cause the regular change of BC emissions. At remote sites, the BC aerosol showed only moderate diurnal fluctuations, due to the rare human activities.

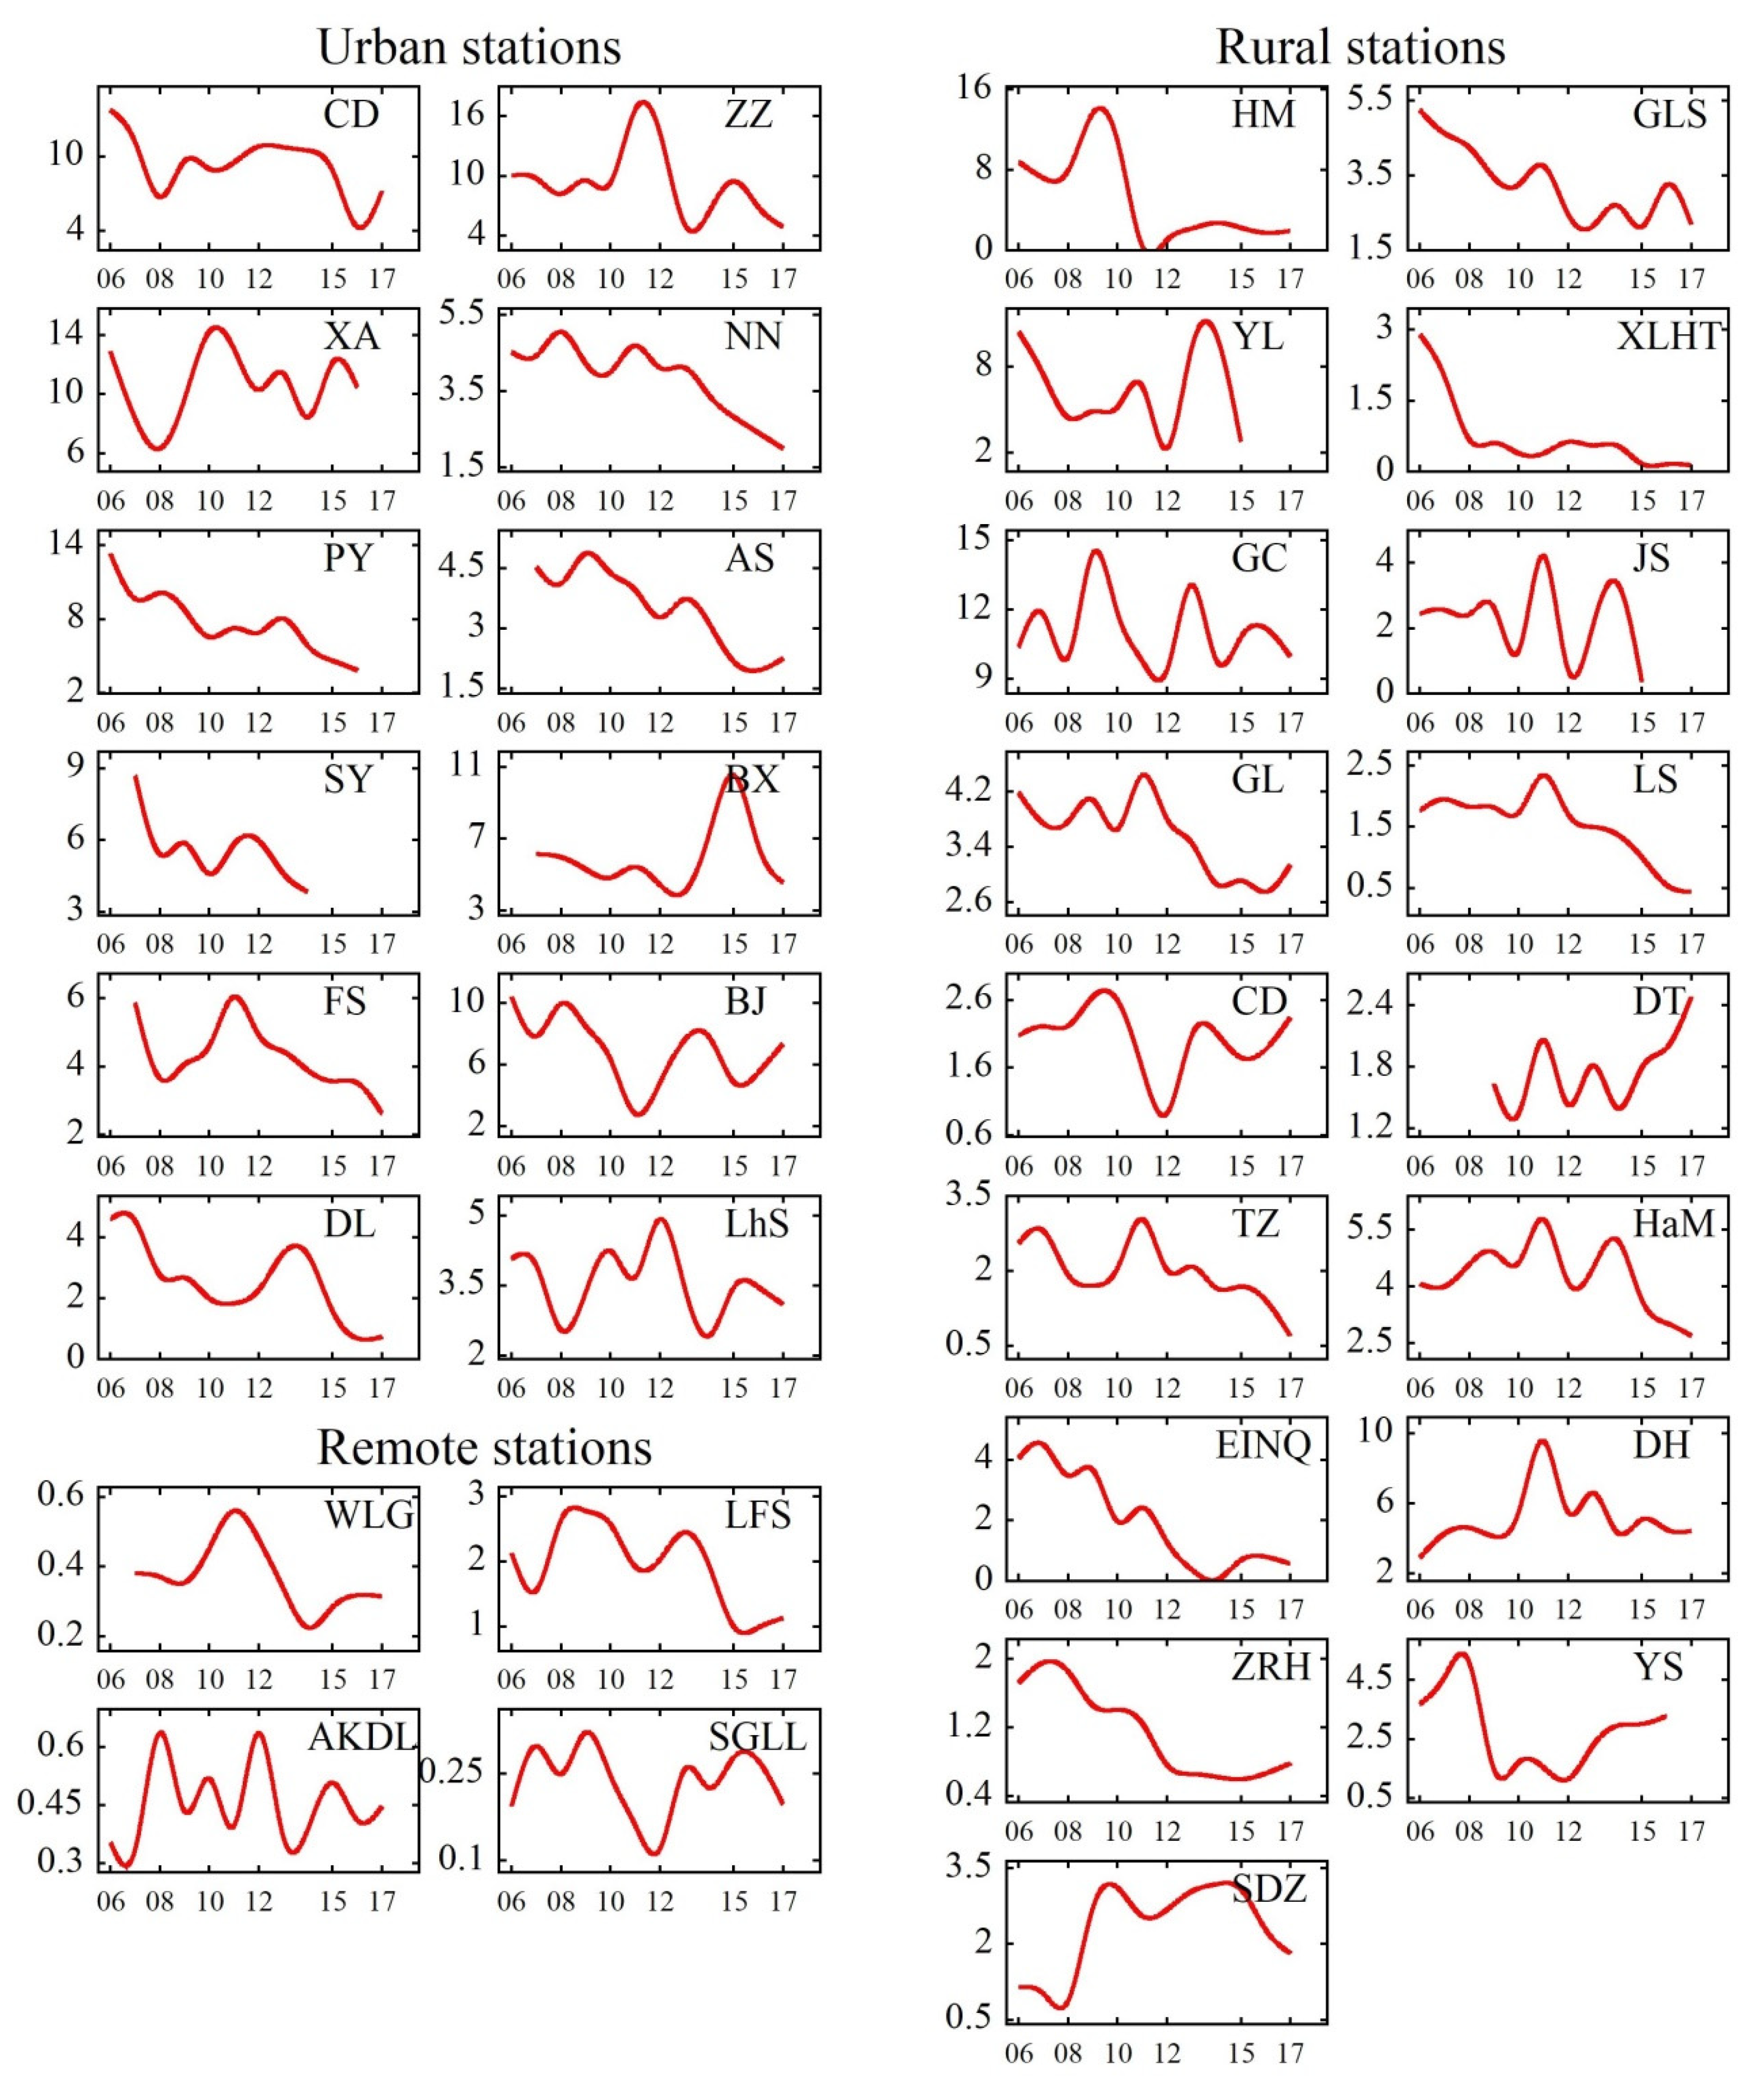
3.3. Interannual Variation of BC Concentration

On the whole, the BC concentration of all sites showed a decreasing trend (Figure 6). BC concentration were monitored at all the above sites from 2006 to 2017. However, due to the lack of data caused by instrument maintenance and other reasons, the data of some sites in some years cannot represent the overall level of this year. In order to accurately reflect the annual change of BC concentration, these values were not shown in Figure 6 or Table 1. In urban sites, except for Benxi, which showed an abnormal increase around 2015, most of the urban sites showed an obvious decreasing trend, although there may be fluctuations. This may be due to sudden changes in emission sources and fluctuations in meteorological conditions. In the remote sites, the concentration of BC aerosol was low, with no obvious trend of increasing or decreasing, and fluctuated slightly. However, the BC concentration of Longfengshan was significantly higher than that of the other three stations from 2006 to 2015, and showed a rapid decline after 2015. For the rural sites, most of the sites also show a decreasing trend. The BC concentration in North China Plain and Guanzhong Plain represented by Beijing and Xi’an was relatively high and fluctuated greatly. In Northeast China, except Benxi, the overall BC concentration was lower than that of the North China Plain, and showing a trend of steady decreasing. In the middle and lower reaches of the Yangtze River, the BC concentration was even lower. In south China, the concentration in Panyu decreased significantly year by year, from 2006 to 2015, it decreased by nearly 8 μg m−3, while in Nanning and Guilin, the concentration decreased slightly by years. Combined with Table 1, it shows that the average annual concentration in 2016 and 2017 was lower than the 10-year average from 2006 to 2015 at most sites, except for several sites such as Yushe, which also indicated that the BC emissions in China were decreasing, especially in urban areas.
In addition, at some sites, such as Gucheng, Changde, Dongtan, and Shangdianzi, the average concentration fluctuated, but there is no obvious trend of decreasing, or even an increasing trend. Almost all such sites are rural sites. In the case of overall decline of BC emission sources, this increasing trend may be caused by annual changes in meteorological conditions. In addition, the control of BC emission sources was likely to focus on industry and transportation, and other emission sources cannot be excluded from the sudden rise near these sites.
From the perspective of the BC emission, BC emissions are relatively high in the North China Plain, the Yangtze River Delta, the Central China, and the Sichuan basin, which is consistent with the distribution of the 10-year average concentration of BC (Figure 7). At the same time, it should also be pointed out that China’s BC emissions were decreasing. In recent years, China has implemented emission reduction measures, such as reducing traffic and straw combustion emissions, resulting in a general trend of decreasing BC concentration in the atmosphere. Figure 7e shows that BC emissions decreased in most areas of China, comparing 2016 to 2008, but increased slightly in some areas, such as the Northeast China. Except for the regions with high emissions mentioned above, the emission reduction in the Pearl River Delta is also significant, which can also be seen from the BC concentration variation in Panyu. The change of BC concentration is closely related to BC emissions, and it is of great importance to obtain an accurate BC emission inventory for the research of BC.

3.4. Diurnal Variation of BC Concentration

The BC concentration has a relatively obvious diurnal variation (Figure 8), which is more obvious in urban sites. There are significant concentration increases between local time 7:00–9:00 and 18:00–0:00. In Beijing, Chengdu, Zhengzhou, the BC concentration at local time 21:00–8:00 maintained a relatively high level. In the four remote sites, the overall BC concentration was low, but there was also an obvious bimodal diurnal variation. In most rural sites, a similar pattern is followed. In addition to Gaolanshan, Dongtan, Lushan and several sites of variation characteristics are relatively different, where a significant increase in BC occurred between local time 8:00–12:00. It is speculated that it is related to the geographical location of the site. Dongtan is a coastal station, while Gaolanshan and Lushan are mountain sites, the variation characteristics of BC concentration may be quite different. The variations of concentration in Tazhong and Shangdianzi are more similar to the cities such as Beijing. The diurnal cycles of the BC concentrations were found to be considerably affected by the air exchange rate, occupants’ behavior patterns and nearby traffic emissions [25]. Regular human activities in urban areas will result in significant emission increases, such as morning and evening traffic peaks. Meanwhile, the change of boundary layer height will also affect diurnal BC concentration variation in the atmosphere.

3.5. Data Differences Before and after Revision

After the data revision, the changes in the mean value of the data before and after the revision were analyzed (positive values in the Figure 9 indicate that the revised data is larger than the original data). As shown in the figure, the revised data of most urban sites and remote sites are smaller than the original data except Beijing, Panyu, Akdala and several sites, while the revised data of most rural sites are larger than the original data. In addition, the data deviation before and after the revision was large, and only nine of the 35 sites had a mean difference of less than 0.1. The highest difference was 0.44 in Gaolanshan. This indicated that it was necessary to revise the original Aethalometer data, otherwise it could not represent the true local BC concentration.

4. Conclusions

The EC concentration measured by TOR method was fitted with the optical absorption measured by the Aethalometer to obtain the absorption cross section applicable to these sites. The existing Aethalometer observation data were revised and the analysis conclusion is as follows:
1. The BC concentration in the North China Plain, Central China Plain and Sichuan Basin is relatively high. Chengdu, Xi’an and other densely populated cities have higher concentrations, usually above 8 μg m−3. The average concentration in Gucheng is the highest, reaching 11.13 μg m−3, while in Yulin, Huimin and other rural sites, the average concentration also reaches 6 μg m−3. The lowest concentration appears in Shangri-La, only 0.19 μg m−3. The proportion of BC aerosol in PM2.5 at these sites is generally low. The average BC concentration of four remote sites is below 0.5 μg m−3 except Longfengshan. The ten-year average BC concentration has already acquired the application value of climate analysis, and it can provide a comparison for the future analysis of the climatic effects of BC. The proportion of BC aerosol in PM2.5 is generally low, mostly below 0.2, even though sites such as Gucheng and Zhengzhou have relatively high BC concentrations. In remote sites, the proportion of BC in PM2.5 is usually around 0.05, which can represent the atmospheric background characteristics.
2. The seasonal average BC concentration in most sites showed a consistent trend, that is, the highest concentration occurred in winter, followed by autumn and spring, and the lowest concentration was in summer. In some northern sites, the diurnal variation of BC concentration is more drastic in autumn and winter. Such characteristics are not obvious in southern stations.
3. The overall BC concentration in China showed a decreasing trend. The majority of urban sites show a significant decreasing trend. In the remote sites, the overall concentration of BC was low, with no obvious trend of increase or decrease, and slightly fluctuated. In the rural sites, most of the sites also show a decreasing trend, but in Gucheng, Jinsha, Dongtan and Shangdianzi several sites show a sharp fluctuation, the fluctuation is more obvious than the urban areas. Moreover, the variations of BC concentration and emissions showed a good consistency, and it proved the effectiveness of China’s emission reduction measures.
4. The BC concentration has a relatively obvious diurnal variation, which is more obvious in urban sites. There was a significant increase in the concentration between 7:00–9:00 and 18:00–0:00. Regular human activities and the change of boundary layer height will result in significant emission increases, and then affect the diurnal variation of BC concentration.
5. The revised data are quite different from the original data, the average difference before and after the revision was about 17.3%. The rate of error at different sites is quite different, so it is necessary to revise the Aethalometer observation data.
In conclusion, the spatial distribution of BC aerosol in China is very different, and the change with time is obvious. The variation characteristics are also different in different regions. Moreover, the Aethalometer observation data has some errors, which need to be revised for each observation area, in order to study the long-term variation characteristics of BC aerosol. Meanwhile, 10 years of continuous monitoring data has a strong application value, which can make a good comparison for subsequent climate analysis and radiation research. In addition, in the Western China regions with fewer observations, CAWNET provides some valuable data for comparative analysis of the effects of BC radiation on snow cover in the northwest.

Author Contributions

Data curation, Y.W. and X.Z.; formal analysis, B.G.; visualization, B.G. and Y.W.; funding acquisition, Y.W.; investigation, B.G., Y.W. and Z.Y.; methodology, Y.W. and X.Z.; software, Y.W.; writing—original draft, B.G.; writing—review and editing, Y.W., H.C. and J.M. All authors have read and agreed to the published version of the manuscript.

Funding

This research was supported by grants from the National Key Research and Development Program (2016YFC0203306, 2019YFC0214601), the Atmospheric Pollution Control of the Prime Minister Fund (DQGG0104), and CAMS projects (2020Z011, 2020KJ013).

Acknowledgments

All figures in this study were produced by the open source software of MeteoInfo (http://www.meteothink.org).

Conflicts of Interest

The authors declare no conflict of interest.

Appendix A

Table A1. Comparison table of abbreviations in the article.
No.Abbreviation 1Full Name
1AE-31Aethalometer-31
2AesAethalometer instruments
3ATNThe attenuation of light
4BCBlack carbon
5CAWNETChina Atmosphere Watch Network
6CMAChina Meteorological Administration
7ECElement carbon
8MAAPMulti-angle Absorption Photometer
9MEICMulti-resolution Emission Inventory for China
10OCOrganic carbon
11PSAPParticle Soot Absorption Photometer
12SMPSScanning Mobility Particle Sizer
13SP2Single Particle Soot Photometer
14TORThe thermal/optical reflectance method
1 abbreviations of city names listed in Table 1.

References

  1. Cape, J.N.; Coyle, M.; Dumitrean, P. The atmospheric lifetime of black carbon. Atmos. Environ. 2012, 59, 256–263. [Google Scholar] [CrossRef] [Green Version]
  2. Drinovec, L.; Gregoric, A.; Zotter, P.; Wolf, R.; Anne Bruns, E.; Bruns, E.A.; Prevot, A.S.H.; Favez, O.; Sciare, J.; Arnold, I.J.; et al. The filter-loading effect by ambient aerosols in filter absorption photometers depends on the coating of the sampled particles. Atmos. Meas. Tech. 2017, 10, 1043–1059. [Google Scholar] [CrossRef] [Green Version]
  3. Jacobson, J.Z. Strong radiative heating due to the mixing of black carbon in atmospheric aerosols. Nature 2001, 409, 695–697. [Google Scholar] [CrossRef] [PubMed]
  4. Hansen, J.; Nazarenko, L. Soot climate forcing via snow and ice albedos. Proc. Natl. Acad. Sci. USA 2004, 101, 423–428. [Google Scholar] [CrossRef] [Green Version]
  5. Huang, L.; Gong, S.L.; Sharma, S.; Lavoué, D.; Jia, C.Q. A trajectory analysis of atmospheric transport of black carbon aerosols to Canadian high Arctic in winter and spring (1990–2005). Atmos. Chem. Phys. 2010, 10, 5065–5073. [Google Scholar] [CrossRef] [Green Version]
  6. Flanner, M.G.; Zender, C.S.; Randerson, J.T.; Rasch, P.J. Present-day climate forcing and response from black carbon in snow. J. Geophys. Res. Atmos. 2007, 112, 1–17. [Google Scholar] [CrossRef] [Green Version]
  7. Peng, J.; Hu, M.; Guo, S.; Du, Z.; Zheng, J.; Shang, D.; Zamora, M.L.; Zeng, L.; Shao, M.; Wu, Y.S.; et al. Markedly enhanced absorption and direct radiative forcing of black carbon under polluted urban environments. Proc. Natl. Acad. Sci. USA 2016, 113, 4266–4271. [Google Scholar] [CrossRef] [Green Version]
  8. Rana, A.; Jia, S.; Sarkar, S. Black carbon aerosol in India: A comprehensive review of current status and future prospects. Atmos. Res. 2019, 218, 207–230. [Google Scholar] [CrossRef]
  9. Monge, M.E.; D’Anna, B.; Mazri, L.; Giroir-Fendler, A.; Ammann, M.; Donaldson, D.J.; George, C. Light changes the atmospheric reactivity of soot. Proc. Natl. Acad. Sci. USA 2010, 107, 6605–6609. [Google Scholar] [CrossRef] [Green Version]
  10. Fu, T.M.; Cao, J.J.; Zhang, X.Y.; Lee, S.C.; Zhang, Q.; Han, Y.M.; Qu, W.J.; Han, Z.; Zhang, R.; Wang, Y.X.; et al. Carbonaceous aerosols in China: Top-down constraints on primary sources and estimation of secondary contribution. Atmos. Chem. Phys. 2012, 12, 2725–2746. [Google Scholar] [CrossRef] [Green Version]
  11. Vaishya, A.; Singh, P.; Rastogi, S.; Babu, S.S. Aerosol black carbon quantification in the central Indo-Gangetic Plain: Seasonal heterogeneity and source apportionment. Atmos. Res. 2017, 185, 13–21. [Google Scholar] [CrossRef]
  12. Rajesh, T.A.; Ramachandran, S. Black carbon aerosols over urban and high altitude remote regions: Characteristics and radiative implications. Atmos. Environ. 2018, 194, 110–122. [Google Scholar] [CrossRef]
  13. Prasad, P.; Roja Raman, M.; Venkat Ratnam, M.; Chen, W.N.; Vijaya Bhaskara Rao, S.; Gogoi, M.M.; Kompalli, S.K.; Sarat Kumar, K.; Suresh Babu, S. Characterization of atmospheric Black Carbon over a semi-urban site of Southeast India: Local sources and long-range transport. Atmos. Res. 2018, 213, 411–421. [Google Scholar] [CrossRef]
  14. Tan, H.; Liu, L.; Fan, S.; Li, F.; Yin, Y.; Cai, M.; Chan, P.W. Aerosol optical properties and mixing state of black carbon in the Pearl River Delta, China. Atmos. Environ. 2016, 131, 196–208. [Google Scholar] [CrossRef]
  15. Li, L.; Che, H.; Derimian, Y.; Dubovik, O.; Schuster, G.L.; Chen, C.; Li, Q.; Wang, Y.; Guo, B.; Zhang, X. Retrievals of fine mode light-absorbing carbonaceous aerosols from POLDER/PARASOL observations over East and South Asia. Remote Sens. Environ. 2020, 247, 111913. [Google Scholar] [CrossRef]
  16. Li, L.; Dubovik, O.; Derimian, Y.; Schuster, G.L.; Lapyonok, T.; Litvinov, P.; Ducos, F.; Fuertes, D.; Chen, C.; Li, Z.; et al. Retrieval of aerosol components directly from satellite and ground-based measurements. Atmos. Chem. Phys. 2019, 19, 13409–13443. [Google Scholar] [CrossRef] [Green Version]
  17. Saturno, J.; Pöhlker, C.; Massabò, D.; Brito, J.; Carbone, S.; Cheng, Y.; Chi, X.; Ditas, F.; Hrab De Angelis, I.; Morán-Zuloaga, D.; et al. Comparison of different Aethalometer correction schemes and a reference multi-wavelength absorption technique for ambient aerosol data. Atmos. Meas. Tech. 2017, 10. [Google Scholar] [CrossRef] [Green Version]
  18. Massabò, D.; Caponi, L.; Bove, M.C.; Prati, P. Brown carbon and thermal-optical analysis: A correction based on optical multi-wavelength apportionment of atmospheric aerosols. Atmos. Environ. 2016, 125, 119–125. [Google Scholar] [CrossRef]
  19. Wang, Q.Y.; Huang, R.J.; Cao, J.J.; Tie, X.X.; Ni, H.Y.; Zhou, Y.Q.; Han, Y.M.; Hu, T.F.; Zhu, C.S.; Feng, T.; et al. Black carbon aerosol in winter northeastern Qinghai-Tibetan Plateau, China: The source, mixing state and optical property. Atmos. Chem. Phys. 2015, 15, 13059–13069. [Google Scholar] [CrossRef] [Green Version]
  20. Shan, T. One-Year Measurements of Equivalent Black Carbon, Optical Properties, and Sources in the Urumqi River. Atmosphere 2020, 11, 478. [Google Scholar] [CrossRef]
  21. Allen, G.A.; Lawrence, J.; Koutrakis, P. Field validation of a semi-continuous method for aerosol black carbon (Aethalometer) and temporal patterns of summertime hourly black carbon measurements in southwestern PA. Atmos. Environ. 1999, 33, 817–823. [Google Scholar] [CrossRef]
  22. Zhang, X.Y.; Wang, Y.Q.; Zhang, X.C.; Guo, W.; Niu, T.; Gong, S.L.; Yin, Y.; Zhao, P.; Jin, J.L.; Yu, M. Aerosol monitoring at multiple locations in China: Contributions of EC and dust to aerosol light absorption. Tellus B Chem. Phys. Meteorol. 2008, 60, 647–656. [Google Scholar] [CrossRef]
  23. Weingartner, E.; Saathoff, H.; Schnaiter, M.; Streit, N.; Bitnar, B.; Baltensperger, U. Absorption of light by soot particles: Determination of the absorption coefficient by means of aethalometers. J. Aerosol Sci. 2003, 34, 1445–1463. [Google Scholar] [CrossRef]
  24. Arnott, W.P.; Hamasha, K.; Moosmüller, H.; Sheridan, P.J.; Ogren, J.A. Towards aerosol light-absorption measurements with a 7-wavelength aethalometer: Evaluation with a photoacoustic instrument and 3-wavelength nephelometer. Aerosol Sci. Technol. 2005, 39, 17–29. [Google Scholar] [CrossRef]
  25. Park, S.S.; Hansen, A.D.A.; Cho, S.Y. Measurement of real time black carbon for investigating spot loading effects of Aethalometer data. Atmos. Environ. 2010, 44, 1449–1455. [Google Scholar] [CrossRef]
  26. Virkkula, A.; Mäkelä, T.; Hillamo, R.; Yli-Tuomi, T.; Hirsikko, A.; Hämeri, K.; Koponen, I.K. A simple procedure for correcting loading effects of aethalometer data. J. Air Waste Manag. Assoc. 2007, 57, 1214–1222. [Google Scholar] [CrossRef] [PubMed]
  27. Schmid, O.; Artaxo, P.; Arnott, W.P.; Chand, D.; Gatti, L.V.; Frank, G.P.; Hoffer, A.; Schnaiter, M.; Andreae, M.O. Spectral light absorption by ambient aerosols influenced by biomass burning in the Amazon Basin. I: Comparison and field calibration of absorption measurement techniques. Atmos. Chem. Phys. 2006, 6, 3443–3462. [Google Scholar] [CrossRef] [Green Version]
  28. Collaud Coen, M.; Weingartner, E.; Apituley, A.; Ceburnis, D.; Fierz-Schmidhauser, R.; Flentje, H.; Henzing, J.S.; Jennings, S.G.; Moerman, M.; Petzold, A.; et al. Minimizing light absorption measurement artifacts of the Aethalometer: Evaluation of five correction algorithms. Atmos. Meas. Tech. 2010, 3, 457–474. [Google Scholar] [CrossRef] [Green Version]
  29. Cao, J.; Zhu, C.; Ho, K.; Han, Y.; Shen, Z.; Zhan, C.; Zhang, J. Light attenuation cross-section of black carbon in an urban atmosphere in northern China. Particuology 2015, 18, 89–95. [Google Scholar] [CrossRef]
  30. Zhang, Y.; Li, Y.; Guo, J.; Wang, Y.; Chen, D.; Chen, H. The climatology and trend of black carbon in China from 12-year ground observations. Clim. Dyn. 2019, 53, 5881–5892. [Google Scholar] [CrossRef]
  31. Zhang, X.Y.; Wang, Y.Q.; Niu, T.; Zhang, X.C.; Gong, S.L.; Zhang, Y.M.; Sun, J.Y. Atmospheric aerosol compositions in China: Spatial/temporal variability, chemical signature, regional haze distribution and comparisons with global aerosols. Atmos. Chem. Phys. 2012, 779–799. [Google Scholar] [CrossRef] [Green Version]
  32. Wang, Q.; Huang, R.J.; Cao, J.; Han, Y.; Wang, G.; Li, G.; Wang, Y.; Dai, W.; Zhang, R.; Zhou, Y. Mixing state of black carbon aerosol in a heavily polluted urban area of China: Implications for light absorption enhancement. Aerosol Sci. Technol. 2014, 48, 689–697. [Google Scholar] [CrossRef] [Green Version]
  33. Kondo, Y.; Sahu, L.; Kuwata, M.; Miyazaki, Y.; Takegawa, N.; Moteki, N.; Imaru, J.; Han, S.; Nakayama, T.; Oanh, N.T.K.; et al. Stabilization of the mass absorption cross section of black carbon for filter-based absorption photometry by the use of a heated inlet. Aerosol Sci. Technol. 2009, 43, 741–756. [Google Scholar] [CrossRef]
  34. Wang, Y.Q.; Zhang, X.Y.; Sun, J.Y.; Zhang, X.C.; Che, H.Z.; Li, Y. Spatial and temporal variations of the concentrations ofPM10, PM2.5 and PM1 in China. Atmos. Chem. Phys. 2015, 15, 15319–15354. [Google Scholar] [CrossRef]
  35. Li, M.; Liu, H.; Geng, G.; Hong, C.; Liu, F.; Song, Y.; Tong, D.; Zheng, B.; Cui, H.; Man, H.; et al. Anthropogenic emission inventories in China: A review. Natl. Sci. Rev. 2017, 4, 834–866. [Google Scholar] [CrossRef]
  36. Multi Resolution Emission Inventory for China. Available online: http://www.meicmodel.org (accessed on 27 June 2020).
  37. Stabile, L.; Fuoco, F.C.; Buonanno, G. Characteristics of particles and black carbon emitted by combustion of incenses, candles and anti-mosquito products. Build. Environ. 2012, 56, 184–191. [Google Scholar] [CrossRef]
Figure 1. Sites distribution of the China Atmosphere Watch Network (CAWNET) and the nine regions in China comes from the work of Zhang et al. [31].
Atmosphere 11 00684 g001
Figure 2. The correlations of absorption coefficient (common units: m−1 or Mm−1 = 10−6 m−1) measured by Aethalometer and element carbon (EC) concentration.
Atmosphere 11 00684 g002
Figure 3. Average BC concentration of each site from 2006 to 2015, unit: μg m−3.
Atmosphere 11 00684 g003
Figure 4. The average proportion of BC in PM2.5 from 2006 to 2015.
Atmosphere 11 00684 g004
Figure 5. The seasonal average BC concentration from 2006 to 2015, unit: μg m−3.
Atmosphere 11 00684 g005
Figure 6. Annual average variation of BC concentration at each site, unit: μg m−3, the X-axis sequence from 2006 to 2017, which are abbreviated as the last two digits.
Atmosphere 11 00684 g006
Figure 7. China BC emission inventory at 0.25° × 0.25° in (a) 2008, (b) 2010, (c) 2012, (d) 2015, (e) 2016, and (f) 2016 minus 2008, unit: ton grid−1.
Atmosphere 11 00684 g007
Figure 8. The diurnal variation of BC concentration at each station, units: μg m−3.
Atmosphere 11 00684 g008
Figure 9. Change ratio of the mean value of the revised data compared with the mean value of original data.
Atmosphere 11 00684 g009
Table 1. Location, grade, absorption cross section and average black carbon (BC) concentration of each site.
StationsLatitude (°N)Longitude (°E)Altitude (m)Typeσ* 1BC (2006–2015)BC (2016)BC (2017)
Chengdu (CD)30.65104.04496.0urban14.19.974.337.21
Zhengzhou (ZZ)34.78113.6899.0urban12.39.596.864.88
Xi’an (XA)34.43108.97363.0urban9.410.3610.47——
Nanning (NN)22.82108.3584.0urban13.44.012.412.00
Panyu (PY)23.00113.355.0urban8.87.903.84——
Anshan (AS)41.05123.0078.3urban14.43.661.952.24
Shenyang (SY)41.76123.41110.0urban14.45.29————
Benxi (BX)41.19123.47185.4urban14.46.006.604.56
Fushun (FS)41.88123.95163.0urban14.44.393.512.62
Beijing (BJ)39.80116.4731.3urban11.27.175.507.35
Dalian (DL)38.90121.6391.5urban14.42.94——0.73
Lhasa (LhS)29.6791.133663.0urban8.83.573.463.10
Tongliao (TL)43.60122.27178.5rural14.43.673.763.61
Huimin (HM)37.48117.5311.7rural11.25.311.731.92
Gaolanshan (GLS)36.00105.852161.5rural7.33.343.242.18
Yulin (YL)38.43109.201135.0rural7.36.00————
Xilinhaote (XLHT)43.95116.121003.0rural11.20.880.160.14
Gucheng (GC)39.13115.8015.2rural11.211.13——9.97
Jinsha (JS)29.63114.20416.0rural12.32.22————
Guilin (GL)25.32110.30164.4rural13.43.672.753.14
Lushan (LS)29.57115.991165.0rural12.31.650.550.43
Changde (CD)29.17111.71563.0rural182.03——2.34
Dongtan (DT)31.50121.8010.0rural12.31.641.982.48
Tazhong (TZ)39.0083.671099.3rural8.92.181.420.70
Hami (HaM)42.8293.52737.2rural8.94.353.022.69
Ejinaqi (EINQ)41.95101.07940.5rural8.92.170.790.56
Dunhuang (DH)40.1594.681139.0rural8.95.004.504.43
Zhurihe (ZRH)42.40112.901150.8rural11.21.200.660.78
Yushe (YS)37.07112.981041.4rural12.32.793.28——
Shangdianzi (SDZ)40.65117.12293.3rural11.22.402.291.82
Linan (LA)30.30119.73138.6rural12.34.142.742.43
Waliguan (WLG)36.28100.923816.0remote140.380.320.31
Longfengshan (LFS)44.73127.60330.5remote14.42.030.981.13
Akdala (AKDL)47.1287.97562.0remote8.90.450.410.45
Shangri-La (SGLL)28.0299.733580.0remote140.25——0.20
1 This symbol represents the absorption cross section applicable to each site.

