Article

Black Carbon: The Concentration and Sources Study at the Nam Co Lake, the Tibetan Plateau from 2015 to 2016

1
State Key Laboratory of Cryospheric Sciences, Northwest Institute of Eco-Environment and Resources, Chinese Academy of Sciences, Lanzhou 730000, China
2
Institute of Tibetan Plateau Research, Chinese Academy of Sciences, Beijing 100101, China
3
Beacon Science & Consulting, Doncatster East, VIC 3109, Australia
*
Author to whom correspondence should be addressed.
Atmosphere 2020, 11(6), 624; https://doi.org/10.3390/atmos11060624
Submission received: 20 May 2020 / Revised: 8 June 2020 / Accepted: 10 June 2020 / Published: 12 June 2020
(This article belongs to the Special Issue Interaction of Air Pollution with Snow and Seasonality Effects)

Abstract

:
We measured black carbon (BC) with a seven-wavelength aethalometer (AE-31) at the Nam Co Lake (NCL), the hinterland of the Tibetan Plateau (TP) from May 2015 to April 2016. The daily average concentration of BC was 145 ± 85 ng m−3, increasing by 50% since 2006. The seasonal variation of BC shows higher concentrations in spring and summer and lower concentrations in autumn and winter, dominated by the adjacent sources and meteorological conditions. The diurnal variation of BC showed that its concentrations peaked at 9:00–16:00 (UTC + 8), significantly related to local human activities (e.g., animal-manure burning and nearby traffic due to the tourism industry). The concentration-weighted trajectory (CWT) analysis showed that the long-distance transport of BC from South Asia could also be a potential contributor to BC at the NCL, as well as the biomass burning by the surrounding residents. The analyses of the absorption coefficient and absorption Ångström exponent show the consistency of sourcing the BC at the NCL. We suggest here that urgent measures should be taken to protect the atmospheric environment at the NCL, considering the fast-increasing concentrations of BC as an indicator of fuel combustion.

1. Introduction

Black carbon (BC) has a vital role in the earth’s climate system and energy budget. BC is produced by the incomplete combustion of biomass, coal, and diesel fuels. In the atmosphere, BC causes atmospheric heating and alters cloud formation processes [1], which is estimated to be the second most important agent of global warming after CO2 [2,3]. BC can transport far away from its emission source since its lifetime in the atmosphere varies from several days to weeks. BC deposited on ice and snow surfaces has been proven to reduce surface albedo by absorbing more solar radiation, which may accelerate glacier melting and result in changes in glaciers [4,5]. BC not only plays a major role in climate change, but also has negative influences on human health [6].
The Nam Co Lake, hereafter NCL (30°30′–30°56′ N, 90°16′–91°03′ E) is located in the hinterland of the Tibet Plateau (TP). It is the highest saltwater lake in the world and the second-largest saltwater lake in China. Due to the harsh natural environment and climatic conditions, the NCL is far from human life and industrial production areas, and human activities there are weak. The NCL adjoins several important BC emission regions, such as South East Asia, South Asia, and the southwestern part of China. The atmospheric pollutants from these areas can reach the TP through long-distance transmission, leading to significant changes in the environment and climate of the NCL [7]. Therefore, the NCL has relatively weaker emissions, which is an ideal choice to monitor the regional background concentration of BC and evaluate the various impacts caused by human activities. Moreover, the monitoring of BC as an air pollutant at the NCL is necessary and fundamental, not only for its environmental purpose, but also for its climatic significance.
In recent decades, many studies have been devoted to the observation and research of BC at the remote site of the TP. These studies have played a key role in determining the seasonal and diurnal variation, potential source contribution areas, and optical properties of BC [8,9,10,11]. For example, Ming et al. [12] used traditional sampling methods to study the BC concentration at the NCL from July 2006 to January 2007 and suggested that the BC concentration at the NCL can reflect regional and even global atmospheric background concentration. Zhao et al. [8] used the same method to measure the BC concentrations at the NCL from July 2006 to December 2009 and suggested that BC concentration in non-monsoon periods is higher than that in monsoon periods due to the emission sources in South Asia. Wan et al. [13] studied the BC concentration with different sample sizes at the NCL from January 2012 to December 2013. Besides the studies on the concentrations of BC, there are also studies on the source of BC. Li et al. [14] analyzed the carbon isotope composition of aerosol samples and snow pit samples in the northern Qinghai-Tibet Plateau, suggesting that BC is mainly affected by fossil fuel combustion rather than biomass combustion. Zhang et al. [9] studied the diurnal variation of BC at the NCL from October 2010 to October 2014 and analyzed the possible sources of BC by the correlation of atmospheric optical depth (AOD) and BC. However, China’s research on BC was mainly concentrated in cities and some suburbs [10,15,16,17], while the BC observation data in the hinterland of the TP are still scarce, especially since real-time online observation, and the absorption characteristics of aerosols at the NCL and its source analysis based on this are not well understood.
Here, the high temporal-resolution data of BC at the NCL, measured by an aethalometer instrument (Model AE-31), are presented. The primary objectives of this study were: (1) to characterize the seasonal and diurnal variation of BC; (2) to explore the relationship between BC, meteorological conditions, and absorption properties; (3) to investigate the potential sources and transport pathways of BC. The results can provide scientific and theoretical support for assessing the environmental and climatic effects of BC in remote areas.

2. Experiments

The data collected in this work were uniformized to Beijing time (UTC +8).

2.1. Site Description

A seven-wavelength aethalometer (AE-31) was deployed at the NCL, located in the hinterland of the TP, as shown in Figure 1. The observation station is set up at the NCL Station (30°46.44′ N, 90°59.31′ E) for Multi-Sphere Observation and Research, Chinese Academy of Sciences (hereinafter referred to as the NCL Station). This station is located in the southeast of the NCL, north of the Nyainqen Tanglha Mountains, and is about 60 km away from the nearest city, Dangxiong, Tibet. The NCL is mainly affected by the Indian monsoon in summer and westerly circulation in winter.
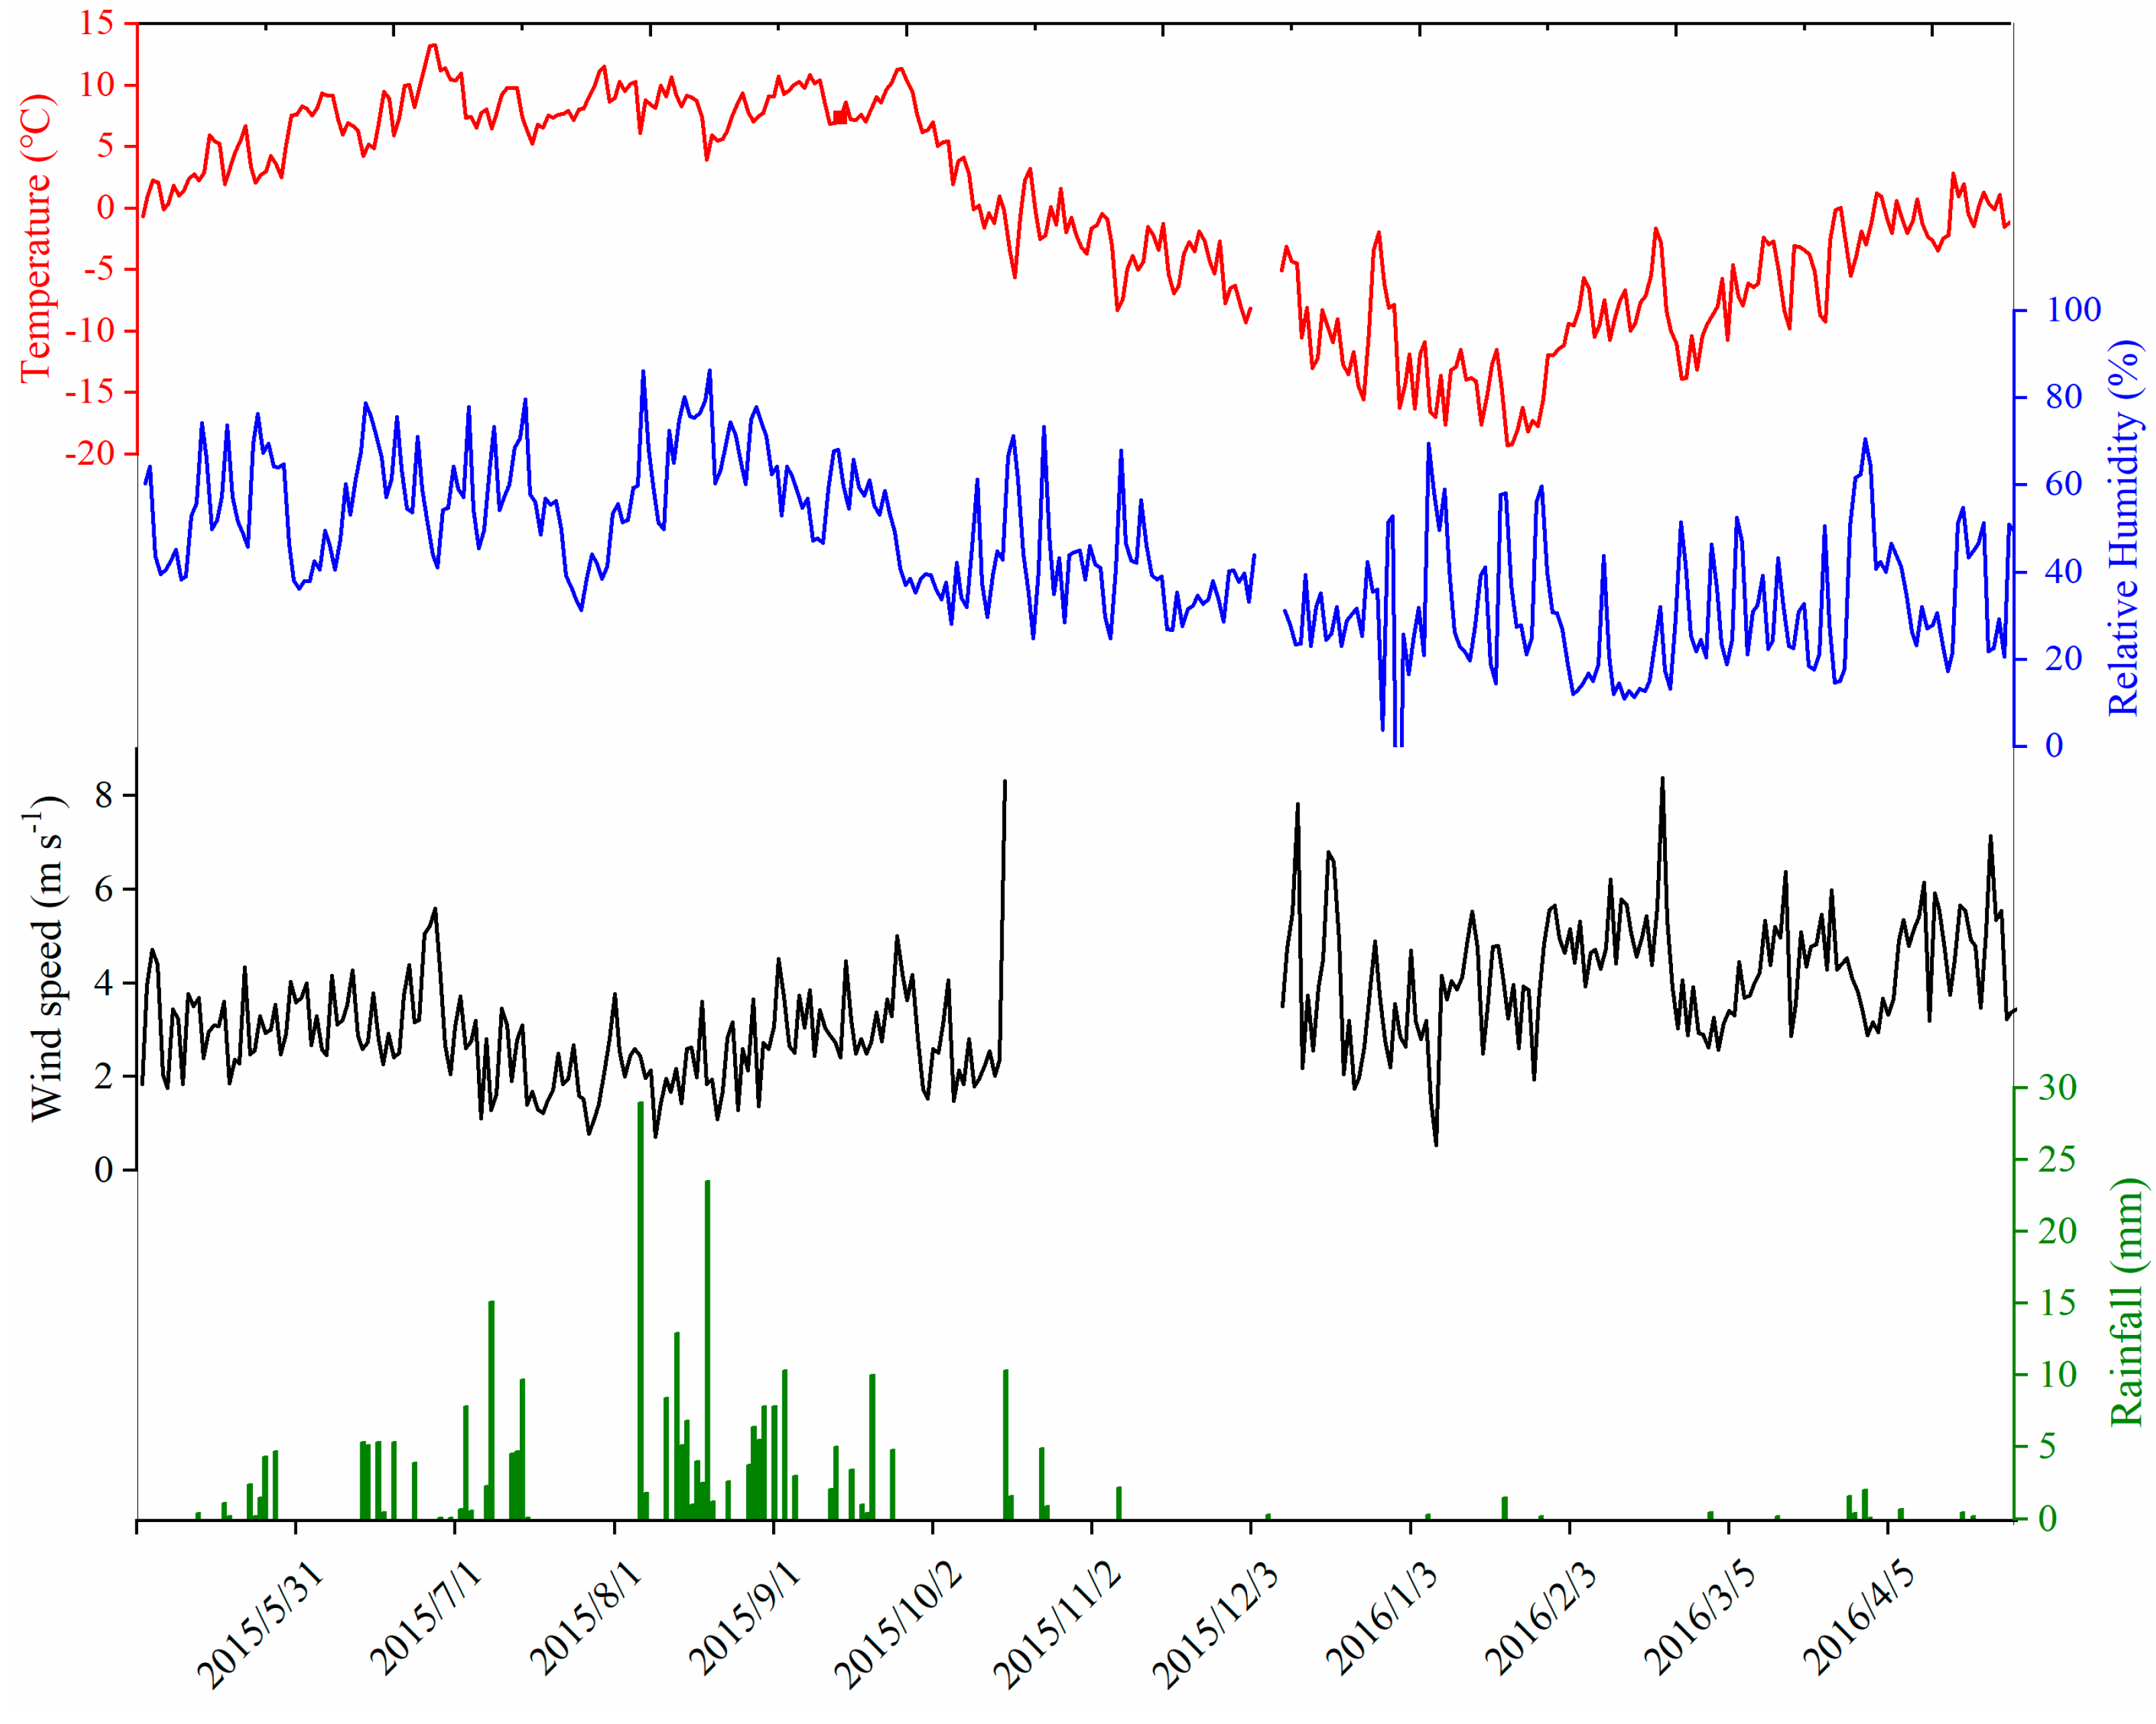
Figure 2 shows the temperature, precipitation, wind speed, and relative humidity data observed by the automatic weather station (AWS) at the NCL Station from May 2015 to April 2016. Meteorological conditions show seasonal variations. The highest average temperature was 8.3 °C in summer, and the lowest average temperature was −11 °C in winter. The average temperatures in spring and autumn were −0.9 °C and 1.9 °C, respectively. Rainfall mainly occurred in summer, accounting for 68% of one year and the relative humidity exceeded 59%. Rainfall was scarce in winter, accounting for only 7% of one year, and the atmosphere was relatively dry. During the entire sampling period, wind speeds were 3.9, 2.6, 3, and 4.1 m s−1 from spring to winter, respectively.

2.2. Instrument and Data Analysis

Near-real-time continuous measurement of BC was observed from May 2015 to April 2016 using a seven-wavelength aethalometer, model AE31 (Magee Scientific®, Berkeley, CA, USA, measuring at 370, 470, 520, 590, 660, 880, and 950 nm). The flow rate was 3.9 liters per minute (LPM) with a time resolution of 5 min. The air sampling inlet without cutoff was amounted at the height of ~2 m above the ground [18]. The optical attenuation-detecting technique was used in the aethalometer. The BC concentration was calculated from an incremental attenuation between two measurements using the effective specific mass absorption cross-section (MAC) of the BC deposited on the quartz filter, area of the sample spot, and the flow rate. Regular calibrations and flow checks were carried out on the instrument to maintain the data reliability and accuracy. This instrument was calibrated in 2015 by the manufacturer, Magee Technologies™. The mass concentration of BC derived from the aethalometer did not represent the actual value of BC but was referred to as “equivalent BC” [19]. The 880 nm channel was considered as the standard channel for BC measurement, since BC is the principle absorber of light at that wavelength. The MAC value of 16.6 m2 g−1 was used to determine the BC concentration at 880 nm [20].
Considering the instability of aethalometer, extreme data are prone to appear in online observations, including outliers and negative values. In this study, the raw data were processed through the noise reduction averaging (ONA) algorithm [21], which can be used to reduce noise. The similar data screening procedure of BC is described elsewhere [21,22,23]. In addition, the data were processed into a 1 h average for further calculation and analysis.

2.3. Calculation of Optical Properties

The aerosol absorption coefficient α(λ) was obtained by using the following equation:
α ( λ ) = B C × 14,625 × 10 3 λ × C × R
where α(λ) is aerosol absorption coefficient, λ is the wavelength, which was 880 nm for BC calculations here, C is the multiple scattering uncertainty factor, which depends on the filter paper and apparatus, and R is the correction factor for minimizing the inherent uncertainty associated with the aethalometer, arising from the multiple scattering of light in the filter matrix and the change in the optical path length due to successive aerosol loading [24]. Here C = 2.14 and R = 1 were adopted here to simplify calculation [25], although recently some studies have demonstrated that those correction factors depend on wavelengths and meteorological conditions [26].
In order to understand the spectral changes in the aerosol light absorption properties, we calculated the absorption Ångström exponent (AAE) in the present study with the following equations:
A A E ( λ 1 , λ 2 ) = ln ( α ( λ 1 ) ) ln ( α ( λ 2 ) ) ln ( λ 1 ) ln ( λ 2 )
where AAE is the absorption Ångström exponent, and λ is wavelength. AAE is a powerful real-time measurable spectral parameter for source apportionment [27,28] and to see its applicability for source identification presents some actual examples of AAE associated with different sources, such as vehicle, biomass, or coal emissions. For example, AAE is close to 1 when vehicle emissions are dominant, while it falls between 1 and 3 when incomplete combustion is significant [29,30] and it can reach even higher values during the processes of biomass burning or secondary organic formation [31]. Earlier investigators have reported that BC originating from fossil fuel combustion has an AAE varying inversely with wavelength [32]. The AAE used here was calculated restrictedly in visible lights (470 and 660 nm).

2.4. Backward Trajectory Analysis and Concentration Weighted Trajectory Analysis

To investigate the potential transport pathways of BC, five-day backward air-mass trajectories were computed using the Hybrid Single-Particle Lagrangian Integrated Trajectory (HYSPLIT) model [33]. This model was run every six hours for the whole sampling period for each sampling site at 500 m above ground level (AGL) on each day from 1 May 2015 to 30 April 2016. The meteorological data used for trajectory calculating were the GDAS (Global Data Assimilation System) data (1° × 1°) and were downloaded from the web server of NOAA Air Resources Laboratory.
Concentration weighted trajectory analysis (CWT) is a method for calculating the weighted concentration of trajectories in a potential source area, which assigns the concentration values at the receptor site to the respective backward trajectories [34]. In the CWT method, each grid cell is assigned a weighted concentration by averaging the sample concentrations that have associated trajectories that crossed that grid cell as follows:
C i j = 1 l = 1 M m i j l   l = 1 M C l m i j l
where Cij is the average weight concentration on the grid (i, j), l is index of the trajectory, M is the total number of trajectories, Cl the concentration observed on arrival of trajectory l, and mijl is the time spent on the grid (i, j) by trajectory l. A high value for Cij implies that air parcels traveling over the grid (i, j) would be, on average, associated with high concentrations at the receptor. The arbitrary weighting function described above was also used in the CWT analyses to reduce the effect of the small values of nij, which is the total endpoint number of air-mass trajectories falling into the ijth cell during the study period.

3. Results and Discussion

3.1. Temporal Variations of BC

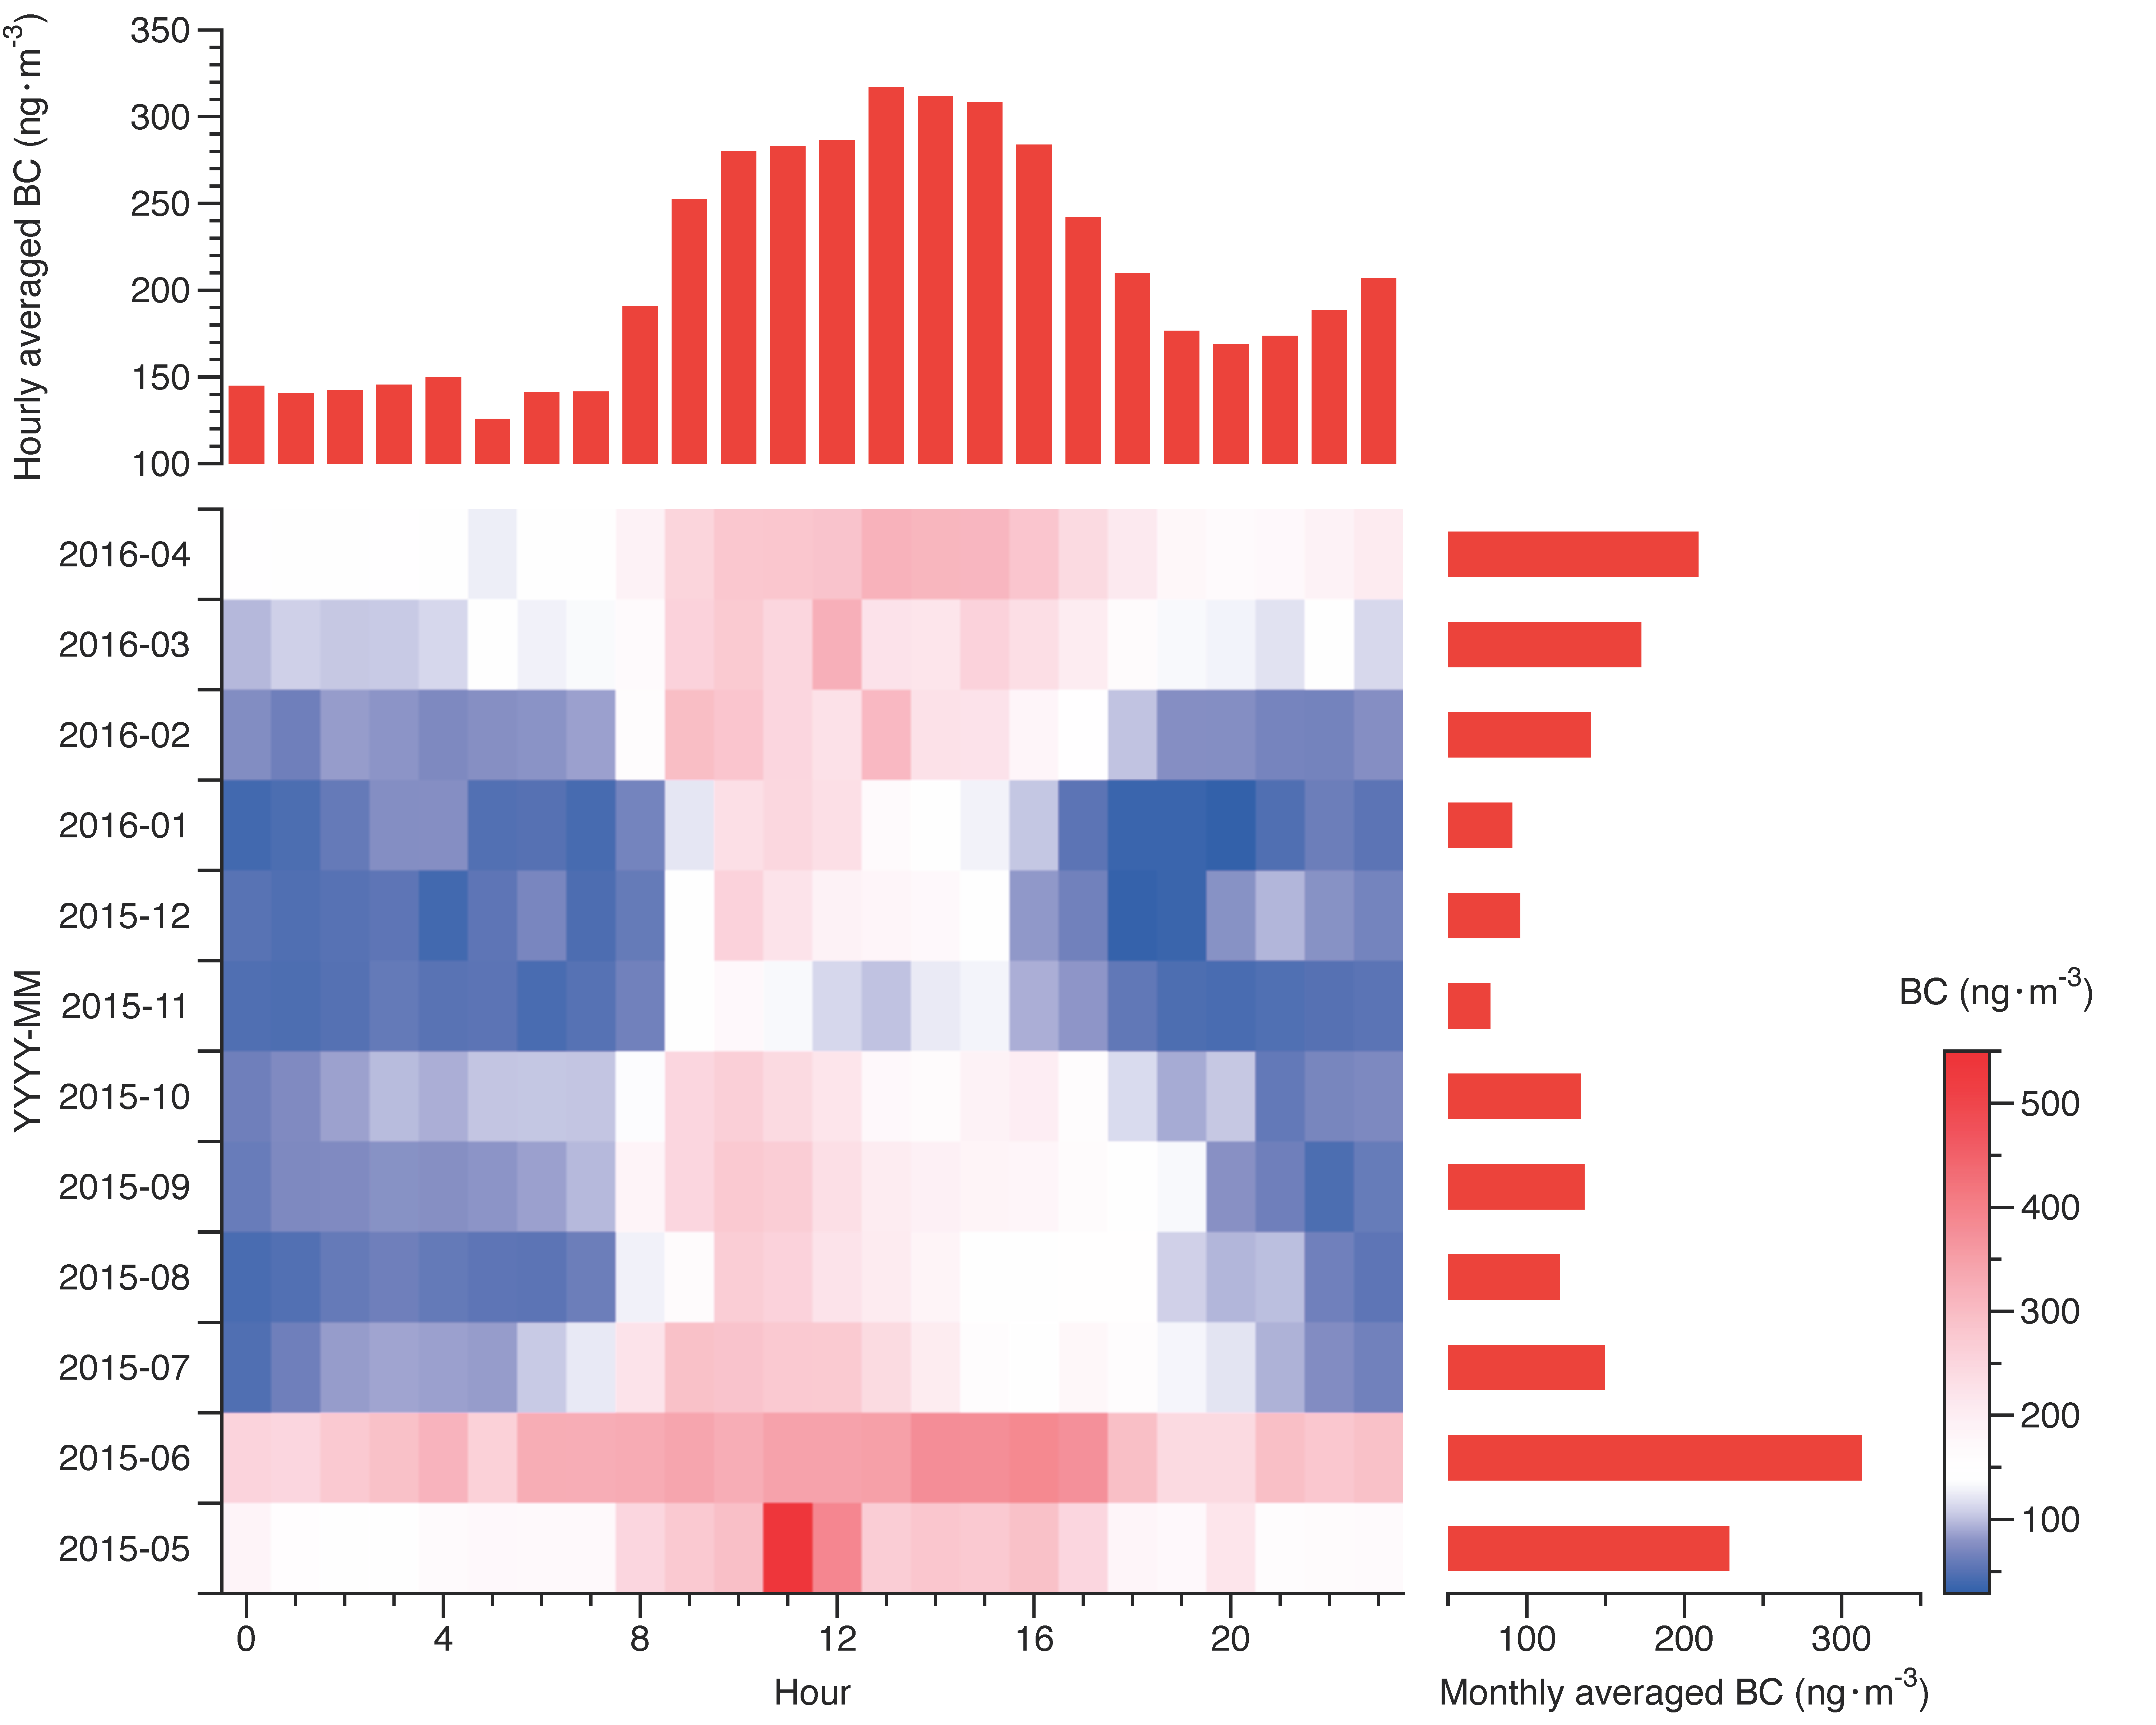
The daily and hourly mean concentrations of BC at the NCL from May 2015 to April 2016 are shown in Figure 3. During the observation period, the daily mean BC was substantially in the range of 25–578 ng·m−3 with the mean of 145 ± 85 ng·m−3. Compared with a decade ago [12], the average concentration of BC increased by 50%. The monthly mean of the concentrations 150 of BC ranged from 77–312 ng·m−3. The BC has seasonal cycles at Nam Co. The seasonally averaged BC concentrations during the study period were 203, 194, 116, and 109 ng·m−3 in spring, summer, autumn and winter, respectively. The concentrations of BC in spring and summer were approximately two-times higher than in autumn and winter. The highest concentration might be related to the large amounts of biomass burning at Nam Co and relatively drier weather. The lowest average concentration in November may be attributed to more precipitation during the 2015 monsoon period. After the precipitation, the BC concentration at Nam Co dropped to a lower level.
This seasonal variation was mainly related to long-distance transport and meteorological conditions. High BC concentrations in spring could be attributed to meteorological conditions, such as it being relatively dry and there being less precipitation. Compared with spring, the BC concentration in summer was lower, which may be due to the frequent precipitation events in summer, accounting for 68% of the whole year. Precipitation has a wet removal effect on BC, thereby greatly reducing BC concentration.
Studying the diurnal variation of BC is a useful approach to understand the effect of mesoscale atmospheric processes and human activities on BC [35]. The diurnal variation of BC at Nam Co had obvious unimodal characteristics, which were high during the day (205 ng·m−3) and low at night (106 ng·m−3). There was a significant peak in BC concentration during 9:00–16: 00 Beijing time (the same applies from now on), which was strongly related to meteorological factors and local anthropogenic activities, such as the indigenous Tibetan burning of animal waste and tourism traffic. At 7:00 h, BC concentration began to increase until the highest value appeared at 11:00, when it started to decline slowly and decreased to the bottom at 0:00–1:00. The peak concentrations appearing at 11: 00 were closely related to local residents’ activities (cooking, heating, etc.) and tourism (traffic and biofuel burning). The lowest values appeared between 0:00 and 1:00, which may be related to lower night temperatures and fewer human activities.
Table 1 shows the BC concentrations with the aethalometer in some remote region over the Tibetan Plateau. BC concentrations at Nam Co were significantly lower than at Ranwu and Beiluhe. The BC concentrations at the NCL were close to most of those over the remote region of the TP, such as Muztagh Ata and Qilian Shan, which also reflects that relatively clean atmosphere environment. Therefore, Nam Co has a lower BC concentration and fewer emission sources, which effectively reflects the background concentration of the Tibetan Plateau. However, under appropriate atmospheric transmission conditions, emissions from surrounding areas also increase the BC concentration of Nam Co.

3.2. Impacts of Meteorological Conditions on BC Variations

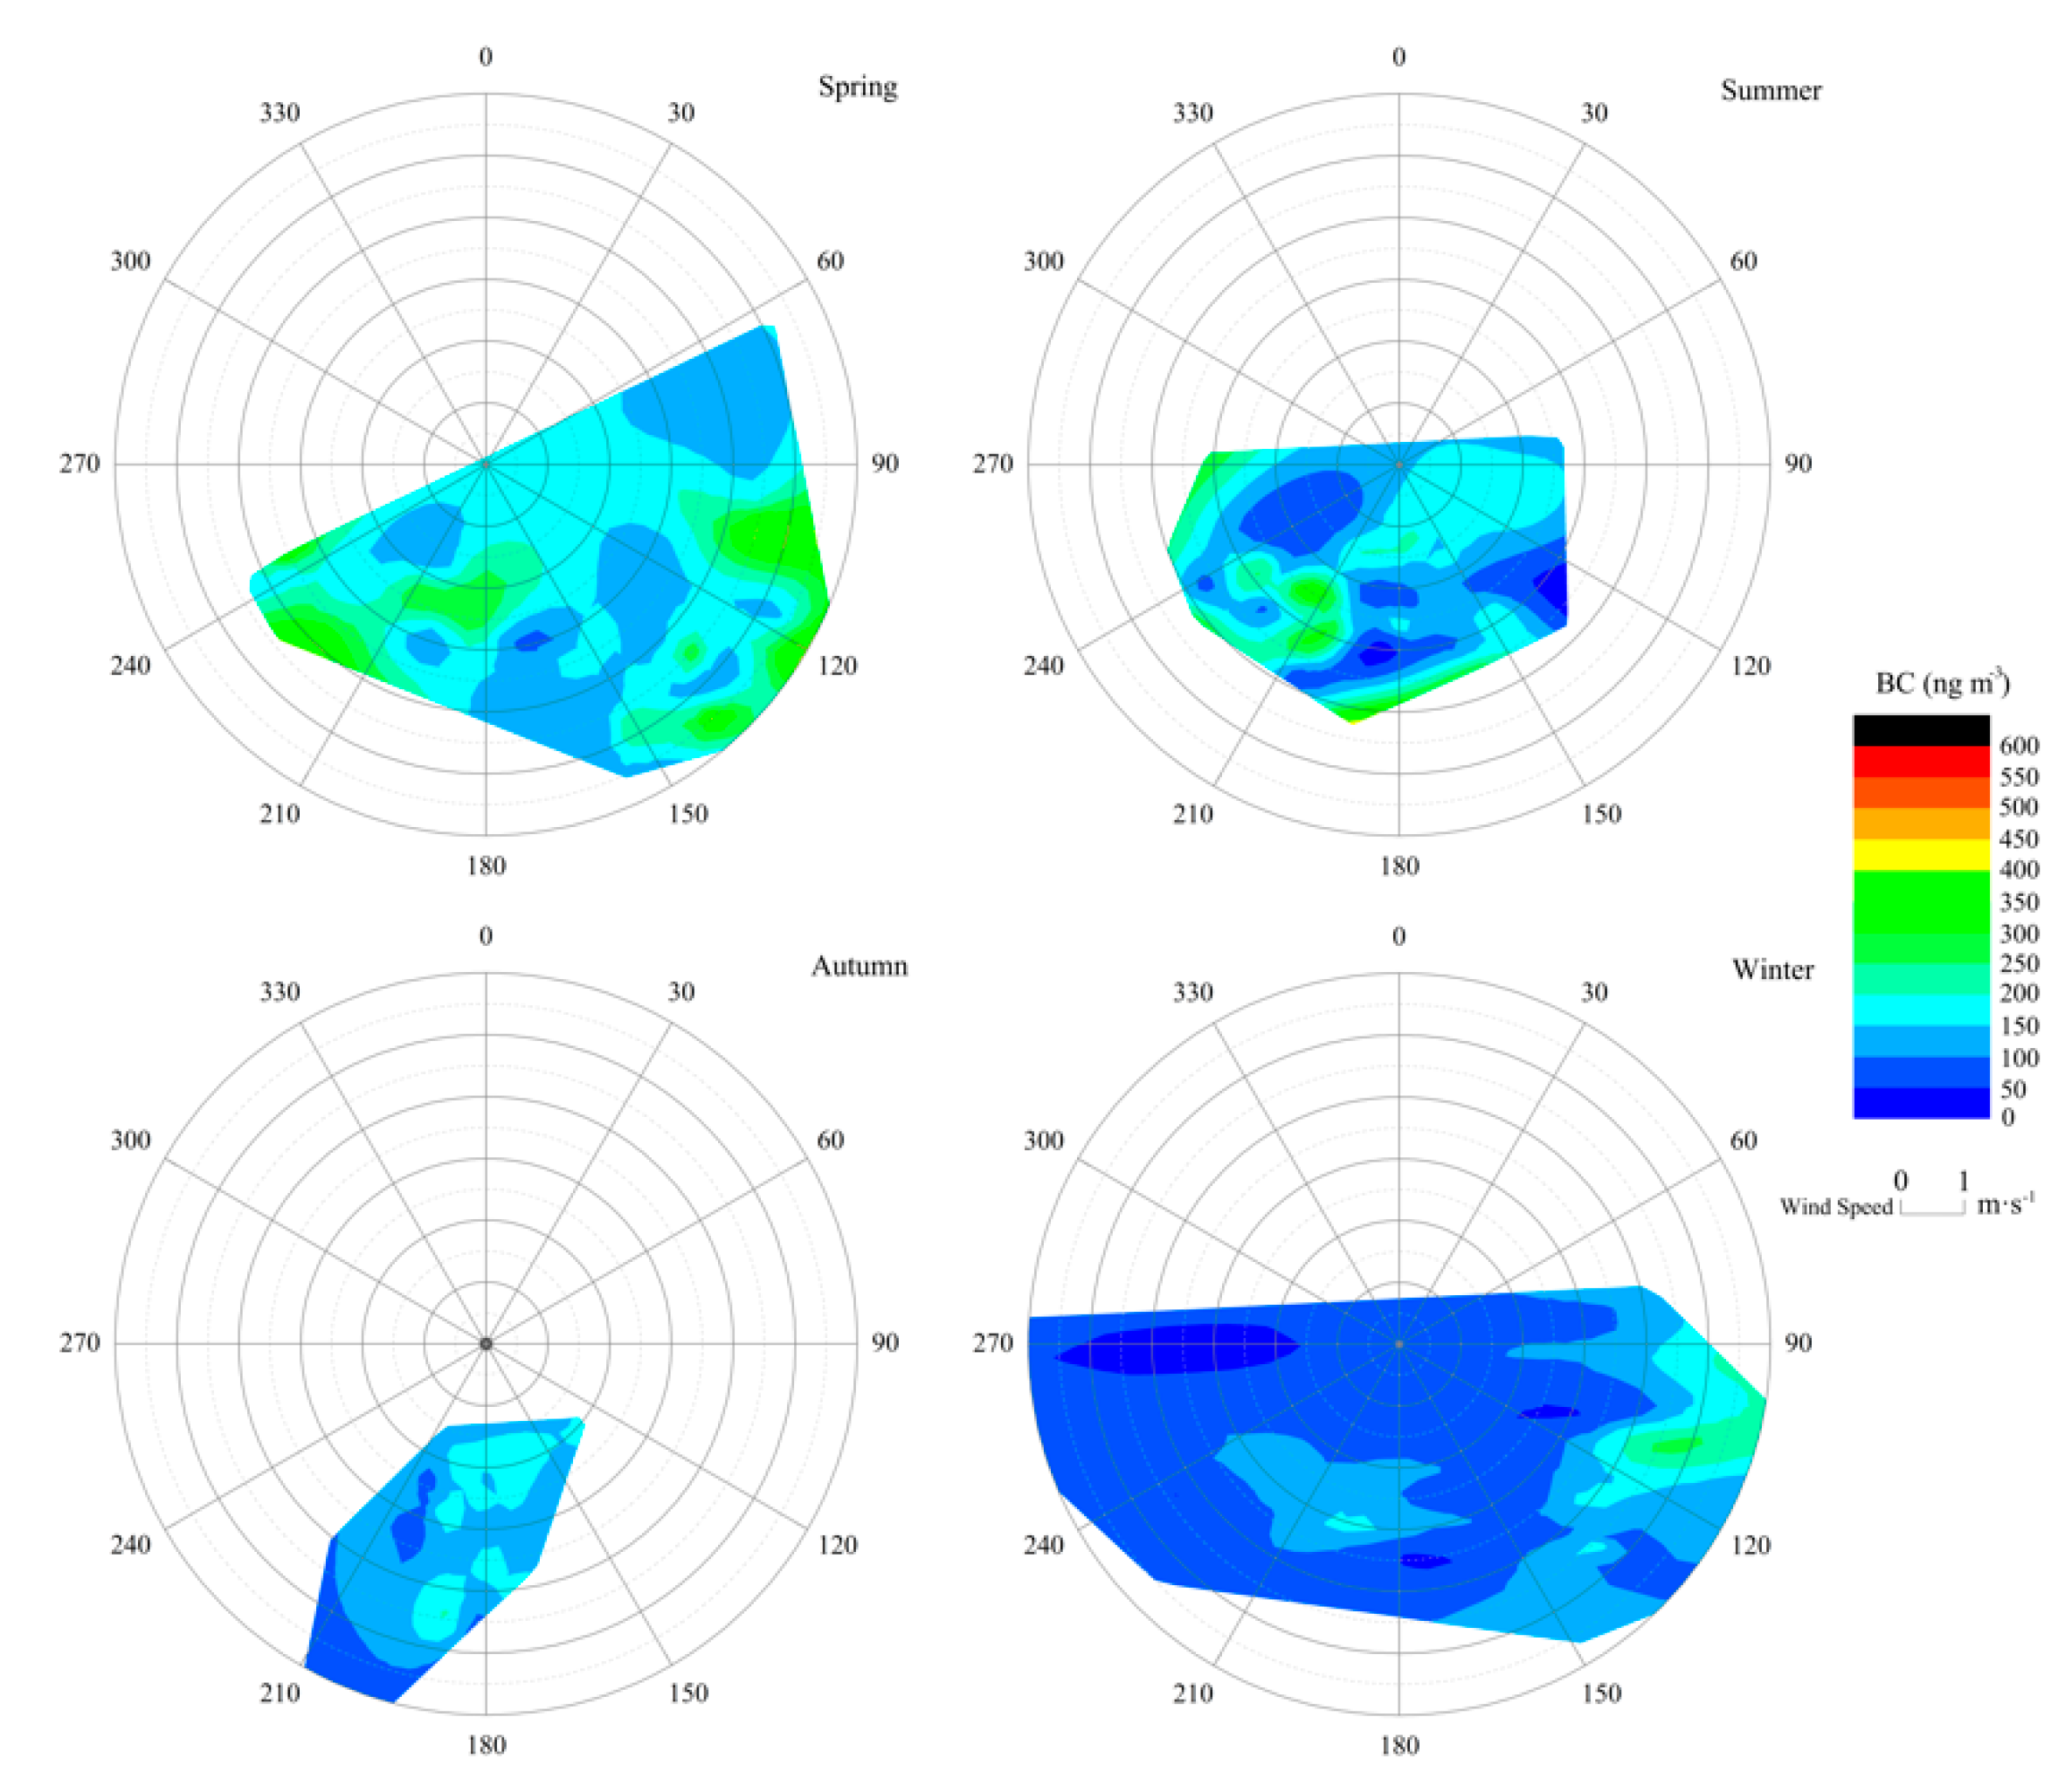
BC aerosols in the atmosphere are usually affected by the combination of meteorological conditions, such as source emissions, wet and dry deposition processes, wind, and atmospheric boundary layers. Rainfall, relative humidity, and winds are also significant factors of BC concentration. Figure 4 shows the relationship between BC and winds at Nam Co. Higher concentrations of BC (>150 ng·m−3) are associated with higher wind speeds and southern and eastern directions in all seasons, and in winter, when westerlies prevail, the BC was predominantly lower than 50 ng·m−3 unless the high-speed wind (>4 m·s−1) brought inputs from the east-southeast. This indicates that the high-speed winds in the southern directions can transport BC with long-distance sources to the NCL. When BC concentration were higher than 300 ng·m−3, southeast and southwest winds were high-frequency wind directions in spring, and south and southwest winds were high-frequency wind directions in summer. When the BC concentrations fell between 200 ng·m−3 and 300 ng·m−3, south and southwest winds were high-frequency wind directions in autumn, while southeastern wind was the high-frequency wind direction in winter.
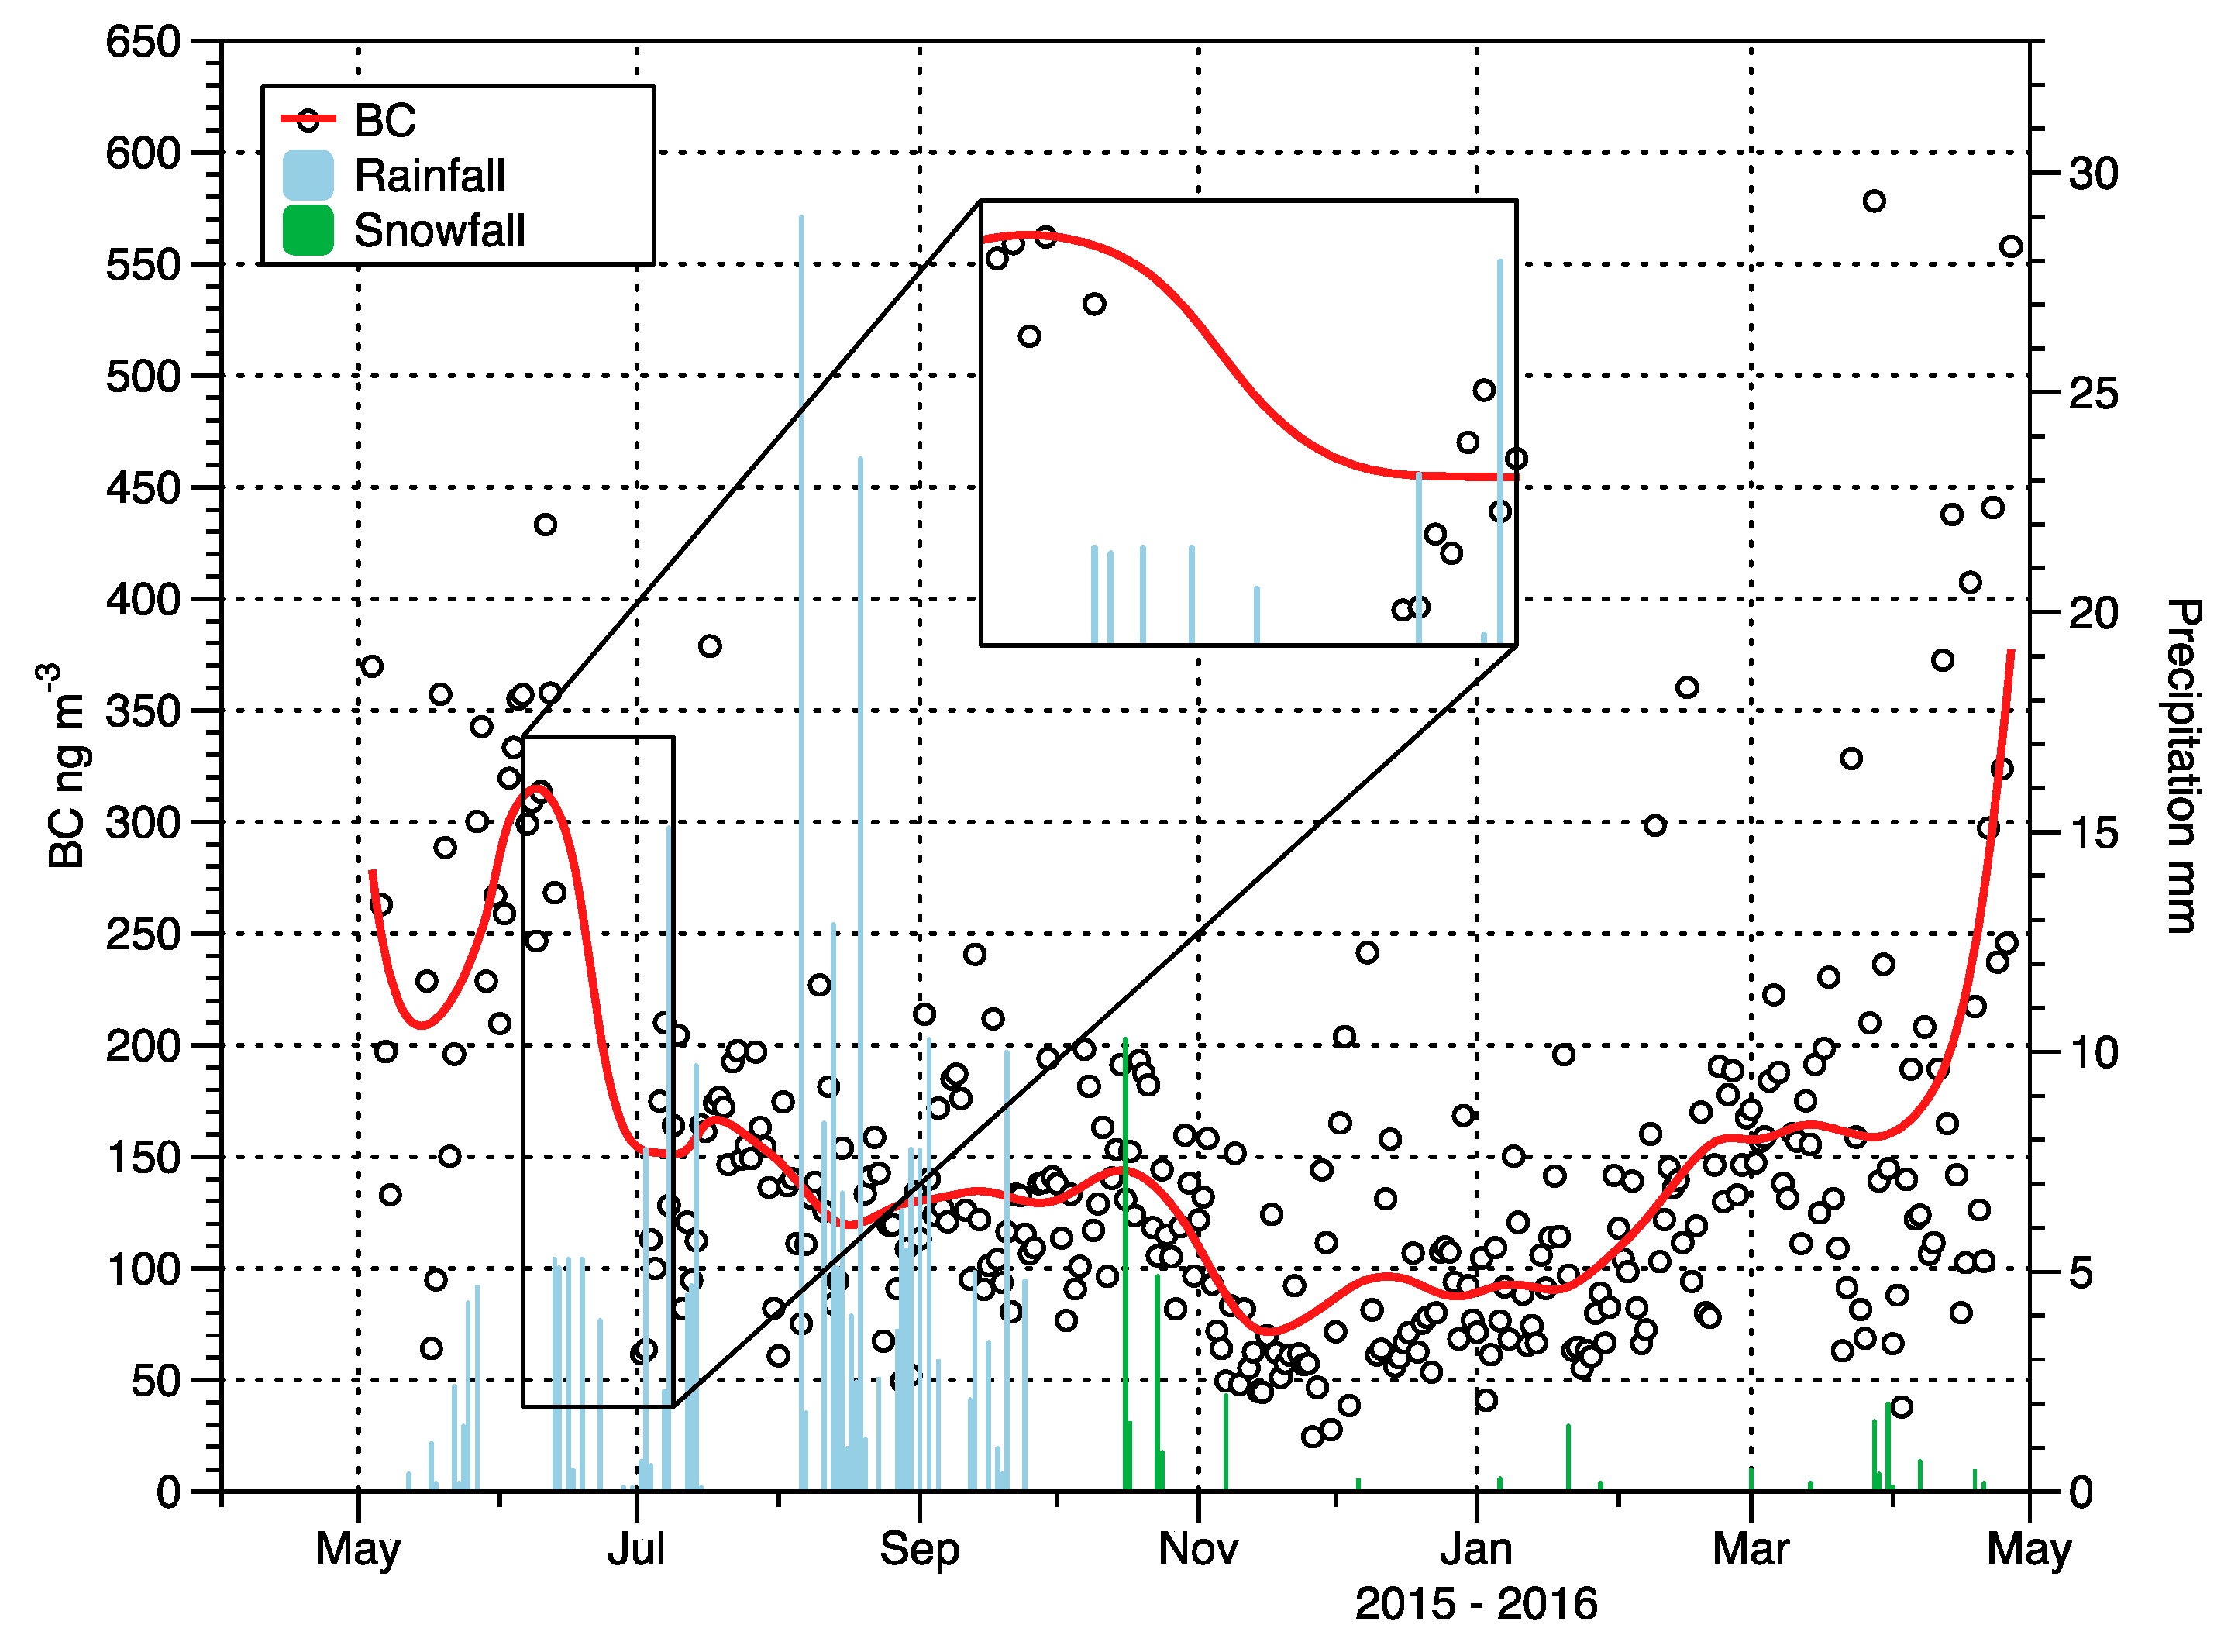
Besides the prevailing winds, precipitations also play a crucial role in influencing the concentrations of the atmospheric constituents at the NCL [12]. Figure 5 shows the change of BC concentration during rainfall and snowfall. Precipitation has a wet removal effect on BC, which significantly reduces the concentration of BC. There are frequent rainfall events in summer, which accounts for 68% of the yearly days, making the BC concentrations in summer slightly lower than those in spring. Three days after rainfall, BC concentrations were still at a low level, and the lowest concentration appeared on the rainfall day. Compared with rainfall, snowfall in winter had a more substantial effect on the deposition of BC, and it took longer for the BC concentration to recover to the average concentration after snowfall than after rainfall.
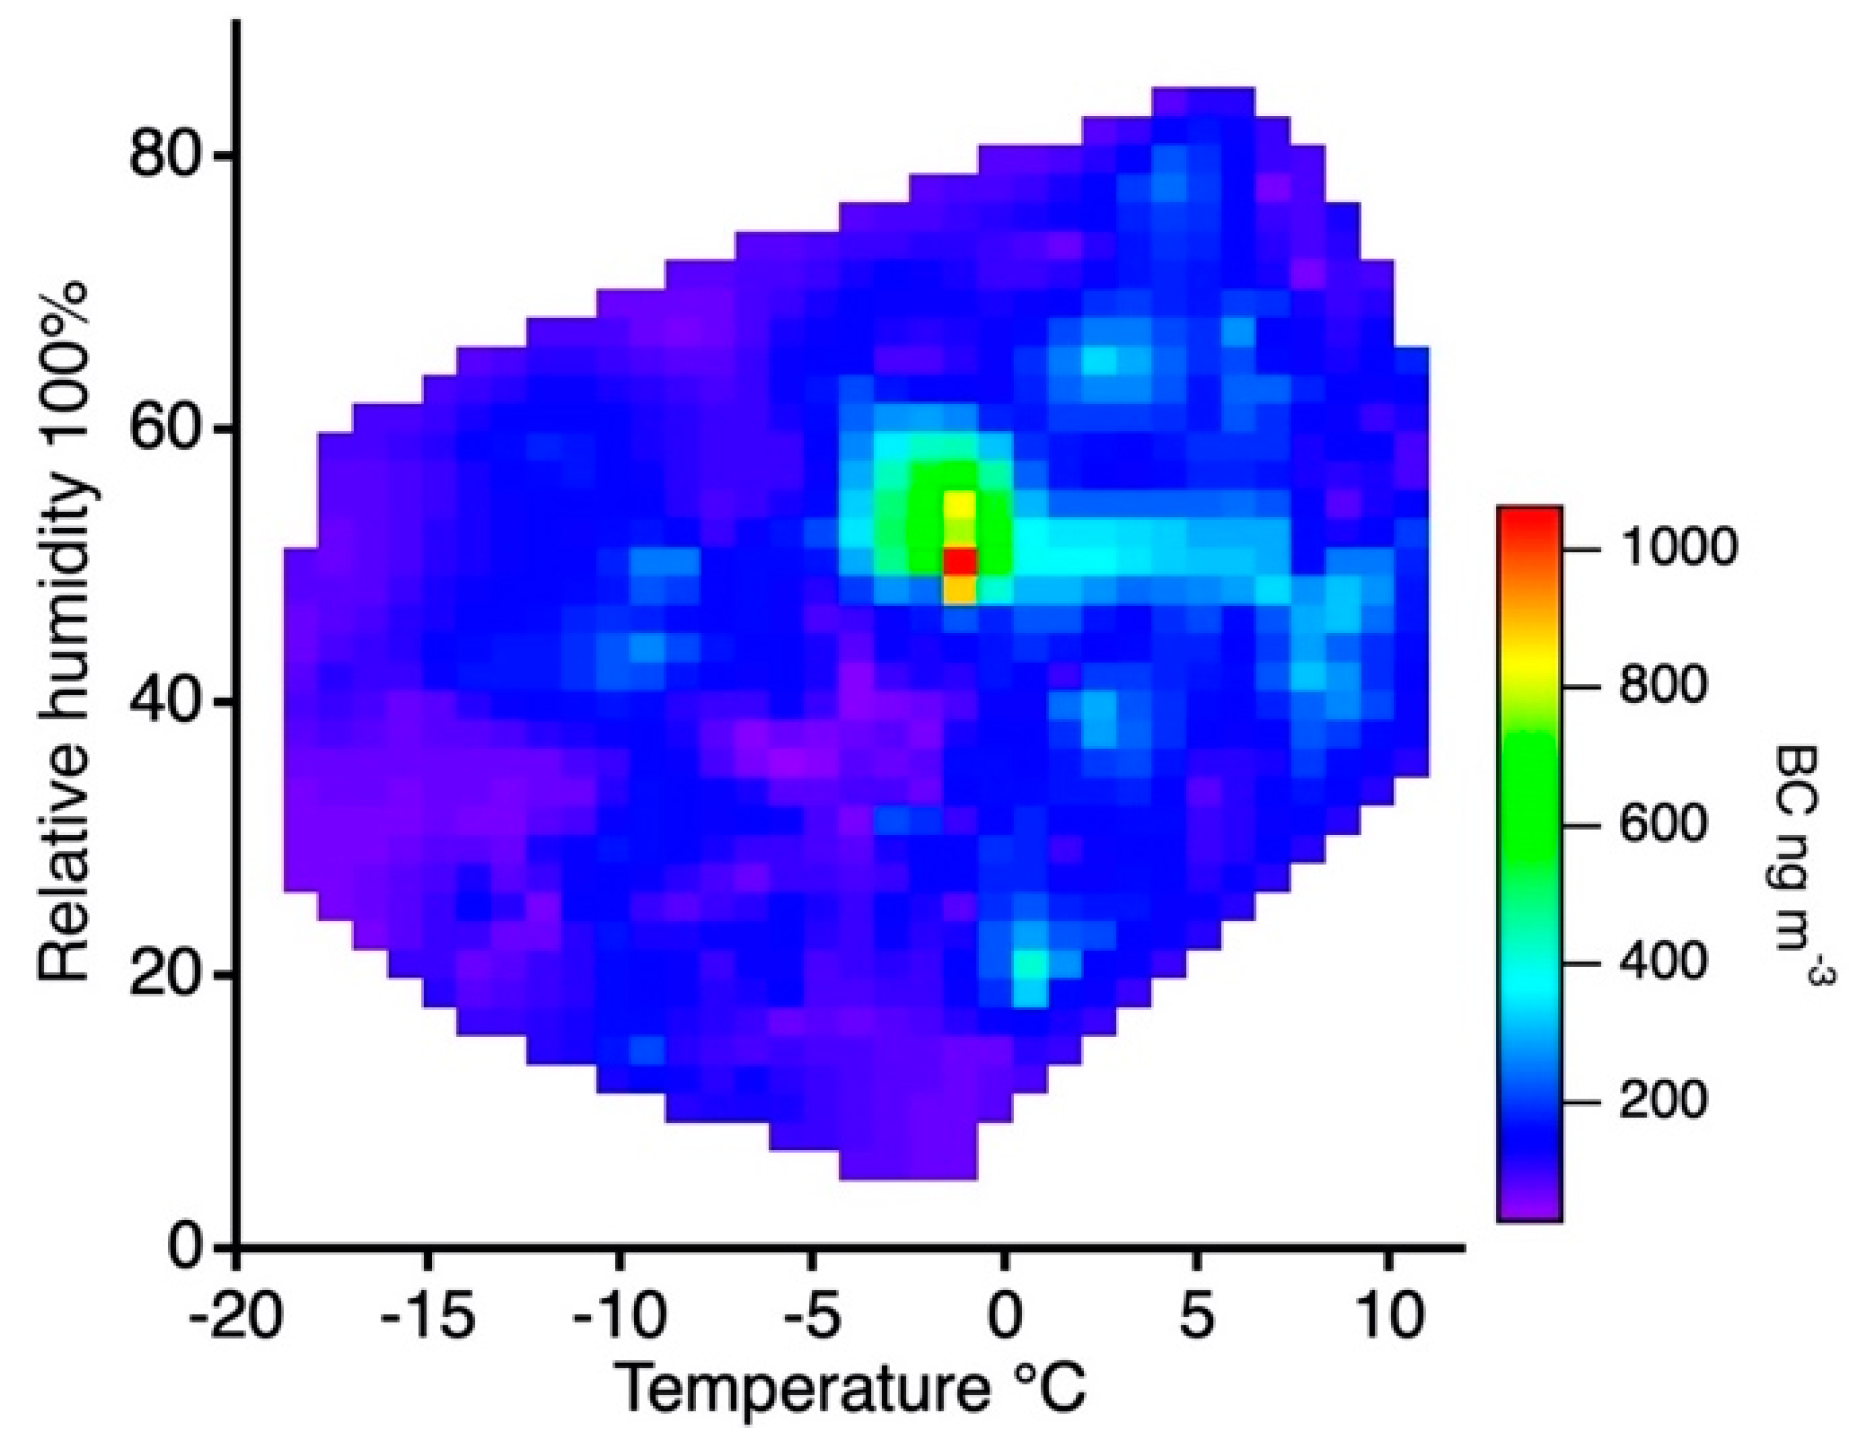
Figure 6 shows the concentration distribution of BC in the map of temperature and relative humidity (RH) at the NCL. The BC particles tend to agglomerate within the area of ~45–60% in RH from ~–5 °C to 0 °C and show significantly higher concentrations than other areas of temperature and RH. At another site—Qilian Mountain of the TP—Zhao et al. [36,39] observed that the BC showed a significantly positive correlation with RH (under 50%) and suggested that BC could join in absorbing water vapor in relatively drier environments and act as a condensing nuclei. We suggest that BC particles at the NCL might also absorb water vapor in the function of relative humidity in a relatively dry and cold environment. The correlation of BC with decreasing temperature could be due to the strong influence of biomass burning for domestic heating, which had been observed at several sites, as shown by a previous study [40].

3.3. Absorption Properties of BC

The monthly averages absorption coefficient of BC ranged from 0.6 to 2.43 Mm−1 for α(λ) (880 nm) from Equation (1) with an average value of 1.2 ± 0.52 Mm−1. The seasonal averages were 1.58 ± 0.22, 1.51 ± 0.8, 0.9 ± 0.26, and 0.85 ± 0.21 Mm−1 for α(λ)(880 nm) in spring, summer, autumn, and winter, respectively. In general, α(λ)(880 nm) is the largest in spring, and the lowest in winter. This is associated with the emission sourcing varying with seasons at the NCL. In spring and summer, there are more active human activities on the plateau, including relatively intense tourism and pasturing. The induced biomass burning from these activities emits brown carbon which has remarkable—and gradually increasing—absorption capabilities towards the shorter wavelengths under 600 nm [41], while in autumn and winter, strong westerlies swipe and carry dust, impacting the NCL area, which have a three order-of-magnitude smaller absorption than BC [42]. However, in this wavelength range, the absorption of dust, including hematite composite, can have absorption comparable with BC [43]. The stronger aerosol absorption in spring might result from the absorption by higher BC concentrations and additional dust input in dryer seasons [9].
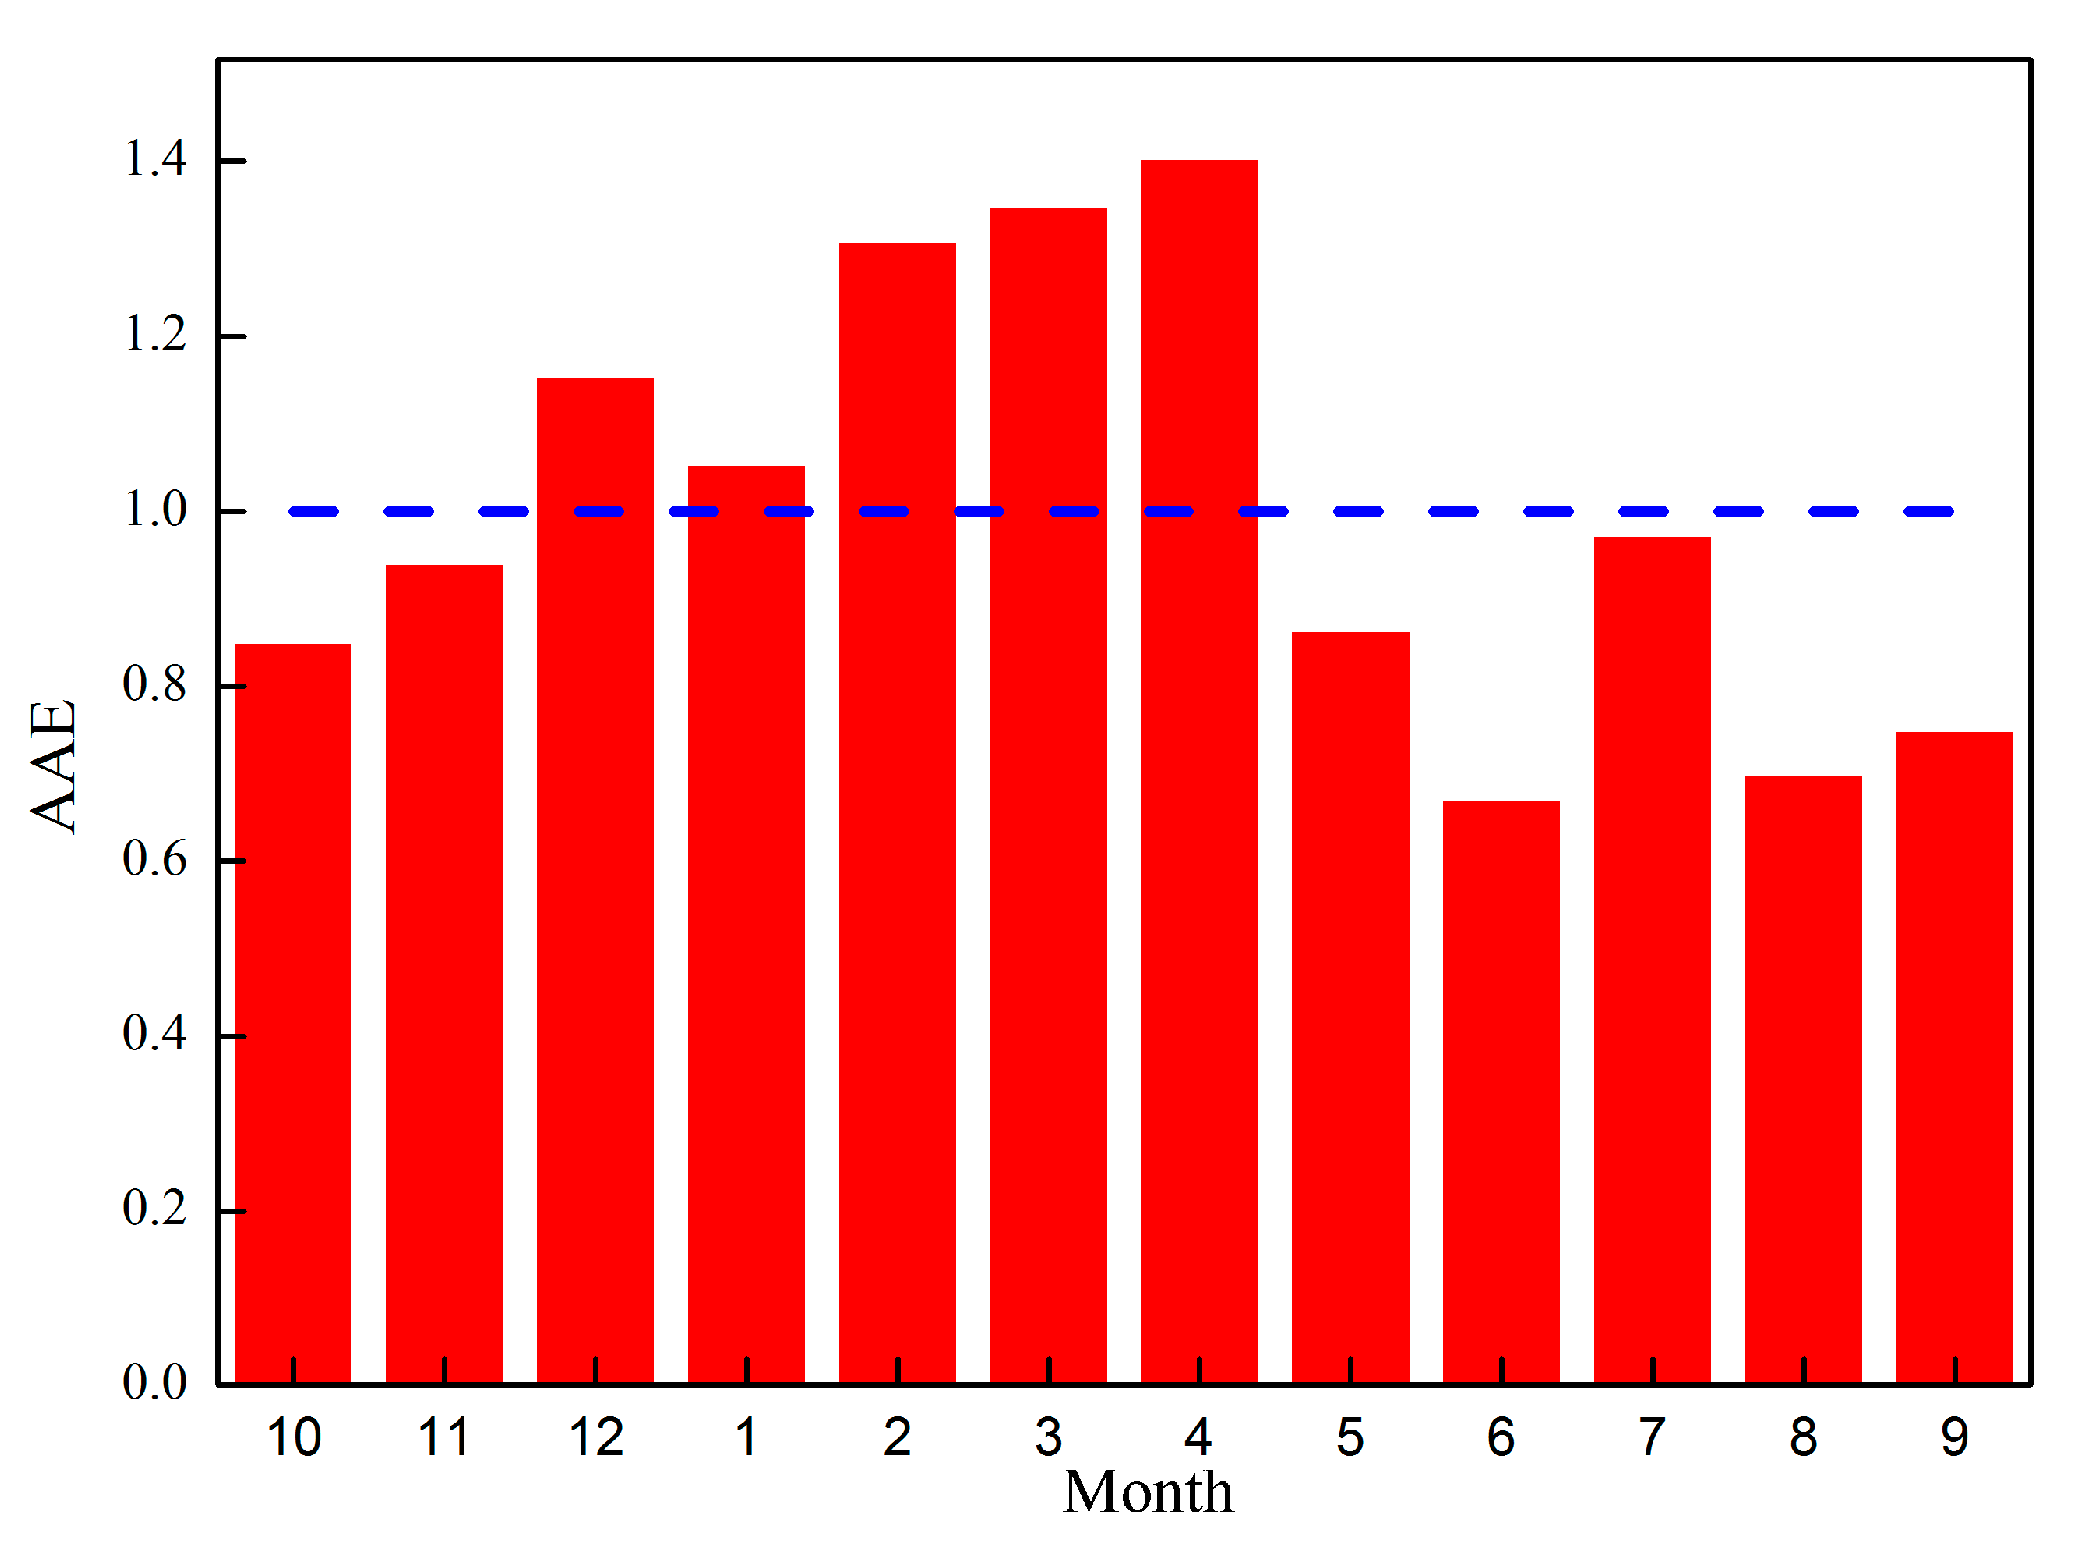
Several previous studies have shown that AAE can be used to distinguish between aerosols originating from fossil fuel and biomass fuel combustion [32,44,45]. Monthly average AAEs, calculated for the atmosphere at Nam Co, are shown in Figure 7. The AAEs restricted between 470 nm and 660 nm ranged from 0.67 to 1.4, with an average of 1. The AAEs in summer (0.78) and autumn (0.85) were less than 1, while the AAEs in winter (1.17) and spring (1.27) were higher than 1. The higher AAEs in winter and spring indicated the potential contribution of brown carbon (BrC) by combusting yak manure for heating in Tibet [46].
Several studies have found that aerosols originating from fossil-fuel combustion have a weaker dependence on spectral light absorption, with an average AAE close to 1 [27,47]. Different from fossil-fuel emissions, the AAEs from biomass burning have been reported between 1.5 and 3, and a value of 2 is often considered as a mean [32]. AAE values between 1 and 2 could be indicative of aerosols of mixed sources, that is, fossil and biomass fuels. Therefore, fossil-fuel emissions are the primary source of BC at the NCL, but the contribution of biomass burning and other impurities to BC in winter and spring was higher than that in summer and autumn.

3.4. BC Potential Sources

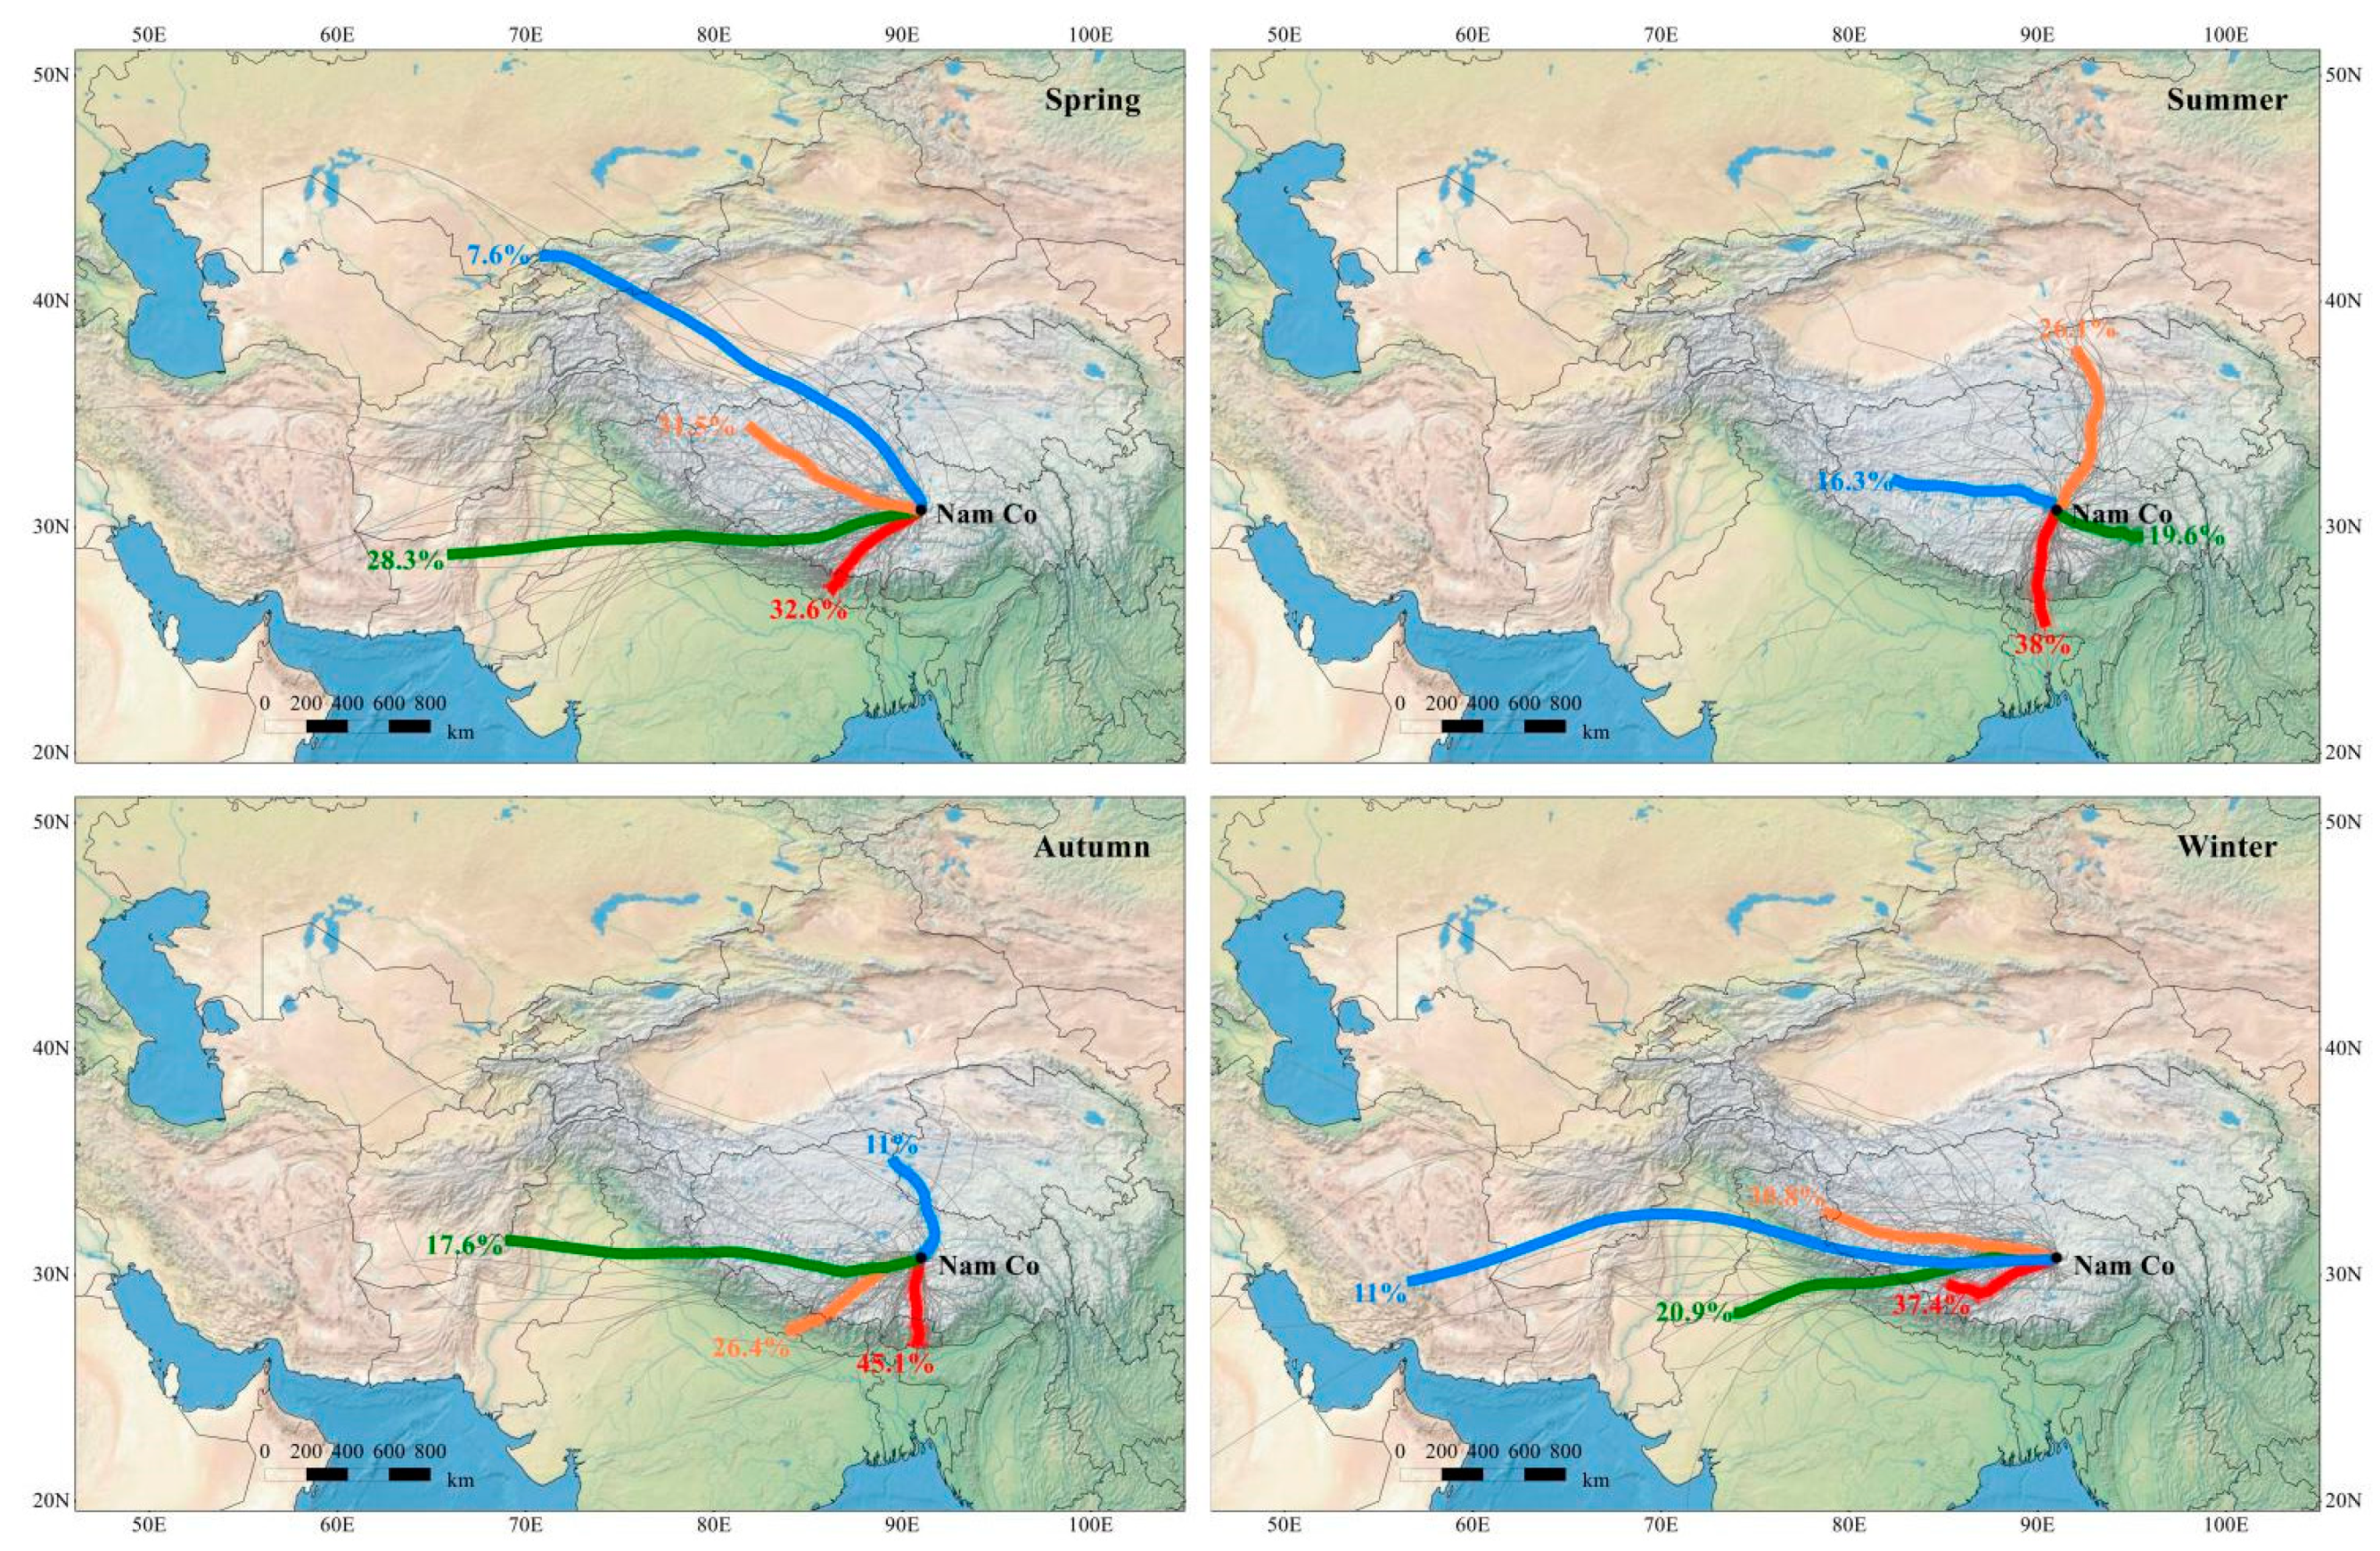
Figure 8 shows that there are four pathways for air masses to arrive at the NCL from their distant sources during the observation period. The cluster analysis suggested that air masses over the sampling site are mostly from Nepal and northern India in spring. Air masses originating in West Asia also accounted for 31.5%, and western Xinjiang and Central Asia accounted for 7.6% of the total trajectories. Air masses were mainly from Nepal in summer, and trajectories from Nepal account for ~38% of the total trajectories, indicating that emissions in South Asia could travel to Nam Co by the Indian monsoon. The NCL was also affected by short-range air masses from the north and east, accounting for 26.1% and 19.6%, respectively. In autumn, the proportion of air masses in Bangladesh, Nepal, and northern India began to increase, reaching 71.5%, and Nam Co was more susceptible to the impact of long-distance air mass transmission in South Asia. In winter, the proportion of western transmission by the westerly circulation began to increase, accounting for 30.8%, only second to southern transmission (37.4%).
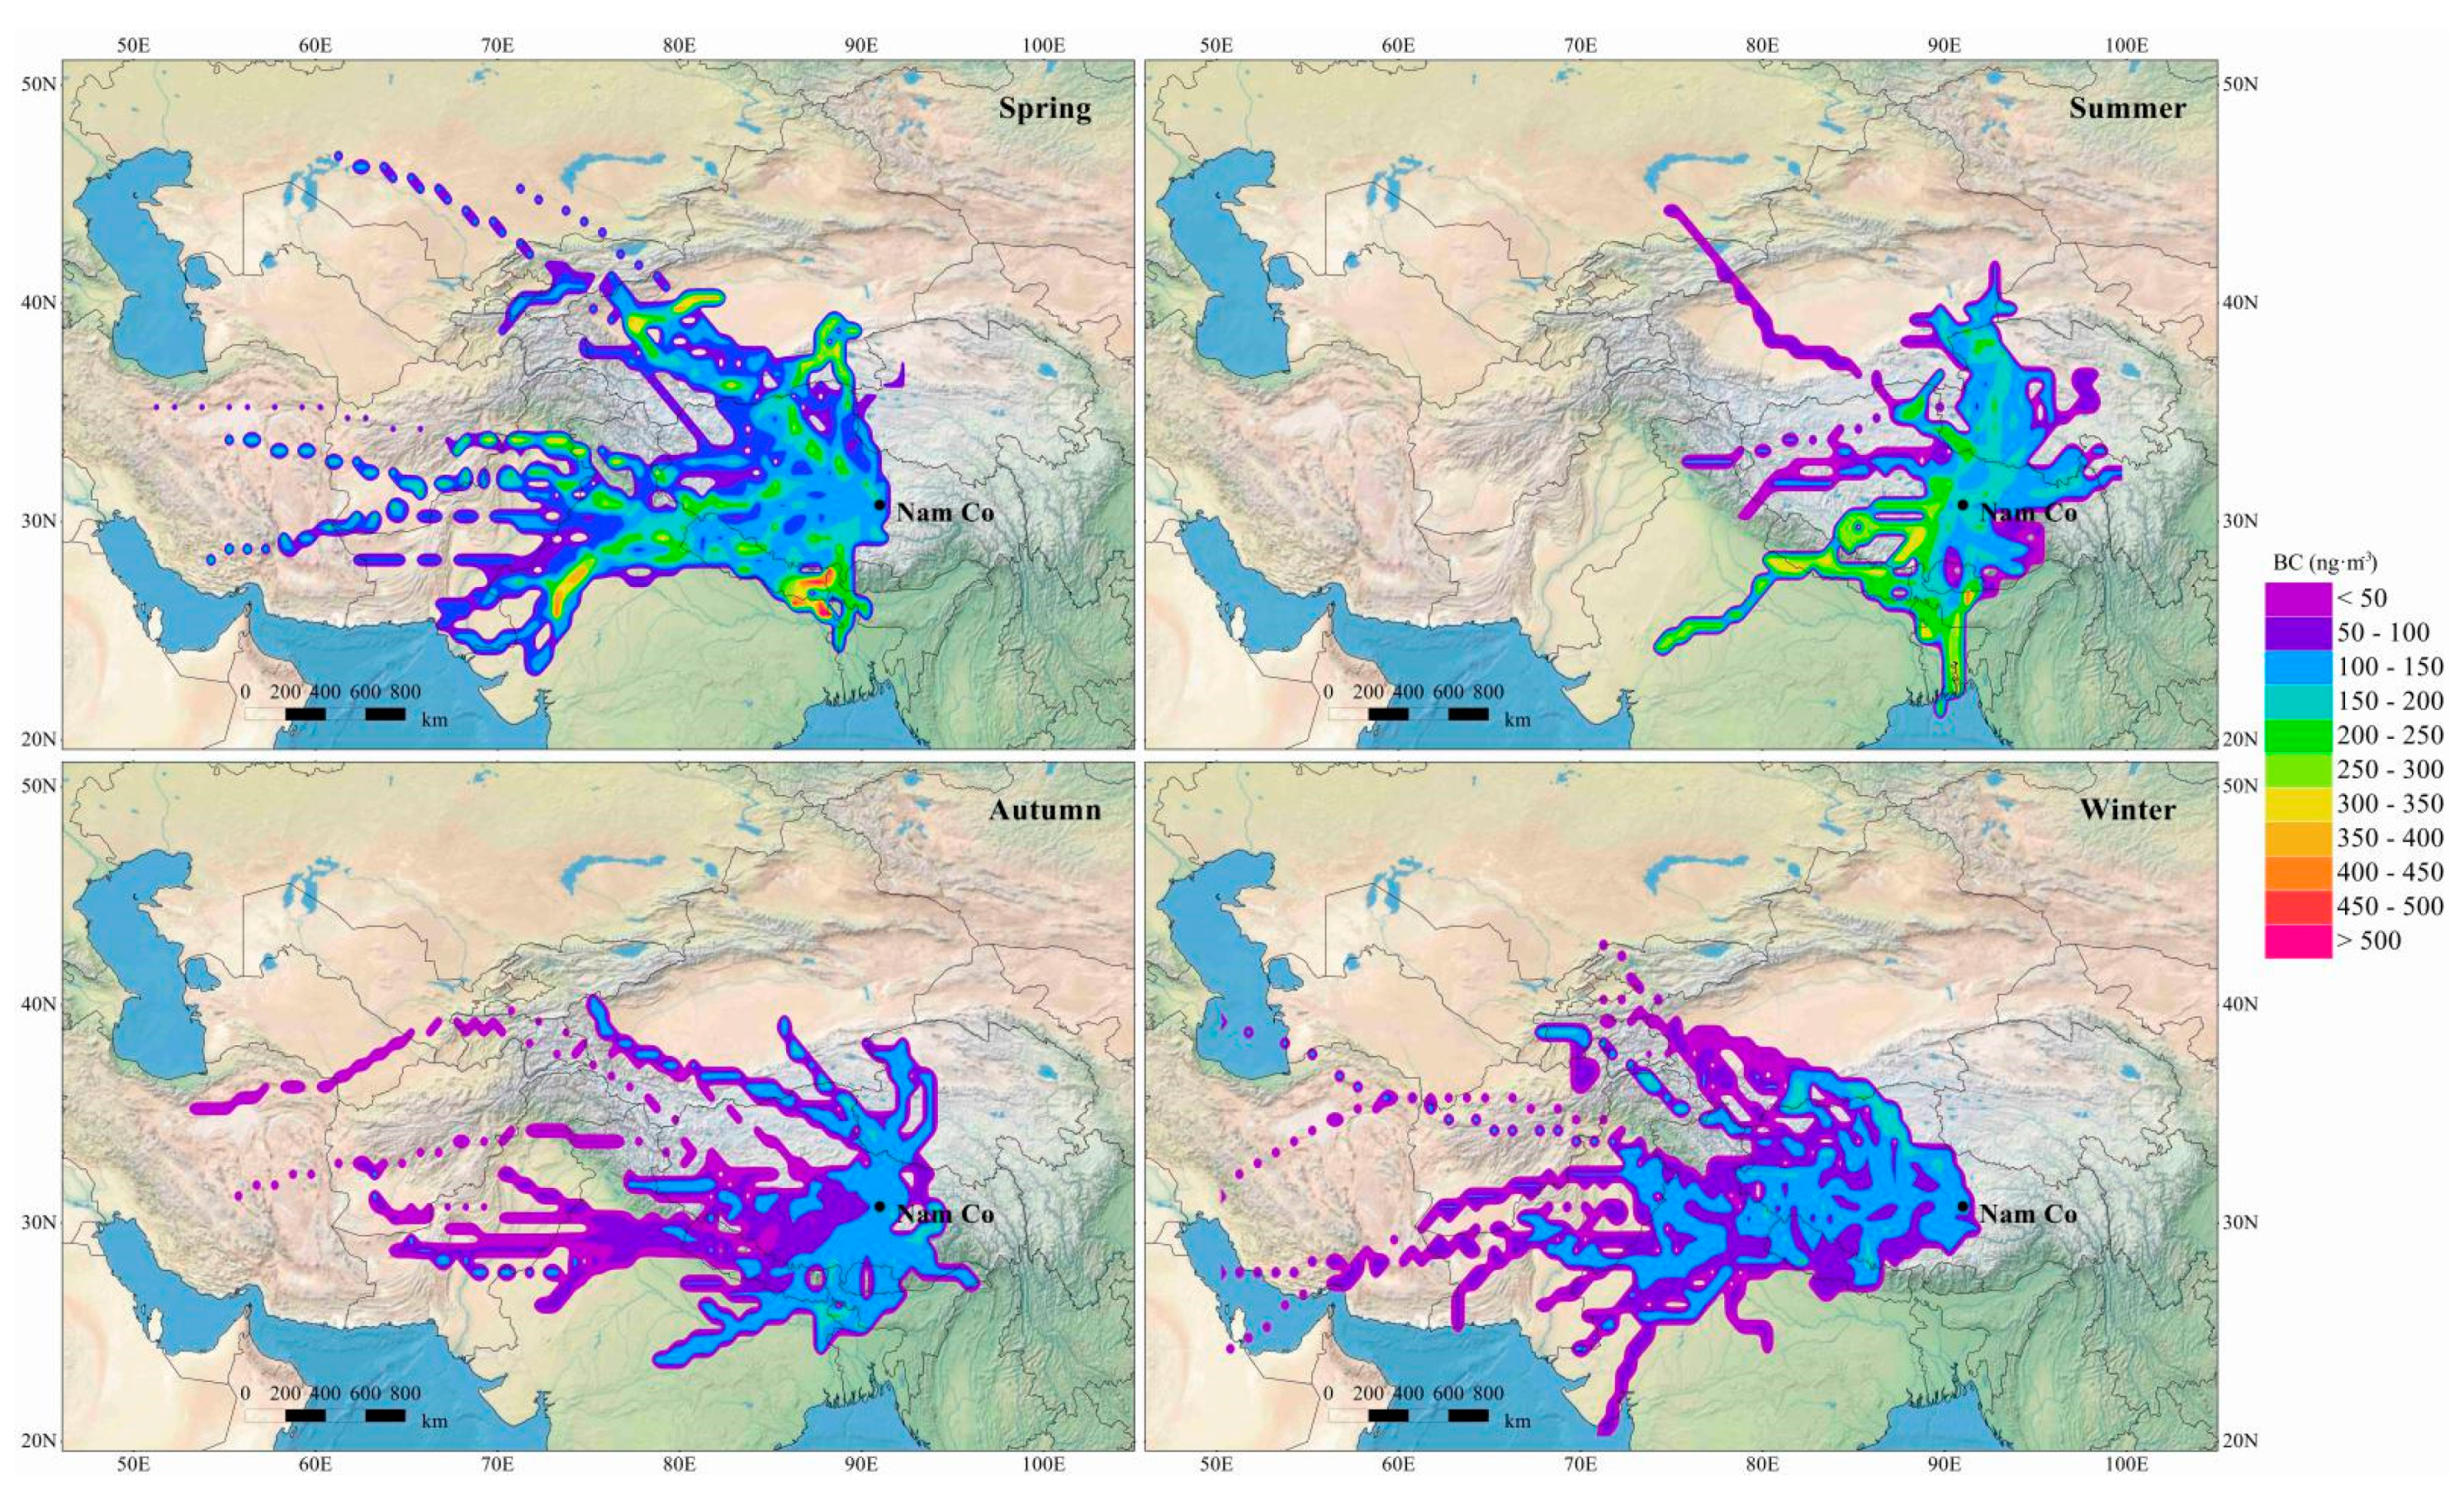
We also calculated and analyzed the potential source areas and their contributions to BC in different seasons. The concentration-weighted trajectory analysis method (CWT) was used here. Figure 9 shows the results of the CWT analysis at Nam Co during the observation period. In spring, higher concentrations of BC were mainly distributed in Nepal, northwestern India, and Central Asia; in summer, higher concentrations were mainly distributed in Nepal, northwestern India, and Central Asia; in autumn and winter, higher concentrations appeared in the surroundings of the NCL due to the weaker background.
The NCL is a clean area with weak pollutant emissions, but it is adjacent to two large BC emission sources in East and South Asia. The NCL area is mainly affected by long-range air masses over the TP and its surrounding areas, and it also inevitably retains the pollution signals caused by human production and living in the surrounding areas (such as South Asia). Studies have found that BC aerosols from South Asia can cross the Himalayas to the inland areas of the TP. If the BC emissions of South Asian are taken into account, they inevitably have a significant impact on BC over the NCL via long-distance transports.

4. Conclusions

BC was measured by a seven-wavelength aethalometer (AE-31) at the Nam Co Lake (NCL), the Tibetan Plateau (TP). The average daily BC concentration was 145 ± 85 ng·m−3. The BC concentrations at the NCL were lower than many remote sites of the TP, reflecting a background level. The diurnal variations of BC showed plateaus from 9:00 to 16:00 (UTC + 8), associated with human activities, such as the indigenous burning of animal waste for heating and tourist traffic. Backward-trajectory analysis and meteorology show that the seasonal variation of BC was both related to sources on the local scale and long-distance transport from adjacent heavily polluted areas, such as South Asia.
We also analyzed the relationship between BC, relative humidity, and air temperature. The higher BC concentrations were more associated with the winds greater than 2 m·s−1, relative humidity between 50% and 60%, and temperatures between –5 °C and 0 °C. This suggests that BC here might absorb water vapor in the function of relative humidity in a relatively dry and cold environment. The precipitations may keep the concentrations of BC low for three days. The absorption coefficient of BC, α(λ)(880 nm), were 50% higher than 1 in spring and summer and slightly lower than 1 in autumn and winter. The difference shows that the fossil-fuel and biofuel emissions of BC dominate the main sources at the NCL in warm and cold seasons, respectively.
With one year of continuous and high-resolution BC data, we conclude that the average concentration of BC at the NCL increased by ~50% compared with the result one decade ago [12]. The local air pollution has been elevated due to intensified human activities, although BC is still reflecting a background level at a remote site. The environment of the Nam Co Lake in the hinterland of the Tibetan Plateau cannot avoid the worsening of this harsh situation. Urgent protection measures are needed to preserve the local environment from the administration level.

Author Contributions

F.W. collected the data and drafted the manuscript. X.Z., X.Y., and M.S. helped collect data and plot figures. G.Z. helped to draft the manuscript. J.M. conceived and oversaw the work and sophisticated the manuscript. All authors have read and agreed to the published version of the manuscript.

Funding

This work is supported by the Strategic Priority Research Program of the Chinese Academy of Sciences (XDA20040501, XDA2006020103), the National Natural Science Foundation of China (41721091), the Second Tibetan Plateau Scientific Expedition and Research (STEP) Program (grant no. 2019QZKK0201) and the State Key Laboratory of Cryospheric Science (SKLCS-ZZ-2019).

Acknowledgments

We thank the staff working at the Nam Co Observatory, Chinese Academy of Sciences for helping to collect data. We also gratefully thank the reviewers for their constructive comments.

Conflicts of Interest

The authors declare no conflict of interest.

References

  1. Ramanathan, V.; Ramana, M.V.; Roberts, G.; Kim, H.; Corrigan, C.; Chung, C.; Winker, D. Warming trends in Asia amplified by brown cloud solar absorption. Nature 2007, 448, 575–578. [Google Scholar] [CrossRef] [PubMed]
  2. Ramanathan, V.; Carmichael, G. Global and regional climate changes due to black carbon. Nat. Geosci. 2008, 1, 221–227. [Google Scholar] [CrossRef]
  3. Bond, T.C.; Doherty, S.; Fahey, D.; Forster, P.M.; Berntsen, T.; DeAngelo, B.J.; Flanner, M.G.; Ghan, S.; Kärcher, B.; Koch, D.; et al. Bounding the role of black carbon in the climate system: A scientific assessment. J. Geophys. Res. Atmos. 2013, 118, 5380–5552. [Google Scholar] [CrossRef]
  4. Ming, J.; Wang, Y.; Du, Z.; Zhang, T.; Guo, W.; Xiao, C.; Xu, X.; Ding, M.; Zhang, D.; Yang, W. Widespread Albedo Decreasing and Induced Melting of Himalayan Snow and Ice in the Early 21st Century. PLoS ONE 2015, 10, e0126235. [Google Scholar] [CrossRef] [PubMed] [Green Version]
  5. Ming, J.; Xiao, C.; Wang, F.; Li, Z.; Li, Y. Grey Tienshan Urumqi Glacier No.1 and light-absorbing impurities. Environ. Sci. Pollut. Res. 2016, 23, 9549–9558. [Google Scholar] [CrossRef] [Green Version]
  6. Mordukhovich, I.; Wilker, E.; Suh, H.H.; Wright, R.; Sparrow, D.; Vokonas, P.S.; Schwartz, J. Black Carbon Exposure, Oxidative Stress Genes, and Blood Pressure in a Repeated-Measures Study. Environ. Heal. Perspect. 2009, 117, 1767–1772. [Google Scholar] [CrossRef]
  7. Lu, Z.; Streets, D.G.; Zhang, Q.; Wang, S. A novel back-trajectory analysis of the origin of black carbon transported to the Himalayas and Tibetan Plateau during 1996–2010. Geophys. Res. Lett. 2012, 39. [Google Scholar] [CrossRef] [Green Version]
  8. Zhao, S.; Ming, J.; Sun, J.; Xiao, C. Observation of carbonaceous aerosols during 2006–2009 in Nyainqêntanglha Mountains and the implications for glaciers. Environ. Sci. Pollut. Res. 2013, 20, 5827–5838. [Google Scholar] [CrossRef]
  9. Zhang, X.; Ming, J.; Li, Z.; Wang, F.; Zhang, G. The online measured black carbon aerosol and source orientations in the Nam Co region, Tibet. Environ. Sci. Pollut. Res. 2017, 24, 25021–25033. [Google Scholar] [CrossRef] [Green Version]
  10. Zhu, C.-S.; Cao, J.; Ho, K.F.; Chen, L.-W.A.; Huang, R.-J.; Wang, Y.-C.; Li, H.; Shen, Z.; Chow, J.C.; Watson, J.; et al. The optical properties of urban aerosol in northern China: A case study at Xi’an. Atmos. Res. 2015, 160, 59–67. [Google Scholar] [CrossRef]
  11. Tang, J.; Wen, Y.; Zhou, L.; Qi, D.; Zheng, M. Observational study of black carbon in clean air area of western China. Q. J. Appl. Meteorol. 1999, 10, 33–43. [Google Scholar]
  12. Ming, J.; Xiao, C.; Sun, J.; Kang, S.; Bonasoni, P. Carbonaceous particles in the atmosphere and precipitation of the Nam Co region, central Tibet. J. Environ. Sci. 2010, 22, 1748–1756. [Google Scholar] [CrossRef]
  13. Wan, X.; Kang, S.; Wang, Y.; Xin, J.; Liu, B.; Guo, Y.; Wen, T.; Zhang, G.; Cong, Z. Size distribution of carbonaceous aerosols at a high-altitude site on the central Tibetan Plateau (Nam Co Station, 4730 m asl). Atmos. Res. 2015, 153, 155–164. [Google Scholar] [CrossRef]
  14. Li, C.; Bosch, C.; Kang, S.; Andersson, A.; Chen, P.; Zhang, Q.; Cong, Z.; Chen, B.; Qin, D.; Örjan, G. Sources of black carbon to the Himalayan–Tibetan Plateau glaciers. Nat. Commun. 2016, 7, 12574. [Google Scholar] [CrossRef] [PubMed]
  15. Song, S.; Wu, Y.; Xu, J.; Ohara, T.; Hasegawa, S.; Li, J.; Yang, L.; Hao, J. Black carbon at a roadside site in Beijing: Temporal variations and relationships with carbon monoxide and particle number size distribution. Atmos. Environ. 2013, 77, 213–221. [Google Scholar] [CrossRef]
  16. Zhang, X.; Rao, R.; Huang, Y.; Mao, M.; Berg, M.J.; Sun, W. Black carbon aerosols in urban central China. J. Quant. Spectrosc. Radiat. Transf. 2015, 150, 3–11. [Google Scholar] [CrossRef]
  17. Zhao, S.; Tie, X.; Cao, J.; Li, N.; Li, G.; Zhang, Q.; Zhu, C.; Long, X.; Li, J.; Feng, T.; et al. Seasonal variation and four-year trend of black carbon in the Mid-west China: The analysis of the ambient measurement and WRF-Chem modeling. Atmos. Environ. 2015, 123, 430–439. [Google Scholar] [CrossRef]
  18. Hansen, A.; Rosen, H.; Novakov, T. The aethalometer—An instrument for the real-time measurement of optical absorption by aerosol particles. Sci. Total Environ. 1984, 36, 191–196. [Google Scholar] [CrossRef] [Green Version]
  19. Petzold, A.; Ogren, J.; Fiebig, M.; Laj, P.; Li, S.-M.; Baltensperger, U.; Popp, T.; Kinne, S.; Pappalardo, G.; Sugimoto, N.; et al. Recommendations for reporting “black carbon” measurements. Atmos. Chem. Phys. 2013, 13, 8365–8379. [Google Scholar] [CrossRef] [Green Version]
  20. Hansen, A.D.A.; Novakov, T. Real-Time Measurement of Aerosol Black Carbon During the Carbonaceous Species Methods Comparison Study. Aerosol Sci. Technol. 1990, 12, 194–199. [Google Scholar] [CrossRef]
  21. Hagler, G.; Yelverton, T.L.; Vedantham, R.; Hansen, A.D.; Turner, J.R. Post-processing Method to Reduce Noise while Preserving High Time Resolution in Aethalometer Real-time Black Carbon Data. Aerosol Air Qual. Res. 2011, 11, 539–546. [Google Scholar] [CrossRef] [Green Version]
  22. Park, S.; Hansen, A.D.; Cho, S.Y. Measurement of real time black carbon for investigating spot loading effects of Aethalometer data. Atmos. Environ. 2010, 44, 1449–1455. [Google Scholar] [CrossRef]
  23. Cheng, Y.-H.; Lin, M.-H. Real-Time Performance of the microAeth® AE51 and the Effects of Aerosol Loading on Its Measurement Results at a Traffic Site. Aerosol Air Qual. Res. 2013, 13, 1853–1863. [Google Scholar] [CrossRef] [Green Version]
  24. Coen, M.C.; Weingartner, E.; Apituley, A.; Ceburnis, D.; Fierz-Schmidhauser, R.; Flentje, H.; Henzing, B.; Jennings, S.G.; Moerman, M.; Petzold, A.; et al. Minimizing light absorption measurement artifacts of the Aethalometer: Evaluation of five correction algorithms. Atmos. Meas. Tech. 2010, 3, 457–474. [Google Scholar] [CrossRef] [Green Version]
  25. Weingartner, E.; Saathoff, H.; Schnaiter, M.; Streit, N.; Bitnar, B.; Baltensperger, U. Absorption of light by soot particles: Determination of the absorption coefficient by means of aethalometers. J. Aerosol Sci. 2003, 34, 1445–1463. [Google Scholar] [CrossRef]
  26. Ajtai, T.; Kiss-Albert, G.; Utry, N.; Tóth, A.; Hoffer, A.; Szabó, G.; Bozóki, Z. Diurnal variation of aethalometer correction factors and optical absorption assessment of nucleation events using multi-wavelength photoacoustic spectroscopy. J. Environ. Sci. 2019, 83, 96–109. [Google Scholar] [CrossRef]
  27. Sandradewi, J.; Prévôt, A.S.H.; Szidat, S.; Perron, N.; Alfarra, M.R.; Lanz, V.A.; Weingartner, E.; Baltensperger, U. Using Aerosol Light Absorption Measurements for the Quantitative Determination of Wood Burning and Traffic Emission Contributions to Particulate Matter. Environ. Sci. Technol. 2008, 42, 3316–3323. [Google Scholar] [CrossRef] [PubMed]
  28. Ajtai, T.; Utry, N.; Pintér, M.; Major, B.; Bozoki, Z.; Szabó, G. A method for segregating the optical absorption properties and the mass concentration of winter time urban aerosol. Atmos. Environ. 2015, 122, 313–320. [Google Scholar] [CrossRef]
  29. Pintér, M.; Ajtai, T.; Kiss-Albert, G.; Kiss, D.; Utry, N.; Janovszky, P.; Palásti, D.; Smausz, T.; Kohut, A.; Hopp, B.; et al. Thermo-optical properties of residential coals and combustion aerosols. Atmos. Environ. 2018, 178, 118–128. [Google Scholar] [CrossRef]
  30. Martinsson, J.; Eriksson, A.C.; Nielsen, I.E.; Malmborg, V.B.; Ahlberg, E.; Andersen, C.; Lindgren, R.; Nyström, R.; Nordin, E.Z.; Brune, W.H.; et al. Impacts of Combustion Conditions and Photochemical Processing on the Light Absorption of Biomass Combustion Aerosol. Environ. Sci. Technol. 2015, 49, 14663–14671. [Google Scholar] [CrossRef] [PubMed]
  31. Yan, C.; Zheng, M.; Bosch, C.; Andersson, A.; Desyaterik, Y.; Sullivan, A.P.; Collett, J.; Zhao, B.; Wang, S.; He, K.; et al. Important fossil source contribution to brown carbon in Beijing during winter. Sci. Rep. 2017, 7, 43182. [Google Scholar] [CrossRef]
  32. Kirchstetter, T.W.; Novakov, T.; Hobbs, P.V. Evidence that the spectral dependence of light absorption by aerosols is affected by organic carbon. J. Geophys. Res. Space Phys. 2004, 109. [Google Scholar] [CrossRef] [Green Version]
  33. Draxler, R.; Hess, G. An overview of the HYSPLIT_4 modelling system for trajectories, dispersion and deposition. Aust. Meteorol. Mag. 1998, 47, 295–308. [Google Scholar]
  34. Babu, S.S.; Chaubey, J.P.; Moorthy, K.K.; Gogoi, M.M.; Kompalli, S.K.; Sreekanth, V.; Bagare, S.P.; Bhatt, B.C.; Gaur, V.K.; Prabhu, T.; et al. High altitude (∼4520 m amsl) measurements of black carbon aerosols over western trans-Himalayas: Seasonal heterogeneity and source apportionment. J. Geophys. Res. Space Phys. 2011, 116. [Google Scholar] [CrossRef] [Green Version]
  35. Dumka, U.; Moorthy, K.K.; Kumar, R.; Hegde, P.; Sagar, R.; Pant, P.; Singh, N.; Babu, S.S. Characteristics of aerosol black carbon mass concentration over a high altitude location in the Central Himalayas from multi-year measurements. Atmos. Res. 2010, 96, 510–521. [Google Scholar] [CrossRef]
  36. Zhao, S.; Ming, J.; Xiao, C.; Sun, W.; Qin, X. A preliminary study on measurements of black carbon in the atmosphere of northwest Qilian Shan. J. Environ. Sci. 2012, 24, 152–159. [Google Scholar] [CrossRef]
  37. Zhu, C.-S.; Cao, J.; Hu, T.-F.; Shen, Z.; Tie, X.-X.; Huang, H.; Wang, Q.; Huang, R.-J.; Zhao, Z.-Z.; Močnik, G.; et al. Spectral dependence of aerosol light absorption at an urban and a remote site over the Tibetan Plateau. Sci. Total. Environ. 2017, 590, 14–21. [Google Scholar] [CrossRef] [PubMed]
  38. Wang, M.; Xu, B.; Wang, N.; Cao, J.; Tie, X.; Wang, H.; Zhu, C.; Yang, W. Two distinct patterns of seasonal variation of airborne black carbon over Tibetan Plateau. Sci. Total Environ. 2016, 573, 1041–1052. [Google Scholar] [CrossRef] [PubMed] [Green Version]
  39. Zhao, S. The Study on Measurements of Carbonaceous Aerosols in the Atmosphere and Snowpack in the Central Tibet (Nam Co Station) and in the Northeast Margin of the Tibet (Qilian Shan Station). Master’s Thesis, University of Chinese Academy of Sciences, Lanzhou, China, 2012. [Google Scholar]
  40. Cesari, D.; Merico, E.; Dinoi, A.; Marinoni, A.; Bonasoni, P.; Contini, D. Seasonal variability of carbonaceous aerosols in an urban background area in Southern Italy. Atmos. Res. 2018, 200, 97–108. [Google Scholar] [CrossRef]
  41. You, R.; Radney, J.G.; Zachariah, M.R.; Zangmeister, C.D. Measured Wavelength-Dependent Absorption Enhancement of Internally Mixed Black Carbon with Absorbing and Nonabsorbing Materials. Environ. Sci. Technol. 2016, 50, 7982–7990. [Google Scholar] [CrossRef] [Green Version]
  42. Linke, C.; Möhler, O.; Veres, A.; Mohácsi, Á.; Bozoki, Z.; Szabó, G.; Schnaiter, M. Optical properties and mineralogical composition of different Saharan mineral dust samples: A laboratory study. Atmos. Chem. Phys. 2006, 6, 3315–3323. [Google Scholar] [CrossRef] [Green Version]
  43. Utry, N.; Ajtai, T.; Pintér, M.; Tombácz, E.; Illés, E.; Bozoki, Z.; Szabó, G. Mass-specific optical absorption coefficients and imaginary part of the complex refractive indices of mineral dust components measured by a multi-wavelength photoacoustic spectrometer. Atmos. Meas. Tech. 2015, 8, 401–410. [Google Scholar] [CrossRef] [Green Version]
  44. Chakrabarty, R.K.; Moosmüller, H.; Chen, L.-W.A.; Lewis, K.; Arnott, W.P.; Mazzoleni, C.; Dubey, M.K.; Wold, C.E.; Hao, W.M.; Kreidenweis, S.M. Brown carbon in tar balls from smoldering biomass combustion. Atmos. Chem. Phys. 2010, 10, 6363–6370. [Google Scholar] [CrossRef] [Green Version]
  45. Praveen, P.S.; Ahmed, T.; Kar, A.; Rehman, I.H.; Ramanathan, V. Link between local scale BC emissions in the Indo-Gangetic Plains and large scale atmospheric solar absorption. Atmos. Chem. Phys. Discuss. 2012, 12, 1173–1187. [Google Scholar] [CrossRef] [Green Version]
  46. Chung, C.E.; Kim, S.-W.; Lee, M.; Yoon, S.-C.; Lee, S. Carbonaceous aerosol AAE inferred from in-situ aerosol measurements at the Gosan ABC super site, and the implications for brown carbon aerosol. Atmos. Chem. Phys. 2012, 12, 6173–6184. [Google Scholar] [CrossRef] [Green Version]
  47. Russell, P.B.; Bergstrom, R.W.; Shinozuka, Y.; Clarke, A.D.; Decarlo, P.F.; Jimenez, J.L.; Livingston, J.M.; Redemann, J.; Dubovik, O.; Strawa, A. Absorption Angstrom Exponent in AERONET and related data as an indicator of aerosol composition. Atmos. Chem. Phys. 2010, 10, 1155–1169. [Google Scholar] [CrossRef] [Green Version]
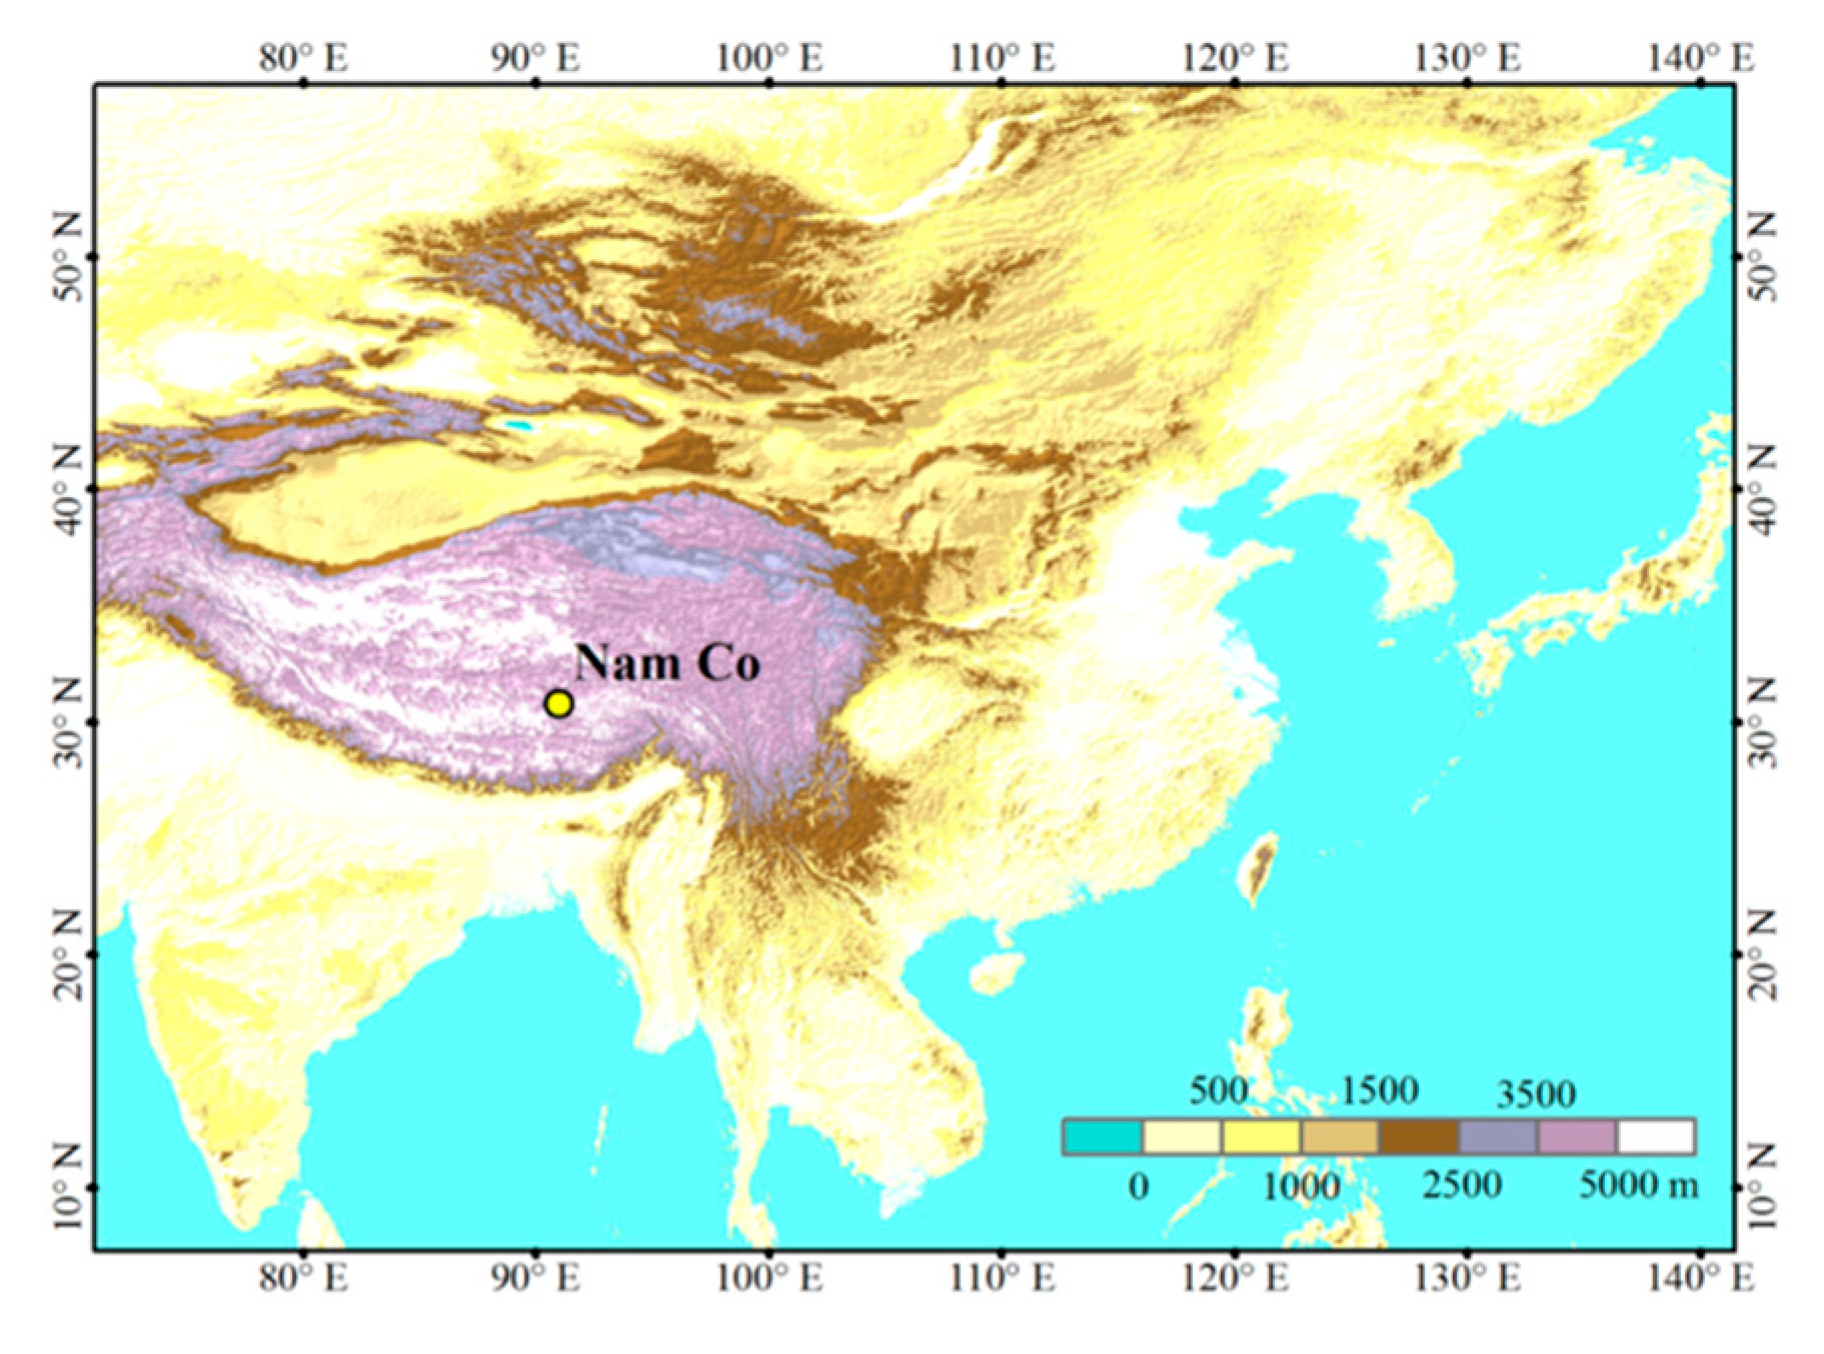
Figure 1. Measurement site and the surrounding areas.
Atmosphere 11 00624 g001
Figure 2. Elementary meteorological observations at the Nam Co Lake (NCL) Station from May 2015 to April 2016, including air temperature, relative humidity, wind speeds, and precipitation.
Atmosphere 11 00624 g002
Figure 3. The temporal variation of BC on daily basis vertically, and hourly basis horizontally, including hourly and monthly averaged BC on the top and right panes, respectively, during May 2015 to April 2016.
Atmosphere 11 00624 g003
Figure 4. The relationship of average BC concentration and winds during the study period.
Atmosphere 11 00624 g004
Figure 5. The variation of daily-averaged BC and rainfall during the study period, where the red line is the LOESS fit of the BC. The magnified frame shows the typical suppressing effect of precipitation on the concentrations of BC.
Atmosphere 11 00624 g005
Figure 6. The relationship of BC concentration, temperature, and relative humidity.
Atmosphere 11 00624 g006
Figure 7. The monthly variation of AAEs, restricted between 470 nm and 660 nm during the study period.
Atmosphere 11 00624 g007
Figure 8. Cluster-mean 5-day backward air-mass trajectories calculated by the HYSPLIT model, including the percentages of each cluster trajectory during spring, summer, autumn, and winter.
Atmosphere 11 00624 g008
Figure 9. Seasonal distribution of concentration-weighted trajectory (CWT) of BC.
Atmosphere 11 00624 g009
Table 1. BC concentration with aethalometer in some remote region over the Tibetan Plateau.
LocationPeriodAethalometerBC (ng·m−3)Reference
Nam CoMay 2015–April 2016AE-31145 ± 85This study
WaliguanJuly 1994–December 1995AE-10130–300[11]
Qilian ShanMay 2009–March 2011AE-3118–72[36]
Muztagh AtaNovember 2009–September 2010AE-16133[37]
RanwuNovember 2012–June 2013AE-31276[38]
BeiluheNovember 2012–June 2013AE-31413[38]