Article

Simulation of Climate Change Impacts on Phenology and Production of Winter Wheat in Northwestern China Using CERES-Wheat Model

1
Research Center of Fluid Machinery Engineering and Technology, Jiangsu University, ZhenJiang 212013, China
2
Key Laboratory for Agricultural Soil and Water Engineering in Arid Area of Ministry of Education, Northwest A&F University, Yangling 712100, China
3
Institute of Water Saving Agriculture in Arid Areas of China (IWSA), Northwest A&F University, Yangling 712100, China
4
Zhenjiang Engineering Survey & Design Institute Co., Ltd., Zhenjiang 212013, China
*
Author to whom correspondence should be addressed.
Atmosphere 2020, 11(7), 681; https://doi.org/10.3390/atmos11070681
Submission received: 8 May 2020 / Revised: 22 June 2020 / Accepted: 23 June 2020 / Published: 28 June 2020
(This article belongs to the Special Issue Plant Adaptation to Global Climate Change)

Abstract

:
Wheat plays a very important role in China’s agriculture. The wheat grain yields are affected by the growing period that is determined by temperature, precipitation, and field management, such as planting date and cultivar species. Here, we used the CSM-CERES-Wheat model along with different Representative Concentration Pathways (RCPs) and two global circulation models (GCMs) to simulate different impacts on the winter wheat that caused by changing climate for 2025 and 2050 projections for Guanzhong Plain in Northwest China. Our results showed that it is obvious that there is a warming trend in Guanzhong Plain; the mean temperature for the different scenarios increased up to 3.8 °C. Furthermore, the precipitation varied in the year; in general, the rainfall in February and August was increased, while it decreased in April, October and November. However, the solar radiation was found to be greatly reduced in the Guanzhong Plain. Compared to the reference year, the results showed that the number of days to maturity was shortened 3–24 days, and the main reason was the increased temperature during the winter wheat growing period. Moreover, five planting dates (from October 7 to 27 with five days per step) were applied to simulate the final yield and to select an appropriate planting date for the study area. The yield changed smallest based on Geophysical Fluid Dynamics Laboratory (GFDL)-CM3 (−6.5, −5.3, −4.2 based on RCP 4.5, RCP 6.0, and RCP 8.5) for 2025 when planting on October 27. Farmers might have to plant the crop before 27 October.

1. Introduction

The growing wheat (Triticum aestivum L.) in China makes up 21.9% of the whole crop area sown in 2011, leading to China producing the highest wheat grain yield in the world [1,2]. However, wheat production is facing future changes in rainfall patterns, temperature conditions, and other factors that restrict farmers’ ability to plant this crop. Thus, the whole world, including China, is paying attention to the risk of wheat production [3,4,5]. Previous studies have shown that wheat productivity will be vulnerable to climate change in southeastern Asia and southern China [6,7,8]. Thus, the appropriate strategies should be analyzed for adoption by policymakers and farmers.
In 30 or 50 years, the world will change in an unimaginable way and it is difficult to imagine how the future climate will be changed and how the crops respond to those climate changes, which results in many uncertainties in these studies [9,10,11]. Therefore, determining the possibile future changes in climate may affect the wheat yield, therefore finding strategies to adapt to ensure the continuation of the wheat supply are necessary. Combining the outputs of GCMs under different RCPs with the models is an active way to learn the effects of changed climate on crops yield [12,13,14,15]. At present, crop models have been proved the ability to provide useful views into the design of decision making in the agricultural management by simulating how cropping systems respond to climate change, management, and variety selection [16,17,18,19]. One of their advantages is that they can deal with crop responses for climate changes, i.e., drought, waterlogging, high temperatures, atmospheric CO2 concentration changes and precipitation [20,21,22]. Therefore, many studies have attempted to investigate how the future climate will affect wheat growing under different scenarios by using crop models [23,24,25].
Generally, the projected changes in final production have quite a wide range, depending on the crop simulation models, GCMs, and RCP scenarios that were selected. SimCLIM has been used with a large number of crop simulations [26,27]. For example, SimCLIM was used in Georgia, USA to study the response of soybean phenology, development and yield to the changing climate coupled with the CSM-CROPGRO-Soybean model [28,29], and it also has been applied to project the climate variability and its impact on cotton production in southern Punjab, Pakistan [29]. Moreover, SimCLIM has provided an easier way to learn climatic factors for different fields such as agriculture [30] and ecosystem resilience [31]. The CSM-CERES-Wheat model could analyze the influence of soil, field management (like irrigation, fertilization, planting date, cultivar) as well as climate on crop growth and grain yield [32,33,34]. The model can simulate wheat development, water balance, phosphorous, nitrogen balance, and aboveground biomass and grain yield in relation to weather, soil, phenotype factors and management practices [35,36,37].
In this research, we studied the future climate change in the two future projections of 2025 and 2050 compared with the baseline period (1961–1990), and the response of winter wheat production to it and compared with the reference years (19834–2013). The greenhouse gas CO2 emissions of three RCPs were considered. The CERES-Wheat model was applied to study crop yield simulation in cooperation with the GCM climate. The main goals of this analysis were: (1) to identify the future climate change in Guanzhong Plain, (2) to study the future climate change impacts on winter wheat phenology and productivity in this region, and (3) to provide suggestions for potential adaptation strategies for winter wheat growth in Guanzhong Plain.

2. Materials and Methods

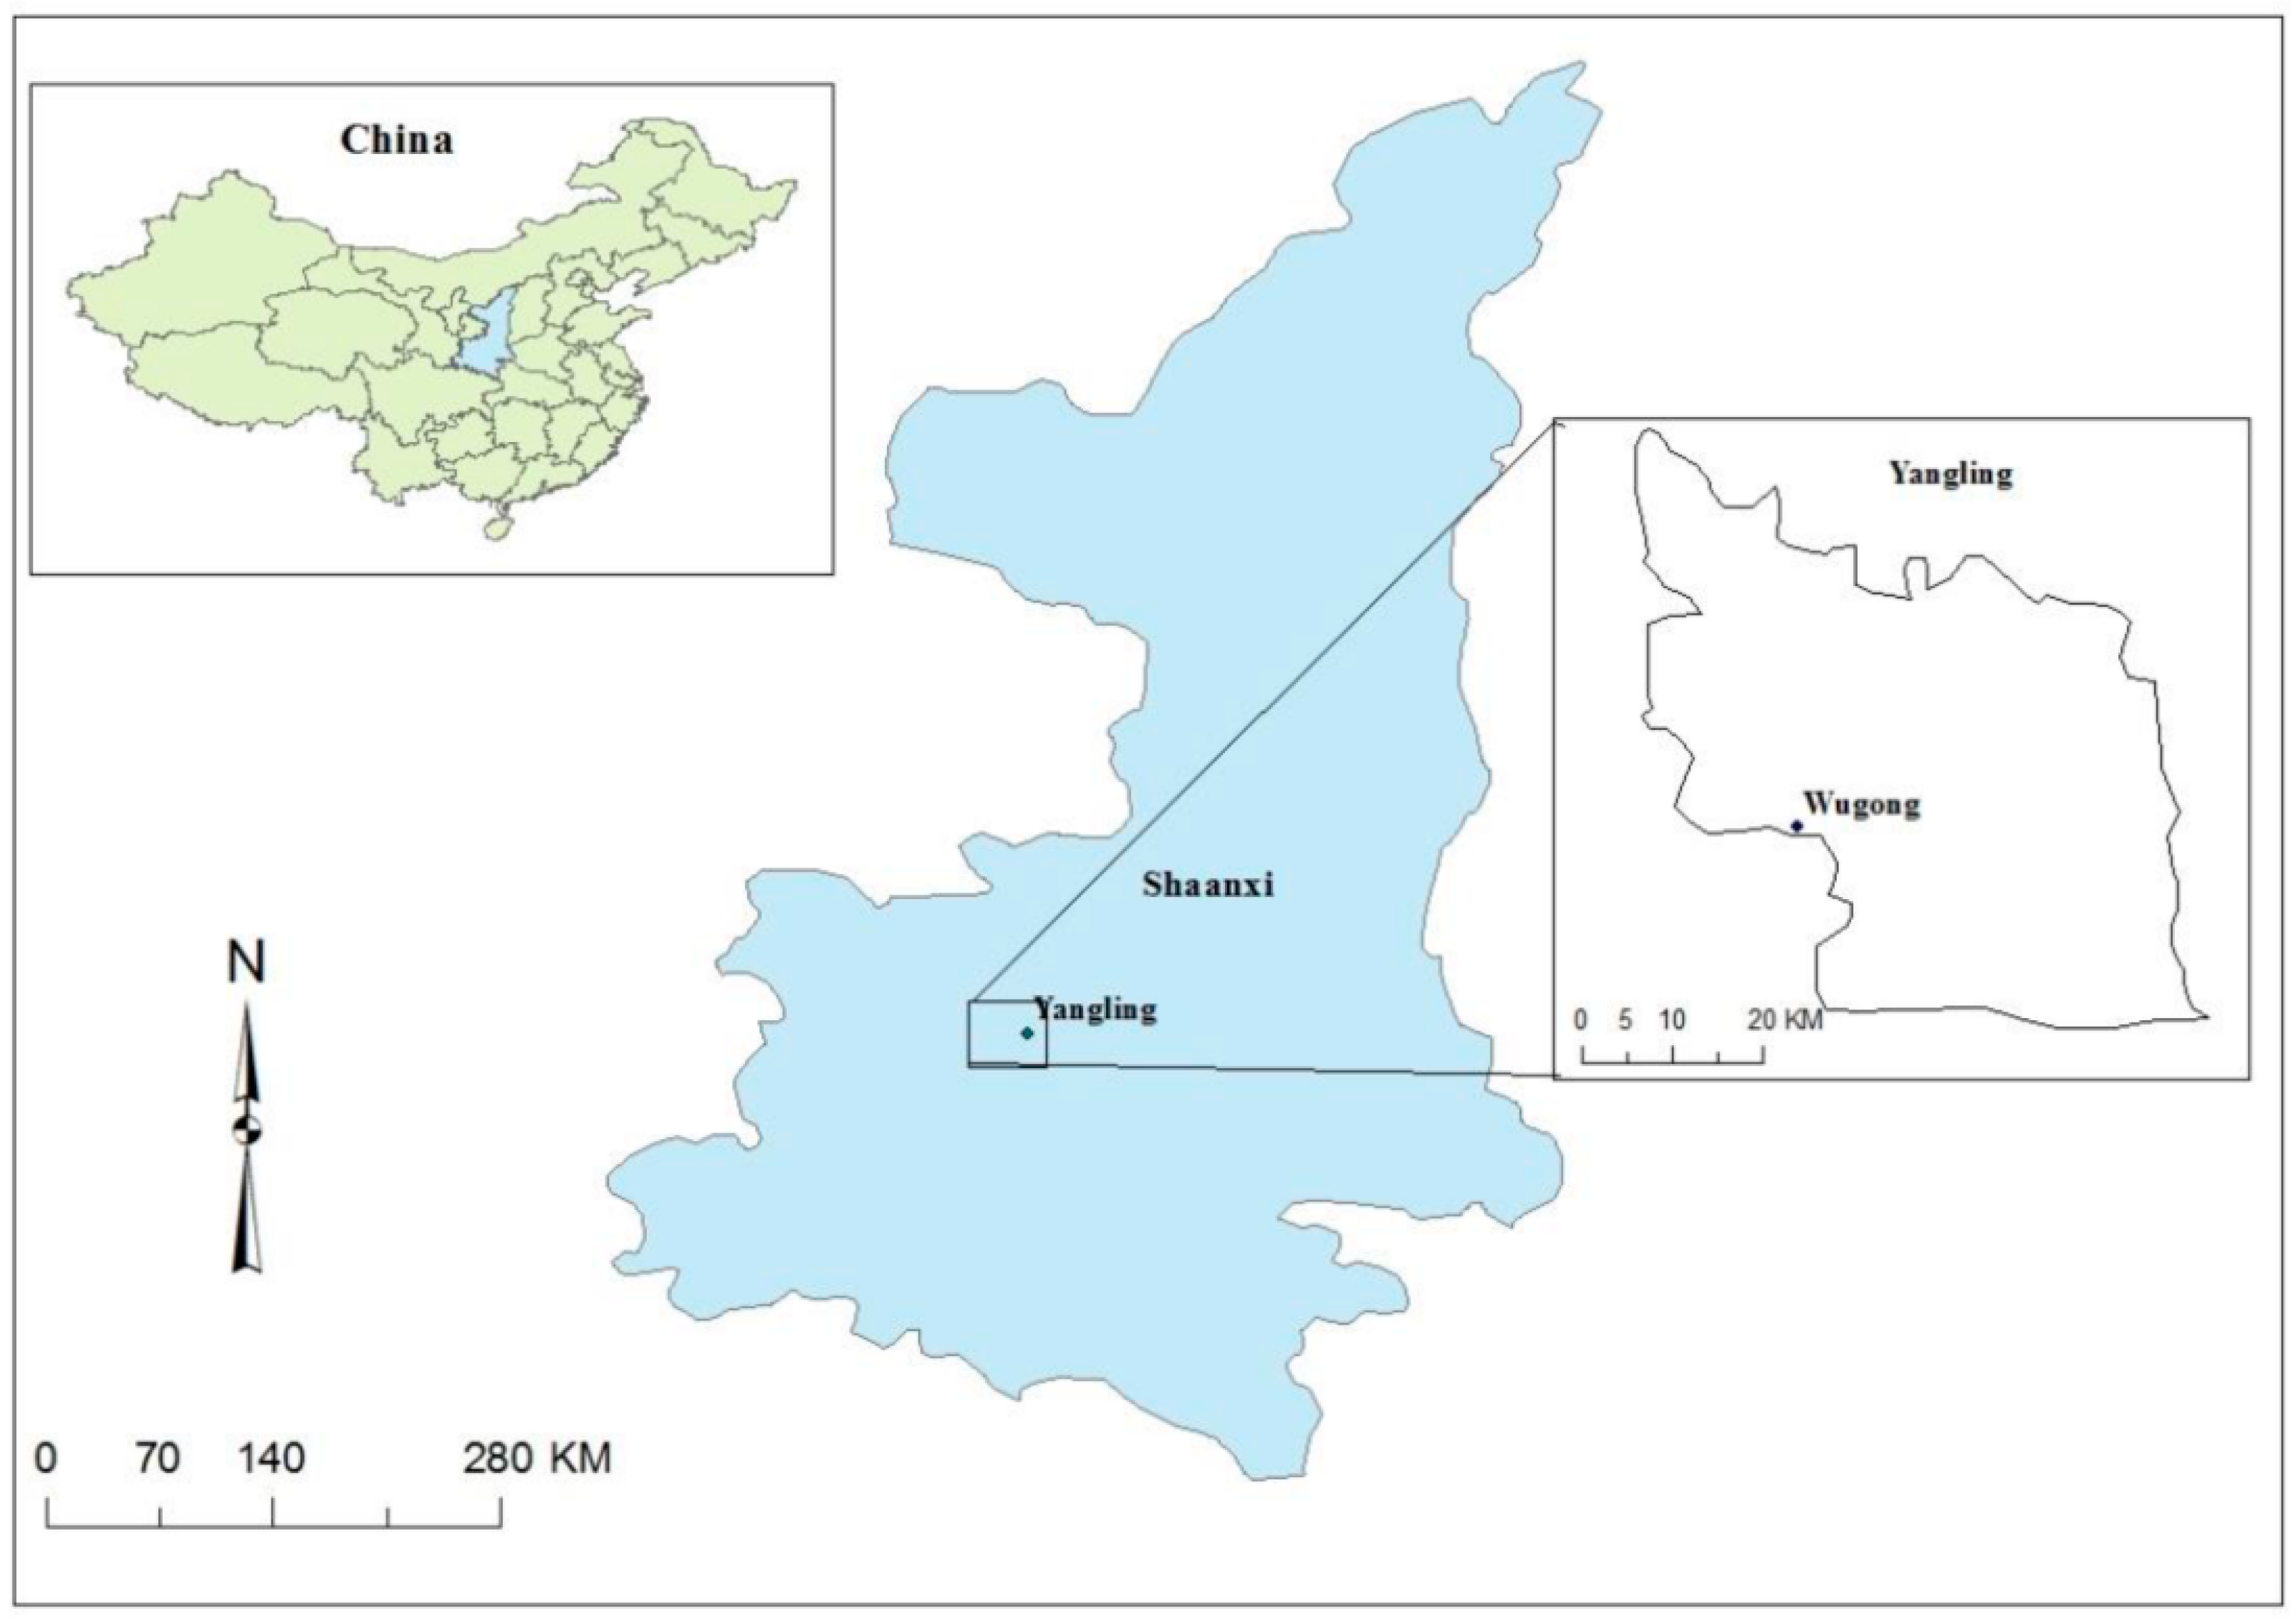
2.1. Study Location and Crop Management

Yangling, an arid area of Guanhzong Plain, China (34.38° N, 107.15° E), was selected as a case study (Figure 1) [38]. Guanzhong Plain, located in the southestern China, a winter wheat-summer corn double cropping system was applied in this area. The cultivar “Xiaoyan 22” was selected as the planting cultivar with the recommendation of local farmers. The data of growth and yield for “Xiaoyan 22” were validated with different irrigation levels by the CERES-Wheat model; the details were provided by Zheng et al. [39]. Previous results showed that the validated model could simulate winter wheat phenology, total biomass and final yield greatly, with a lower normalized root mean square error (RMSEn). However, the RMSEn was a bit high when simulating aboveground biomass in the treatments that had water stress. With the RMSEn less than 2% for phenology, 15% for total biomass, and 15% for the yield. The genetic coefficient for “Xiaoyan 22” is shown in Table 1.
Further detailed information about basic field conditions and management strategies was pursued by Zheng et al. [40]. The soil parameters are listed in Table 2, and the initial conditions of soil used in the simulation are shown in Table 3. The sowing density was 340 plants m−2, and 130 kg ha−1 N was applied on the planting date and wintering time, independently. The simulation was set as a rainfed condition.

2.2. Climate Models

The SimCLIM [41] as initially developed to enable integrated estimate of future climate on different regions in New Zealand [42,43]. SimCLIM 2013 [44] mainly relies on the IPCC CMIP5 datasets. Generally, 1986 to 2005 was used as the baseline period for the SimCLIM 2013; the previous standard 1961 to 1990 can also be used. Thus, we used 1961–1990 as the baseline period and chose 1984–2013 as the reference year in our study. The climate projections from ranged from 1991 to 2100 around the world.

2.3. Yield Simulation with the Crop Model

Here, DSSAT Version 4.6 [35,36,37] was used to simulate the wheat phenology, as well as the winter wheat grain yield for 2025 and 2050 projections. The inputs of daily weather data for simulations from future projections were modified from SimCLIM based on the reference years weather. The daily weather inputs included sunshine hours, rainfall, and maximum and minimum temperatures. These data for the reference time 1984–2013 and baseline 1961–1990 at the study area were downloaded from the China Meteorological Data Service Center (CMDC) [45]. The RCPs (RCP 2.6, RCP 4.5, RCP 6.0, and RCP 8.5) are named after a possible range of radiative forcing values in the year 2100 (of 2.6, 4.5, 6.0, and 8.5 W/m2, respectively) [46]. Three scenarios (RCP 4.5, RCP 6.0, and RCP 8.5) were selected in this study. RCP 6.0 represents the median value of medium climate prediction sensitivity, while RCPs 4.5 and 8.5 with low and high climate sensitivity, respectively. Furthermore, two GCM models (GFDL-CM3 and MRI-CGCM3) were selected from SimCLIM; both of these GCMs provided all the climate variables including temperature, precipitation, SRAD, wind speed, relative humidity, and sea level. These two GCMs can project future climate change accurately, so their prediction for future temperature, SRAD and rainfall have been accepted [28,47]. The present average planting date was around October 15 in the study area. Five planting dates, about 10 days in advance of and 10 days after (October 7, 12, 17, 22 and 27), were set to simulate the anthesis date, maturity date, and yield in the 2025 and 2050 projections. The simulated phenology and final yield in projections 2025 and 2050 were compared with 1984–2013.

3. Results

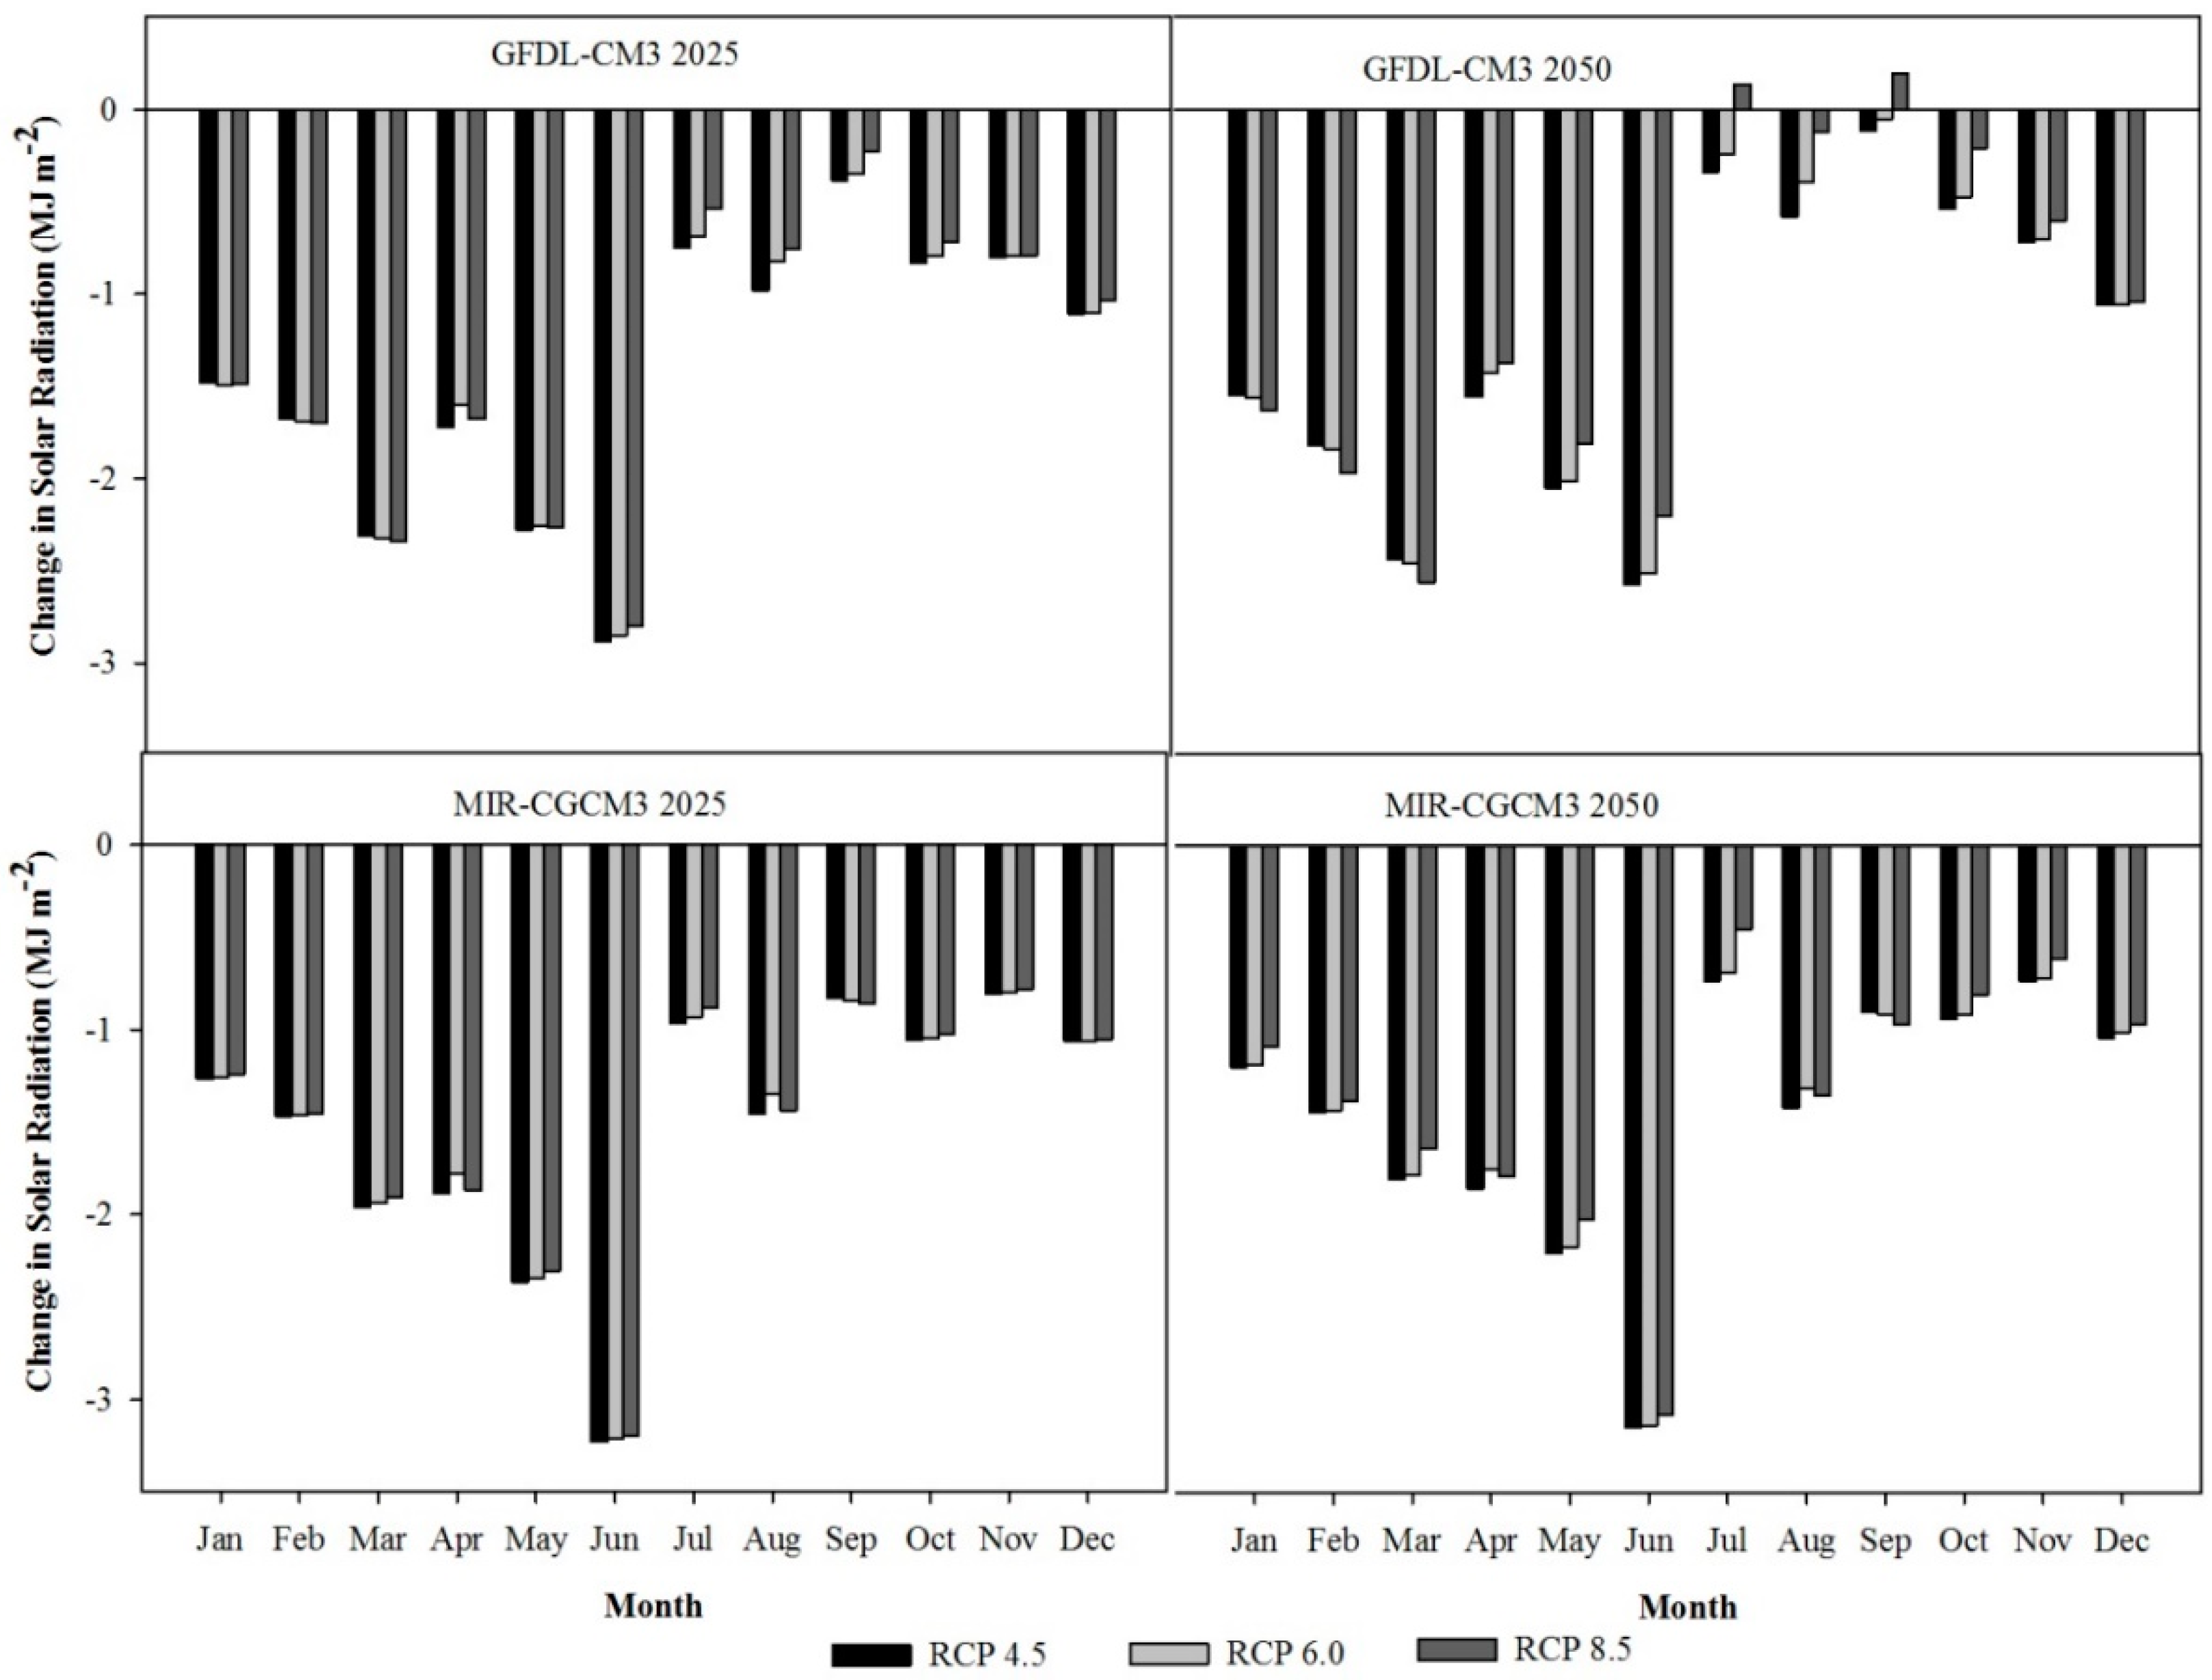
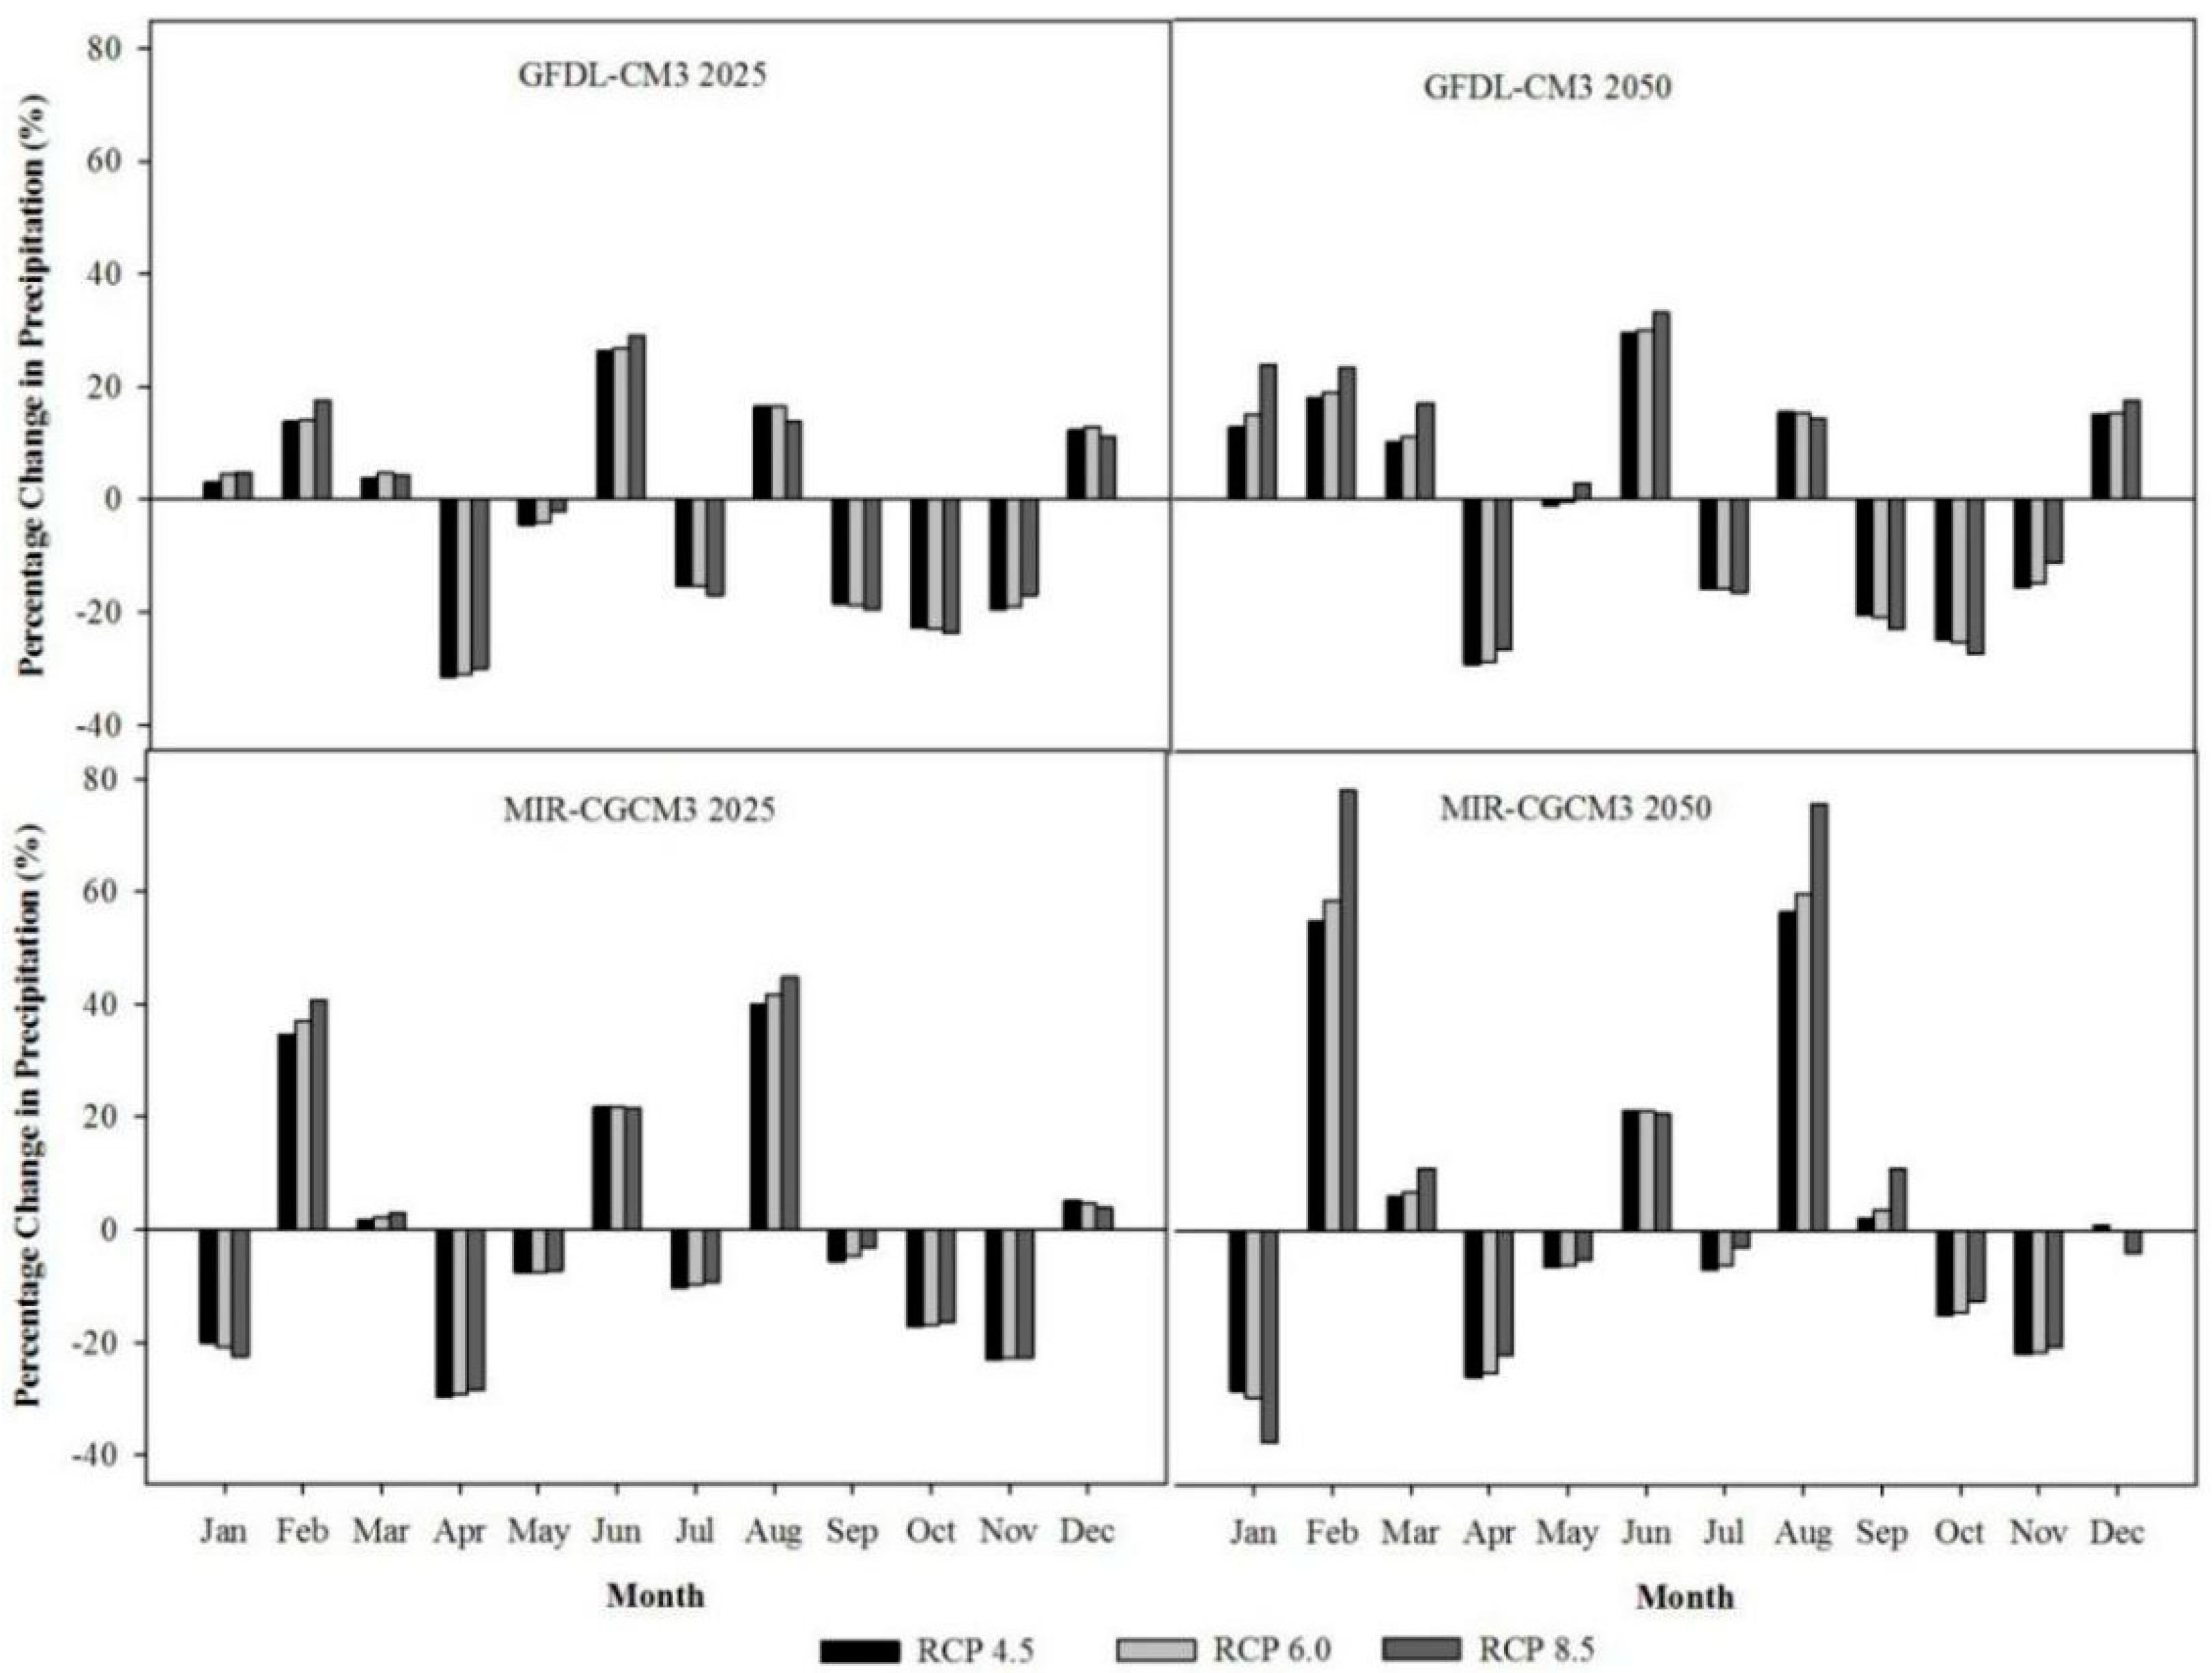
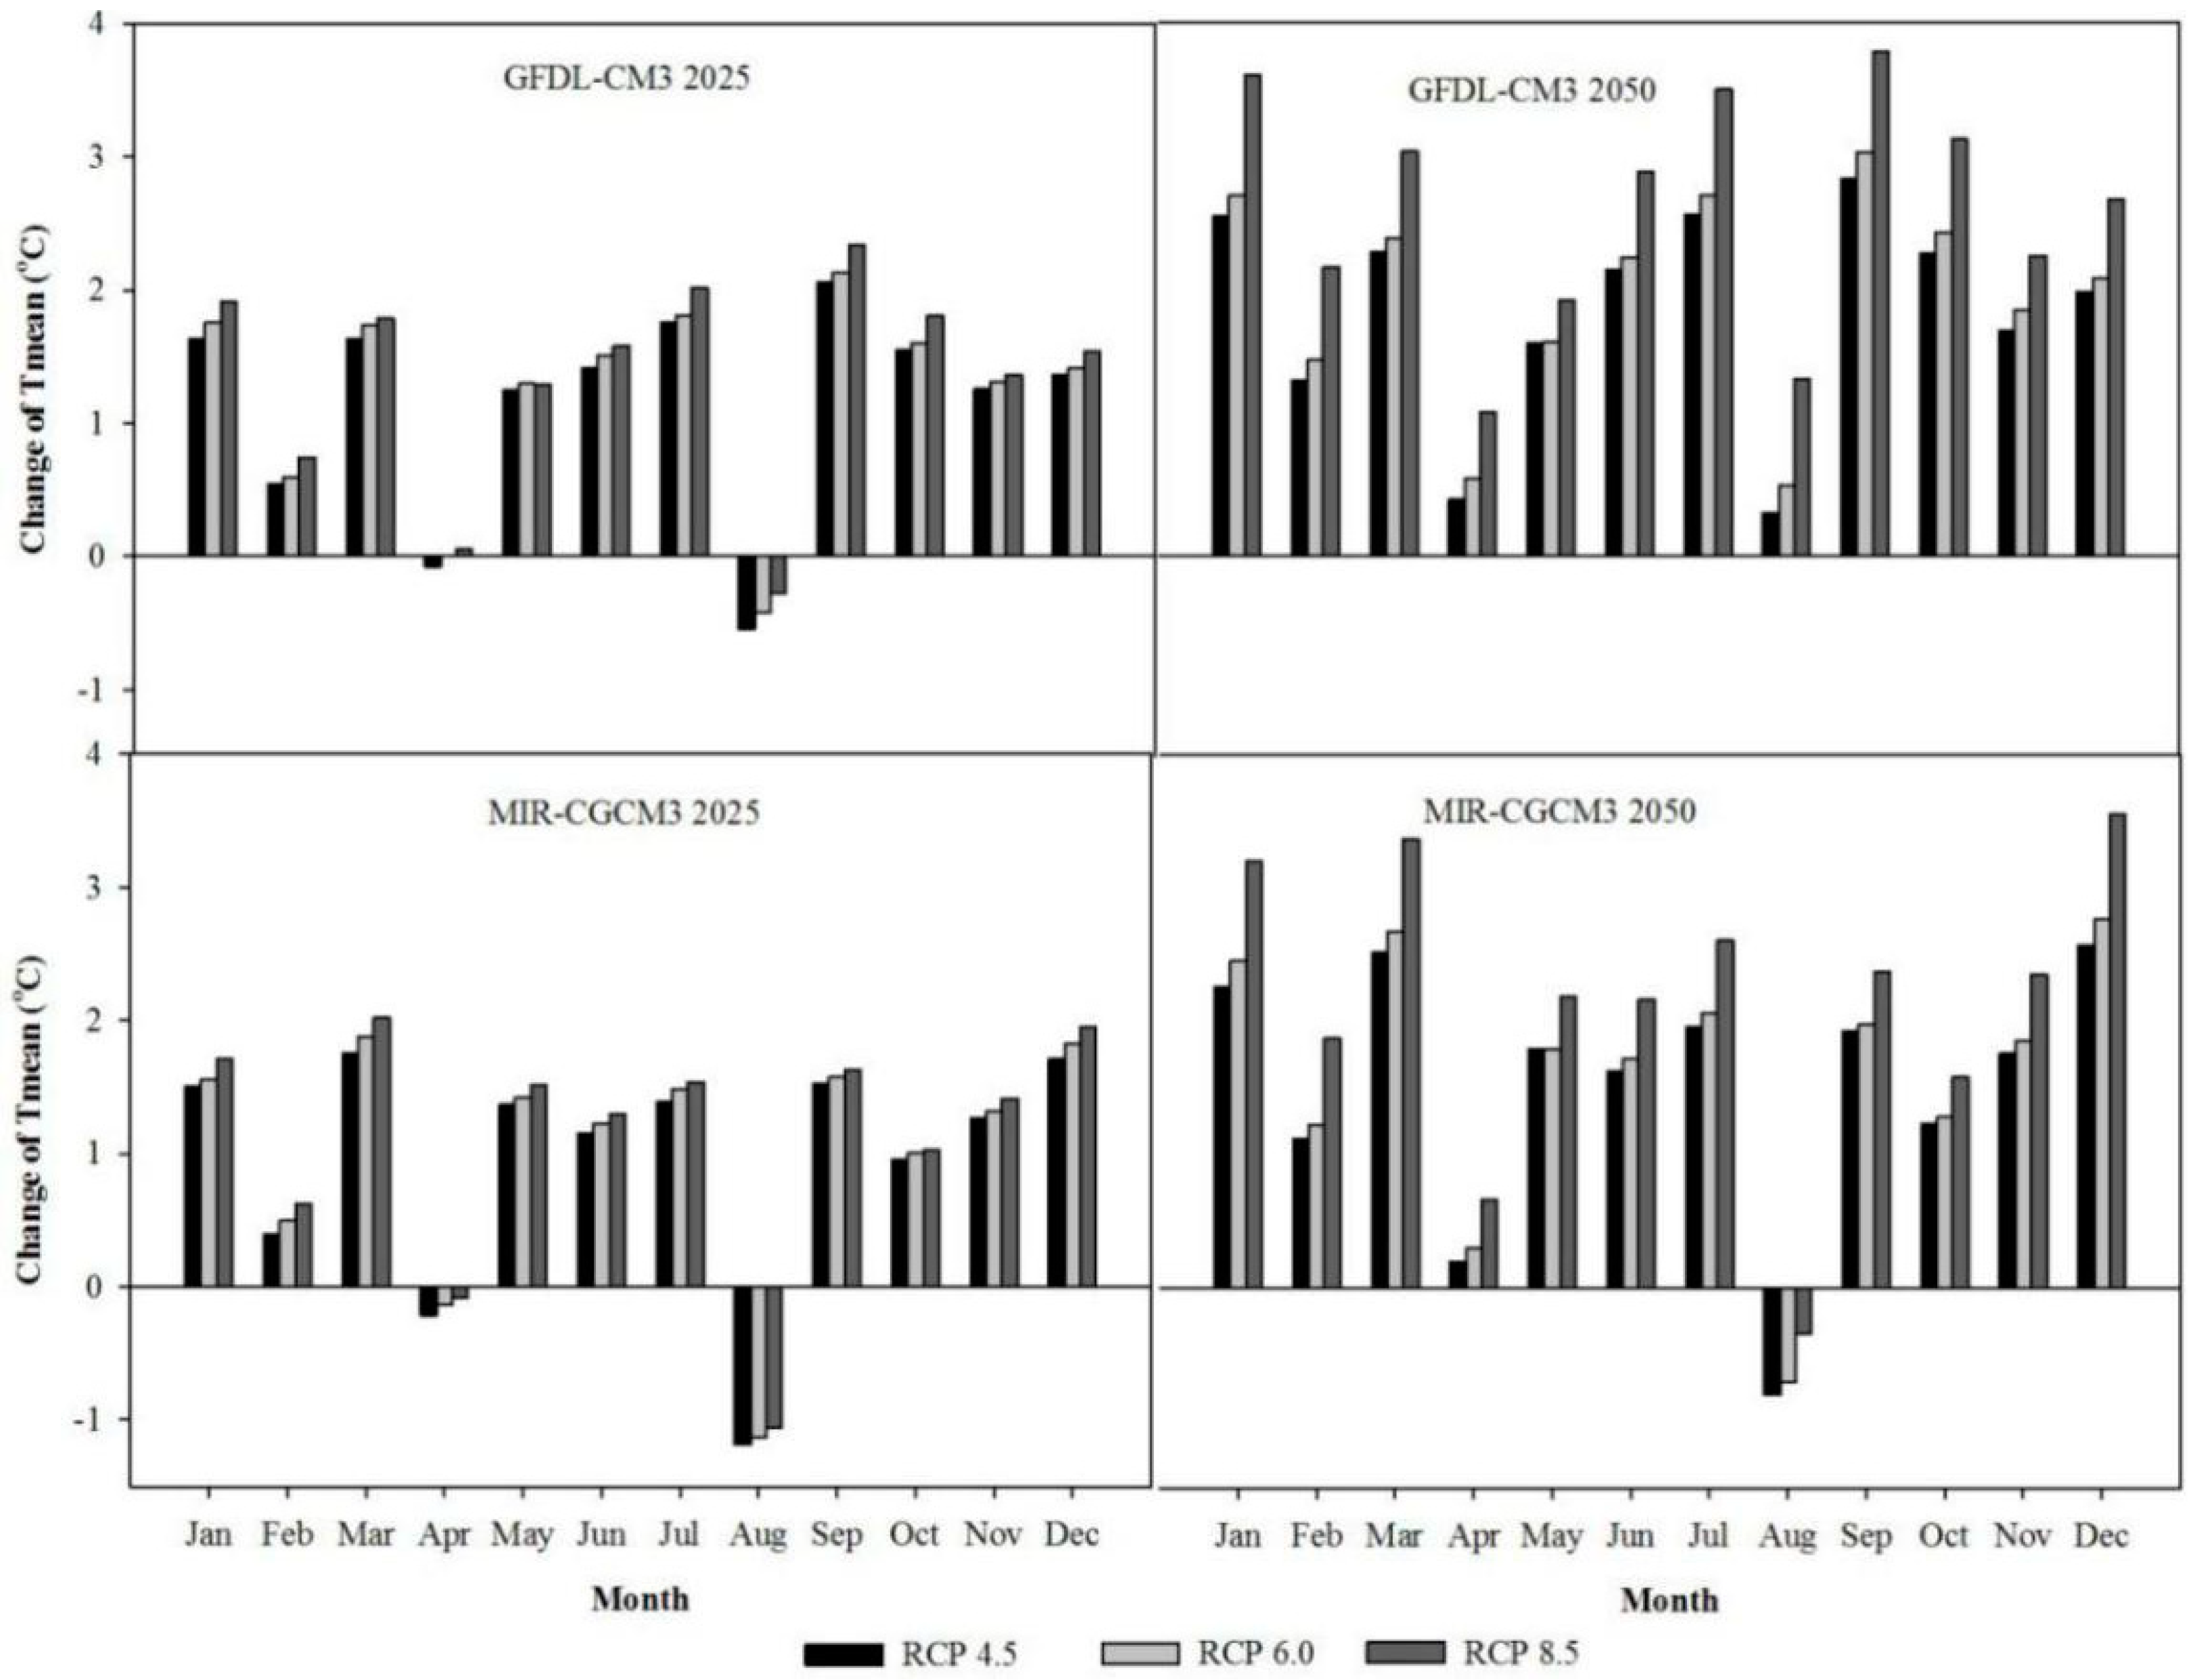
3.1. Climate Projections for 2025 and 2050

The predicted monthly change of solar radiation (SRAD) (Figure 2), percentage of precipitation (Figure 3) and mean temperature (Tmean) (Figure 4) for 2025 and 2050 were modified with SimCLIM based on two GCMs (i.e., GFDL and MRI) and three RCPs. The mean daily radiation for 1961–1990 in the study area was 15.2 MJ m−2; the results showed that the average SRAD decreased for all three RCPs compared with the baseline. The SRAD showed difference by year and month for the GFDL model for the future projections in 2025 and 2050. The predicted SRAD change (based on GFDL) as 2025 was the same for the given months compared to 2050 projection, with a slight decreasing trend in January, February, and March and a slight increasing trend in the rest of the months. Among the three RCPs, the projection for SRAD for 2025 only showed a slight difference, but the differences among the three scenarios in 2050 were greater than in 2025. The predicted trends for the change in solar radiation based on MRI were similar to GFDL, and the differences among the three scenarios were smaller than the GFDL.
The average yearly rainfall for 1961–1990 at the experiment site was 623.5 mm. Projected rainfall showed a difference between two GCMs, with one GCM simulating an increase in rainfall and another projecting a decrease (Figure 3). Projected rainfall usually increased in February, June, August, while it decreased in April, July, October, and November compared with the baseline. The rainfall was projected to increase by 13–40% for February and 1.5–5% for March for the 2025 projection. The differences among RCPs were no more than 3% for 2025. While the yearly difference, between the projections of 2025 and 2050, was larger based on MIR compared with GFDL; it was approximately 61% between 2025 and 2050.
The average daily Tmean for 1961–1990 at the study area was 13.9 °C. Figure 4 shows changes in Tmean projected by two GCMs and three RCPs compared with the baseline. Overall, the Tmean had an increasing trend in the 2025 and 2050 projections. The mean temperature increases were 1.2, 2.1, 1.0 and 1.8 °C for the GFDL 2025, GFDL 2050, MRI 2025, and MRI 2050 projections. A small decreasing trend was found in the projections except for the GFDL 2050 projection.

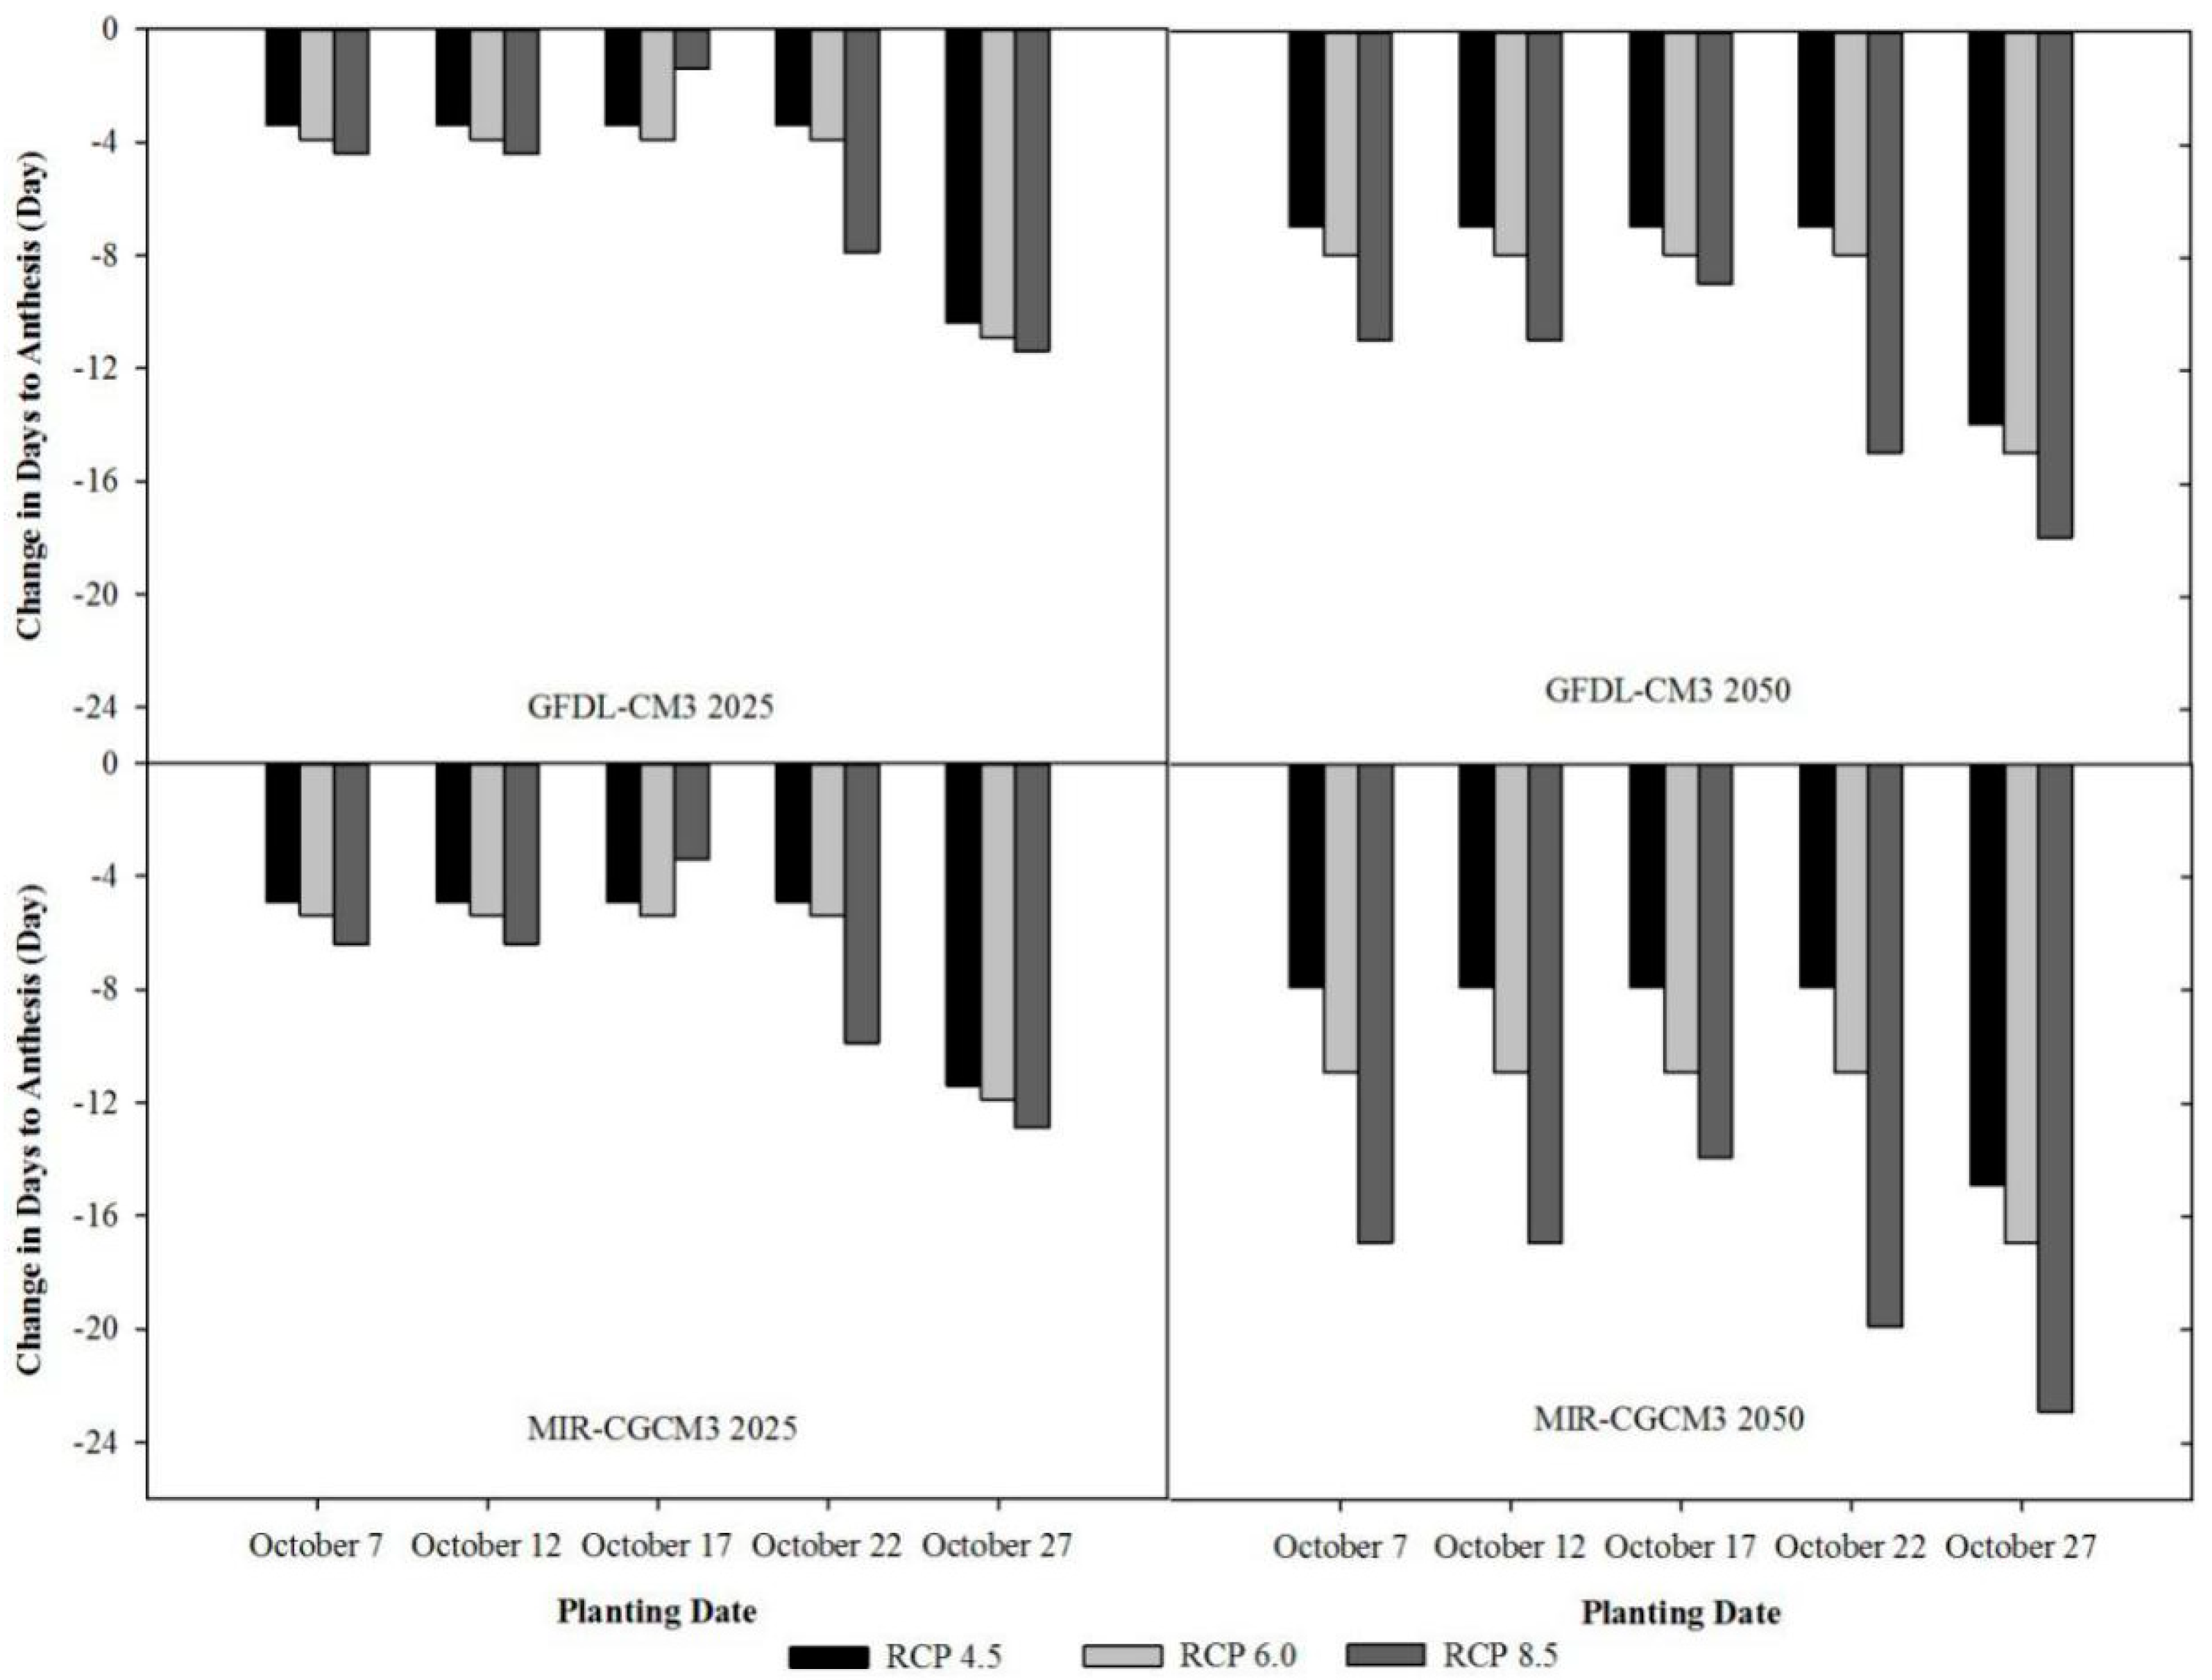
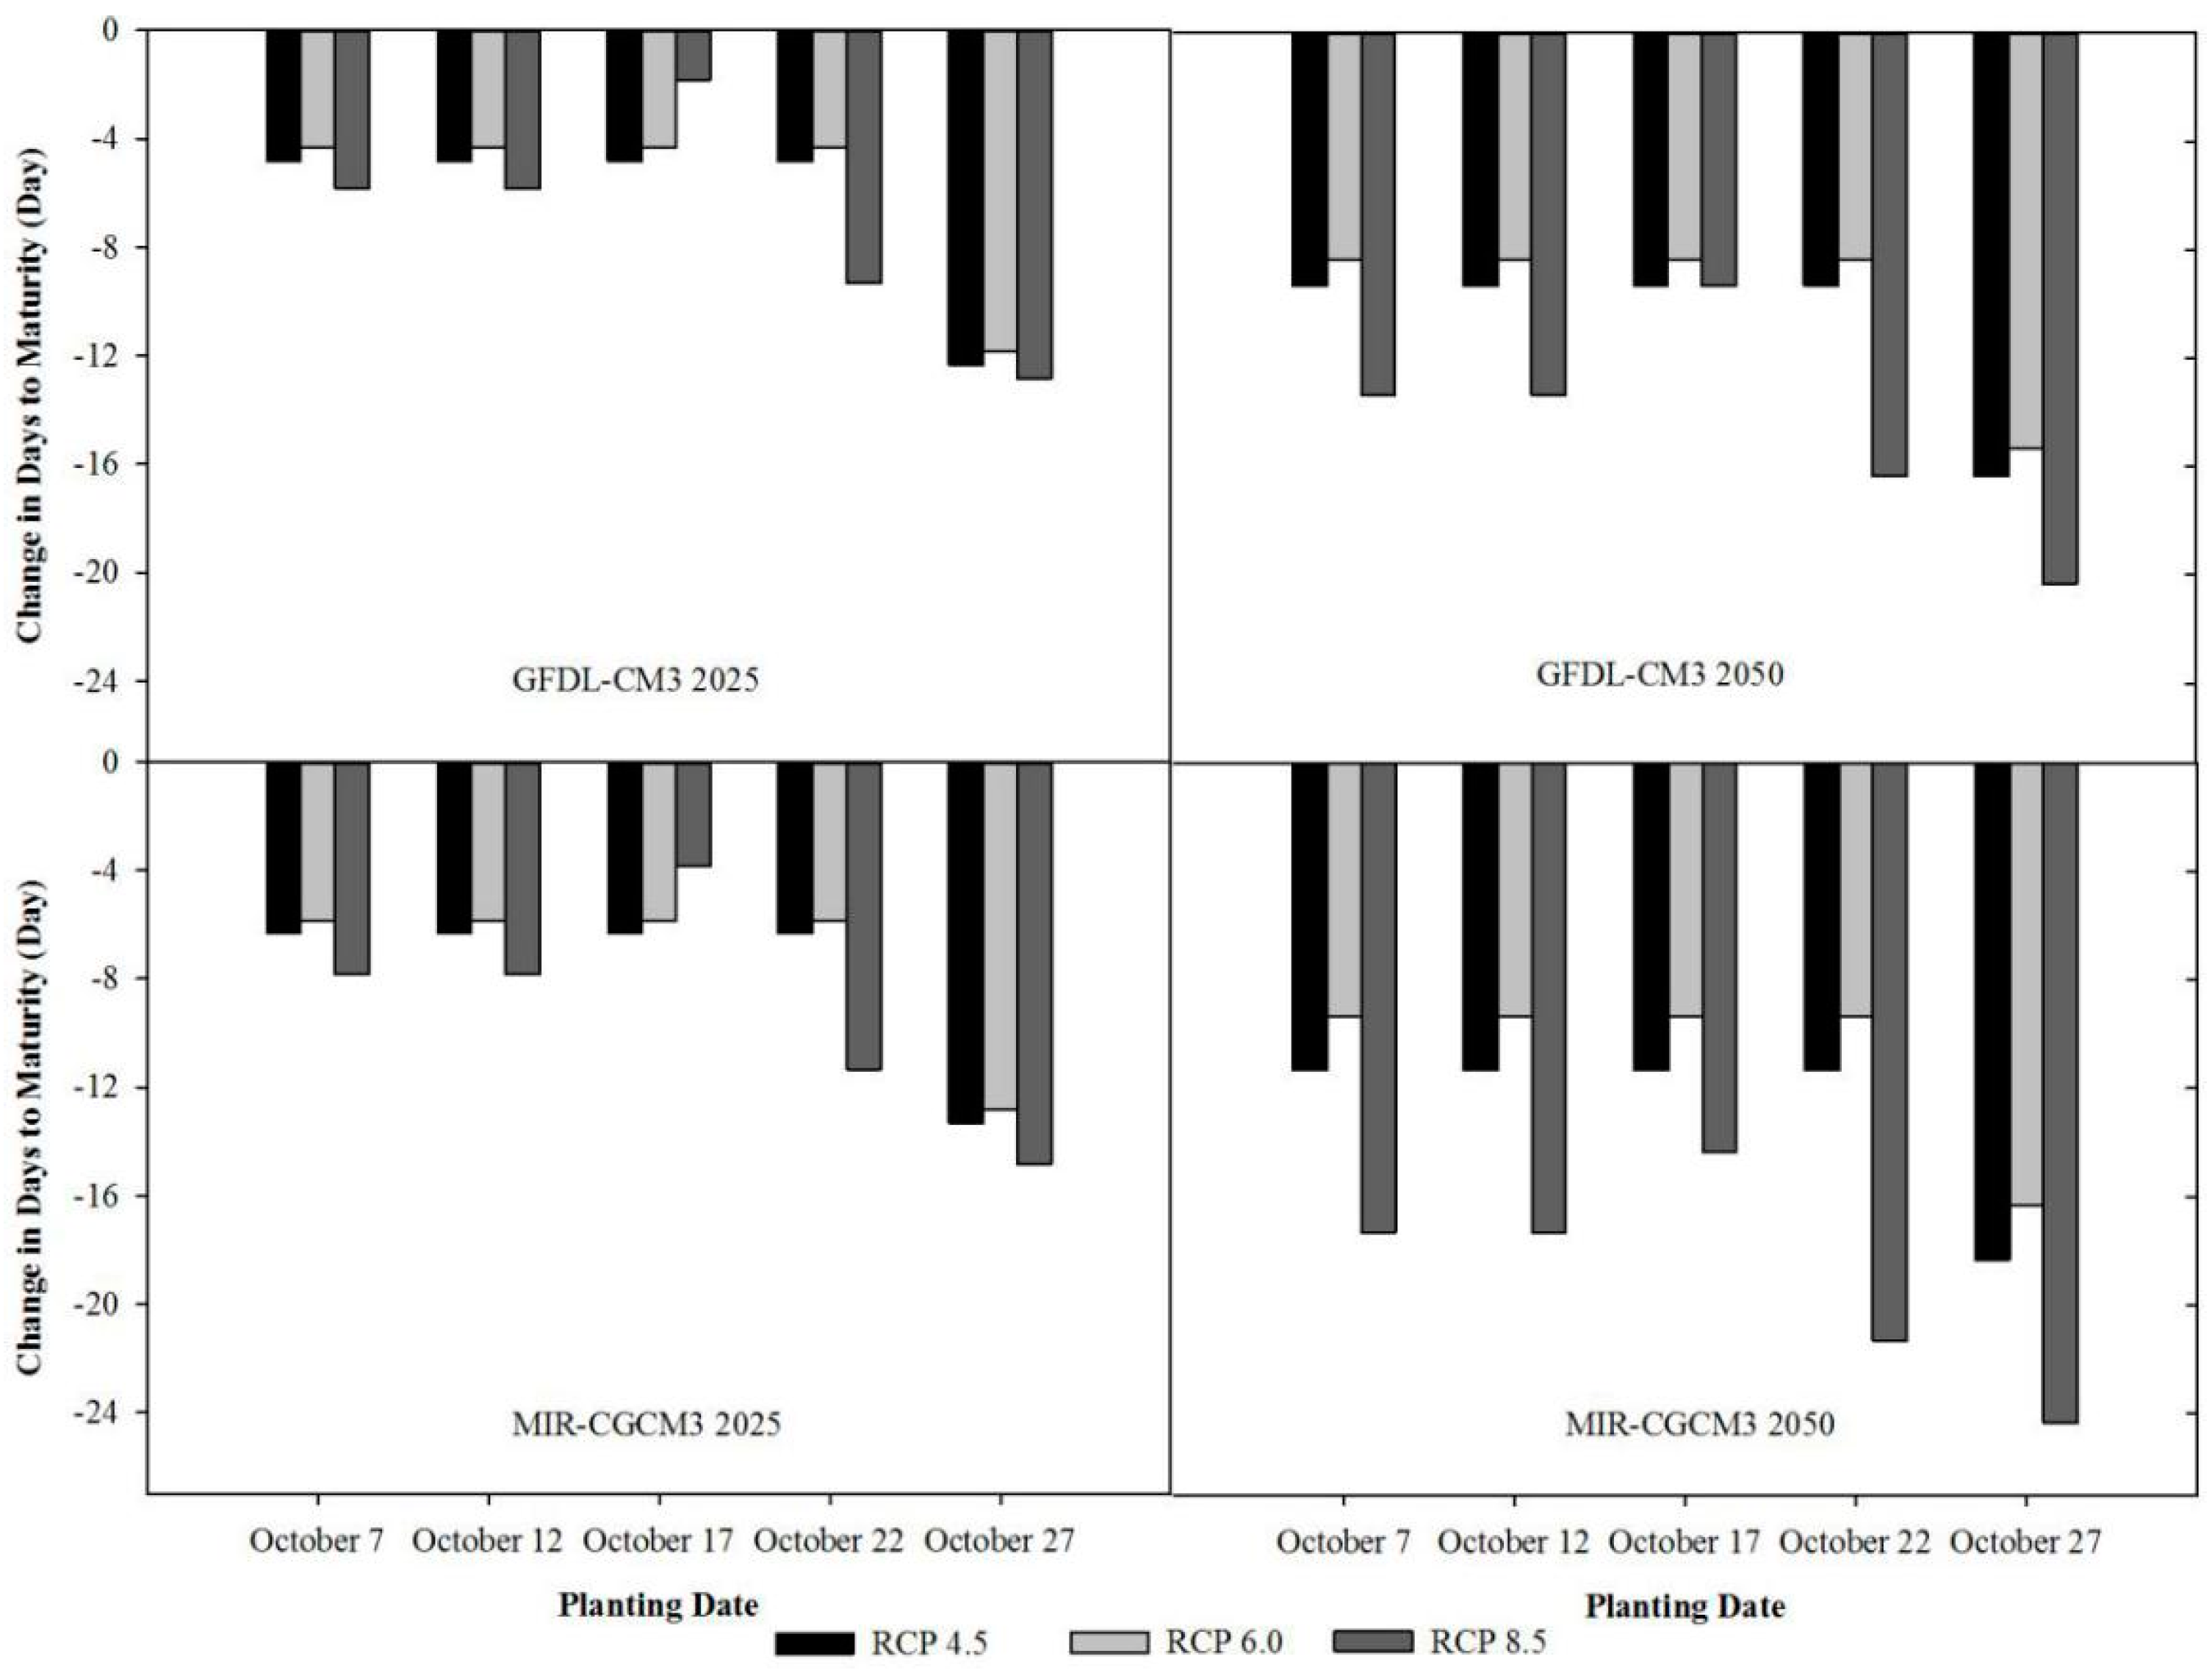
3.2. Projected Phenology Changes

To know the impact of changing climate on winter wheat growing period, we simulated the number of days from planting to anthesis (ADAPS) and the number of days from planting to maturity (MDAPS) for different planting dates based on the two GCMs and three RCPs, the results of which are illustrated in Figure 5. Obvious decreases were projected for both two future periods compared with the reference year. The ADAPS decreased from 4.8 to 5.9 days on average and from 8.3 to 12.7 days based on GFDL for the 2025 and 2050 projections, respectively. The largest change of ADAPs was observed in 2050, according to GFDL model in RCP 8.5, with a decrease of 17.9 days, and with a decrease of 18.1 days based on MIR under RCP 8.5.
Similarly, the MDAPS was shortened compared with the reference years for both GCMs; the predictions showed a difference in planting date, GCMs, scenarios, and projected years (Figure 6). The MDAPS had a decreasing trend under different scenarios and different planting dates. Among the three RCPs, the largest decrease was occurred for the RCP 8.5, followed by RCP 6.0, while RCP 4.5 showed similar changes based on both GCMs. The greatest shortening of MDAPS was projected by MIR on October 27 during 2050 under RCP 8.5, reaching 24.3 days. The MDAPS decreased from 6.3 to 7.1 days on average and from 9.7 to 14.5 days based on GFDL for the 2025 and 2050 projections, respectively.

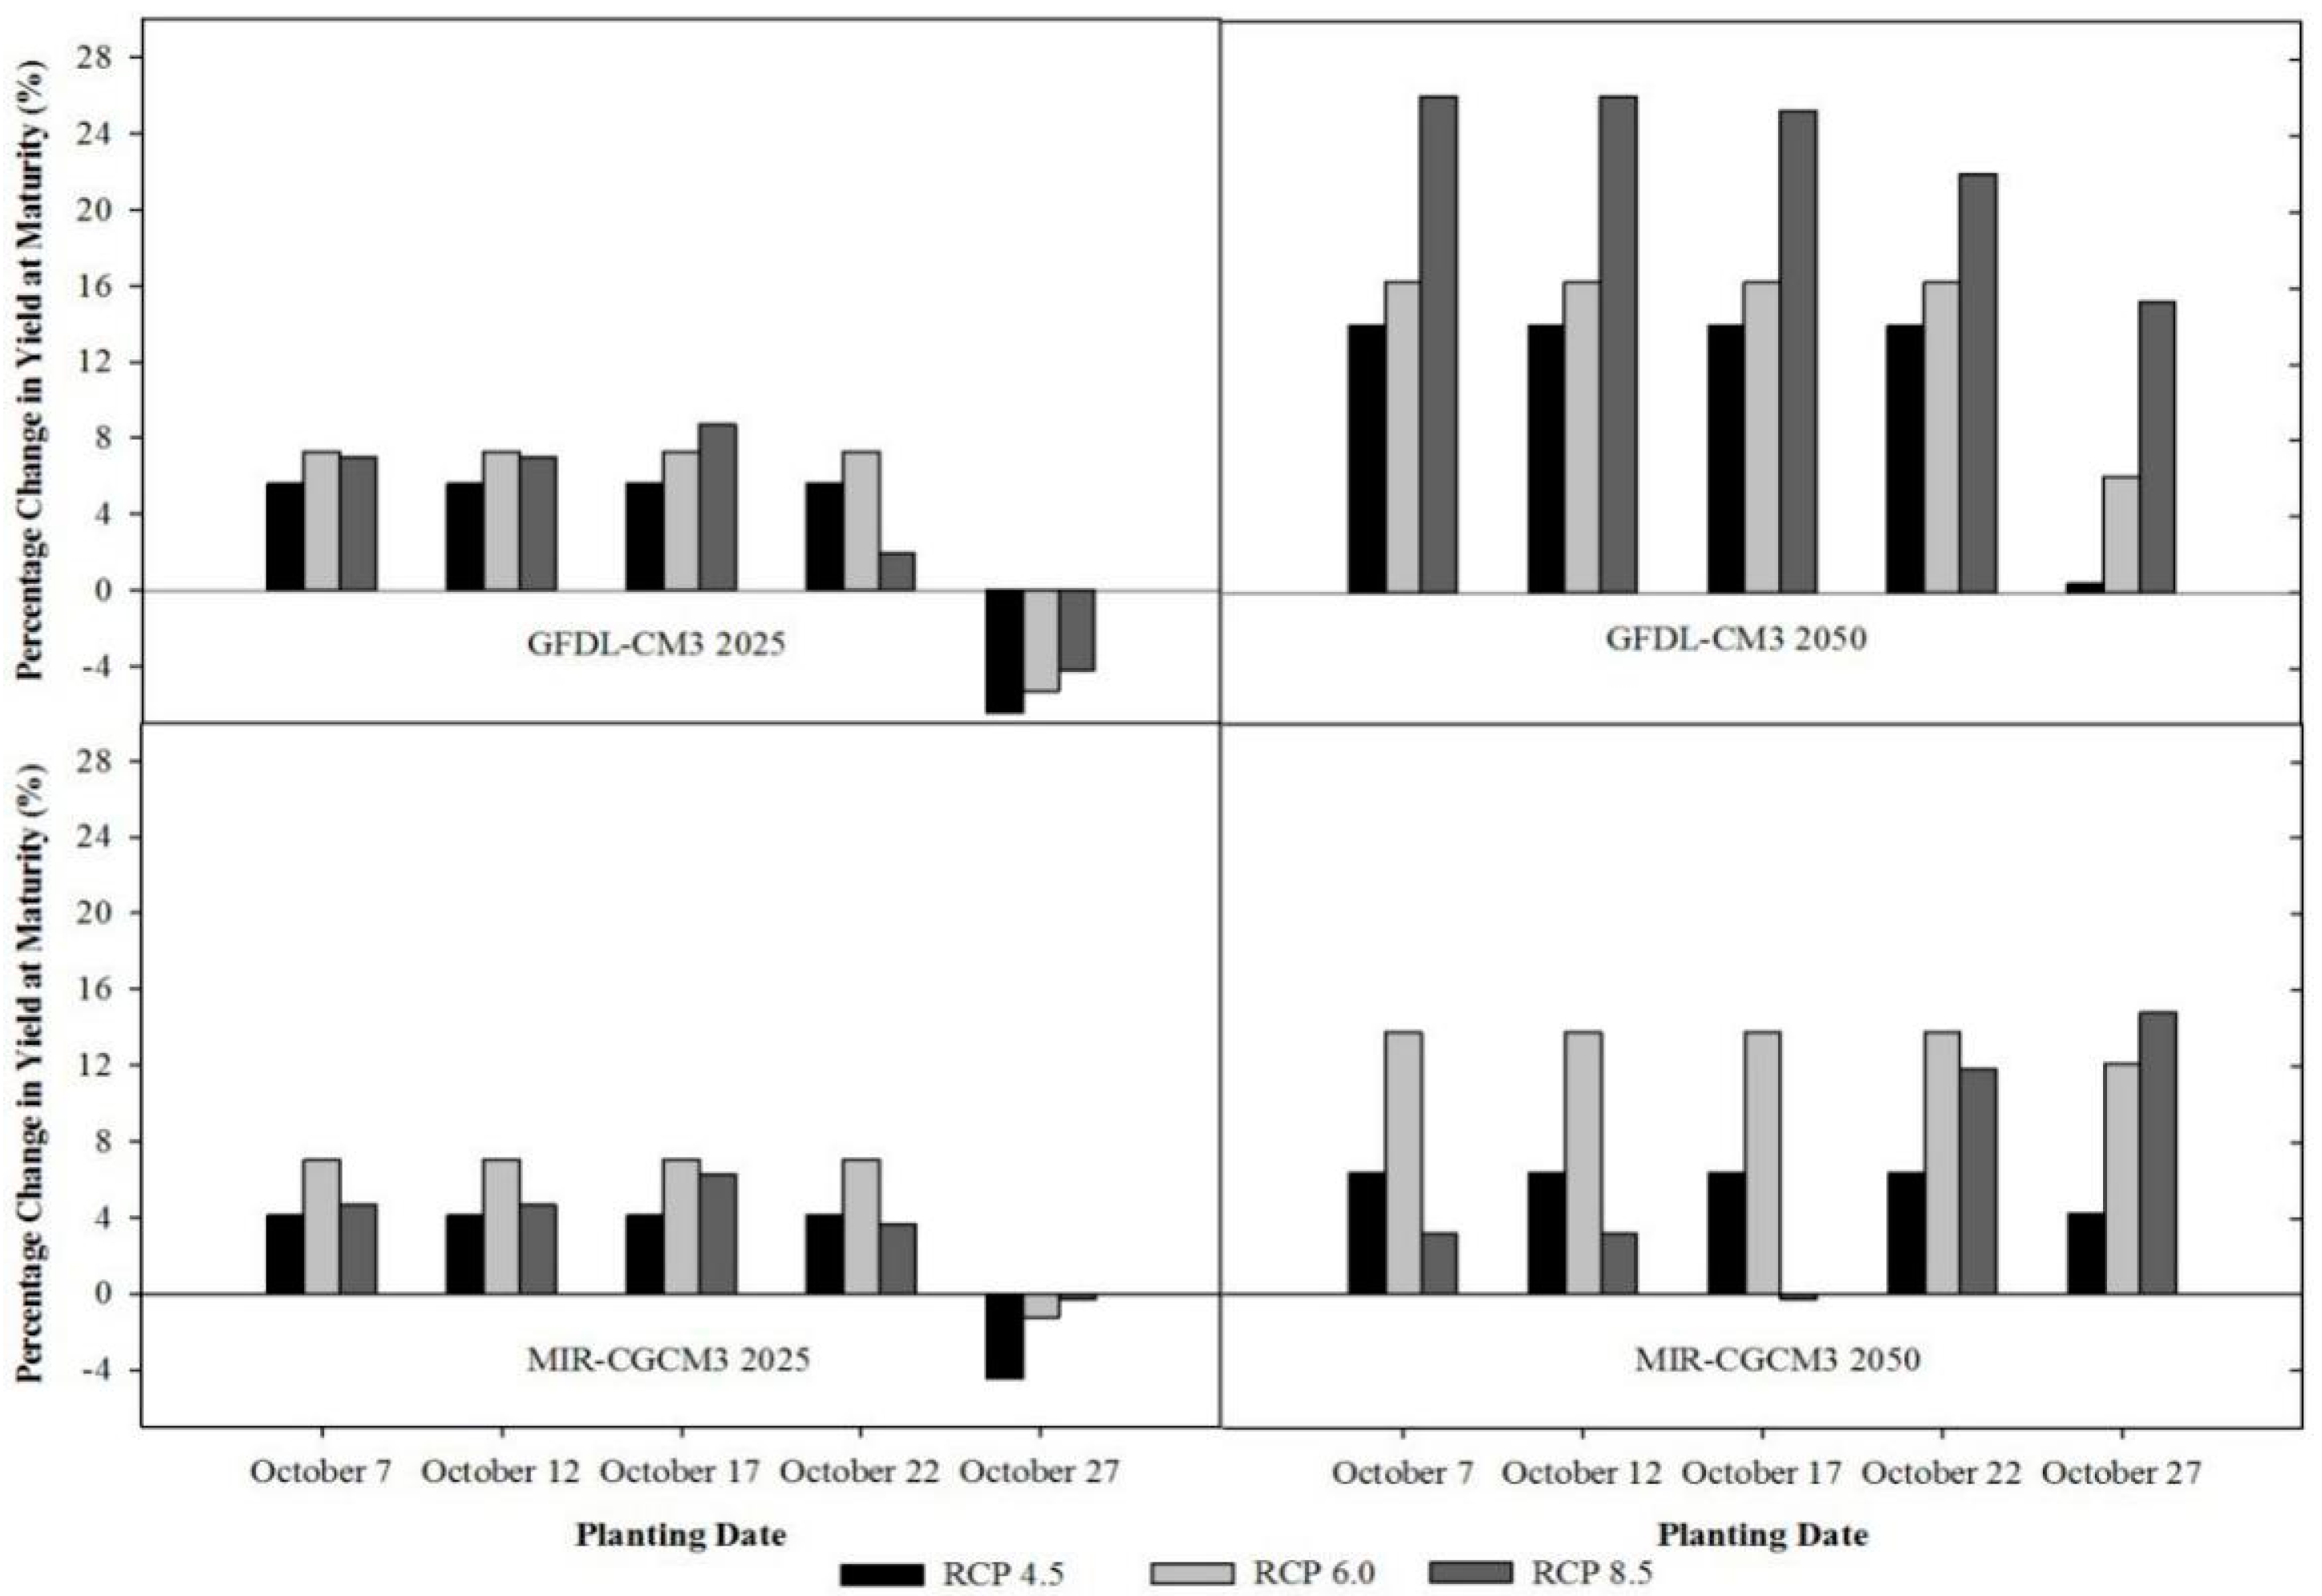
3.3. Projected Changes in Winter Wheat Yields

As mentioned before, the historical weather data based on the reference years were modified through two GCMs and three RCP scenarios to predict the yield productions in the future projections under changed sowing windows by using crop model. The predicted grain yields for the 2025 and 2050 projections based on two GCMs are shown in Table 4. For all the scenarios, the winter got a higher yield when planting on October 17, and the yield decreased largely when planting date shifted to October 27. In our study, we compared the simulations of winter wheat for the reference years with the future projections based on two GCMs instead of analyzing the absolute wheat yield prediction (Figure 7).
Among the three RCPs, the increases in grain yield between the scenarios were different and they depended on the sowing date. The yield increased higher for RCP 6.0, followed by RCPs 8.5 and 4.5 in the 2025 projection before October 12, while in the 2050 projection, the increase in yield for RCP 8.5 was higher, followed by RCPs 6.0 and 4.5 based on GFDL. For MRI GCM, the yield increased higher for RCP 6.0 and followed by RCP 4.5 and RCP 8.5. Due to the large increase in rainfall for the 2050 projection, the yield rose larger than for the 2025 projection. The grain yield at maturity had a deceasing trend when planting on October 27 based on all the RCPs and both GCMs for the 2025 projection, and except for the MRI 2050 projection, the grain yield had a declining trend based on all three RCPs and two GCMs when the planting date was delayed to 17 October. The largest increases in grain yield were 26.1%, 16.3%, and 14% based on the GFDL 2050 projection for the RCP 8.5, RCP 6.0, and RCP4.5, respectively, when planting on October 7 and 12.

4. Discussion

In our study, by using the crop simulation model, the wheat grain yield in Guanzhong Plain would increase by 2.8% and 8.6% under RCP 4.5, 5.1% and 13.9% under RCP 6.0, and 3.9% and 14.8% under RCP 8.5 for the 2025 and 2050 projections. The results were consistent with a previous study which found that the warming climate in the last 30 years increased wheat yield by 0.9–12.9% in north part of China but decreased 1.2–10.2% in south part of China, differed in location, and the reason was due to the final impacts depends on the combined effect of changes in all climate variables. One zone was sensitive to mean temperature and the other was most sensitive to solar radiation during the growing period [6]. The adverse effects of changed climate can be reduced by choosing optimum sowing dates [48,49], and increasing rainfall during this time is also beneficial [50]. Our study illustrated that the winter wheat planted after October 17 would decrease the grain yield by 0.3–6.5%. For the 2025 projection, the average yield increased less for RCP 8.5 compared with the other RCPs based on GFDL and MRI GCM. The reason for this may due to the larger decrease in MDPAS.
Physiologically, wheat is a C3 plant, which greatly benefits from an increase in CO2 concentration; that is, the increase in CO2 concentration has a fertilization effect that can increase in the photosynthetic rate and it also has a water-saving effect by decreasing transpiration [51,52]. Generally, increases in CO2, high mean temperature, and SRAD can improve photosynthesis leading to a final yield increase. Therefore, changes in CO2, Tmean, and SRAD would affect the crop production significantly [53]. Parry et al. [54] illustrated that, because of the “CO2-fertilization effect”, increasing in CO2 concentration would counteract the passive influences (such as yield reduction) of climate change in the future projections. The yield gains for RCP 8.5 were larger based on GFDL. The reason for this may due to the CO2 fertilization offsetting the interactions, such as higher temperature [55]. Semenov and Shewry [56] found that, although earlier flowering with increasing temperatures allowed crops to escape increasing terminal drought, compared to RCP 4.5, the RCP 8.5 with higher CO2 concentrations can also counteract the increased negative impacts of rainfall reduction and shorter growth period. Thus, an appropriate decision to support the arid area could be to plant a cultivar that flowers early [52].
Obviously, there were some uncertainties and limitations in the method of combining different scenarios and crop models in our study. The crop models are useful tools in predicting the impacts of different weather conditions on crop development and final productivity, but they have limitations regarding extreme weather events and soil conditions, and the soils used for simulation were also sources of uncertainty, as different calibration results could lead to different simulation results. Our results showed that the phenology of winter wheat totally decreased in the future and the yield increased in Guanzhong Plain by the midcentury. Hernandez-Ochoa et al. [55] indicated that applying the wheat-crop-climate multi-model ensemble may counteract the negative impact of climate change on wheat yield in Mexico. Parry et al. [57] suggested about 5% to 10% wheat yield may decline around the world by midcentury, even changing the sowing dates, choosing the different varieties, applying the appropriate fertilizer and irrigation amount or other adaptation strategies applied. In our further studies, we will take into account other wheat cultivars that may be more heat tolerant and drought resistant, as well as other potential adaptation scenarios such as irrigation and fertilizer management.

5. Conclusions

The present study indicated that the solar radiation mainly reduced from 0.3 to 3.3 MJ m−2 in the future projection and decreased most in June. Rainfall normally raised in February, June and August, but reduced in April, October and November in the study area. The precipitation change for the RCP 8.5 scenario was the largest, followed by RCPs 6.0 and 4.5. The mean temperature in most months rose compared with the baseline, among which the temperature in January, March, and December increased the most. The winter wheat anthesis date was shortened 3–23 days, the maturity date was shortened 4–24 days under different projections, and the winter wheat yield increased up to 28% among all scenarios.
Overall, the effect of the future climate on winter wheat production in Guanhzong Plain is positive, and the negative impact of climate change depends on the climate projections considered, as some of the GCMs showed an increase in grain yield and some showed a reducing trend. For the planting date, October 7–17 is the optimum choice, and the winter wheat yield would have a declining trend when planting after October 17. However, the simulated results were based on the rainfed scenario; the grain yield of rainfed wheat is very sensitive to climate change. Due to the great uncertainty in the future change of rainfed wheat yield in the Guanzhong area, irrigation management should be considered.

Author Contributions

Z.Z. and Z.W., methodology, software, investigation, and data curation. X.W., formal analysis. Z.Z., conceptualization, writing-original draft preparation. H.C., validation, resources, writing-review and editing, supervision, project administration, and funding acquisition. All authors have read and agreed to the published version of the manuscript.

Funding

This research was supported by the National Key Research and Development Program of China (grant number 2016YFC0400202), the Project of the Faculty of Agricultural Equipment of Jiangsu University, and a Project Funded by the Priority Academic Program Development of Jiangsu Higher Eeucation Institutions (No. PAPD-2018-87).

Conflicts of Interest

The authors declare no conflict of interest.

References

  1. National Bureau of Statistics of China. China Statistical Yearbook 2011; China Statistics Press: Beijing, China, 2011. [Google Scholar]
  2. FAO. Statistical Yearbook: World Food and Agriculture; FAO (Food and Agriculture Organization of the United Nations): Rome, Italy, 2012; p. 184. [Google Scholar]
  3. Chen, Y.; Zhang, Z.; Wang, P.; Song, X.; Wei, X.; Tao, F. Identifying the impact of multi-hazards on crop yield—A case for heat stress and dry stress on winter wheat yield in northern China. Eur. J. Agron. 2016, 73, 55–63. [Google Scholar] [CrossRef]
  4. Liang, S.; Li, Y.; Zhang, X.; Sun, Z.; Sun, N.; Duan, Y.; Xu, M.; Wu, L. Response of crop yield and nitrogen use efficiency for wheat-maize cropping system to future climate change in northern China. Agric. For. Meteorol. 2018, 262, 310–321. [Google Scholar] [CrossRef]
  5. Hernadez-Ochoa, I.M.; Asseng, S.; Kassie, B.T.; Xiong, W.; Robertson, R.; Pequeno, D.N.L.; Sonder, K.; Reynolds, M.; Babar, M.A.; Milan, A.M.; et al. Climate change impact on Mexico wheat production. Agric. For. Meteorol. 2018, 263, 373–387. [Google Scholar] [CrossRef]
  6. Tao, F.; Zhang, Z.; Xiao, D.; Zhang, S.; Rotter, R.P.; Shi, W.; Liu, Y.; Wang, M.; Liu, F.; Zhang, H. Response of wheat growth and yield to climate change in different climate zones of China, 1981–2009. Agric. For. Meteorol. 2014, 189, 91–104. [Google Scholar] [CrossRef]
  7. Xiao, D.; Tao, F. Contributions of cultivars, management and climate change to winter wheat yield in the North China Plain in the past three decades. Eur. J. Agron. 2014, 52, 112–122. [Google Scholar] [CrossRef]
  8. Kaushika, G.S.; Himanshu Arora, H.; KS, H.P. Analysis of climate change effects on crop water availability for paddy, wheat and berseem. Agric. Water Manag. 2019, 225, 105734. [Google Scholar]
  9. Zhang, H.; Zhou, G.; Liu, D.; Wang, B.; Xiao, D.; He, L. Climate-associated rice yield change in the Northeast China Plain: A simulation analysis based on CMIP5 multi-model ensemble projection. Sci. Total Environ. 2019, 666, 126–138. [Google Scholar] [CrossRef]
  10. IPCC. Climate Change 2001: The Scientific Basis. Contribution of Working Group I to the Third Assessment Report of the Intergovernmental Panel on Climate Change; Houghton, J.T., Ding, Y., Griggs, D.J., Noguer, M., van der Linden, P.L.J., Dai, X., Maskell, K., Johnson, C.A., Eds.; Cambridge University Press: Cambridge, UK; New York, NY, USA, 2001; p. 881. [Google Scholar]
  11. Lobell, D.B.; Field, C.B.; Cahill, K.N.; Bonfils, C. Impacts of future climate change on California perennial crop yields: Model projections with climate and crop uncertainties. Agric. For. Meteorol. 2006, 141, 208–218. [Google Scholar] [CrossRef] [Green Version]
  12. Xiong, W.; Holman, I.; Conway, D.; Lin, E.; Li, Y. A crop model cross calibration for use in regional climate impacts studies. Ecol. Model. 2008, 213, 365–380. [Google Scholar] [CrossRef]
  13. Rosenzweig, C.; Elliott, J.; Deryng, D.; Ruane, A.C.; Müller, C.; Arneth, A.; Boote, K.J.; Folberth, C.; Glotter, M.; Khabarov, N.; et al. Assessing agricultural risks of climate change in the 21st century in a global gridded crop model inter comparison. Proc. Natl. Acad. Sci. USA 2014, 111, 3268–3272. [Google Scholar] [CrossRef] [Green Version]
  14. Wang, W.; Yu, Z.; Zhang, W.; Shao, Q.; Zhang, Y.; Luo, Y.; Jiao, X.; Xu, J. Response of rice yield, irrigation water requirement and water use efficiency to climate change in China: Historical simulation and future projections. Agric. Water Manag. 2014, 146, 249–261. [Google Scholar] [CrossRef]
  15. Yan, C.R.; Liu, L.; Huang, G.H. Multi-model projections of future climate change under different RCP scenarios in arid inland region of north China. J. Drain. Irrig. Mach. Eng. 2018, 36, 1193–1199, (In Chinese with English abstract). [Google Scholar]
  16. Rotter, R.P.; Carter, T.R.; Olesen, J.E.; Porter, J.R. Crop-climate models need an overhaul. Nat. Clim. Chang. 2011, 1, 175–177. [Google Scholar] [CrossRef]
  17. Chenu, K.; Porter, J.R.; Martre, P.; Basso, B.; Chapman, S.C.; Ewert, F.; Bindi, M.; Asseng, S. Contribution of crop models to adaptation in wheat. Trends Plant Sci. 2017, 22, 472–490. [Google Scholar] [CrossRef] [PubMed]
  18. Martre, P.; Wallach, D.; Asseng, S.; Ewert, F.; Jones, J.W.; Rötter, R.P.; Boote, K.J.; Ruane, A.C.; Thorburn, P.J.; Cammarano, D.; et al. Multi-model ensembles of wheat growth: Many models are better than one. Glob. Chang. Biol. 2015, 21, 911–925. [Google Scholar] [CrossRef] [PubMed]
  19. Gu, Z.; Qi, Z.; Ma, L.; Gui, D.; Xu, J.; Fang, Q.; Yuan, S.; Feng, G. Development of an irrigation scheduling software based on model predicted crop water stress. Comput. Electron. Agric. 2017, 143, 208–221. [Google Scholar] [CrossRef]
  20. Asseng, S.; Ewert, F.; Martre, P.; Rötter, R.P.; Lobell, D.B.; Cammarano, D.; Kimball, B.A.; Ottman, M.J.; Wall, G.W.; White, J.W.; et al. Rising temperatures reduce global wheat production. Nat. Clim. Chang. 2015, 5, 143–147. [Google Scholar] [CrossRef]
  21. Bai, H.; Tao, F. Sustainable intensification options to improve yield potential and co-efficiency for rice-wheat rotation system in China. Field Crop Res. 2017, 211, 89–105. [Google Scholar] [CrossRef]
  22. Yang, W.C.; Mao, X.M. Uncertainty of crop models under influence of climate change. J. Drain. Irrig. Mach. Eng. 2018, 36, 874–879, 902, (In Chinese with English abstract). [Google Scholar]
  23. Liu, Y.; Tao, F. Probabilistic change of wheat productivity and water use in China for global mean temperature changes of 1, 2, and 3 oC. J. Appl. Meteorol. Climatol. 2013, 52, 114–129. [Google Scholar] [CrossRef]
  24. Gennady, B.M.; Peter, T.H.; Bertram, O. Modelling long-term risk profiles of wheat grain yield with limited climate data. Agric. Syst. 2019, 173, 393–402. [Google Scholar]
  25. Rashid, M.A.; Jabloun, M.; Andersen, M.N.; Zhang, X.; Olesen, J.E. Climate change is expected to increase yield and water use efficiency of wheat in the North China Plain. Agric. Water Manag. 2019, 222, 193–203. [Google Scholar] [CrossRef]
  26. Warric, R.A.; Kenny, G.J.; Harman, J.J. The Effects of Climate Change and Variation in New Zealand: An Assessment Using the CLIMPACTS System; The International Global Change Institute (IGCI), University of Waikato: Hamilton, New Zealand, 2001; Available online: http://hdl.handle.net/10289/897 (accessed on 28 June 2020).
  27. Warrick, R.A. Using SimCLIM for modelling the impacts of climate extremes in a changing climate: A preliminary case study of household water harvesting in Southeast Queensland. In Proceedings of the 18th World IMACS. In MODSIM Congress, Cairns, Australia, 13–17 July 2009; pp. 2583–2589. [Google Scholar]
  28. Bao, Y.; Hoogenboom, G.; McClendon, R.; Urich, P. Soybean production in 2025 and 2050 in the southeastern USA based on the SimCLIM and the CSM-CROPGRO-Soybean models. Clim. Res. 2015, 63, 73–89. [Google Scholar] [CrossRef] [Green Version]
  29. Amin, A.; Nasim, W.; Mubeen, M.; Ahmad, A.; Nadeem, M.; Urich, P.; Fahad, S.; Ahmad, S.; Wajid, A.; Tabassum, F.; et al. Simulated CSM-CROPGRO-cotton yield under projected future climate by SimCLIM for southern Punjab, Pakistan. Agric. Syst. 2018, 167, 213–222. [Google Scholar] [CrossRef]
  30. Kenny, G.J.; Harman, J.J.; Flux, T.L.; Warrick, R.A.; Ye, W. The Impact of Climate Change on Regional Resources: A Case Study for Canterbury and Waikato Regions. In The Effects of Climate Change and Variation in New Zealand: An Assessment Using the CLIMPACTS System; Warrick, R.A., Kenny, G.J., Harman, J.J., Eds.; The International Global Change Institute (IGCI), University of Waikato: Hamilton, New Zealand, 2001; Available online: http://hdl.handle.net/10289/897 (accessed on 28 June 2020).
  31. Storey, L.P. Effect of climate and land use change on invasive species: A case study of Tradescantiafluminensis (Vell.) in New Zealand. Ph.D. Thesis, University of Waikato, Hamilton, New Zealand, 2009. Available online: http://hdl.handle.net/10289/2634 (accessed on 28 June 2020).
  32. Li, Z.; Song, M.; Feng, H.; Zhao, Y. Within-season yield prediction with different nitrogen inputs under rain-fed condition using CERES-Wheat model in the northwest of China. J. Sci. Food Agric. 2016, 96, 2906–2916. [Google Scholar] [CrossRef]
  33. Liu, J.; Feng, H.; He, J.; Chen, H.; Ding, D.; Luo, X.; Dong, Q. Modeling wheat nutritional quality with a modified CERES-Wheat model. Eur. J. Agron. 2019, 109, 125901. [Google Scholar] [CrossRef]
  34. Dar, E.A.; Brar, A.S.; Mishra, S.K.; Singh, K.B. Simulating response of wheat to timing and depth of irrigation water in drip irrigation system using CERES-Wheat model. Field Crop Res. 2017, 214, 149–163. [Google Scholar] [CrossRef]
  35. Hoogenboom, G.; Jones, J.W.; Wilkens, P.W.; Porter, C.H.; Boote, K.J.; Hunt, L.A.; Singh, U.; Lizaso, J.L.; Whiht, J.W.; Uryasev, O.; et al. Decision Support System for Agrotechnology Transfer, Version 4.5; University of Hawaii: Honolulu, HI, USA, 2011. [Google Scholar]
  36. Jones, J.W.; Hoogenboom, G.; Porter, C.H.; Boote, K.J.; Batchelor, W.D.; Hunt, L.A.; Wilkens, P.W.; Singh, U.; Gijsman, A.J.; Ritchie, J.T. The DSSAT cropping system model. Eur. J. Agron. 2003, 18, 235–265. [Google Scholar] [CrossRef]
  37. Hoogenboom, G.; Porter, C.H.; Boote, K.J.; Shelia, V.; Wilkens, P.W.; Singh, U.; White, J.W.; Asseng, S.; Lizaso, J.I.; Moreno, L.P.; et al. The DSSAT crop modeling ecosystem. In Advances in Crop Modeling for a Sustainable Agriculture; Boote, K.J., Ed.; Burleigh Dodds Science Publishing: Cambridge, UK, 2019; pp. 173–216. [Google Scholar]
  38. Saddique, Q.; Cai, H.; Ishaque, W.; Chen, H.; Chau, H.W.; Chattha, M.U.; Hassan, M.U.; Khan, M.I.; He, J. Optimizing the sowing date and irrigation strategy to improve maize yield by using CERES (Crops Estimation through Resource and Environment Systhesis)-Maize model. Agronomy 2019, 9, 109. [Google Scholar] [CrossRef] [Green Version]
  39. Zheng, Z.; Cai, H.; Yu, L.; Hoogenboom, G. Application of the CSM–CERES–Wheat Model for Yield Prediction and Planting Date Evaluation at Guanzhong Plain in Northwest China. Agron. J. 2017, 109, 204. [Google Scholar] [CrossRef]
  40. Zheng, Z.; Cai, H.; Hoogenboom, G.; Chaves, B.; Yu, L. Limited Irrigation for Improving Water Use Efficiency of Winter Wheat in the Guanzhong Plain of Northwest China. Trans. ASABE 2016, 59, 1841–1852. [Google Scholar]
  41. What is SimCLIM? Available online: http://www.climsystems.com/simclim (accessed on 28 June 2020).
  42. Warrick, R.A.; Ye, W.; Kouwenhoven, P.; Hay, J.E.; Cheatham, C. New Developments of the SimCLIM Model for Simulating Adaptation to Risks Arising from Climate Variability and Change. MODSIM 2005. International Cogress on Modelling and Simulation; Zerger, A., Argent, R.M., Eds.; Modelling and Simulation Society of Australia and New Zealand, 2005. Available online: https://hdl.handle.net/10289/5486 (accessed on 28 June 2020).
  43. Kenny, G.J.; Warrick, R.A.; Campbell, B.D.; Sing, G.C.; Camilleri, M.; Jamieson, P.D.; Mitchell, N.D.; Mcpherson, H.G.; Salinger, M.J. Investigating climate change impacts and thresholds: An application of the CLIMPACTS integrated assessment model for New Zealand agriculture. Clim. Chang. 2000, 46, 91–113. [Google Scholar] [CrossRef]
  44. Yin, C.; Li, Y.; Urich, P. SimCLIM 2013 Data Manual; CLIMsystems Ltd.: Hamilton, New Zealand, 2013; Available online: http://documents.climsystems.com/news/6-11-2013/SimCLIM_2013_AR5_data_manual.pdf (accessed on 28 June 2020).
  45. China Meteorological Data Service Center. Available online: http://data.cma.cn/ (accessed on 28 June 2020).
  46. IPCC. Climate Change 2014: Synthesis Report. Contribution of Working Groups I, II and III to the Fifth Assessment Report to the Intergovernmental Panel o Climate Change; Core Writing Team, Pachauri, R.K., Meyer, L.A., Eds.; IPCC: Geneva, Swizerland, 2014; p. 151, In IPCC AR5 Synthesis Report website. [Google Scholar]
  47. Bao, Y.; Hoogenboom, G.; McClendon, R.W.; Paz, J.O. Potential adaptation strategies for rainfed soybean production in the south-eastern USA under climate change based on the CSM-CROPGRO-Soybean model. J. Agric. Sci. 2015, 153, 798–824. [Google Scholar] [CrossRef]
  48. Carbone, G.J.; Kiechle, W.; Locke, C.; Mearns, L.O.; McDaniels, L.; Downton, M.W. Response of soybean and sorghum to varying spatial scales of climate change scenarios in the southeastern United States. Clim. Chang. 2003, 60, 73–98. [Google Scholar] [CrossRef]
  49. Nasim, W.; Belhouchette, H.; Ahaman, M.H.; Jabran, K.; Ulah, K.; Fahad, S.; Shakee, M.; Hoogenboom, G. Modelling climate change impacts and adaptation strategies for sunflower in Punjab-Pakistan. Outlook Agric. 2016, 45, 39–45. [Google Scholar] [CrossRef]
  50. IPCC. Climate Change 2007: Impacts, Adaptation and Bulnerability. In Contribution of Working Group Ⅱ to the Fourth Assessment Report of the Inter Governmental Panel on Climate Change; Parry, M.L., Canziani, O.F., Palutikof, J.P., van der Linden, P.J., Hanson, C.E., Eds.; Cambridge University Press: Cambridge, UK, 2007; pp. 589–662. [Google Scholar]
  51. Dettori, M.; Cesaraccio, C.; Duce, P. Simulation of climate change impacts on production and phenology of durum wheat in Mediterranean environments using CERES-Wheat model. Field Crops Res. 2017, 206, 43–53. [Google Scholar] [CrossRef]
  52. Qu, C.; Li, X.; Ju, H.; Liu, Q. The impacts of climate change on wheat yield in the Huang-Huai-Hai Plain of China using DSSAT-CERES-Wheat model under different climate scenarios. J. Integr. Agric. 2019, 18, 1379–1391. [Google Scholar] [CrossRef]
  53. Wang, B.; Liu, D.; Asseng, S.; Macadam, I.; Yu, Q. Modelling wheat yield change under CO2 increase, heat and water stress in relation to plant available water capacity in eastern Australia. Eur. J. Agron. 2017, 90, 152–161. [Google Scholar] [CrossRef]
  54. Parry, M.L.; Rosenzweig, C.; Iglesias, A.; Livermore, M.; Fischer, G. Effects of climate change on global food production under SRES emissions and social-economic scenarios. Global Environ. Change 2004, 14, 53–67. [Google Scholar] [CrossRef]
  55. Araya, A.; Hoogenboom, G.; Luedeling, E.; Hadgu, K.M.; Kisekka, I.; Martorano, L.G. Assessment of maize growth and yield using crop models under present and future climate in southwestern Ethiopia. Agric. For. Meteorol. 2015, 214, 252–265. [Google Scholar] [CrossRef]
  56. Semenov, M.A.; Shewry, P.R. Modelling predicts that heat stress, not drought, will increase vulnerability of wheat in Europe. Sci. Rep. 2011, 1, 66. [Google Scholar] [CrossRef]
  57. Hernandez-Ochoa, I.M.; Pequeno, D.N.; Reynolds, M.; Babar, M.A.; Sonder, K.; Milan, A.M.; Hoogenboom, G.; Robertson, R.; Gerber, S.; Rowland, D.L.; et al. Adapting irrigated and rainfed wheat to climate change in semi-arid environments: Management, breeding options and land use change. Eur. J. Agron. 2019, 109, 125915. [Google Scholar] [CrossRef]
Figure 1. Location of the study area.
Atmosphere 11 00681 g001
Figure 2. Changes in monthly SRAD (MJ m−2) as projected for 2025 and 2050 based on three RCPs for two GCMs compared with 1961–1990 for Guanzhong Plain.
Atmosphere 11 00681 g002
Figure 3. Changes in precipitation (%) as projected for 2025 and 2050 based on three RCPs for two GCMs compared with 1961–1990 for Guanzhong Plain.
Atmosphere 11 00681 g003
Figure 4. Changes in mean temperature (°C) projected for 2025 and 2050 based on three RCPs, and RCP 8.5 for two GCMs compared with 1961–1990 for Guanzhong Plain.
Atmosphere 11 00681 g004
Figure 5. Simulated ADAPS of winter wheat for Guanzhong Plain based on three RCPs under different planting dates based on two GCMs in the 2025 and 2050 projections.
Atmosphere 11 00681 g005
Figure 6. Predicted MDAPS of winter wheat for Guanzhong Plain based on three RCPs under different planting date based on two GCMs in the 2025 and 2050 projections.
Atmosphere 11 00681 g006
Figure 7. Predicted winter wheat yield for Guanzhong Plain based on three RCPs under changed planting dates based on two GCMs in the 2025 and 2050 projections.
Atmosphere 11 00681 g007
Table 1. Validated “Xiaoyan 22” wheat cultivar parameters.
AbbreviationDefinitionUnitValue
P1VVernalization sensitivity coefficientdegree-days6.62
P1DPhotoperiod parameter-81.37
P5Grain filling phase duration°C. d572.10
G1Kernel number per unit canopy weight at anthesis#/g23.30
G2Potential kernel growth ratemg33.70
G3Standard, non-stressed dry weight (total, including grain) of a single tiller at maturityg1.55
PHINTThermal time between the appearance of leaf tips°C. d97.20
Table 2. Soil physical parameters for the study area, Yangling.
Depth (cm)Bulk Density (g·cm3)Field CapacityWilting MoistureSoil Texture (%)
sandsiltclay
0–231.30.280.1226.740.832.1
23–351.40.280.1325.042.832.1
35–741.40.270.1524.144.831.0
74–951.40.280.1922.738.838.5
95–1631.40.270.1421.338.640.1
163–1961.30.260.1324.336.938.9
Table 3. Initial conditions of soil profile and physical characteristics in the field, Yangling.
Soil Depth (cm)Wilting Point (cm3·cm−3)Field Capacity (cm3·cm−3)Saturation (cm3·cm−3)Initial Water Content (cm3·cm−3)NH4-N Conc. (g·Mg−1)NO3-N Conc. (g·Mg−1)
0–50.100.280.450.281.9012.90
5–350.110.280.460.240.5011.20
35–700.120.280.460.220.4012.60
70–900.140.280.490.220.6011.80
90–1000.140.280.500.230.6010.50
Table 4. Simulated yields for the 2025 and 2050 projections based on GFDL and MRI GCM.
Planting DateProjections
GFDL-CM3 2025GFDL-CM3 2050MRI-CGCM3 2025MRI-CGCM3 2050
RCP 4.5RCP 6.0RCP 8.5RCP 4.5RCP 6.0RCP 8.5RCP 4.5RCP 6.0RCP 8.5RCP 4.5RCP 6.0RCP 8.5
10.742164282.54271455246435034415742724178.5424745424121
10.1242164282.54271455246435034415742724178.5424745424121
10.1742164282.54340455246435002415742724243424745423982
10.2242164282.54068.5455246434870415742724137.5424745424466
10.2737343778.53824401042354603381439423979416044774582

