Mapping Climate Change, Natural Hazards and Tokyo’s Built Heritage


Abstract
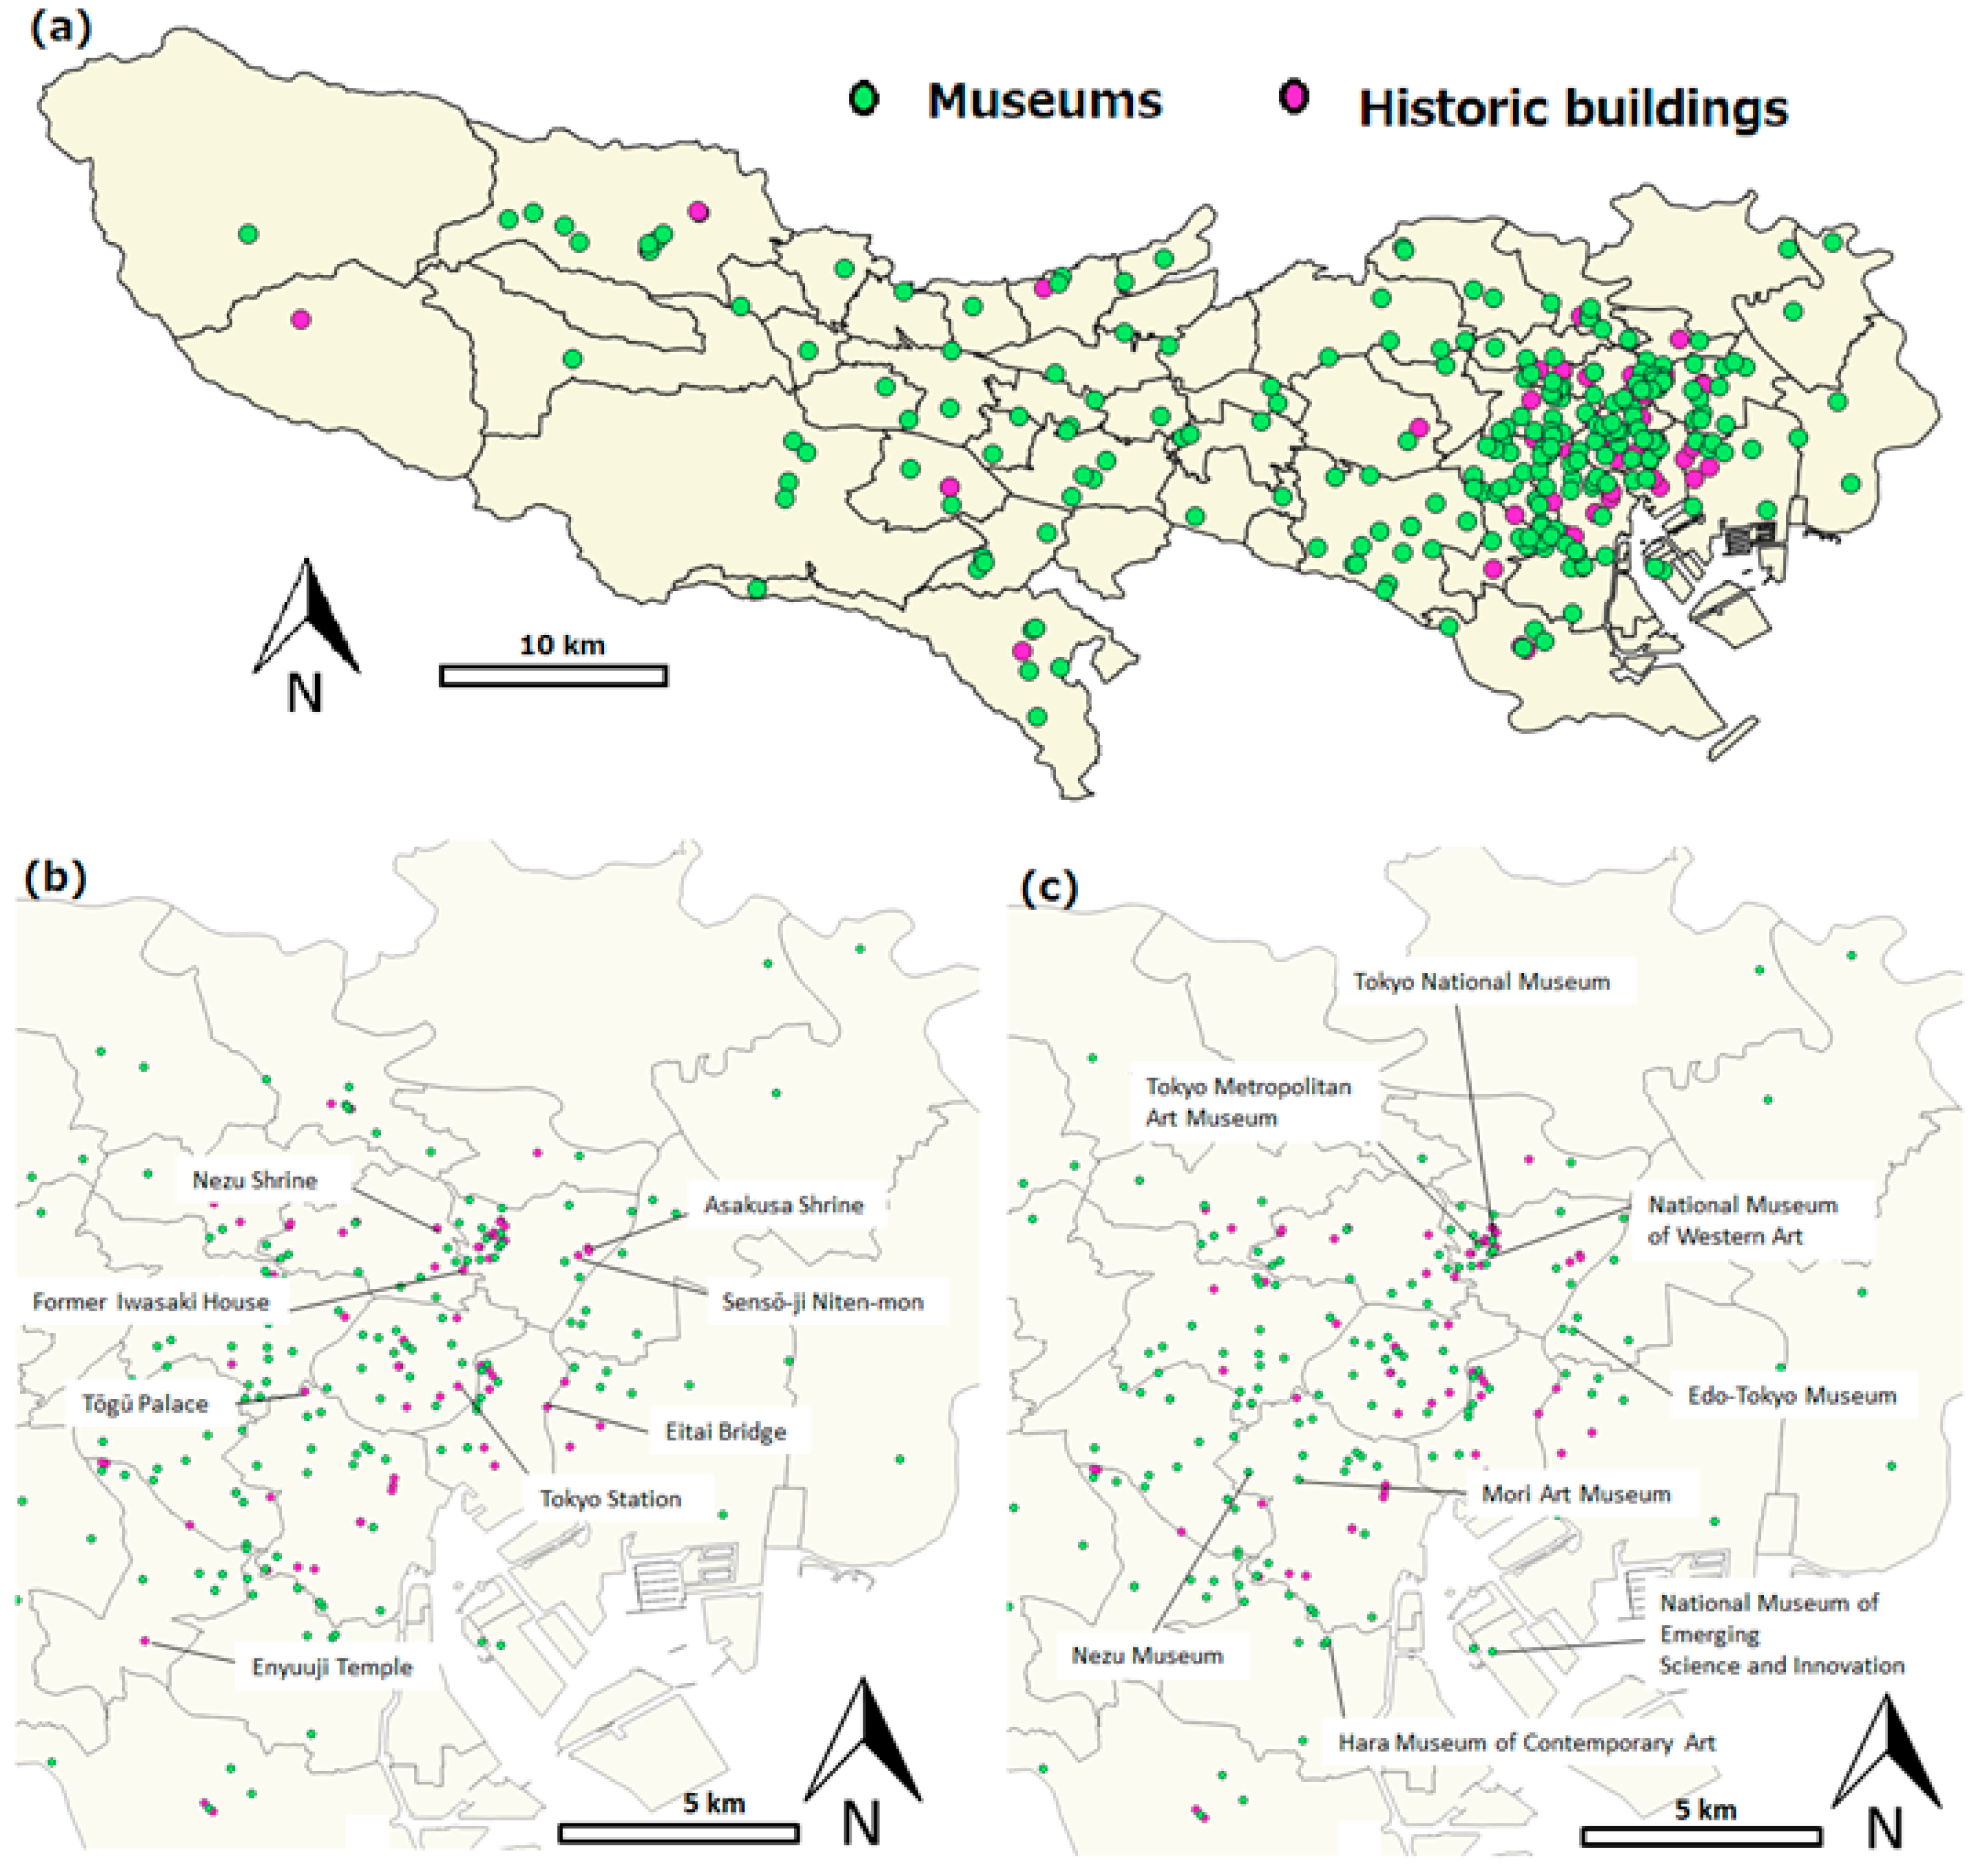
1. Introduction
2. Materials and Methods
3. Results
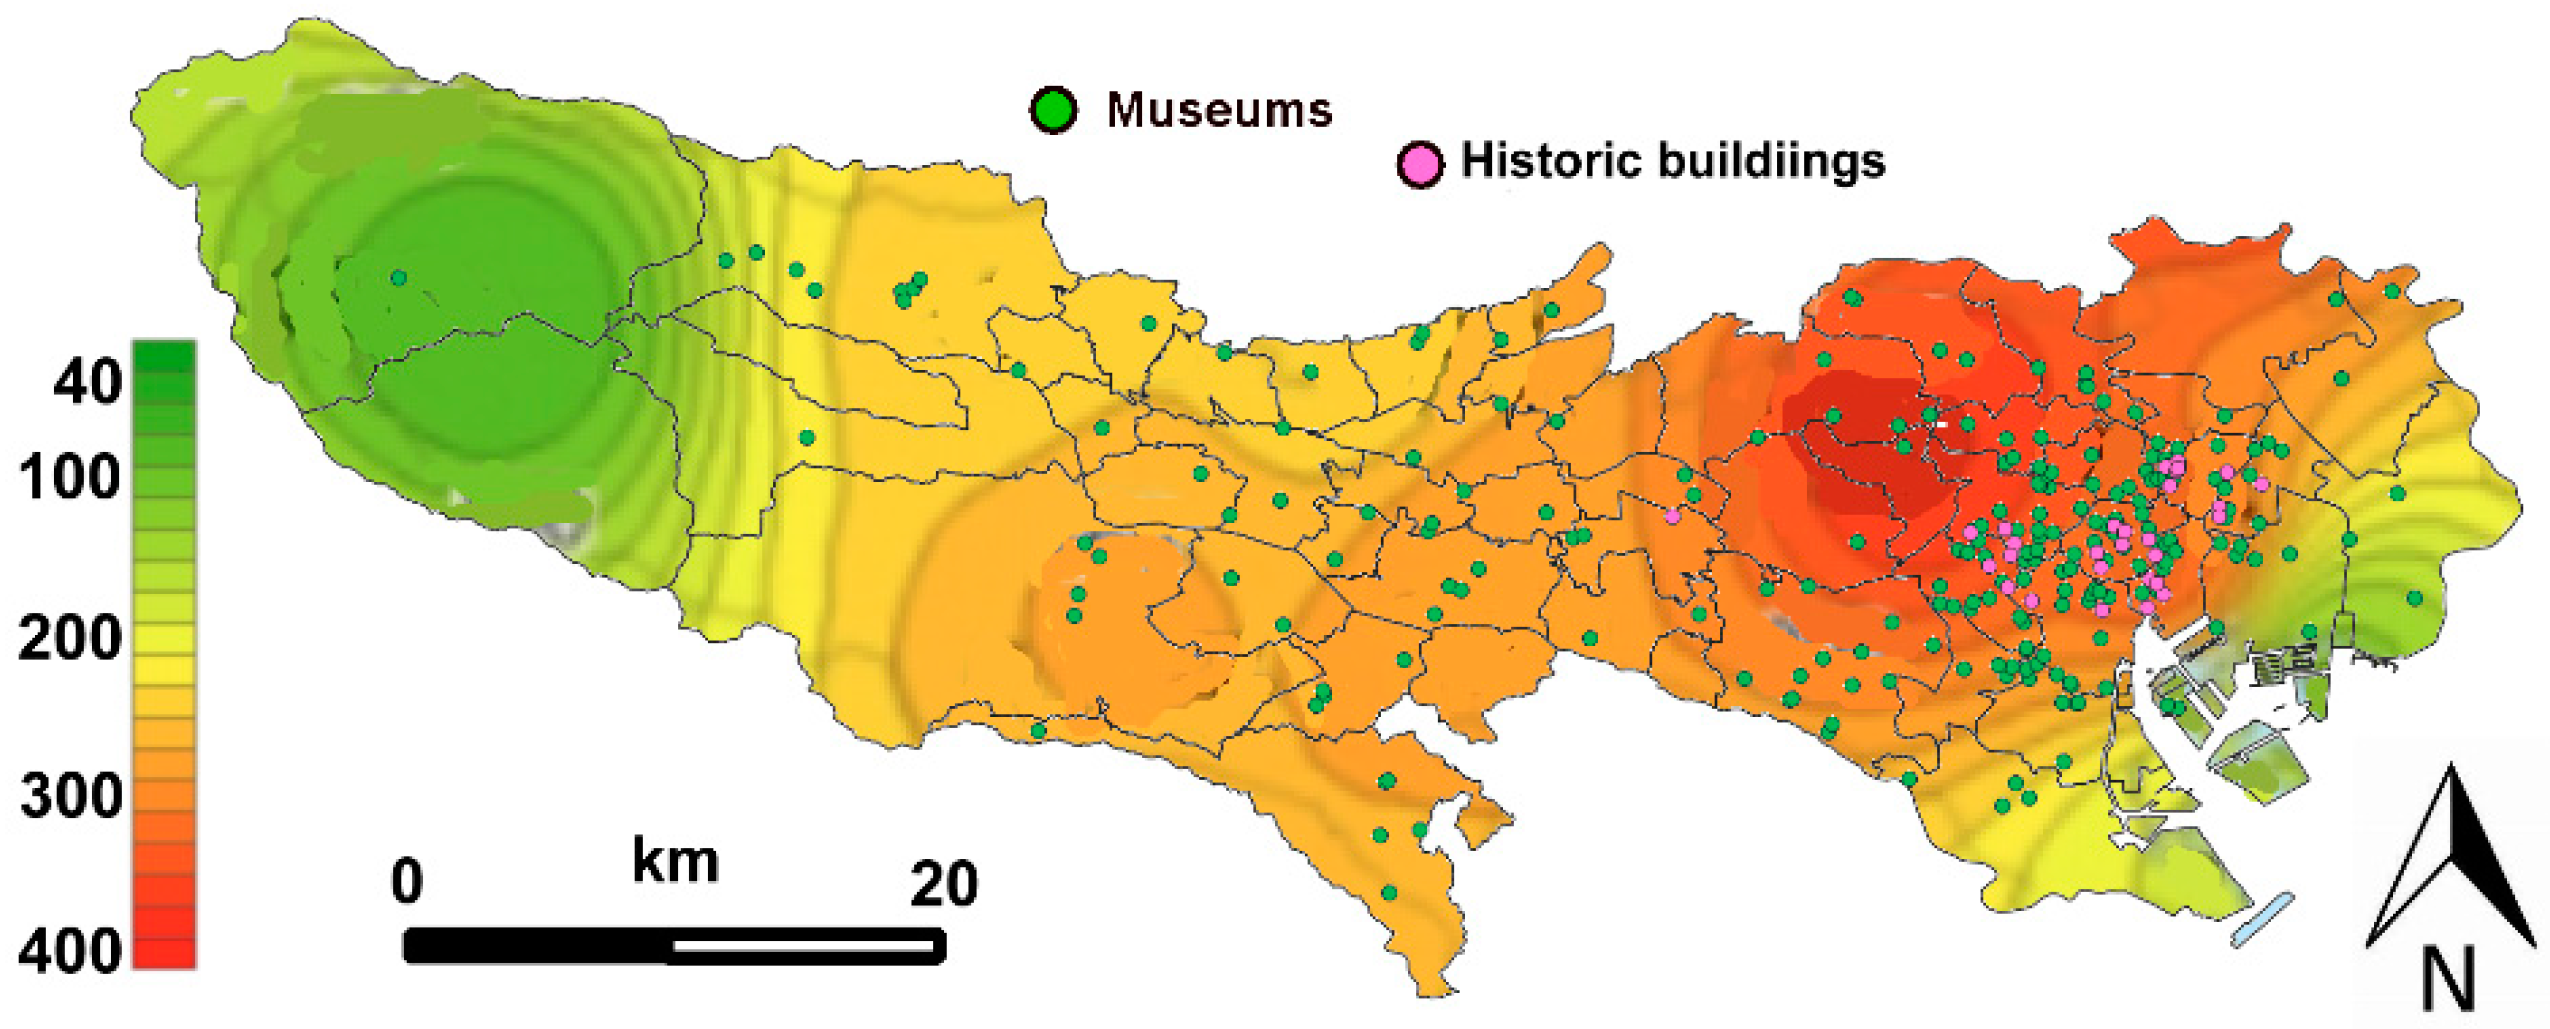
3.1. Temperature and Urban Heat Island
3.2. Storms, Typhoons and Floods

3.3. Earthquakes and Fires
3.4. Debris Flow, Slope Failure and Landslides
- Debris flow—soil and rock on a hillside or in a riverbed are washed after heavy or continuous rain, which can reach 20–40 km hr−1
- Slope failure—abrupt slope collapse under the influence of a rain or an earthquake. This occurs so suddenly that people fail to escape when it occurs near a residential area and can lead to many fatalities.
- Landslide—massive quantities of soil move slowly downslope under the influence of groundwater and gravity. The large soil mass means serious damage can occur, and once started, it is extremely difficult to stop.
3.5. Visitor Experience Under a Changing Climate
4. Discussion and Conclusions
Author Contributions
Funding
Acknowledgments
Conflicts of Interest
References
- Geospatial Information Authority of Japan (GSI): Digital Elevation Model (DEM) Download Service. Available online: https://fgd.gsi.go.jp/download/menu.php (accessed on 23 May 2020).
- Ministry of Land, Infrastructure, Transport and Tourism (MLIT). National Land Numerical Information Download Service. Available online: http://nlftp.mlit.go.jp/ (accessed on 23 May 2020).
- Sabbioni, C.; Brimblecombe, P.; Cassar, M. The Atlas of Climate Change Impact on European Cultural Heritage: Scientific Analysis and Management Strategies; Anthem Publishing: London, UK, 2010. [Google Scholar]
- Bonazza, A.; Maxwell, I.; Drdácký, M.; Vintzileou, E.; Hanus, C. Safeguarding Cultural Heritage from Natural and Man-Made Disasters: A Comparative Analysis of Risk Management in the EU; ICOMOS Open Archive: Paris, France, 2018. [Google Scholar]
- Accardo, G.; Giani, E.; Giovagnoli, A. The risk map of Italian cultural heritage. J. Arch. Conserv. 2003, 9, 41–57. [Google Scholar] [CrossRef]
- De la Fuente, D.; Vega, J.M.; Viejo, F.; Díaz, I.; Morcillo, M. Mapping air pollution effects on atmospheric degradation of cultural heritage. J. Cult. Herit. 2013, 14, 138–145. [Google Scholar] [CrossRef]
- Wang, J.J. Flood risk maps to cultural heritage: Measures and process. J. Cult. Herit. 2015, 16, 210–220. [Google Scholar] [CrossRef]
- Wu, P.S.; Hsieh, C.M.; Hsu, M.F. Using heritage risk maps as an approach to estimating the threat to materials of traditional buildings in Tainan (Taiwan). J. Cult. Herit. 2014, 15, 441–447. [Google Scholar] [CrossRef]
- Futagami, Y.; Kumamoto, T. Seimic assessment of the risks that intraplate earthquakes pose for the National Treasures of Japan—Constructing a GIS database of National Treasures that is integrated with an active fault database. Archeol. Nat. Sci. 2002, 44, 45–75. [Google Scholar]
- Futagami, Y.; Morii, M.; Kumamoto, T. Construction and Integration of GIS Databases for Risk Assessment of Nationally Designated Cultural Properties due to Earthquakes and Typhoons in Japan. In Digital Documentation, Interpretation & Presentation of Cultural Heritage, In Proceedings of the 22nd CIPA Symposium 11–15 October 2009, Kyoto, Japan; CRC Press: Boca Raton, FL, USA, 2009. [Google Scholar]
- Brimblecombe, P. Heritage climatology. In Climate Change and Cultural Heritage; Lefevre, R.-A., Sabbioni, C., Eds.; Edipuglia: Bari, Italy, 2010; pp. 54–57. [Google Scholar]
- Yanai, H.; Kumano, N.; Tamura, M.; Kuwahara, Y. Basic Research for the Estimation of Flood Damage Costs using Global Coastal Dike Information-Tokyo Bay and Ise Bay. JSCER 2019, 75, 323–330. [Google Scholar] [CrossRef]
- Yasuhara, K.; Komine, H.; Yokoki, H.; Suzuki, T.; Mimura, N.; Tamura, M.; Chen, G. Effects of climate change on coastal disasters: New methodologies and recent results. Sustain. Sci. 2011, 6, 219–232. [Google Scholar] [CrossRef]
- Hoshino, S.; Esteban, M.; Mikami, T.; Takabatake, T.; Shibayama, T. Effect of sea level rise and increase in typhoon intensity on coastal structures in Tokyo Bay. In Coastal Structures 2011; World Scientific: Singapore, 2013; Volume 2, pp. 141–152. [Google Scholar]
- Esteban, M.; Jonkman, S.N.; Hoshino, S.; Ruiz-Fuentes, M.J.; Mikami, T.; Takagi, H.; Shibayama, T.; van Ledden, M. Chapter. 33: Adaptation to Sea Level Rise in Tokyo Bay: Opportunities for a Storm Surge Barrier? In Handbook of Coastal Disaster Mitigation for Engineers and Planners; Esteban, M., Takagi, H., Shibayama, T., Eds.; Butterworth-Heinemann: Oxford, UK, 2015; pp. 723–747. [Google Scholar]
- Nakagawa, M.; Saito, M.; Yamaga, H. Earthquake Risks and Land Prices: Evidence from the Tokyo Metropolitan Area. Jpn. Econ. Rev. 2009, 60, 208–222. [Google Scholar] [CrossRef]
- de Oliveira, J.A. Why an air pollution achiever lags on climate policy? The case of local policy implementation in Mie. Jpn. Environ. Plan. A. 2011, 43, 1894–1909. [Google Scholar] [CrossRef]
- Ishikawa, Y.; Hara, H. Historical change in precipitation pH at Kobe, Japan: 1935–1961. Atmos. Environ. 1997, 31, 2367–2369. [Google Scholar] [CrossRef]
- Nagase, Y.; Silva, E.C.D. Acid rain in China and Japan: A game-theoretic analysis. Reg. Sci. Urban. Econ. 2007, 37, 100–120. [Google Scholar] [CrossRef]
- Cheng, H.; Zhang, W.; Wang, Q.; Wan, W.; Du, X. Breakthroughs, China’s Path to Clean Air 2013–2017; Clean Air Asia: Beijing, China, 2018. [Google Scholar]
- Japan Meteorological Agency (JMA). Climate Change Monitoring Report 2018 (in Japanese). 2019. Available online: https://www.data.jma.go.jp/cpdinfo/monitor/2018/pdf/ccmr2018_all.pdf (accessed on 23 May 2020).
- Historic England. Number 10: The Impact of Covid-19 on the Heritage Sector, Heritage Online Debate. 2020. Available online: https://historicengland.org.uk/whats-new/debate/ (accessed on 23 May 2020).
- Japan Meteorological Agency (JMA). Climate Change Monitoring Report 2017 (in Japanese). 2018. Available online: https://www.data.jma.go.jp/cpdinfo/monitor/2017/pdf/ccmr2017_all.pdf (accessed on 23 May 2020).
- Lee, K.; Kim, Y.; Sung, H.C.; Ryu, J.; Jeon, S.W. Trend Analysis of Urban Heat Island Intensity According to Urban Area Change in Asian Mega Cities. Sustainability 2020, 12, 112. [Google Scholar] [CrossRef]
- RealEstateJapan. Urban Heat Island Effect: Why It’s So Hot in Tokyo & What’s Being Done about It; GPlusMedia Lnc.: Tokyo, Japan, 2020. [Google Scholar]
- Ministry of the Environment, Government of Japan. General Rules of Heat Island Measures (in Japanese). Available online: https://www.env.go.jp/air/life/heat_island/taikou/taikou_h250508.pdf (accessed on 23 May 2020).
- Mikami, T. Recent progress in urban heat island studies: Focusing on the case studies in Tokyo. Euro. J. Environ. Earth Sci. 2006, 1, 79–88. [Google Scholar] [CrossRef]
- Matsumoto, J.; Fujibe, F.; Takahashi, H. Urban climate in the Tokyo metropolitan area in Japan. J. Environ. Sci. 2017, 59, 54–62. [Google Scholar] [CrossRef] [PubMed]
- Ichinose, T.; Shimodozono, K.; Hanaki, K. Impact of anthropogenic heat on urban climate in Tokyo. Atmos. Environ. 1999, 33, 3897–3909. [Google Scholar] [CrossRef]
- Mochida, A.; Murakami, S.; Ojima, T.; Kim, S.; Ooka, R.; Sugiyama, H. CFD analysis of mesoscale climate in the Greater Tokyo area. J. Wind Eng. Ind. Aerodyn. 1997, 67, 459–477. [Google Scholar] [CrossRef]
- Kiritani, K. Different effects of climate change on the population dynamics of insects. Appl. Entomol. Zool. 2013, 48, 97–104. [Google Scholar] [CrossRef]
- Doi, H. Delayed phenological timing of dragonfly emergence in Japan over five decades. Biol. Lett. 2008, 4, 388–391. [Google Scholar] [CrossRef]
- Yoshio, M.; Ishii, M. Geographical variation of pupal diapause in the Great Mormon butterfly, Papilio memnon L. (Lepidoptera: Papilionidae), in western Japan. Appl. Entomol. Zool. 1998, 33, 281–288. [Google Scholar]
- Tougou, D.; Musolin, D.L.; Fujisaki, K. Some like it hot! Rapid climate change promotes changes in distribution ranges of Nezara viridula and Nezara antennata in Japan. Entomol. Exp. Appl. 2009, 130, 249–258. [Google Scholar] [CrossRef]
- Pinniger, D.B. Ten years on-from vodka beetles to risk zones. In Integrated Pest Management for Collections; Winsor, P., Pinniger, D., Bacon, L., Child, B., Harris, K., Lauder, D., Phippard, J., Xavier-Rowe, A., Eds.; English Heritage: Swindon, UK, 2011; pp. 1–9. [Google Scholar]
- Brimblecombe, P.; Brimblecombe, C.T. Trends in insect catch at historic properties. J. Cult. Herit. 2015, 16, 127–133. [Google Scholar] [CrossRef]
- Brimblecombe, P. Policy relevance of small changes in climate with large impacts on heritage. In Cultural Heritage Facing Climate Change; Lefevre, R.-A., Sabbioni, C., Eds.; Edipuglia: Bari, Italy, 2018; pp. 25–32. [Google Scholar]
- Brimblecombe, P.; Lankester, P. Long-term changes in climate and insect damage in historic houses. Stud. Conserv. 2013, 58, 13–22. [Google Scholar] [CrossRef]
- Brimblecombe, P.; Hayashi, M. Pressures from long term environmental change at the shrines and temples of Nikkō. Herit. Sci. 2018, 6, 27. [Google Scholar] [CrossRef]
- NIES (>2010) Invasive Species of Japan, National Institute for Environmental Studies, Tsukuba-City, Japan. Available online: https://www.nies.go.jp/biodiversity/invasive/DB/detail/60500e.html (accessed on 24 May 2020).
- Marceau, L.E. One Flood, Two “Saviours”: Takebe Ayatari’s Changing Discourse on the Kanpō Floods of 1742. In Crisis and Disaster in Japan and New Zealand; Palgrave Macmillan: Singapore, 2019; pp. 13–21. [Google Scholar]
- Fiévé, N.; Waley, P. Japanese Capitals in Historical Perspective: Place, Power and Memory in Kyoto, Edo and Tokyo; Routledge: Abingdon, UK, 2013. [Google Scholar]
- Tsuguti, H.; Seino, N.; Kawase, H.; Imada, Y.; Nakaegawa, T.; Takayabu, I. Meteorological overview and mesoscale characteristics of the Heavy Rain Event of July 2018 in Japan. Landslides 2019, 16, 363–371. [Google Scholar] [CrossRef]
- Ministry of Education, Culture, Sports, Science and Technology (MECSST). Damage Information Due to Heavy Rain in July 2018 (22nd Report) (in Japanese). Available online: https://www.mext.go.jp/component/a_menu/other/detail/__icsFiles/afieldfile/2019/01/09/1407285_22_1.pdf (accessed on 23 May 2020).
- Sudden Shower over Shin-Ōhashi Bridge and Atake. Available online: https://upload.wikimedia.org/wikipedia/commons/c/cc/Hiroshige_Atake_sous_une_averse_soudaine.jpg (accessed on 23 May 2020).
- Kimoto, M.; Yasutomi, N.; Yokoyama, C.; Emori, S. Projected changes in precipitation characteristics around Japan under the global warming. Sola 2005, 1, 85–88. [Google Scholar] [CrossRef]
- Japan Meteorological Agency (JMA). Climate Change Monitoring Report 2011 (in Japanese). 2012. Available online: https://www.data.jma.go.jp/cpdinfo/monitor/2011/pdf/ccmr2011_all.pdf (accessed on 23 May 2020).
- Yonetani, T. Increase in number of days with heavy precipitation in Tokyo urban area. J. Appl. Meteorol. 1982, 21, 1466–1471. [Google Scholar] [CrossRef]
- Kanae, S.; Oki, T.; Kashida, A. Changes in hourly heavy precipitation at Tokyo from 1890 to 1999. J. Meteorol. Soc. Jpn. Ser. II 2004, 82, 241–247. [Google Scholar] [CrossRef]
- Japan Property Central (JPC). Tokyo’s Latest Flood Map Puts a Third of City in Risk Zone, Japan Property Central. 2018. Available online: https://japanpropertycentral.com/2018/04/tokyos-latest-flood-map-puts-a-third-of-city-in-risk-zone/ (accessed on 23 May 2020).
- Saraswat, C.; Kumar, P.; Mishra, B.K. Assessment of stormwater runoff management practices and governance under climate change and urbanization: An analysis of Bangkok, Hanoi and Tokyo. Environ. Sci. Policy 2016, 64, 101–117. [Google Scholar] [CrossRef]
- Yasuda, T.; Mase, H.; Mori, N. Projection of future typhoons landing on Japan based on a stochastic typhoon model utilizing AGCM projections. Hydrol. Res. Lett. 2010, 4, 65–69. [Google Scholar] [CrossRef]
- Nishijima, K.; Maruyama, T.; Graf, M. A preliminary impact assessment of typhoon wind risk of residential buildings in Japan under future climate change. Hydrol. Res. Lett. 2012, 6, 23–28. [Google Scholar] [CrossRef]
- Yang, Q.; Gao, R.; Bai, F.; Li, T.; Tamura, Y. Damage to buildings and structur54es due to recent devastating wind hazards in East Asia. Nat. Hazards 2018, 92, 1321–1353. [Google Scholar] [CrossRef]
- Furumura, T.; Takeuchi, H. Large Earthquakes Occurring beneath Tokyo Metropolitan Area and Strong Ground Motions (in Japanese). J. Geogr. (Chigaku Zasshi) 2007, 116, 431–450. [Google Scholar] [CrossRef]
- Photograph of Bevastation in the Area around Sensō-ji Temple, Asakusa after the Great Kantō Earthquake of 1923. Available online: https://commons.wikimedia.org/wiki/File:Theosakamainichi-earthquakepictorialedition-1923-page9-crop.jpg (accessed on 23 May 2020).
- Disaster Management Section Tokyo Metropolitan Government (TMG), Your Community’s Earthquake Risk 2018. Available online: https://www.toshiseibi.metro.tokyo.lg.jp/bosai/chousa_6/download/earthquake_risk.pdf (accessed on 23 May 2020).
- Cabinet Office Japan (CO). Disaster Management Japan. 1657 Edo Great Fire of the Meiji Era. 2003. Available online: http://www.bousai.go.jp/kohou/oshirase/h15/pdf/2-7.pdf (accessed on 23 May 2020).
- The Metropolitan Police Department Building Burning after the Great Kantō Earthquake. Available online: https://it.m.wikipedia.org/wiki/File:Metropolitan_Police_Office_after_Kanto_Earthquake.jpg (accessed on 23 May 2020).
- Shindo, T.; Motoyama, H.; Sakai, A.; Honma, N.; Takami, J.; Shimizu, M.; Tamura, K.; Shinjo, K.; Ishikawa, F.; Ueno, Y.; et al. Lightning occurrence characteristics in Japan for 17 years: Observation results with lightning location systems of electric power utilities from 1992 to 2008. IEEJ Trans. Electr. Electr. Eng. 2012, 7, 251–257. [Google Scholar] [CrossRef]
- Geotechnical Engineering Office, Guide to Slope Maintenance, Geoguide 5. Civil Engineering and Development Department HKSAR. 2018. Available online: https://www.cedd.gov.hk/filemanager/eng/content_113/eg5_20181120.pdf (accessed on 23 May 2020).
- Grossi, C.M.; Brimblecombe, P.; Lloyd, H. The effects of weather on visits to historic properties. Views 2010, 47, 69–71. [Google Scholar]
- Cuffe, H.E. Rain and museum attendance: Are daily data fine enough? J. Cult. Econ. 2018, 42, 213–241. [Google Scholar] [CrossRef]
- Audience Insight Pack; National Trust: Swindon, UK, 2015; pp. 1–11.
- Grossi, C.M.; Brimblecombe, P.; Esbert, R.M.; Alonso, F.J. Color changes in architectural limestones from pollution and cleaning. Color. Res. Appl. 2007, 32, 320–331. [Google Scholar] [CrossRef]
- Brimblecombe, P.; Hayashi, M. Perception of the relationship between climate change in Japan and traditional wooden heritage in Japan. In Public Archaeology and Climate Change; Dawson, T., Nimura, C., Lopez-Romero, E., Daire, M.-Y., Eds.; Barnsley: Oxbow, UK, 2017; pp. 288–302. [Google Scholar]
- Snow Scene at Kinryuzan Buddist Temple, Asakusa District. Available online: http://mercury.lcs.mit.edu/~jnc/prints/8snow.html (accessed on 23 May 2020).
- Portalsite of Hazardmap. Available online: https://disaportal.gsi.go.jp/index.html (accessed on 23 May 2020).


| Target River | Design Storm | Rainfall | Cities Affected |
|---|---|---|---|
| Shibakawa River, New Shibakawa River | Accounts for current development of river and drainage channels, regulating ponds, etc. Rise of Shibakawa River after heavy rain that occurs every 100 years. Inundation from overflow and collapse of levees. | September 1958 flood, Kanogawa Typhoon or Typhoon Ida: 2 days rain 411 mm | Adachi, Katsushika |
| Kandagawa River | Inundation potential from the Kandagawa River due to the Tokai heavy rain accounting for channel maintenance. Depth from both river water and inside the levee. | September 2000 Tokai heavy rainfall: rain 589 mm, hourly maximum 114 mm | Chiyoda, Chuo, Shinjuku, Bunkyo, Taito, Shibuya, Nakano, Suginami, Toshima, Musashino, Mitaka |
| Tonegawa River | Account for current state of river channel and flood control. Simulates expectation from heavy rain once in 200 years. | Tonegawa River basin and upper Yattajima: 3 days rain 318 mm | Adachi, Katsushika, Edogawa |
| Edogawa River | Simulates Edogawa River overflow due to heavy rain that occurs about once every 200 years. | Upper Yattajima: 3 days rain 318 mm | Adachi, Katsushika, Edogawa |
| Arakawa River | Accounts for current state of the Arakawa River river channel and flood control. Simulates Arakawa River overflows due to heavy rain every 200 years. | Arakawa basin; 3 days rain 548 mm | Chiyoda, Chuo, Minato, Taito, Sumida, Koto, Kita, Arakawa, Itabashi, Adachi, Katsushika, Edogawa |
| Nakagawa River, Ayasegawa River | Accounts for current state of channel and flood control. Simulates Nakagawa and Ayasegawa River overflows due to 100-year heavy rain, but only inundation from Edogawa River. | Nakagawa and Ayase basins: 48 h rain 355 mm | Adachi, Katsushika |
| Tamagawa River, Oogurigawa River | Accounts for current state of channel and flood control. Simulates Tamagawa River overflow due to a 200-year heavy rain. | Tamagawa River basin and the upstream area of Ishihara site: 2 days rain 457 mm | Ota, Setagaya, Hachioji, Tachikawa, Ome, Fuchu, Akishima, Chofu, Hino, Kunitachi, Fukuo, Komae, Tama, Inagi, Hamura, Akiruno |
| Asakawa River | Accounts for development of river channels. Simulates Asakawa River overflows due to a 200-year heavy rain. | Tamagawa River basin and the upstream area of Ishihara site: 2 days rain 457 mm | Hachioji, Hino, Tama |
| Elevation/m | Museums | Historic Buildings |
|---|---|---|
| 0–0.5 | 4 | 3 |
| 0.5–1.0 | 10 | 1 |
| 1.0–2.0 | 8 | 2 |
| 2.0–5.0 | 13 | 5 |
| >5.0 | 0 | 1 |
© 2020 by the authors. Licensee MDPI, Basel, Switzerland. This article is an open access article distributed under the terms and conditions of the Creative Commons Attribution (CC BY) license (http://creativecommons.org/licenses/by/4.0/).
Share and Cite
Brimblecombe, P.; Hayashi, M.; Futagami, Y. Mapping Climate Change, Natural Hazards and Tokyo’s Built Heritage. Atmosphere 2020, 11, 680. https://doi.org/10.3390/atmos11070680
Brimblecombe P, Hayashi M, Futagami Y. Mapping Climate Change, Natural Hazards and Tokyo’s Built Heritage. Atmosphere. 2020; 11(7):680. https://doi.org/10.3390/atmos11070680
Chicago/Turabian StyleBrimblecombe, Peter, Mikiko Hayashi, and Yoko Futagami. 2020. "Mapping Climate Change, Natural Hazards and Tokyo’s Built Heritage" Atmosphere 11, no. 7: 680. https://doi.org/10.3390/atmos11070680
APA StyleBrimblecombe, P., Hayashi, M., & Futagami, Y. (2020). Mapping Climate Change, Natural Hazards and Tokyo’s Built Heritage. Atmosphere, 11(7), 680. https://doi.org/10.3390/atmos11070680