Article

Spatiotemporal Variations and Health Implications of Hazardous Air Pollutants in Ulsan, a Multi-Industrial City in Korea

1
Environment, Health and Welfare Research Center, National Agenda Research Division, Korea Institute of Science and Technology, Seoul 02792, Korea
2
National Center for Fine Dust Information, Ministry of Environment, Cheongju 28166, Korea
3
Air Pollution Engineering Division, National Institute of Environmental Research, Incheon 22689, Korea
4
Department of Environmental Engineering, Korea National University of Transportation, Chungju 27469, Korea
5
Department of Infra System, Hanseo University, Seosan 31692, Korea
6
Department of Environmental Engineering, Yeungnam University, Gyeongsan 38541, Korea
*
Author to whom correspondence should be addressed.
Atmosphere 2020, 11(5), 547; https://doi.org/10.3390/atmos11050547
Submission received: 18 March 2020 / Revised: 21 May 2020 / Accepted: 22 May 2020 / Published: 25 May 2020
(This article belongs to the Special Issue Health Impact Assessment of Air Pollution)

Abstract

:
We measured a wide range of hazardous air pollutants (HAPs) simultaneously at five sites over four seasons in 2009–2010 in Ulsan, the largest industrial city in Korea. Target analytes included volatile organic compounds (VOCs), carbonyls, polycyclic aromatic hydrocarbons (PAHs), phthalates, and heavy metals (HMs). The objectives of this study were to evaluate the occurrence and spatiotemporal distributions of HAPs, and to identify important HAPs based on health risk assessment. Industrial emissions affected ambient levels of VOCs and HMs, as demonstrated by spatial distribution analysis. However, concentrations of PAHs and phthalates were relatively uniform at all sites. VOCs and HMs exhibited little seasonal variation, while formaldehyde increased in the summer due to its secondary formation. PAHs exhibited notable seasonal variation; higher in cold seasons and lower in warm seasons. Cumulative cancer risks imposed by 35 HAPs were 4.7 × 10⁻⁴ and 1.7 × 10⁻⁴ in industrial and residential areas, respectively. The top five major cancer risk drivers appeared to be formaldehyde, benzene, benzo[a]pyrene, As, and Co. The sums of hazard quotients (HQ) derived by 47 HAPs were 10.0 (industrial) and 2.4 (residential). As the individual species, only two HAPs exceeded the HQ of 1, which are As (3.1) and Pb (2.1) in the industrial area. This study demonstrated the importance of a comprehensive monitoring and health risk assessment to prioritize potentially toxic pollutants in the ambient air of a large industrial city.

1. Introduction

Hazardous air pollutants (HAPs, often known as air toxics) have become a concern in many countries [1,2,3,4,5,6,7], largely due to public awareness of the importance of environmental health [8,9,10,11]. According to the United States Environmental Protection Agency (USEPA), HAPs are defined as pollutants that are known or suspected to cause cancer or other serious health effects, such as reproductive effects or birth defects, or have adverse effects on ecology or the environment [10].
Various classes of organic and inorganic chemicals belong to the HAP category, including volatile organic compounds (VOCs), polycyclic aromatic hydrocarbons (PAHs), dioxins, pesticides, phthalates, and heavy metals (HMs) [12,13,14]. Among them, VOCs and PAHs have received special attention because many are considered human carcinogens and are ubiquitous in the ambient air to which the general public is routinely exposed [1,2,3,4,5,6,7]. In addition, some HAPs are bioaccumulative and persistent in the environment [13,15]. Therefore, long-term exposure to various HAPs, even at low ambient levels, may have adverse effects on human health and the environment due to their nonthreshold nature of toxicity as well as the combined risk caused by exposure to multiple pollutants [9,13,16]. Depending on legal, socioeconomic, and industrial circumstances, different countries list different numbers of individual chemicals or classes of chemicals as HAPs; e.g., the USA lists 187 air toxics [12]; Japan, 248 [17]; and Korea, 35.
The significance of urban air toxics is justified because they generally tend to pose greater risks to a larger population and are produced by a wider variety of emission sources than HAPs in nonurban areas [18]. Furthermore, public health risks from urban air toxics can be increased due to simultaneous exposure to multiple pollutants from various emission sources, including stationary and mobile sources. Risk assessment for urban air toxics involves a set of procedures and requires a variety of input factors, among which monitoring of ambient air quality is a crucial step that provides exposure data for the general public. An accurate estimation of the exposure level depends on a large amount of ambient concentration data. In general, a huge body of data is available for criteria pollutants, but there is a lack of sufficient data for HAPs in many countries. The most likely reason for the scarcity of ambient data for some HAPs is that measurement often requires sophisticated sampling and analytical skills. It is impractical to measure and regulate the myriad of air toxics that exist in urban areas. Accordingly, there is a long-standing recognition of a need to identify the most important HAPs in a specific area to efficiently reduce health risks. In this respect, effective air quality management systems should prioritize HAPs based upon the relative risks posed by many different types of pollutants. For example, the USEPA identified 30 urban air toxics among 187 HAPs that are expected to pose the greatest potential health threat in urban areas [18]. Similarly, the Japanese Ministry of the Environment prioritized 23 toxics among 248 HAPs, taking into consideration their toxicity, ubiquity, and abundancy [17].
Ulsan is the largest industrial city in Korea, with a population of more than 1.2 million. As Korea’s largest industrial cluster for automotive, shipbuilding, petrochemical, and nonferrous metallic industries, the city economically accounts for 12.5% of the total industrial output of Korea [19]. However, the contribution of air pollutant emissions from this city has also been substantial, as much as its economic contribution. According to the Pollutant Release and Transfer Registers (PRTR) data in Korea [20], the city of Ulsan was second among 17 local governments in Korea, with an annual amount of 8,211 tons of toxic chemical emissions as of 2012, which accounts for 16.1% of Korea’s emissions nationwide. Among multi-industrial activities in Ulsan, the petrochemical, oil refinement, and nonferrous metal industries are likely to be major sources of VOCs and PAHs due to the nature of their operational processes [21,22]. In addition, shipbuilding and car manufacturing industries are potential sources of VOCs and HMs [23]. Although automobile emissions are probably the most common source of HAPs in typical urban areas, industrial emissions may be a more significant contributor in a heavily industrialized city, such as Ulsan. Therefore, the adverse impacts of industrial activities on ambient levels of HAPs in nearby residential areas are a matter of great concern in Ulsan.
A number of studies have been conducted on the air pollution of Ulsan, but most of them focused on criteria pollutants [24,25,26]. In relation to HAPs, only a few studies have been conducted within and around the city, i.e., VOCs [27], PAHs [21,22,28], and HM studies [23,29,30]. However, each of these studies was conducted sporadically and focused on only one category of HAPs. Therefore, current knowledge is still not comprehensive enough to identify major HAPs based on health risks in the Ulsan area. This is primarily because ambient concentration data for a wide spectrum of HAPs, covering VOCs, PAHs, and HMs, is lacking. These data are essential to assess more realistic exposure levels and to characterize their spatial and temporal distributions. Another important deficiency is a lack of information on the cumulative effects of multipollutants on human health [4,9].
In this context, we carried out an intensive ambient air monitoring of various HAPs for one year at several locations in Ulsan, representing industrial and residential areas. More than 130 chemical species in vapor or particulate phases were simultaneously measured, including VOCs, carbonyls, PAHs, phthalates, and trace elements. The measured data were then used to identify HAPs that may pose the greatest health risks (both carcinogenic and noncarcinogenic) by a deterministic screening approach for human health risk assessment [1,2,3,4,6,7,31,32,33]. The objectives of this study were (i) to investigate the occurrence of HAPs and their distribution characteristics in the ambient air, along with the spatial and temporal variations in their concentrations, (ii) to evaluate the impact of industrial activities on atmospheric HAPs in Ulsan City, and (iii) to identify and prioritize important HAPs in Ulsan based on health risk assessments.

2. Materials and Methods

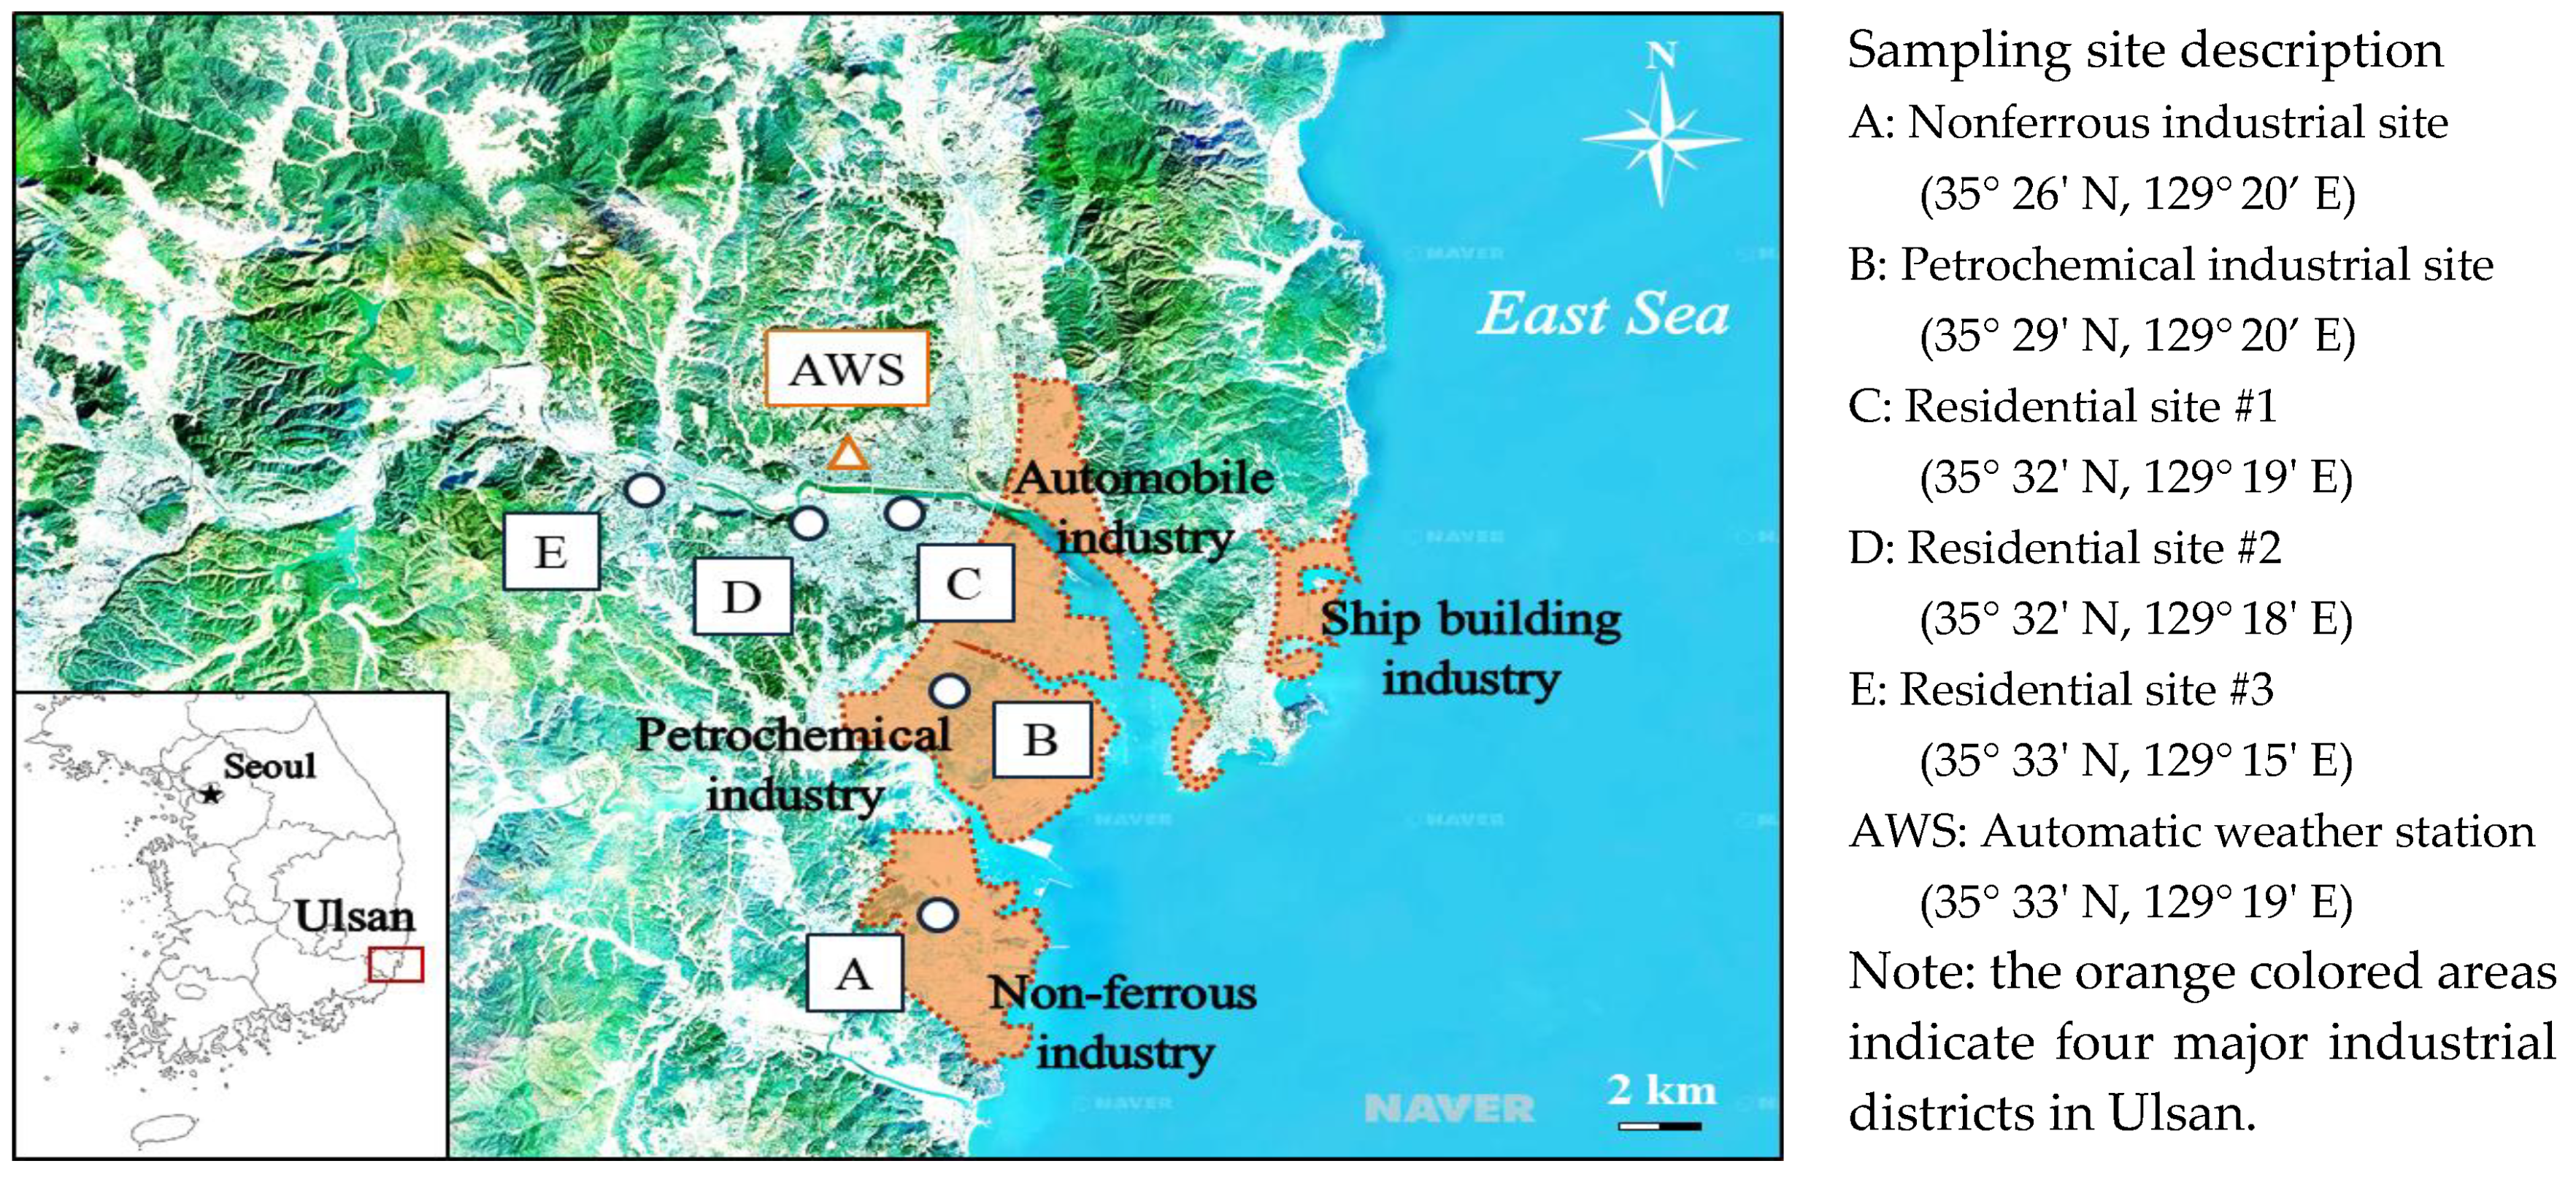
2.1. Study Area and Sampling Sites

Ulsan is located at the southeastern end of the Korean Peninsula, approximately 400 km southeast of the capital, Seoul (Figure 1). There are two national industrial complexes (i.e., Ulsan-Mipo and Onsan) and 10 local complexes in the Ulsan area, which can be geographically classified into four groups: (i) Onsan district, with a nonferrous metallic industrial complex and two large oil refineries; (ii) Yeocheon district, where Korea’s largest petrochemical industrial complex is located; (iii) Yangjeong district, housing a large scale automobile industry, such as Hyundai Motors; and (iv) Mipo district, home of the world’s largest shipyard. To provide information on the magnitude of HAP emissions from the four industrial districts in Ulsan, PRTR data for airborne toxic chemicals emitted from the four districts in 2010 are summarized in Table S1 [20].
A total of five sampling sites (two industrial and three residential) were selected to measure the HAPs in the Ulsan area (Figure 1). All sites were well-prepared for air sampling purposes in terms of electricity and vandalism, as these sites all belonged to the National Ambient Air Quality Monitoring Network in Korea. Site A (Hwasan) was located in the center of the Onsan national industrial complex, and samplers were installed on the rooftop of a container house in open spaces with no building within a 50 m radius, and where traffic was low. Site B (Bugok) was within the Ulsan-Mipo national industrial complex, and the sampling equipment was placed on the rooftop of a building at an elevation of ~15 m, where there was relatively low traffic. The sampling equipment for the three nonindustrial sites was placed on rooftops, ~12 to 15 m above ground level. Site C (Samsan) was in the center of the city, where commercial and residential areas were mixed. Site D (Shinjung) was in a typical residential area, surrounded by many schools and low-rise houses with low traffic. Site E (Mugeo) was located in a relatively new town, where large numbers of shops, restaurants, and high-rise apartments were mixed. Site E was in an area generally known as the gateway to the city, with heavy traffic due to the tollgate of a highway being located within 2 km.

2.2. Sampling Periods and Weather Conditions

Air sampling was conducted over four seasons in 2009–2010. In each season, samples were collected over eight consecutive days at each site. Details of sampling periods and weather conditions are presented in Table 1, together with number of samples collected in each season. Weather data were obtained on an hourly basis from the Automatic Weather Station in Ulsan (Figure 1). The prevailing wind directions during the sampling periods varied from season to season, but in general they were westerly. In the spring, westerly and easterly winds were mixed, but south-southwest winds dominated in the summer. However, westerly and northwest winds were most frequent in autumn and winter, respectively. Seasonal wind-roses in Ulsan were presented in Figure S1. The average wind speeds in autumn and winter were lower than those in spring and summer, possibly causing adverse effects on air pollution mitigation during the cold seasons.

2.3. Sampling and Analysis of Vapor Phase HAPs

The measurement protocol of VOCs was similar in principle to the USEPA TO-17 method [34]. VOC samples were collected at a flow rate of 100 mL/min for 4 h on stainless steel adsorbent tubes (0.6 × 9 cm, Perkin Elmer, London, UK), using personal pumps equipped with a mass flow controller (FLEC 1001, Chematec, Denmark). For continuous sampling over a day at each site, sequential automatic tube samplers (STS 25, Perkin Elmer, UK, and MTS32, Markes, Wales, UK) were used, thereby six samples per day were obtained. As a result, a total of 960 effective samples were obtained. Each tube was packed with 120 mg of Carbograph-2 (20/40 mesh) in the front position and 280 mg of Carbograph-1 (40/60 mesh) in the back position. Before sampling, the adsorbent tubes were preconditioned with a He gas flow of 80 mL/min at 250 °C for 2 h using a thermal conditioner (TC-20, Markes, Wales, UK).
The analysis of VOCs was performed using an automatic thermal desorption apparatus (Unity/Ultra, Markes, Wales, UK) and gas chromatography with mass spectrometry (GC/MS, HP6890/5973, Hewlett-Packard, Palo Alto, CA 94304, USA). Thermal desorption of VOCs adsorbed onto the tube was carried out at 300 °C with a flow rate of 50 mL/min for 10 min. The eluted VOCs were transferred to a cold trap (packed with 12 mg of Tenax-TA and 47 mg of Carbopack B) maintained at −15 °C. Subsequently, the cold trap was rapidly heated to 320 °C and maintained at that temperature for 5 min. The VOCs were then injected into a capillary column (Rtx-1, 0.32 mm × 105 m × 1.5 μm, Restek, Bellefonte, PA 16823, USA). The temperature of the GC oven was initially set to 50 °C for 10 min, and then increased to 250 °C at a rate of 5 °C/min. The flow rate of the carrier gas (helium) in the column was maintained at 1.13 mL/min, while the outlet split flow of the thermal desorber was set at 10 mL/min. Two standard mixtures (i.e., gas and liquid) were used together for identification and calibration purposes. For the gas standard, a mixture of 62 components (EPA TO-15/17 Calibration Mix, 1 ppm, Supelco, Bellefonte, PA 16823, USA) and a mixture of 41 components (TO-14A Calibration Mix, 1 ppm, Restek, Bellefonte, PA 16823, USA) were used. For example, acrylonitrile was not included in the 62 Mix, but this compound was calibrated with the 41 Mix. Some VOCs were unavailable in the gas standard mixtures, so a liquid standard mixture was prepared with individual standards, including naphthalene, N,N-dimethylformamide, epichlorohydrin, nitrobenzene, aniline, phenol, 2-methoxyethanol, 2-ethoxyethanol, and 2-ethoxyethyl acetate (Sigma-Aldrich, St. Louis, MI 48880, USA). These 9 VOCs have been of concern in Korea, and are included among the 48 priority air toxics. Aliquots of the liquid standard mixtures (100 μg/mL each) were spiked into clean tubes using a packed column GC injector at 300 °C and a He flow rate of 100 mL/min for 1 min [35]. Five very volatile VOCs (propylene, ethanol, Freon 12, chloromethane, and Freon 114) were excluded from the target analytes because these compounds were found to be inefficiently collected by the adsorbent tubes.
Carbonyls were collected on cartridges packed with 2,4-dinitrophenylhydrazine-impregnated silica (LpDNPH S10x, Supelco, Bellefonte, PA 16823, USA) at a flow rate of 1 L/min for 2 h using personal pumps (SKC, Eighty Four, PA 15330, USA). To avoid sampling defects, ozone scrubbers (Supelco Inc., Bellefonte, PA 16823, USA) were placed in front of the cartridges [36]. The carbonyls were extracted with 4 mL of acetonitrile, and then analyzed by high-performance liquid chromatography (HPLC) with UV detection at 360 nm (Shimadzu LC-9A HPLC system, Japan). Chromatographic separations were carried out using a solvent gradient elution at a flow rate of 1.0 mL/min on a Restek Ultra C18 analytical column (4.6 mm × 15 cm, 5 μm particle size) in a column oven at a constant temperature of 35 °C. The mobile phase consisted of two parts, A (methanol 100%) and B (water 50% and methanol 50%). The gradient elution was programmed from 70% B to 15% B over 20 min, followed by column washing with 100% A for 5 min. In total, 16 carbonyls were determined using a carbonyl standard mixture (Aldehyde-Ketone-DNPH TO-11A Calibration Mix., Restek, Bellefonte, PA 16823, USA) and a standard for 2-butanone (Restek, Bellefonte, PA 16823, USA). In this study, carbonyl samples were taken three times per day at each site in each season; morning (9 to 11 a.m.), afternoon (2 to 4 p.m.), and evening (6 to 8 p.m.). Some samples were lost due to sampling artifacts (particularly on rainy days) or malfunction of the personal pumps. Consequently, a total of 452 carbonyl samples were obtained.

2.4. Sampling and Analysis of Particulate Phase HAPs

Airborne suspended particulate matter (SPM) samples were collected on quartz fiber filters (8” × 10” QMA, Whatman, Clifton, NJ 07014, USA) using high-volume air samplers (TE-PNY1123, Tisch Environmental Inc., Cleves, OH 45002, USA) over a 24 h period at a flow rate of ~600 L/min. Prior to use, the filters were precleaned with HPLC-grade methanol by ultrasonication for 2 h, followed by heat treatment at ~400 °C for 4 h to remove any remaining organic matter. The pretreated filters were equilibrated in a desiccator under conditions of constant temperature (20 ± 1 °C) and relative humidity (45 ± 5%) for 24 h, and then weighed before sampling. The particle filters were divided into four equal parts: two of which were used for PAH/phthalate analysis, and the remaining two were used for the determination of SPM, and trace elements. To determine the mass concentration of SPM, two pieces (4.45 cm diameter each) were clipped from a portion of the filter sample with a circular knife and weighed after 24 h equilibration under conditions identical to the pre-sampling conditions.
Although atmospheric PAHs and phthalates are present in vapor and particulate phases, we focused on only the particulate phase of those compounds because carcinogenic PAHs/phthalates are mostly found in particle samples [15,21,37,38]. Meanwhile, we measured naphthalene, which is one of volatile PAHs of environmental concern, as a VOC. A solvent extraction system (Soxtec 2055, Foss, 8022 Zürich, Switzerland) was used to extract PAHs and phthalates from the filters. The samples were extracted with 80 mL of an acetone/hexane mixture (1:9, v/v) for 40 min at 145 °C, and then rinsing was carried out at a rate of 40−50 times per hour for 100 min. Prior to the extraction, the filter samples were spiked with an aliquot (100 μL) of a mixture (11.765 μg/mL each) of five surrogate standards (SS) for PAHs, including naphthalene-d8, acenaphthene-d10, phenanthrene-d10, chrysene-d12, and perylene-d12 (Z-014J, AccuStandard, New Haven, CT 06513, USA), and another aliquot (100 μL) of a mixture (~20 μg/mL each) of two SS for phthalates (dibutyl phthalate-d4 and dioctyl phthalete-d4, ChemService, West Chester, PA 19380, USA). The extracted samples were first concentrated to ~4 mL using a vacuum evaporator (RapidVap, Labconco, Kansas City, MO 6413, USA) with N2 gas. Subsequently, the concentrated samples were passed through an anhydrous sodium sulfate cartridge (Bond Elut, Agilent Technologies, Santa Clara, CA 95051, USA) to remove any water in the organic phase [39], and finally concentrated to 0.5 mL. The samples were then analyzed by gas chromatography/mass spectrometry (GC/MS) (6890N/5973i, Agilent Technologies, Santa Clara, CA 95051, USA) in selected ion monitoring mode after spiking with 100 μL of a mixture (~10 μg/mL each) of four internal standards (IS) for PAHs, including acenaphthylene-d8, pyrene-d10, benz[a]anthracene-d12, and benzo[a]pyrene-d12 (Cambridge Isotope Lab., Tewksbury, MA 01876, USA), and another 100 μL (20.758 μg/mL) of 1-phenyldodecane (Sigma-Aldrich, St. Louis, MI 48880, USA), which was used as an IS for the phthalates. A fused-silica capillary column (DB-5MS, 0.25 mm × 30 m, 1 μm, J & W Scientific, Folsom, CA 95630, USA) was used for separation with an oven temperature program as follows: the oven was initially set to 70 °C for 1 min, then the temperature was increased to 205 °C at a rate of 15 °C/min and again to 325 °C at a rate of 8 °C/min, and then held for 15 min. The flow rate of carrier gas (He) was constant at 1.2 mL/min throughout the GC run. The injector temperature was set to 300 °C, and 2 μL of each sample was injected by an autosampler in splitless mode. The standard reference material (SRM) 2260a (NIST, Gaithersburg, MD 20899, USA), a mixture of 36 PAHs, was used as the calibration standard for the PAHs, while the EPA phthalate esters 6 mixture (Supelco, Bellefonte, PA 16823, USA) was used for the phthalates. The quantitation of PAH/phthalate concentrations was conducted by the IS method, and all concentration data were corrected by the recovery rates of the corresponding SS [39]. Field blank filters were also treated by the same procedure as above, and no significant contamination was found.
Portions (3.3 cm diameter each × 6) of the filter samples were utilized for the analysis of trace elements. The elements were extracted by a hydrochloric-nitric acid solution (16.75% and 5.55% (v/v), respectively) using a microwave digestion system (Ethos, Milestone, Italy), and then analyzed using inductively coupled plasma-atomic emission spectrometry (ICP-AES) (Optima 3000RL, Perkin Elmer, Waltham, MA 02451, USA), according to the USEPA IO-3.4 method [40]. The ICP multielement standard solution IV (Merck, Darmstadt, Germany) was used as the calibration standard. Only toxic HMs (As, Cd, Co, Mn, Ni, Pb, Se, V) were selected in this study. Hexavalent chromium (Cr(VI)) in ambient air was measured separately, following a protocol developed by the USEPA [41]. To measure the Cr(VI), particle samples were collected using cellulose filter papers (No. 41, 37 mm diameter, Whatman, Clifton, NJ 07014, USA) and filter packs at a flow rate of 10 L/min for 24 h. Each filter paper was precleaned with a nitric acid solution (10%, v/v), followed by deionized water, and then dried in a glove box filled with N2 gas (99.999%). Once dried, the filter was impregnated with NaHCO3 (0.12 M) to be used as a sampling medium. After sampling, Cr(VI) was extracted by ultrasonication in the glove box for 1 h with 10 mL of 20 mM NaHCO3. The extracted samples were then analyzed using ion chromatography (IC) (DX-120, Dionex, Sunnyvale, CA 94085, USA), equipped with IonPac-NG1 and IonPac-AS7 (Dionex, Sunnyvale, CA 94085, USA) as the guard and analytical columns, respectively. More details of the sampling and analysis of Cr(VI) can be found in the literature [42].

2.5. Quality Control (QC) and Quality Assurance (QA)

The uncertainty of HAPs concentration data was evaluated with respect to QC/QA, which is summarized in this section for each category of the HAPs. The analytical precisions of individual VOCs were all less than 20%. Method detection limits (MDL) were estimated according to the USEPA guidelines [34,43] and ranged from 0.01 to 0.12 ppb for a typical air volume of 24 L. Two labs independently analyzed parts of 26 pairs of duplicate samples collected in the ambient air of an industrial area. The mean duplicate precisions (MDP) for toluene, ethylbenzene, m-/p-xylenes, and trichloroethylene (TCE) were 27.5%, 22.6%, 17.3%, and 19.2%, respectively, while that for benzene was 32.1%. Although more volatile compounds appeared to be less accurate (for example, 50.7% for dichloromethane), most VOCs displayed MDPs less than 30%, a recommended criterion in the TO-17 method [34]. The analytical precisions of carbonyl compounds were less than 2.5%; the MDLs were between 0.02 and 0.03 ppb. The MDPs for formaldehyde and acetaldehyde were 14.6% and 19.1%, respectively, while the other carbonyls agreed within a range of 30%.
The performance of the PAH measurement was also evaluated in terms of its analytical repeatability, MDL, extraction efficiency, and accuracy, according to the USEPA TO-13A protocol [39]. The mean repeatability of GC response factors and retention times for the 36 PAHs were 5.2% and 0.2%, respectively. Meanwhile, those for the six phthalates were 7.3% and 0.2%, respectively. The MDLs for PAHs were found to be in the range of 0.02 ng/m3 for benzo[a]pyrene (BaP) to 0.12 ng/m3 for coronene, assuming an air volume of 800 m3. The MDLs for phthalates were all higher than those for PAHs, ranging from 0.29 ng/m3 for dimethyl phthalate to 2.24 ng/m3 for di(2-ethylhexyl)phthalate (DEHP). The mean recovery rate for the 19 PAHs of 80.1% (ranging from 61.5% to 98.5%). Similarly, the recovery efficiency for the six phthalates was 93.6% (ranging from 81.8% to 99.5%). The recovery rate and accuracy of the PAH data were further examined using SRM1649a (Urban Dust, NIST, Gaithersburg, MD 20899, USA). The mean relative error (MRE) for the 20 PAHs certified in the SRM1649a ranged from 2.0% for chrysene to 37.0% for indeno[1,2,3-c,d]pyrene.
The analytical precision of toxic HMs appeared to range from 2.0% for Mn and Pb to 15.9% for Se. The estimated MDLs were in a range of 0.11 ng/m3 for Cd to 2.17 ng/m3 for Pb, assuming a typical air sampling volume of 800 m3. The recovery rates of HMs were evaluated using SRM1648 (Urban Particulate Matter, NIST, Gaithersburg, MD 20899, USA). Overall, HMs showed good recovery rates, ranging from 82.7% for Cd to 109.3% for Ni, with the exception of Se (24.5%). The Se data were corrected for recovery efficiency, because its poor recovery appeared to be due to a systematic error. The precision of Cr(VI) measurements was 6.5%. The recovery efficiency and MDL were 96.5% and 0.13 ng/m3, respectively.

2.6. Toxicity Information and Health Risk Assessment

In general, there are two approaches in the assessment of human health risks, i.e., the deterministic (point estimation) and stochastic (Monte-Carlo simulation) exposure assessment [44]. We applied the deterministic approach to this study as a screening tool for investigating which HAPs are most likely to cause significant health impacts for the residents of Ulsan. The deterministic estimation has been used in several studies [1,3,6,7,31,32,33], although there are some limitations such as the uncertainties associated with the breath rate and exposure duration, etc. In this study, the potential public health risk was evaluated only for long-term (chronic) inhalation exposure to air toxics, with respect to cancer and noncancer effects. The cancer and noncancer risks for a HAP were calculated using the following equations according to USEPA’s guidance [45]:
Cancer risk = Exposure concentration (μg/m3) × Inhalation unit risk (µg/m3)−1
Noncancer risk = Exposure concentration (μg/m3)/Reference concentration (µg/m3)
In this study, it was assumed that the measured concentration of a specific HAP is equal to the exposure concentration [45]. The inhalation unit risk (IUR) values were taken from the USEPA [46,47], the California EPA [48], and the World Health Organization (WHO) [49]. The noncancer risk for a specific HAP was expressed as a hazard quotient (HQ), and the reference concentrations (RfC) were taken from the USEPA [46,47,50]. When the RfC for a specific substance was not available, its respective reference exposure level (REL) from the California EPA [48] or minimal risk level (MRL) from the US Agency for Toxic Substances and Disease Registry (ATSDR) [51] were used as the RfC. The toxicity information was first obtained from the USEPA Integrated Risk Information System (IRIS) [47], and then (in order of preference) the estimate provided by the California EPA [48], the US ATSDR [51], the Health Effects Assessment Summary Tables (HEAST) [50], or the Provisional Peer-reviewed Toxicity Values (PPRTVs) [52] was used. If two or more toxicity values differed for one chemical, the more conservative (health-protective) value was adopted. Chemicals without any IUR, RfC, REL, or MRL values were not included from the risk assessment process. The toxicity values applied to individual HAPs are compiled in Table S2 [47,48,50,51,52], Table S3 [44,45,46,47,48,49,51,52], and Table S4 [53,54,55,56].

3. Results and Discussion

3.1. Occurrence of Vapor Phase HAPs in Ambient Air

Among more than 80 target VOCs, we found that 24 VOCs were detected in more than 50% of samples, and 11 other VOCs were found in 10% to 50% of samples. The VOCs that were detected universally in all samples were benzene, toluene, formaldehyde, and acetone, as opposed to 17 compounds that were not detected in any samples. For statistical analysis, one half of the MDL value was substituted for data below the MDL [3,43]. The concentrations of selected VOCs for each site are summarized in Table 2. Benzene, formaldehyde, and TCE were the VOCs of utmost concern because of their carcinogenic nature and ubiquity [46,49,57]. Exposure to other VOCs, such as toluene, ethylbenzene, and xylenes, also cause adverse health effects on humans [14,49]. Although 1,3-butadiene and vinyl chloride are known to be human carcinogens, they were rarely detected in this study and also appeared at very low concentrations.
As shown in Table 2, VOC concentrations ranged widely, not only between sites but also between compounds. Overall, VOC levels were higher in industrial sites (Sites A and B) than in nonindustrial sites (Sites C, D, and E). For example, average levels of hexane and styrene ranged from 0.80 ppb (at Site C) to 98.20 ppb (Site B), and 0.03 ppb (Site D) to 16.69 ppb (Site B), respectively. Site B, where the highest concentrations for the two compounds (hexane and styrene) were observed, was surrounded by large-scale chemical and petrochemical industries. It is likely that the higher levels of hexane and styrene were associated with oil refinery and polystyrene synthesis plants located in the petrochemical industrial complex.
Benzene, a well-known carcinogen, showed an average concentration of 1.53 ppb and 0.33 ppb in industrial and residential areas, respectively. The average levels of benzene in residential areas appeared to be substantially lower than the NAAQS (~1.5 ppb). However, benzene levels in industrial areas, especially in the petrochemical industrial complex (Site B), appeared to be significant, and its annual average concentration (1.81 ppb) exceeded the NAAQS. These results imply that local sources may have significantly impacted the occurrence of VOCs in ambient air at each sampling site. The most abundant VOCs in residential areas appeared to be formaldehyde (an average of 3.45 ppb for Sites C, D, and E), followed by acetone (3.07 ppb), acetaldehyde (1.65 ppb), and toluene (1.59 ppb). Formaldehyde is also an identified carcinogen, equally ubiquitous in indoor and outdoor air, and is regarded both as a primary and secondary pollutant [58]. Excluding the carbonyls, the BTEX group (benzene, toluene, ethylbenzene, and xylenes) exhibited a generally higher concentration than other VOCs; a result that has been observed in many typical urban and industrial areas in Korea [27,35,59,60,61]) and other countries [4,62,63,64].

3.2. Occurrence of Particulate Phase HAPs in Ambient Air

A statistical summary of ambient concentrations of SPM and particulate HAPs at each site is shown in Table 3, where co-eluted PAHs were expressed as the sum of them. The average level (142.0 μg/m3) of SPM at Site A (located in the nonferrous industrial complex) was substantially higher than that observed at the other four sites (102.9 to 108.5 μg/m3), and the difference appeared to be statistically significant (p < 0.05). The PAHs detected universally in all samples were fluoranthene and pyrene. However, dibenz[a,e]pyrene was not detected in any of the particle samples. Among the 36 target PAHs, 23 exhibited a detection frequency (DF) of 50% or more. All six phthalates were detected in more than 50% of all samples. On the other hand, the DFs of toxic HMs ranged from 38.8% for Se to 100% for Cd, Mn, and Ni. Vanadium data were excluded because its DF was only 6.3%.
The highest concentration of PAH appeared to be fluoranthene at 0.84 ng/m3 (as the average of five sites), followed by pyrene (0.79 ng/m3) and benzo[b+j]fluoranthene (0.75 ng/m3). The average of BaP, a well-known carcinogenic PAH, was 0.33 ng/m3 with a range of 0.29 (Sites B and D) to 0.42 ng/m3 (Site E). Locational variations in the mean concentrations of PAHs were not as distinct as those for the VOC levels. Interestingly, the mean levels of PAHs in many cases appeared to be higher at Site E than at the other sites. The sum of the USEPA 16 priority PAHs and the sum of the 36 PAHs were also highest at Site E (average values of 7.31 ng/m3 and 9.28 ng/m3, respectively). Site E was located in a mixed residential-commercial area with heavy traffic, and hence the elevated PAH levels might be attributed to the effect of vehicle exhaust, especially that of diesel vehicles. As of 2010, the total number of vehicles registered in Ulsan was 440,735, of which 35% were diesel vehicles [19]. Moreover, the traffic volume of heavy-duty trucks and container carriers to and from the industrial complexes were observed to be very high; this is likely because Site E was located near the gateway that connects Ulsan City with other cities in Korea. The phthalate concentrations were also higher in a residential area (Site C) than in industrial areas. Phthalates are plasticizers that are widely used as additives in polyvinyl chloride resins and other plastic materials. They are potentially carcinogenic and endocrine-disrupting, and they are also ubiquitous in both indoor and outdoor air [65,66]. We found that DEHP and dibutyl phthalate (DBP) were the most common phthalates in the ambient air of Ulsan; a finding that agreed with those of other studies [38,66].
In contrast to the PAHs and phthalates, the mean concentrations of HMs were all significantly higher (2 to ~20 times higher) at sampling sites in industrial areas than those in residential areas (p < 0.05), indicating that industrial activities had a significant impact on the ambient levels of HMs. In particular, the mean concentration of Pb at Site A (0.55 μg/m3) in the Onsan nonferrous industrial complex was found to have exceeded the NAAQS (0.5 μg/m3 as an annual average). Furthermore, the average concentration (1.4 μg/m3) of Cr(VI) at Site B in the Ulsan-Mipo industrial complex appeared to have been the highest among major industrial complexes scattered all over the country [42]. In addition to large petrochemical plants, numerous machinery and transportation equipment companies were located in the Ulsan-Mipo complex [67].

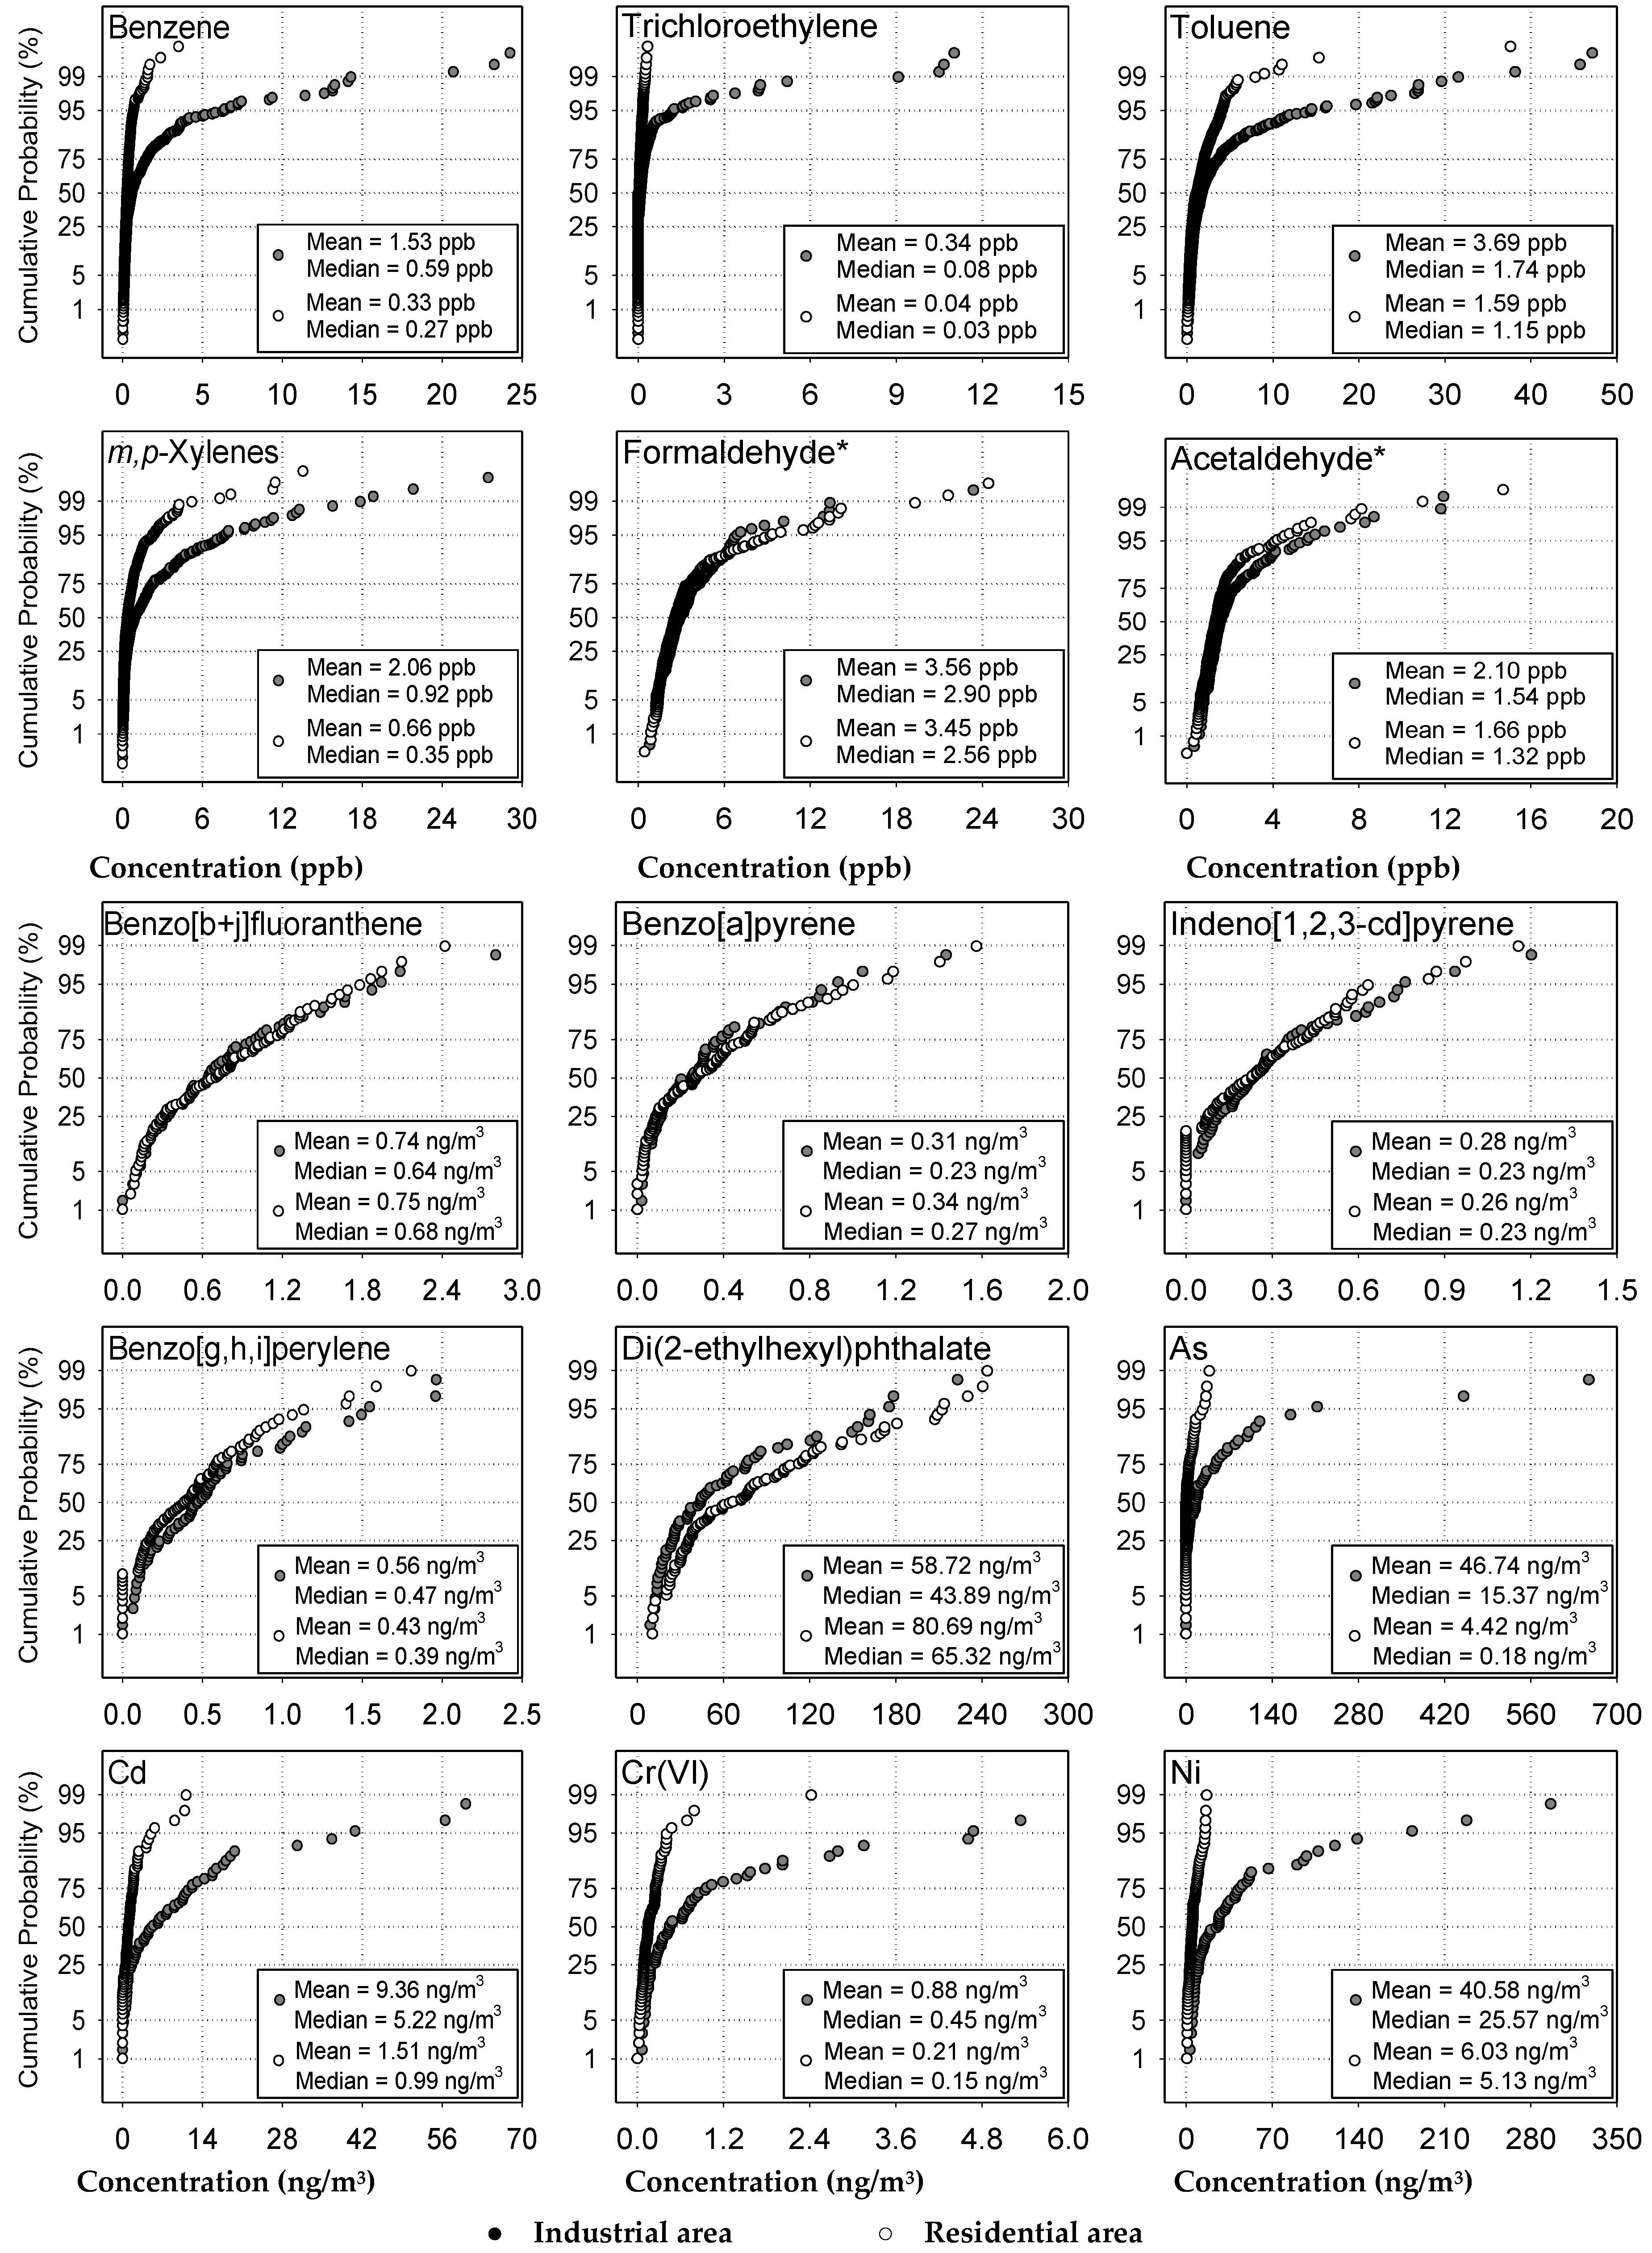
3.3. Comparison of HAPs Levels between Industrial and Residential Areas

To investigate the impacts of industrial emissions on the occurrence of individual HAPs in the ambient air, all the measured HAPs data were divided into two groups: industrial (pooling the data from Sites A and B) and residential (pooling the data from Sites C, D, and E). Comparisons of cumulative probabilities of concentration data of selected HAPs in vapor and particulate phases between the two groups are shown in Figure 2. Two distinct patterns are observed. Among VOCs, benzene, TCE, toluene, and m-/p-xylenes showed much higher levels in industrial areas than in residential areas (p < 0.05), whereas no statistically significant differences were found for formaldehyde and acetaldehyde (p > 0.05). Among particulate phase HAPs, the concentrations of HMs differed significantly between industrial and residential areas (p < 0.05), while ambient levels of PAHs did not show statistically significant differences between the two groups (p > 0.05). The mean concentrations of DEHP and DBP were observed to be slightly higher in the residential areas than in the industrial areas, but there was no significant difference between them (p > 0.05). These results indicated that the major sources of high concentration VOCs and HMs were industrial emissions from both the petrochemical and nonferrous industrial complexes.
However, there was no clear evidence of potential impacts of industrial sources on the occurrence of carbonyls and PAHs in the ambient air of Ulsan. The atmospheric behavior of formaldehyde and acetaldehyde is presumed to be different from other VOCs, as not only are they produced from primary sources, such as industrial emissions or vehicle exhaust, but they also formed in the atmosphere by photochemical oxidation under strong solar radiation and high temperatures [58,68]. The PAH data clearly demonstrated that industrial activities were not the only sources of PAHs in this area. In typical nonindustrial urban areas, automobile emissions have been identified as the most significant sources of PAH, to which diesel vehicles contributed more than the gasoline cars [22,37,69]. Therefore, PAH concentrations in Ulsan have also been influenced by vehicle exhaust and combustion of fossil fuels for space-heating in residential areas, in addition to emissions from local sources in large industrial complexes.

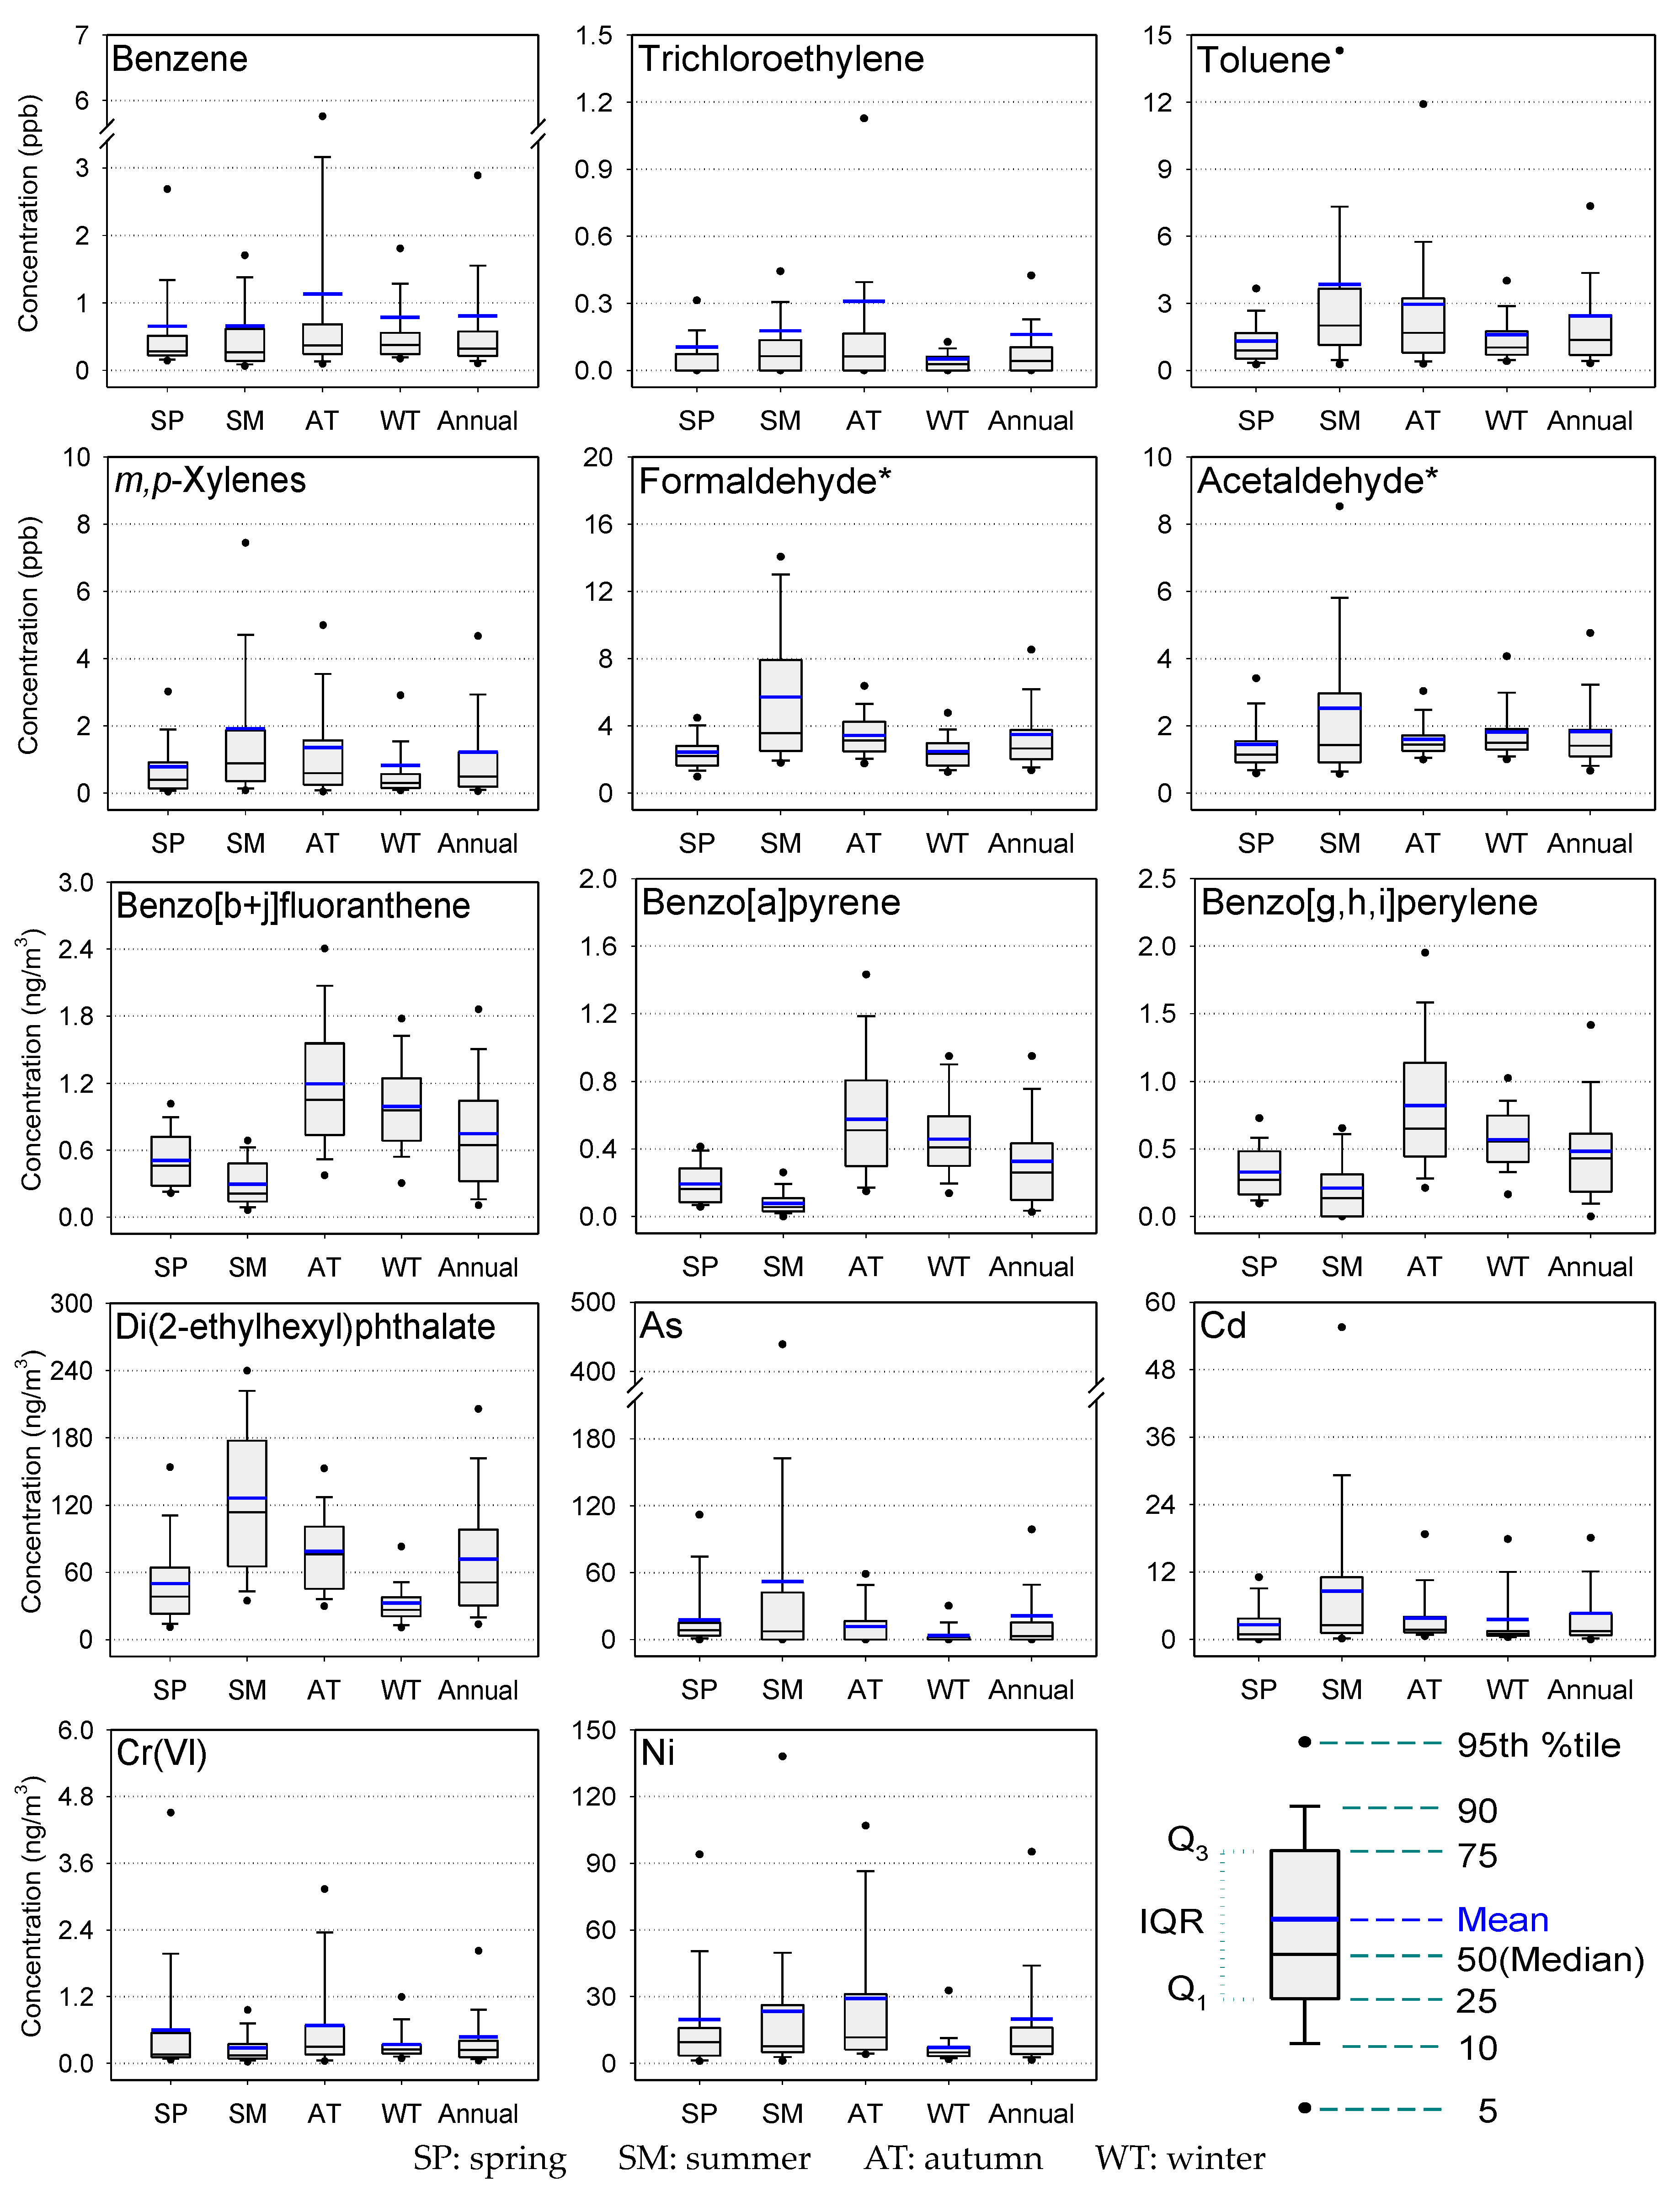
3.4. Seasonal Variation in HAP Concentrations

To investigate the seasonality of HAP concentrations, seasonal average values of the total concentrations of 66 VOCs, 13 carbonyls, 36 PAHs, six phthalates, and eight HMs at each site are summarized in Table 4. In addition, important air toxics from each HAP category were selected, and then their data for each season were compared in Figure 3. There were different patterns of seasonal variations in the concentrations of individual HAPs. Assuming that the industrial activities in the Ulsan area did not vary significantly according to the season, the fugitive emission of volatile substances was expected to be larger in summer than in winter. This assumption was partially confirmed by this study because both the sum of 66 VOCs and the individual VOCs showed always the maximum concentrations in the industrial area in summer. As shown in Figure 3, overall and in general, VOCs (except carbonyls) showed less variation throughout the year compared to PAHs. However, VOCs related to industrial emissions, such as toluene and xylenes, exhibited relatively higher levels in summer than in other seasons. The increased levels of VOCs in summer are attributable to the effect of wind directions. In the Ulsan area, the frequency of south winds in the summer was substantially higher than in other seasons (Table 1 and Figure S1). These wind directions might be an unfavorable condition for dispersing air pollutants from industrial sources, as the major industrial complexes are located upwind of the monitoring sites, particularly in summer. Seasonal concentrations of formaldehyde and acetaldehyde also substantially increased during the summer, possibly due to secondary formation by photochemical reactions.
The seasonal concentrations of SPM were higher in autumn (a seasonal average of 157.9 μg/m3) than in other seasons (89.4 to 104.5 μg/m3). In autumn 2009, severe haze pollution persisted for four days (from October 19 to 22) over the Ulsan metropolitan area. During this period, the average values of SPM at the five sampling sites ranged from 122.8 (Site C) to 192.7 μg/m3 (Site A), with a maximum of 240.7 μg/m3 (Site A). The ambient levels of SPM tended to increase rapidly under haze pollution events with a low wind speed condition because of the enhanced conversion of vaporous substances into particles and an accelerated particle aggregation rate [70]. Based on the meteorological data of this area (Table 1), the average wind speed in autumn (1.8 m/s) was comparatively lower than in the other seasons (2.4−3.1 m/s). This was important because wind speed plays a vital role in dispersing air pollutants, as the persistence of atmospheric concentrations of pollutants from ground-level sources is inversely proportional to the wind speed. For two days (October 21 to 22), the wind speed was notably lower (<0.8 m/s), which caused the atmosphere to become stagnant.
In contrast to VOCs, the seasonality of PAH concentrations appeared to be much clearer, as seen with the three examples of PAHs shown in Figure 3. In typical urban areas, increased PAH levels are generally expected during the winter, depending on the amount of fossil fuel combustion [2,37,71,72]. In this study, however, autumn was when the highest PAH concentrations were found, followed by winter, spring, and summer. The seasonal averages of BaP were 0.19 ng/m3 and 0.08 ng/ m3 in spring and summer, respectively. However, the averages in autumn and winter increased to 0.58 ng/m3 and 0.46 ng/m3, respectively, with a maximum value of 1.57 ng/m3 (on October 22 at Site E). The higher levels of PAHs in autumn are attributed to the meteorological condition in the city during the autumn campaign, as mentioned above for the seasonal variation of SPM. PAH levels commonly display a “high in cold season and low in warm season” pattern in temperate zones [71,72]. Similarly, we attributed the elevated levels of PAHs observed during the cold months in Ulsan to many reasons, including: (i) increased usage of heating fuels during the cold season; (ii) stagnation and stabilization of the atmosphere in winter; (iii) enhanced phase transformation from vapor to particles; and (iv) generation of incomplete combustion products due to the cold start of diesel vehicles in winter [73].
In addition, the increased levels of PAHs during the cold seasons might be influenced by local sources outside Ulsan as well as transboundary pollution from neighboring countries such as China and North Korea [74,75]. There is a large iron-steel industrial complex 50 km north of Ulsan, including primary steel production plants. The iron-steel industry essentially consumes large amounts of fossil fuels, resulting in enormous emissions of air pollutants, such as SO2, NOx, PM, VOCs, and PAHs [37]. In China and North Korea, the use of coal for space heating increases during the period from October to March [75,76], thereby leading to increased PAH emissions. The inference on the impact of transboundary transport of PAHs during the cold seasons was supported by the Hybrid Single-Particle Lagrangian Integrated Trajectory (HYSPLIT) modeling [77]. As an example, backward trajectories of air parcels that arrived in Ulsan during the ‘haze episode’ (October 19–22, 2009) were presented in Figure S2. In contrast to PAHs, phthalate concentrations were highest in summer (DEHP was presented as an example). The higher levels in the summer were likely associated with enhanced evaporation under high ambient temperatures because the emission rates of phthalates generally increase as a function of temperature [78]. Ambient levels of HMs in the Ulsan area showed no specific seasonal pattern (Figure 3). Therefore, unlike other air pollutants associated with the burning of fossil fuels for residential heating, HMs in this area are generally believed to be emitted primarily by industries, which operate regularly throughout the year. Consequently, seasonal variation can be insignificant for HMs.

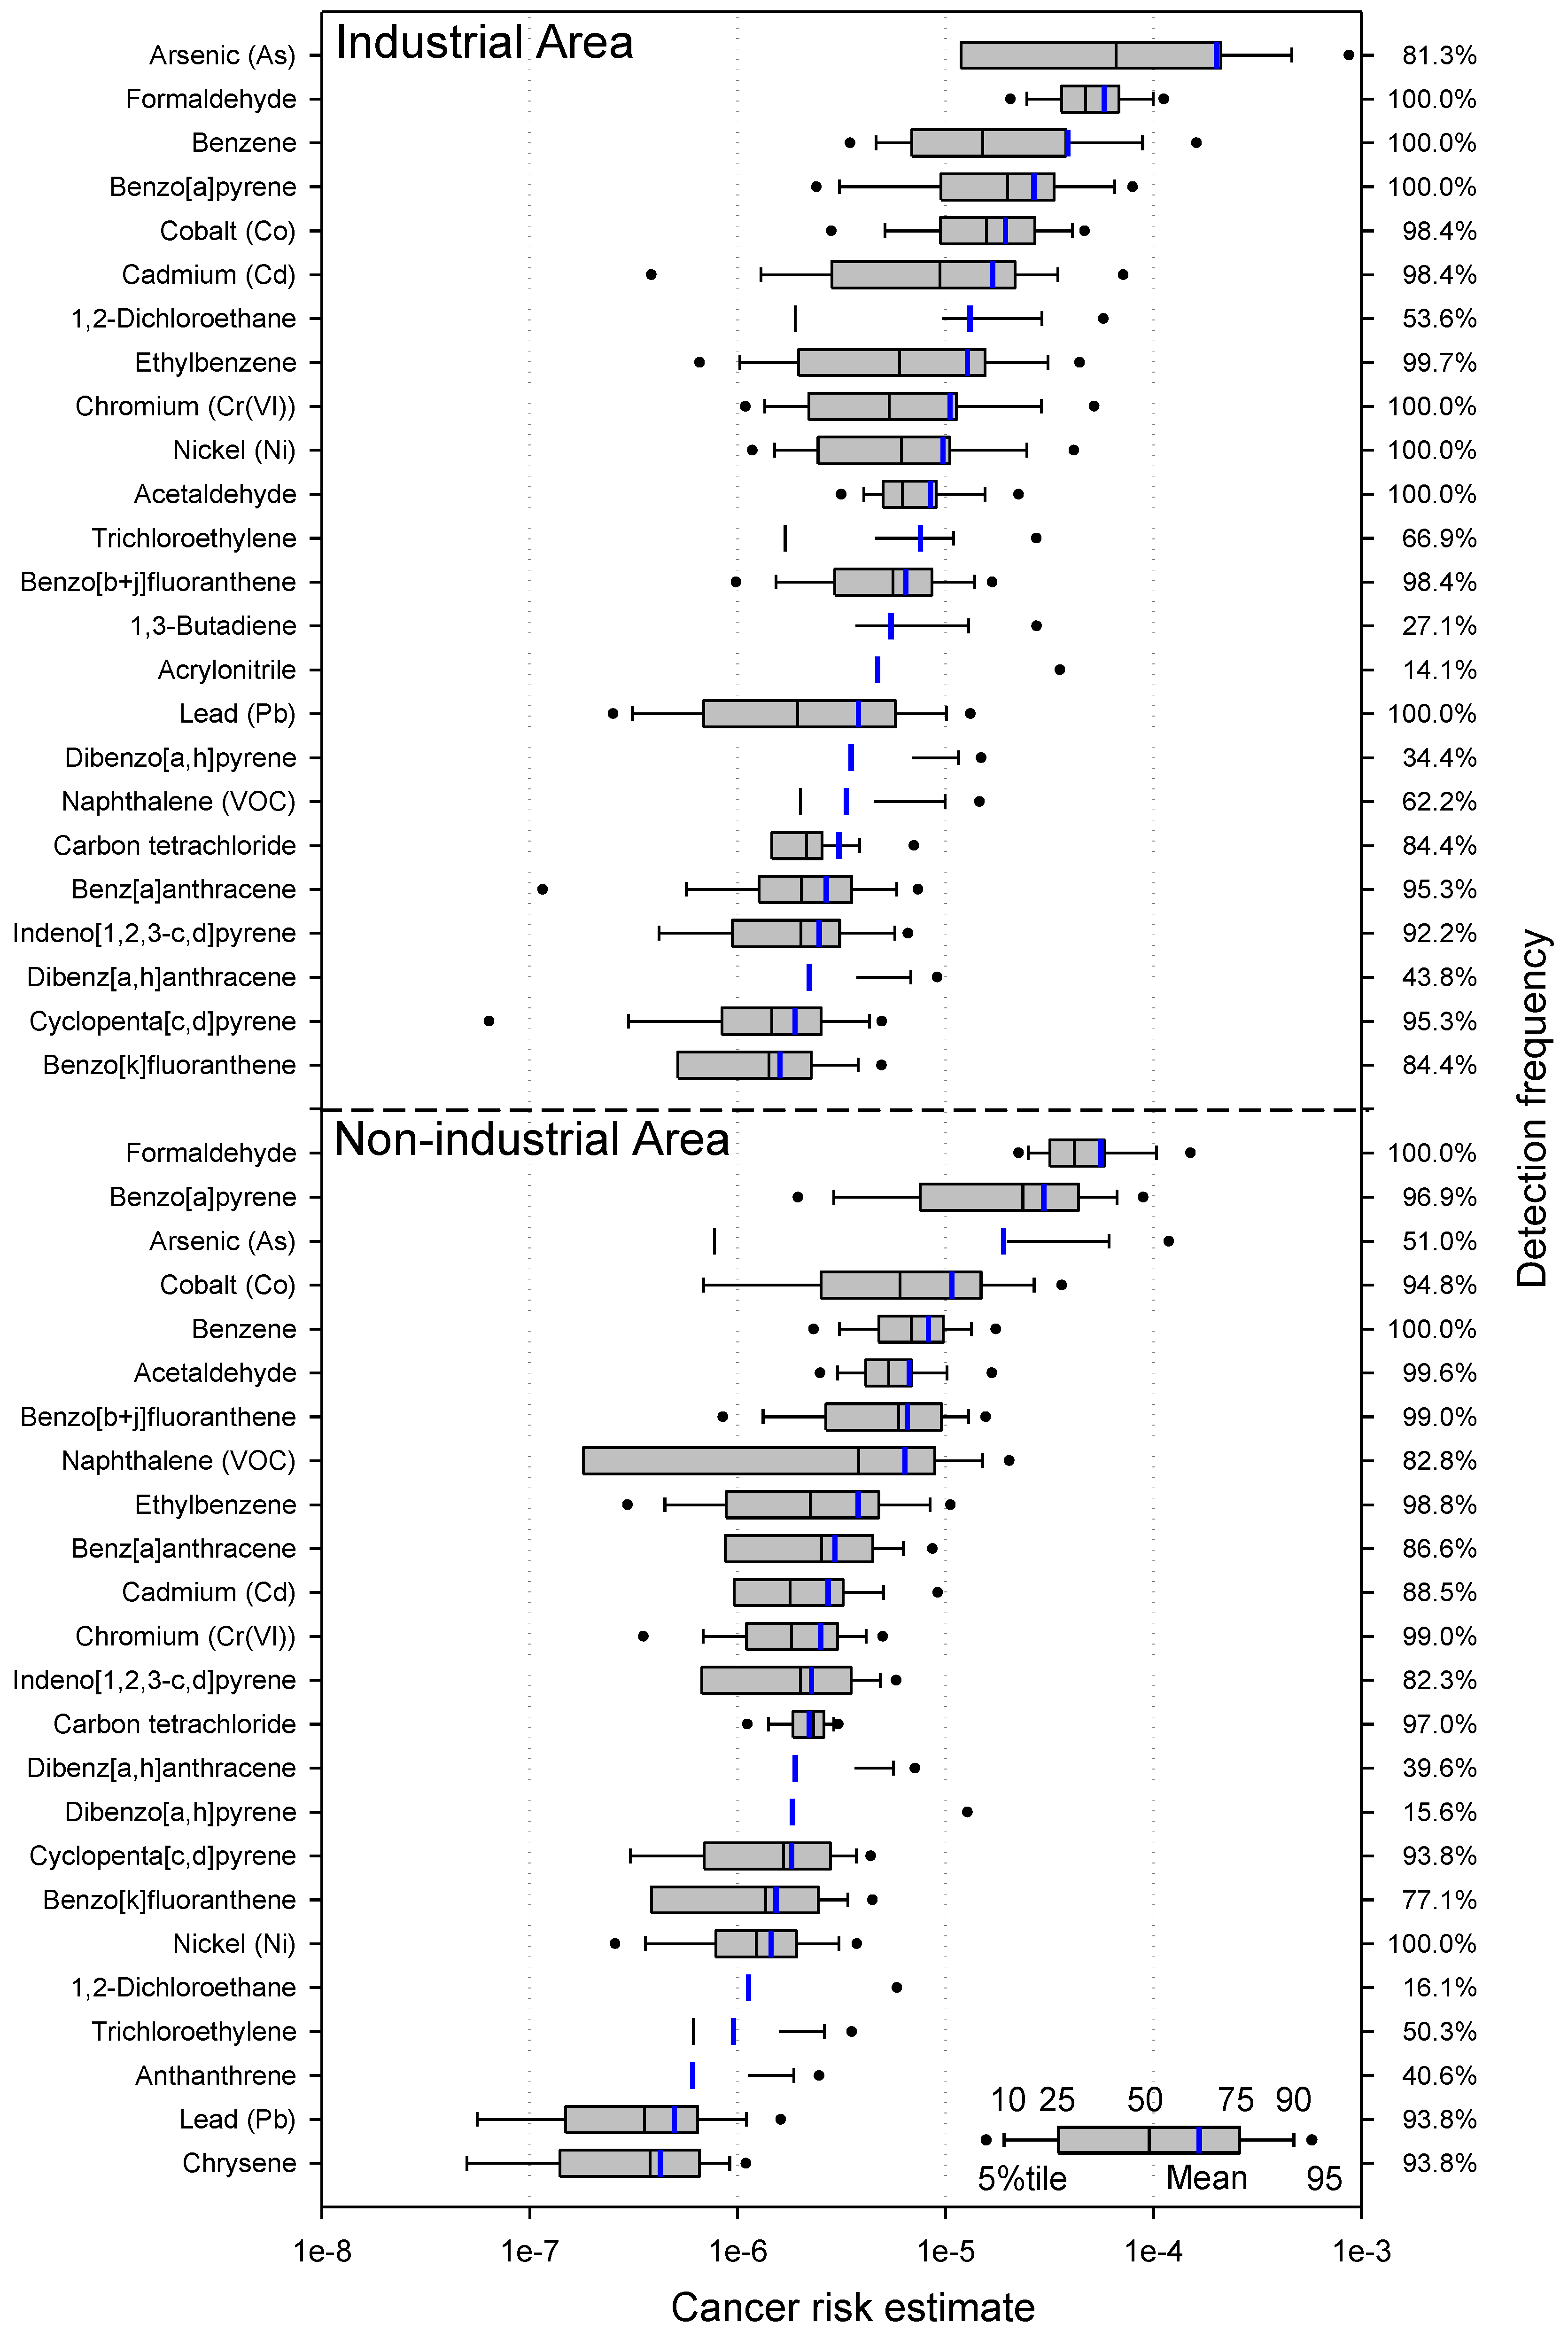
3.5. Health Risk Assessment for Carcinogenic HAPs

The cancer risk for an individual HAP was estimated by multiplying the ambient average concentration of the compound by its corresponding IUR. The IUR is defined as the upper-bound excess lifetime cancer risk estimated to result from continuous exposure to an agent at a concentration of 1 μg/m3 in air [45]. The USEPA generally deems health risks to be significant if cancer risk exceeds the acceptable risk range of 1 × 10⁻⁶ to 1 × 10⁻⁴ [79]. Among more than 130 target analytes measured in this study, the IUR data were available for 50 HAPs (Tables S1 and S2). Consequently, only 35 HAPs were included in the risk assessment, excluding HAPs with lower DF (<20%). The distributions of cancer risk estimates for the top 25 contributors in industrial and nonindustrial (residential) areas are presented in Figure 4, where the panels were arranged by rank according to mean values. The point estimates of cancer risks for the 35 HAPs are presented in Table S4.
As shown in Figure 4, the cancer risk levels for individual species were generally higher in the industrial areas than in the residential areas. The risk levels ranged between 2.0 × 10⁻⁴ for As and 1.1 × 10⁻⁹ for dichloromethane in the industrial areas, whereas they ranged from 5.6 × 10⁻⁵ for formaldehyde to 6.1 × 10⁻¹⁰ for dichloromethane in the residential areas. The cumulative cancer risks associated with exposure to the 35 HAPs listed in Table S4 were 4.7 × 10⁻⁴ (industrial areas) and 1.7 × 10⁻⁴ (residential areas), both of which exceeded the tolerable risk level proposed by the USEPA. These levels appeared to be comparable with the cumulative risks that were estimated at air pollution hot spots in Memphis, Tennessee (2.3 × 10⁻⁴) [3], Portland, Oregon (2.47 × 10⁻⁴) [33], California (3.0 × 10⁻⁴) [32], and at the largest Mediterranean industrial site in Spain (4.6 × 10⁻⁴) [4]. However, these levels were much higher than those estimated in Edmonton, Canada (less than 1.0 × 10⁻⁵) [1] and Seattle, Washington (4.3–6.0 × 10⁻⁵) [6,7]. Importantly, any direct comparison of cumulative cancer risks between this study and other studies needs to be cautious because results can vary greatly, depending on the number of HAPs included in the risk assessment. Comparison of the cancer risks posed by a variety of HAPs in Ulsan City with other areas in Korea was not possible, because no risk assessment data for such a large number of HAPs as were measured in this study were available.
The contributions of HAP subgroups to the total cancer risk were notably different in two areas. In the industrial area, the HM group contributed 55.7% to the cumulative risks, followed by the VOC group (33.8%) and the PAH-phthalate group (10.5%). On the other hand, in the residential area, the VOC group showed the largest contribution (49.7%), followed by the PAH-phthalate group (29.0%) and the HM group (21.3%). The large difference in the relative contribution of HMs between the two areas indicated that the emission sources of this group were predominantly associated with industrial areas, while emissions of VOCs and PAHs were related to not only industrial activities but also sources in nonindustrial areas, such as vehicle exhaust and residential heating during the cold seasons. With respect to an individual HAP, As in the industrial area appeared to have the highest cancer risk, and it was the only HAP that exceeded the tolerable criterion (1 × 10⁻⁴) recommended by the USEPA. However, the cancer risks of 26 and 21 HAPs in the industrial and residential areas, respectively, exceeded 1 × 10⁻⁶, the acceptable risk level set by the USEPA. In industrial areas, the top seven contributors were As (42.6%), formaldehyde (12.3%), benzene (8.3%), BaP (5.7%), Co (4.0%), Cd (3.6%), and 1,2-dichloroethane (2.8%), which contributed 79.3% to the cumulative cancer risk. In residential areas, the top seven contributors were formaldehyde (32.9%), BaP (17.6%), As (11.2%), Co (6.5%), benzene (4.9%), acetaldehyde (3.9%), and B[b+j]F (2.1%), contributing 79.1% to the cumulative risk. Although the magnitude of the carcinogenic risk for each species differed between industrial and nonindustrial areas, the rankings were similar overall in both areas. Therefore, these results suggest that air toxics emitted from the industrial complexes dispersed or were transported to the residential and commercial areas of Ulsan.
Although Cr(VI) is a highly toxic pollutant [80], there has been little information available about its concentrations in the ambient air to which the general public has been routinely exposed. A class of “chromium and its compounds” has been included in the list of HAPs in Korea since 1979. However, the general population has lacked an understanding of the effects of exposure to airborne Cr(VI) because there has been insufficient data on Cr(VI) levels in ambient air. This is largely because the determination of Cr(VI) requires a specific measurement method that is unnecessary for other HMs [42,80]. Consequently, no research papers or reports regarding human health risks due to Cr(VI) have become available in Korea until recently. The estimate of cancer risk from Cr(VI) in this study appeared to be 1.1 × 10⁻⁵ and 2.5 × 10⁻⁶ in the industrial and nonindustrial areas of Ulsan, respectively.

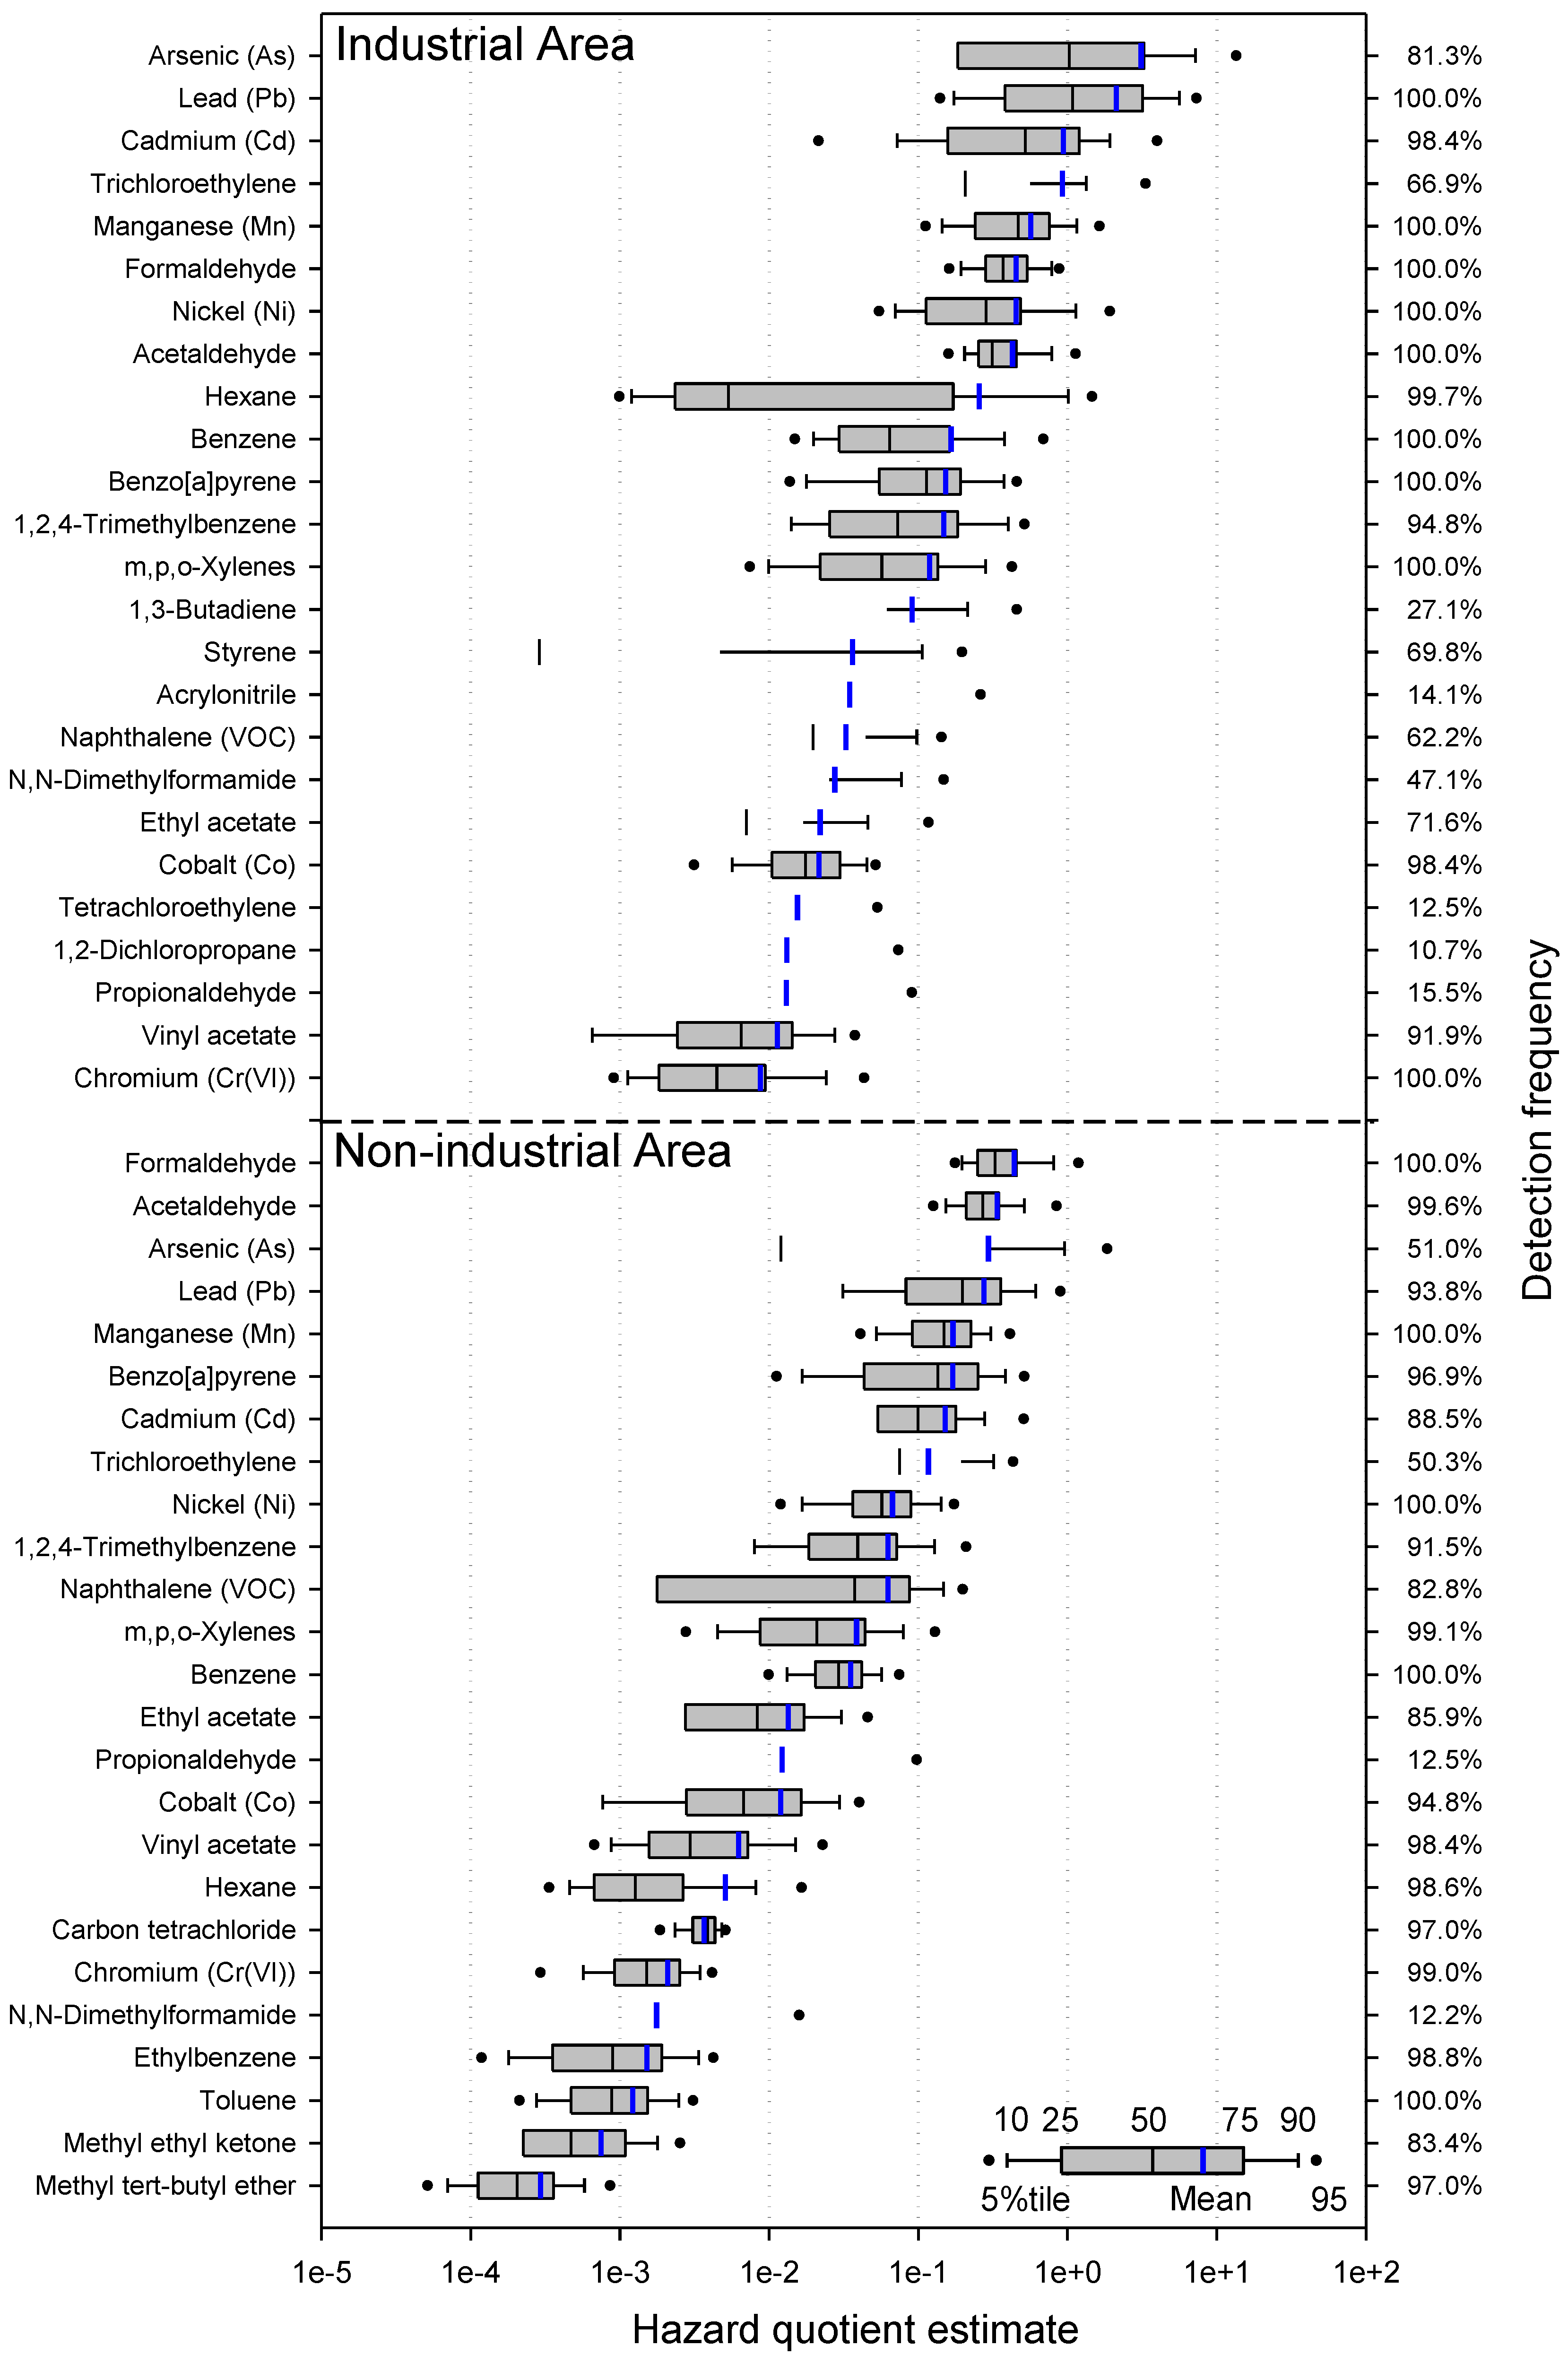
3.6. Health Risk Assessment for Noncarcinogenic HAPs

The chronic noncancer risk for a specific HAP was expressed as an HQ, which was calculated by dividing the average ambient concentration of the pollutant by its corresponding RfC. The chronic RfC is the concentration of a pollutant in mg/m3 below which long-term exposure to the general population is not expected to result in adverse effects [45]. Therefore, an HQ of less than or equal to 1 indicates that adverse effects are not likely to occur, and the hazard from exposure is considered to be negligible. The RfC values were available for only 65 species (Tables S1 and S2). Among them, 20 species (DF < 20%) were not included in the risk calculation. Results of the HQ calculations for the remaining 45 substances are presented in Table S5, and the distributions of noncancer risk estimates for the top 25 HAPs are presented in Figure 5. The sums of HQs, i.e., Hazard Index (HI), for the 45 HAPs were 10.0 and 2.4 in industrial and nonindustrial areas, respectively. However, it is not yet clear whether all 45 HAPs will have impacts on the same target organ or organ systems. So little is known about the interactions of multipollutants and the health risks posed by cumulative HAP exposures. Synergistic or antagonistic interactions among pollutants may enhance or mitigate risks in a way that could not be identified in this study. Nevertheless, such high HI values clearly indicate that a large proportion of the residents of Ulsan have experienced concurrent HAP exposures that may pose noncancer risks for various endpoints.
Among the subgroups of HAPs, HMs appeared to be the largest contributor (71.9%) to the HI, followed by VOCs (26.0%), and PAHs (2.1%) in industrial areas. However, the largest contributing group in the residential areas was VOCs (52.5%), followed by HMs (40.4%), and PAHs (7.1%). In Ulsan, the emission sources of HMs were located predominantly in the industrial complexes, but the sources of VOCs and PAHs were likely to be industrial emissions as well as vehicle exhausts and space-heating fuels in nonindustrial areas. As an individual species, only two HAPs exceeded 1.0 in the industrial area, which are As (3.1) and Pb (2.1). However, none of HAPs exceeded 1.0 in the residential area. Among the VOC groups, TCE, formaldehyde, acetaldehyde, hexane, and benzene appeared to be the major noncancer risk drivers, while As, Pb, Cd, Mn, and Ni were identified as the most threatening HMs.

3.7. Uncertainty and Limitations of the Risk Assessment

There are some limitations to the deterministic approach used in this study. For those HAPs having available toxicological information, most of the uncertainty in the risk assessment might be related to assumptions applied in the derivations of IUR, RfC, REL, and MRL values. In addition, the results of this study may have either underestimated or overestimated the health risks. The estimated risk values might have been underestimated by the limited set of target HAPs and the limited availability of toxicity data. Some potentially important hazardous species, which may have posed some risk, could not be evaluated because they were not measured in this study (for example, ethylene oxide, propylene oxide, beryllium, mercury, and vapor phase PAHs).
In contrast, health risks estimated by this study may have been overestimated due to a number of reasons. First, replacing nondetected data with half of the MDL may have contributed to an overestimation of the health risk as evaluated in this study. However, the use of half of the MDL was found to be insignificant, as the magnitude of possible overestimations due to this effect appeared to be less than 0.1% of the total risks. Second, the application of more protective values, when two toxicity values for a specific HAP were available, could have resulted in an overestimation of the health risk. Finally, the health risks may also have been overestimated because HAP concentrations measured over only one year were applied to IURs and RfCs that were developed for continuous exposures over a 70-year lifespan [33]. Many of these limitations were not only inherent in this study, but have also been recognized in many other similar studies [1,3,4,6,7,32,33,44]. Notwithstanding the limitations associated with risk estimates, this study clearly demonstrated that health risk estimation played a crucial role in identifying and prioritizing the HAPs of concern in the ambient air of Ulsan.

4. Summary and Conclusions

Comprehensive air monitoring of a wide range of HAPs was carried out in industrial and residential areas of Ulsan, the largest industrial city in Korea. Spatial and seasonal variations in the ambient levels of HAPs were investigated, and the measured data were used for health impact assessment with respect to cancer and noncancer risks. The VOCs of particular concern in this area appeared to be formaldehyde, benzene, 1,2-dichloroethane, ethylbenzene, and TCE. The impact of industrial emissions on the ambient levels of primary VOCs was significant, as the concentrations of most VOCs in the industrial area were considerably higher than in the residential area. Some HMs related to industrial activities also showed a clear difference in occurrence between the two areas. However, it is likely that the industrial sources were not the only emitters of PAHs, but other sources such as automobiles and space-heating fuels used in the residential area also contributed to the ambient levels of PAHs. With respect to seasonal variation, concentrations of most VOCs and HMs showed no specific pattern. However, formaldehyde levels increased in summer, due to its secondary formation in the atmosphere. In contrast to VOCs and HMs, the seasonality of PAH levels were much more distinct. The levels were highest in autumn, followed by winter, spring, and summer. The higher levels of PAHs in autumn were largely attributed to the stagnant atmospheric conditions during the autumn campaign, although the impact of transboundary contributions from both domestic sources and long-range transport from China and North Korea cannot be ruled out.
The cumulative cancer risk posed by 35 HAPs was estimated to be 4.7 × 10⁻⁴ and 1.7 × 10⁻⁴ in industrial and residential areas, respectively, both of which exceeded the tolerable risk criterion of 1 × 10⁻⁴ recommended by the USEPA. The sums of HQs derived from 47 HAPs were 10.0 (industrial) and 2.4 (residential). As the individual species, only two exceeded 1.0 in the industrial area, which are As (3.1) and Pb (2.1). However, none of HAPs exceeded 1.0 in the residential area. Among the subgroups of HAPs, HMs and VOCs were the largest contributors to the health risks in the industrial and residential areas, respectively. Overall, we identified ten major risk drivers, and suggest them as top priority HAPs in this area; they are formaldehyde, benzene, ethylbenzene, TCE (as VOCs), BaP, BbF+BjF (as PAHs), As, Co, Cd, and Cr(IV) (as HMs). We further suggest that the HAPs in this region are worth consideration for stricter emission control, particularly for industrial sources. In addition, a further research is required to identify the specific sources of the priority pollutants in the Ulsan area. This study clearly demonstrated the importance of a comprehensive air monitoring and health risk assessment for a wide range of HAPs in identifying potentially toxic pollutants in urban ambient air to which the general public is routinely exposed.

Supplementary Materials

The following are available online at https://www.mdpi.com/2073-4433/11/5/547/s1, Table S1: emissions (kg/year) of selected airborne toxic chemicals from four industrial districts in Ulsan, 2010, Table S2: toxicological data applied to the vapor HAPs, Table S3: toxicological data applied to the particulate HAPs, Table S4: sources of relative potency factors (RPF) for the PAHs and adopted values, Table S5: cancer risk estimation for HAPs in industrial and residential areas of Ulsan, Table S6: noncancer risk estimation for HAPs in industrial and residential areas of Ulsan, Figure S1: wind-roses during seasonal monitoring campaigns in Ulsan, Figure S2: examples of backward trajectories of air parcels by HYSPLIT modeling during the haze episode period in Ulsan.

Author Contributions

Conceptualization, S.-O.B.; methodology, Y.-K.S., J.-H.K., B.-W.K., and S.-O.B.; validation, Y.-K.S. and B.-W.K.; investigation, Y.-K.S., B.-W.K. and J.-H.K.; data curation, K.-M.B., M.-J.K. and Y.-K.S.; writing—draft preparation, K.-M.B. and M.-J.K.; writing—review and editing, S.-O.B.; supervision, S.-O.B.; funding acquisition, S.-O.B. All authors have read and agreed to the published version of the manuscript.

Funding

This work was supported by the Yeungnam University Research Grant (Grant Number: 216A380135).

Acknowledgments

We thank B.Y. Cho, C.G. Jeon, and D.H. Chung, who were graduate students during the period of 2010 to 2012, for their contributions to the field sampling work. We also thank M.D. Lee and R.H. Kim of the National Institute of Environmental Research for their administrative assistance in the fieldwork.

Conflicts of Interest

The authors declare no conflict of interest.

References

  1. Bari, M.A.; Kindzierski, W.B. Concentrations, sources and human health risk of inhalation exposure to air toxics in Edmonton, Canada. Chemosphere 2017, 173, 160–171. [Google Scholar] [CrossRef] [PubMed]
  2. Du, W.; Chen, Y.; Zhu, X.; Zhong, Q.; Zhuo, S.; Liu, W.; Huang, Y.; Shen, G.; Tao, S. Wintertime air pollution and health risk assessment of inhalation exposure to polycyclic aromatic hydrocarbons in rural China. Atmos. Environ. 2018, 191, 1–8. [Google Scholar] [CrossRef]
  3. Jia, C.; Foran, J. Air toxics concentrations, source identification, and health risks: An air pollution hot spot in southwest Memphis, TN. Atmos. Environ. 2013, 81, 112–116. [Google Scholar] [CrossRef]
  4. Ramírez, N.; Cuadras, A.; Rovira, E.; Borrull, F.; Marcé, R.M. Chronic risk assessment of exposure to volatile organic compounds in the atmosphere near the largest Mediterranean industrial site. Environ. Int. 2012, 39, 200–209. [Google Scholar] [CrossRef] [PubMed]
  5. Roukos, J.; Riffault, V.; Locoge, N.; Plaisance, H. VOC in an urban and industrial harbor on the French North Sea coast during two contrasted meteorological situations. Environ. Pollut. 2009, 157, 3001–3009. [Google Scholar] [CrossRef] [PubMed]
  6. Wu, C.; Liu, L.J.S.; Cullen, A.; Westberg, H.; Williamson, J. Spatial-temporal and cancer risk assessment of selected hazardous air pollutants in Seattle. Environ. Int. 2011, 37, 11–17. [Google Scholar] [CrossRef]
  7. Wu, C.; Wu, S.; Wu, Y.H.; Cullen, A.C.; Larson, T.V.; Williamson, J.; Liu, L.J.S. Cancer risk assessment of selected hazardous air pollutants in Seattle. Environ. Int. 2009, 35, 516–522. [Google Scholar] [CrossRef]
  8. Health Impacts of Air Pollution. Available online: https://www.eea.europa.eu/themes/air/health-impacts-of-air-pollution (accessed on 15 January 2019).
  9. National Research Council. Air Quality Management in the United States; The National Academies Press: Washington, DC, USA, 2004; pp. 55–58. [Google Scholar]
  10. What are Hazardous Air Pollutants? Available online: https://www.epa.gov/haps/what-are-hazardous-air-pollutants (accessed on 15 January 2019).
  11. World Health Organization (WHO). Health Risk Assessment of Air Pollution—General Principles; WHO Regional Office for Europe: Copenhagen, Denmark, 2016; pp. 6–10. [Google Scholar]
  12. Initial List of Hazardous Air Pollutants with Modifications. Available online: https://www.epa.gov/haps/initial-list-hazardous-air-pollutants-modifications (accessed on 15 March 2019).
  13. Patrick, D.R. The definition of toxic air pollutants. In Toxic Air Pollution Handbook; Patrick, D.R., Ed.; Van Nostrand Reinhold: New York, NY, USA, 1994; pp. 16–18. [Google Scholar]
  14. Health Effects Notebook for Hazardous Air Pollutants. Available online: https://www.epa.gov/haps/health-effects-notebook-hazardous-air-pollutants (accessed on 15 June 2019).
  15. Baek, S.O.; Field, R.A.; Goldstone, M.E.; Kirk, P.W.; Lester, J.N.; Perry, R. A review of atmospheric polycyclic aromatic hydrocarbons: Sources, fate and behavior. Water Air Soil Pollut. 1991, 60, 279–300. [Google Scholar] [CrossRef]
  16. Risk Assessment for Toxic Air Pollutants: A Citizen’s Guide. Available online: https://www3.epa.gov/airtoxics/3_90024.html (accessed on 15 January 2019).
  17. List of Hazardous Air Pollutants and Priority Pollutants. Available online: https://www.env.go.jp/press/files/jp/16391.pdf (accessed on 15 January 2019). (In Japanese)
  18. Urban Air Toxics. Available online: https://www.epa.gov/urban-air-toxics/urban-air-toxic-pollutants (accessed on 15 December 2018).
  19. Introduction of Ulsan. Available online: http://www.ulsan.go.kr/english/Introduction (accessed on 10 December 2018).
  20. Pollutant Release and Transfer Register (PRTR) Information System in Korea. Available online: http://icis.me.go.kr/prtr/prtrinfo/yearSearch.do (accessed on 15 October 2015).
  21. Nguyen, T.N.T.; Jung, K.S.; Son, J.M.; Kwon, H.O.; Choi, S.D. Seasonal variation, phase distribution, and source identification of atmospheric polycyclic aromatic hydrocarbons at a semi-rural site in Ulsan, South Korea. Environ. Pollut. 2018, 236, 529–539. [Google Scholar] [CrossRef]
  22. Choi, S.D.; Kwon, H.O.; Lee, Y.S.; Park, E.J.; Oh, J.Y. Improving the spatial resolution of atmospheric polycyclic aromatic hydrocarbons using passive air samplers in a multi-industrial city. J. Hazard. Mater. 2012, 241–242, 252–258. [Google Scholar] [CrossRef] [PubMed]
  23. Hieu, N.T.; Lee, B.K. Characteristics of particulate matter and metals in the ambient air from a residential area in the largest industrial city in Korea. Atmos. Res. 2010, 98, 526–537. [Google Scholar] [CrossRef]
  24. Clarke, K.; Kwon, H.O.; Choi, S.D. Fast and reliable source identification of criteria air pollutants in an industrial city. Atmos. Environ. 2014, 95, 239–248. [Google Scholar] [CrossRef]
  25. Lee, B.K.; Jun, N.Y.; Lee, H.K. Comparison of particulate matter characteristics before, during, and after Asian dust events in Incheon and Ulsan, Korea. Atmos. Environ. 2004, 38, 1535–1545. [Google Scholar] [CrossRef]
  26. Susaya, J.; Kim, K.H.; Shon, Z.H.; Brown, R.J.C. Demonstration of long-term increases in tropospheric O3 levels: Causes and potential impacts. Chemosphere 2013, 92, 1520–1528. [Google Scholar] [CrossRef] [PubMed]
  27. Kim, S.J.; Kwon, H.O.; Lee, M.I.; Seo, Y.; Choi, S.D. Spatial and temporal variations of volatile organic compounds using passive air samplers in the multi-industrial city of Ulsan, Korea. Environ. Sci. Pollut. Res. 2019, 26, 5831–5841. [Google Scholar] [CrossRef] [PubMed]
  28. Vu, V.T.; Lee, B.K.; Kim, J.T.; Lee, C.H.; Kim, I.H. Assessment of carcinogenic risk due to inhalation of polycyclic aromatic hydrocarbons in PM10 from an industrial city: A Korean case-study. J. Hazard. Mater. 2011, 189, 349–356. [Google Scholar] [CrossRef]
  29. Lee, B.K.; Hieu, N.T. Seasonal variation and sources of heavy metals in atmospheric aerosols in a residential area of Ulsan, Korea. Aerosol Air Qual. Res. 2011, 11, 679–688. [Google Scholar] [CrossRef]
  30. Kwon, H.O.; Park, M.K.; Kim, S.J.; Choi, J.; Oh, J.; Ahn, J.Y.; Choi, S.D. Size distributions of atmospheric particulate matter and associated trace metals in the multi-industrial city of Ulsan, Korea. Environ. Eng. Res. 2019, 24, 331–338. [Google Scholar] [CrossRef] [Green Version]
  31. Fox, M.A.; Tran, N.L.; Groopman, J.D.; Burke, T.A. Toxicological resources for cumulative risk: An example with hazardous air pollutants. Regul. Toxicol. Pharmacol. 2004, 40, 305–311. [Google Scholar] [CrossRef]
  32. Morello-Frosch, R.A.; Woodruff, T.J.; Axelrad, D.A.; Caldwell, J.C. Air toxics and health risks in California: The public health implications of outdoor concentrations. Risk Anal. 2000, 20, 273–291. [Google Scholar] [CrossRef]
  33. Tam, B.N.; Neumann, C.M. A human health assessment of hazardous air pollutants in Portland, OR. J. Environ. Manag. 2004, 73, 131–145. [Google Scholar] [CrossRef] [PubMed]
  34. USEPA. Compendium Method TO-17: Determination of Volatile Organic Compounds in Ambient Air Using Active Sampling onto Sorbent Tubes, 2nd ed.; USEPA: Cincinnati, OH, USA, 1999; pp. 1–49.
  35. Baek, S.O.; Suvarapu, L.N.; Seo, Y.K. Occurrence and concentrations of toxic VOCs in the ambient air of Gumi, an electronics-industrial city in Korea. Sensors 2015, 15, 19102–19123. [Google Scholar] [CrossRef] [PubMed] [Green Version]
  36. USEPA. Compendium Method TO-11A: Determination of Formaldehyde in Ambient Air Using Adsorbent Cartridge Followed by High Performance Liquid Chromatography, 2nd ed.; USEPA: Cincinnati, OH, USA, 1999; pp. 1–51.
  37. Cheruiyot, N.K.; Lee, W.J.; Mwangi, J.K.; Wang, L.C.; Lin, N.H.; Lin, Y.C.; Cao, J.; Zhang, R.; Chang-Chien, G.P. An overview: Polycyclic aromatic hydrocarbon emissions from the stationary and mobile sources and in the ambient air. Aerosol Air Qual. Res. 2015, 15, 2730–2762. [Google Scholar] [CrossRef] [Green Version]
  38. Teil, M.J.; Blanchard, M.; Chevreuil, M. Atmospheric fate of phthalate esters in an urban area (Paris-France). Sci. Total Environ. 2006, 354, 212–223. [Google Scholar] [CrossRef]
  39. USEPA. Compendium Method TO-13A: Determination of Polycyclic Aromatic Hydrocarbons (PAHs) in Ambient Air Using Gas Chromatography/ Mass Spectrometry, 2nd ed.; USEPA: Cincinnati, OH, USA, 1999; pp. 1–77.
  40. USEPA. Compendium Method IO-3.4: Determination of Metals in Ambient Particulate Matter Using Inductively Coupled Plasma Spectroscopy, 2nd ed.; USEPA: Cincinnati, OH, USA, 1999; pp. 6–26.
  41. USEPA. Standard Operating Procedure for the Determination of Hexavalent Chromium in Ambient Air Analyzed by Ion Chromatography (IC); USEPA: Research Triangle Park, NC, USA, 2006; pp. 5–19.
  42. Kang, B.W.; Lee, H.S.; Kim, J.H.; Hong, J.H.; Kim, R.H.; Seo, Y.K.; Han, J.S.; Baek, K.M.; Kim, M.J.; Baek, S.O. Distribution of airborne hexavalent chromium concentrations in large industrial complexes in Korea. Asian J. Atmos. Environ. 2016, 10, 208–216. [Google Scholar] [CrossRef] [Green Version]
  43. USEPA. Definition and Procedure for the Determination of the Method Detection Limit; Revision 2; USEPA: Washington, DC, USA, 2016; pp. 1–6.
  44. Bari, M.A.; Kindzierski, W.B. Ambient volatile organic compounds (VOCs) in Calgary, Alberta: Sources and screening health risk assessment. Sci. Total Environ. 2018, 631, 627–640. [Google Scholar] [CrossRef] [Green Version]
  45. USEPA. Risk Assessment Guidance for Superfund Volume I: Human Health Evaluation Manual (Part F, Supplemental Guidance for Inhalation Risk Assessment); EPA-540-R-070-002; Office of Superfund Remediation and Technology Innovation, USEPA: Washington, DC, USA, 2009; pp. 13–24.
  46. Dose-Response Assessment for Assessing Health Risks Associated with Exposure to Hazardous Air Pollutants. Available online: https://www.epa.gov/fera/dose-response-assessment-assessing-health-risks-associated-exposure-hazardous-air-pollutants (accessed on 15 December 2018).
  47. IRIS Assessments. Available online: https://cfpub.epa.gov/ncea/iris_drafts/atoz.cfm?list_type=alpha (accessed on 18 December 2018).
  48. Office of Environmental Health Hazard Assessment (OEHHA) Air Chemicals Database. Available online: https://oehha.ca.gov/air/chemicals (accessed on 15 August 2016).
  49. World Health Organization (WHO). Guidelines for Air Quality; WHO: Geneva, Switzerland, 2000; pp. 55–59. [Google Scholar]
  50. USEPA. Health Effects Assessment Summary Tables; USEPA: Washington, DC, USA, 1997; pp. 10–14.
  51. Toxicological Profiles. Available online: https://www.atsdr.cdc.gov/substances/indexAZ.asp (accessed on 15 August 2016).
  52. Provisional Peer-Reviewed Toxicity Values (PPRTVs) Assessments. Available online: https://www.epa.gov/pprtv/provisional-peer-reviewed-toxicity-values-pprtvs-assessments (accessed on 15 June 2018).
  53. Nisbet, I.C.T.; LaGoy, P.K. Toxic equivalency factors (TEFs) for polycyclic aromatic hydrocarbons (PAHs). Regul. Toxicol. Pharmacol. 1992, 16, 290–300. [Google Scholar] [CrossRef]
  54. USEPA. Provisional Guidance for Qualitative Risk Assessment of Polycyclic Aromatic Hydrocarbons; EPA/600/R-93/089; Office of Research and Development, USEPA: Washington, DC, USA, 1993; pp. 5–8.
  55. Malcolm, H.M.; Dobson, S. The Calculation of an Environmental Assessment Level (EAL) for Atmospheric PAHs Using Relative Potencies; Report No. DoE/HMIP/RR/94/041; Department of the Environment: London, UK, 1994.
  56. Technical Support Document for Cancer Potency Factors: Appendix A. A Lookup Table Containing Unit Risk and Cancer Potency Values. Available online: https://oehha.ca.gov/media/downloads/crnr/appendixa.pdf (accessed on 20 June 2019).
  57. Agents Classified by the IARC Monographs, Volumes 1-124. Available online: https://monographs.iarc.fr/agents-classified-by-the-iarc/ (accessed on 15 January 2019).
  58. Ho, K.F.; Lee, S.C.; Tsai, W.Y. Carbonyl compounds in the roadside environment of Hong Kong. J. Hazard. Mater. 2006, 133, 24–29. [Google Scholar] [CrossRef]
  59. Na, G.S.; Kim, Y.P. Seasonal characteristics of ambient volatile organic compounds in Seoul, Korea. Atmos. Environ. 2001, 35, 2603–2614. [Google Scholar] [CrossRef]
  60. Na, K.; Kim, Y.P.; Moon, I.; Moon, K.C. Chemical composition of major VOC emission sources in the Seoul atmosphere. Chemosphere 2004, 55, 585–594. [Google Scholar] [CrossRef] [PubMed]
  61. Yoo, H.J.; Kim, J.; Yi, S.M.; Zoh, K.D. Analysis of black carbon, particulate matter, and gaseous pollutants in an industrial area in Korea. Atmos. Environ. 2011, 45, 7698–7704. [Google Scholar] [CrossRef]
  62. Jia, C.; Batterman, S.; Godwin, C. VOCs in industrial, urban and suburban neighborhoods, Part 1: Indoor and outdoor concentrations, variation, and risk drivers. Atmos. Environ. 2008, 42, 2083–2100. [Google Scholar] [CrossRef]
  63. Kume, K.; Ohura, T.; Amagai, T.; Fusaya, M. Field monitoring of volatile organic compounds using passive air samplers in an industrial city in Japan. Environ. Pollut. 2008, 153, 649–657. [Google Scholar] [CrossRef] [PubMed]
  64. Liu, P.W.G.; Yao, Y.C.; Tsai, J.H.; Hsu, Y.C.; Chang, L.P.; Chang, K.H. Source impacts by volatile organic compounds in an industrial city of southern Taiwan. Sci. Total Environ. 2008, 398, 154–163. [Google Scholar] [CrossRef]
  65. Bauer, M.J.; Herrmann, R. Estimation of the environmental contamination by phthalic acid esters leaching from household wastes. Sci. Total Environ. 1997, 208, 49–57. [Google Scholar] [CrossRef]
  66. Wang, G.; Kawamura, K.; Zhao, X.; Li, Q.; Dai, Z.; Niu, H. Identification, abundance and seasonal variation of anthropogenic organic aerosols from a mega-city in China. Atmos. Environ. 2007, 41, 407–416. [Google Scholar] [CrossRef] [Green Version]
  67. Korea Industrial Complex Cooperation (KICC). A Statistics of Korean Industrial Complexes for 15 years (2001-10216); KICC: Daegu, Korea, 2017; pp. 60–70. [Google Scholar]
  68. Lü, H.; Cai, Q.Y.; Wen, S.; Chi, Y.; Guo, S.; Sheng, G.; Fu, J. Seasonal and diurnal variations of carbonyl compounds in the urban atmosphere of Guangzhou, China. Sci. Total Environ. 2010, 408, 3523–3529. [Google Scholar] [CrossRef]
  69. Napier, F.; Arcy, B.D.; Jefferies, C. A review of vehicle related metals and polycyclic aromatic hydrocarbons in the UK environment. Desalination 2008, 226, 143–150. [Google Scholar] [CrossRef]
  70. Huang, R.J.; Zhang, Y.; Bozzetti, C.; Ho, K.F.; Cao, J.J.; Han, Y.; Daellenbach, K.R.; Slowik, J.G.; Platt, S.M.; Canonaco, F.; et al. High secondary aerosol contribution to particulate pollution during haze events in China. Nature 2014, 514, 218–222. [Google Scholar] [CrossRef] [Green Version]
  71. Lee, J.Y.; Kim, Y.P.; Kang, C.H. Characteristics of the ambient particulate PAHs at Seoul, a mega city of Northeast Asia in comparison with the characteristics of a background site. Atmos. Res. 2011, 99, 50–56. [Google Scholar] [CrossRef]
  72. Dat, N.D.; Chang, M.B. Review on characteristics of PAHs in atmosphere, anthropogenic sources and control technologies. Sci. Total Environ. 2017, 609, 682–693. [Google Scholar] [CrossRef] [PubMed]
  73. Weilenmann, M.; Favez, J.Y.; Alvarez, R. Cold-start emissions of modern passenger cars at different low ambient temperatures and their evolution over vehicle legislation categories. Atmos. Environ. 2009, 43, 2419–2429. [Google Scholar] [CrossRef]
  74. Thang, P.Q.; Kim, S.J.; Lee, S.J.; Ye, J.; Seo, Y.K.; Baek, S.O.; Choi, S.D. Seasonal characteristics of particulate polycyclic aromatic hydrocarbons (PAHs) in a petrochemical and oil refinery industrial area of the west coast of South Korea. Atmos. Environ. 2019, 198, 398–406. [Google Scholar] [CrossRef]
  75. Lee, J.Y.; Kim, Y.P.; Kang, C.H.; Ghim, Y.S.; Kaneyasu, N. Temporal trend and long-range transport of particulate polycyclic aromatic hydrocarbons at Gosan in the northeast Asia between 2001 and 2004. J. Geophy. Res. 2006, 111, D11303. [Google Scholar] [CrossRef] [Green Version]
  76. Kim, I.S.; Lee, J.Y.; Kim, Y.P. Impact of polycyclic aromatic hydrocarbons (PAH) emissions from North Korea to the air quality in the Seoul Metropolitan Area, South Korea. Atmos. Environ. 2013, 70, 159–165. [Google Scholar] [CrossRef]
  77. HYSPLIT. Available online: https://www.ready.noaa.gov/HYSPLIT.php (accessed on 10 December 2019).
  78. Fujii, M.; Shinohara, N.; Lim, A.; Otake, T.; Kumagai, K.; Yanagisawa, Y. A study on emission of phthalate esters from plastic materials using a passive flux sampler. Atmos. Environ. 2003, 37, 5495–5504. [Google Scholar] [CrossRef]
  79. 40 CFR § 300.430-Remedial Investigation/Feasibility Study and Selection of Remedy. Available online: https://ecfr.io/Title-40/pt40.30.300#se40.30.300_1430 (accessed on 10 August 2019).
  80. Kimbrough, D.E.; Cohen, Y.; Winer, A.M.; Creeman, L.; Mabuni, C. A critical assessment of chromium in the environment. Crit. Rev. Environ. Sci. Technol. 1999, 29, 1–46. [Google Scholar] [CrossRef]
Figure 1. Location of study area and hazardous air pollutant (HAP) sampling sites.
Atmosphere 11 00547 g001
Figure 2. Comparison of concentration distributions of selected HAPs between industrial and residential areas in Ulsan.
Atmosphere 11 00547 g002
Figure 3. Seasonal variations in concentrations of selected HAPs in Ulsan.
Atmosphere 11 00547 g003
Figure 4. Distributions of cancer risk estimates for the top 25 HAPs in Ulsan.
Atmosphere 11 00547 g004
Figure 5. Distributions of noncancer risk estimates for the top 25 HAPs in Ulsan.
Atmosphere 11 00547 g005
Table 1. Sampling information and weather conditions during the HAP monitoring campaigns in Ulsan.
Parameter Spring, 2009Summer, 2009Autumn, 2009Winter, 2010
Sampling period22–29 April8–15 July15–22 October9–16 January
Temperature (Mean ± SD, °C)13.2 ± 3.024.6 ± 2.115.5 ± 4.16.3 ± 2.0
Wind speed (Mean ± SD, m/s)2.7 ± 1.43.1 ± 1.71.8 ± 1.22.4 ± 1.3
Prevailing wind directionWSSWWSWNNW
Number of VOC samples240240240240
Number of Carbonyl samples120107120105
Number of PAH/phthalate samples4040 40 40
Number of HM samples4040 40 40
Table 2. Summary of volatile organic compound (VOC) concentrations (ppb) in industrial and residential areas of Ulsan.
CompoundIndustrial AreaResidential Area
Site ASite BSite CSite DSite E
MeanSDMeanSDMeanSDMeanSDMeanSD
1,3-Butadiene0.010.010.160.39 0.010.07 0.010.040.010.01
2-Propanol0.110.270.010.03 0.020.04 0.010.030.010.05
Dichloromethane0.060.170.010.02 0.010.04 0.020.070.020.10
Methyl tert-butyl ether0.461.110.080.09 0.230.22 0.250.440.240.23
Vinyl acetate0.580.920.700.75 0.380.59 0.380.550.290.30
Ethyl acetate0.741.340.100.18 0.300.40 0.250.280.220.36
Hexane1.514.3098.2 125.33 0.801.50 0.852.281.336.86
1,2-Dichloroethane0.170.550.070.15 0.010.04 0.010.040.000.01
Benzene1.253.351.812.27 0.340.25 0.330.340.310.20
Carbon tetrachloride0.120.320.040.07 0.060.02 0.060.020.050.02
Cyclohexane0.360.381.572.51 0.190.26 0.130.180.100.10
Trichloroethylene0.110.150.571.63 0.040.06 0.040.060.040.05
Heptane0.641.210.210.17 0.100.09 0.070.080.080.11
Methyl isobutyl ketone0.420.660.120.16 0.201.01 0.050.060.050.08
N,N-Dimethylformamide0.110.320.430.80 0.020.06 0.020.080.010.08
Toluene5.257.962.142.03 2.002.96 1.331.031.441.72
Ethylbenzene1.071.801.241.66 0.450.61 0.270.310.310.52
m,p-Xylenes2.293.711.832.45 0.961.61 0.500.670.530.96
Styrene0.060.1016.6 39.02 0.070.18 0.050.180.030.07
o-Xylene0.610.870.670.83 0.290.45 0.150.190.180.30
4-Ethyltoluene0.050.070.040.07 0.020.04 0.010.020.020.03
1,3,5-Trimethylbenzene0.060.080.050.07 0.030.04 0.020.020.020.03
1,2,4-Trimethylbenzene0.220.280.190.28 0.120.15 0.070.090.080.12
Naphthalene0.020.030.020.02 0.040.05 0.030.040.030.04
Formaldehyde2.631.224.493.10 3.322.49 3.663.253.373.35
Acetaldehyde1.410.522.792.14 1.601.16 1.881.751.491.43
Acetone3.852.573.501.48 3.081.56 3.181.432.951.30
Propionaldehyde0.040.120.040.100.050.130.050.140.030.10
2-Butanone3.084.49 1.501.42 1.291.29 1.31 1.271.131.28
Note: Amount of data for carbonyl compounds are 91 for Sites A and E and 90 for Sites B, C, and D. Otherwise, the amount of data for each sites is 192.
Table 3. Summary of atmospheric concentrations (ng/m3) of PAHs, phthalates, and HMs in industrial and residential areas of Ulsan.
CompoundIndustrial AreaResidential Area
Site ASite BSite CSite DSite E
MeanSDMeanSDMeanSDMeanSDMeanSD
Naphthalene0.300.190.260.170.230.150.260.180.450.38
Biphenyl0.130.080.120.070.090.060.100.080.150.16
Acenaphthylene0.040.070.030.050.030.050.040.060.080.10
Acenaphthene0.090.100.050.070.060.070.070.090.080.09
Fluorene0.170.200.120.130.080.090.090.100.170.22
Phenanthrene0.620.660.490.460.500.560.560.550.880.84
Anthracene0.060.080.040.040.030.040.050.060.110.13
Fluoranthene0.830.950.670.580.740.710.840.721.140.98
Pyrene0.780.750.640.490.680.540.760.611.080.87
Benzo[c]phenanthrene0.080.090.070.080.070.070.070.070.100.09
BghiF (a) + CcdP (b)0.500.360.370.310.390.270.360.280.510.35
Benzo[a]anthracene0.340.240.280.250.290.220.280.230.450.35
Triphenylene0.170.120.160.120.130.080.130.090.150.10
Chrysene0.480.370.470.400.450.330.440.350.570.44
Benzo[b+j]fluoranthene0.740.480.740.630.720.450.680.480.860.62
Benzo[k]fluoranthene0.180.150.180.190.170.140.160.150.200.18
Benzo[a]fluoranthene0.090.080.070.090.090.080.080.080.130.13
Benzo[e]pyrene0.380.240.350.310.340.220.310.240.380.31
Benzo[a]pyrene0.320.250.290.310.310.270.290.270.420.40
Perylene0.040.050.040.060.050.050.040.050.060.08
Indeno[1,2,3-cd]pyrene0.300.200.270.280.270.210.230.200.290.28
Dibenz[a,h+a,c]anthracene0.050.070.050.070.050.060.040.060.050.07
Benzo[g,h,i]perylene0.650.420.460.430.440.310.380.320.480.44
Anthanthrene0.080.120.060.090.060.090.060.080.090.13
Dibenzo[b,k]fluoranthene0.040.070.040.070.040.050.030.060.030.06
Dibenzo[a,h]pyrene0.040.070.040.070.020.050.020.050.020.06
Coronene0.330.210.180.200.150.150.120.130.150.18
Dimethyl phthalate0.400.650.280.620.360.700.380.690.440.72
Diethyl phthalate4.743.084.172.727.953.659.606.1514.3410.06
Dibutyl phthalate16.6713.7818.6214.7329.8723.7118.0512.3725.2616.84
Butyl benzyl phthalate0.330.440.280.270.620.570.450.483.152.22
Di(2-ethylhexyl)phthalate71.2762.0346.1624.97109.2769.1853.0233.0279.7752.14
Dioctyl phthalate0.470.680.120.160.090.110.140.210.160.24
As83.30135.510.2114.64.397.144.528.324.319.12
Cd15.5214.253.153.671.541.781.642.101.431.98
Co2.061.102.281.641.121.201.321.251.221.23
Cr(VI)0.340.191.401.350.270.370.200.120.160.13
Mn153.8296.92185.33170.3453.5030.9250.7437.4149.5331.12
Ni39.3447.2141.7860.316.454.036.014.375.563.68
Pb553.89351.6281.2865.2242.3838.9247.9464.8133.4830.55
Se61.2290.4054.7871.204.4212.807.6318.042.427.61
SPM (μg/m3)142.4047.04108.5242.91102.9324.40108.0338.64108.0337.11
Note: (a) BghiF: Benzo[g,h,i]fluoranthene; (b) CcdP: Cyclopenta[cd]pyrene.
Table 4. Summary of seasonal concentrations of subgroups of HAPs at each sampling site in Ulsan.
HAP
Subgroup
SeasonnIndustrial AreaNonindustrial Area
Site ASite BSite CSite DSite E
∑66
VOCs (ppb)
Spring24010.4687.464.095.718.03
Summer24030.70288.849.286.565.84
Autumn24016.24118.045.324.735.06
Winter2409.2914.208.283.013.11
∑13Carbonyls
(ppb)
Spring1209.2910.928.7210.068.90
Summer10719.0016.7914.2815.7314.42
Autumn12010.2213.199.488.887.60
Winter1057.6811.057.208.797.27
∑36PAHs
(ng/m3)
Spring404.144.004.163.605.10
Summer403.621.211.681.091.54
Autumn4012.3212.028.4610.3813.51
Winter4012.119.6011.9911.3816.99
∑6Phthalates
(ng/m3)
Spring4043.9160.08123.2469.8986.19
Summer40169.5782.21286.15110.73203.01
Autumn40192.75103.82116.91109.42145.36
Winter4038.8232.4066.3536.5457.95
∑8HMs
(ng/m3)
Spring40796.74398.27113.9685.2587.63
Summer401208.53308.81117.96121.6772.58
Autumn40777.47528.35126.13157.09139.92
Winter40671.49123.2484.3492.5784.90

