An Integrated Cooling Jet and Air Curtain System for Stadiums in Hot Climates


Abstract
1. Introduction and Literature Review
2. Methods
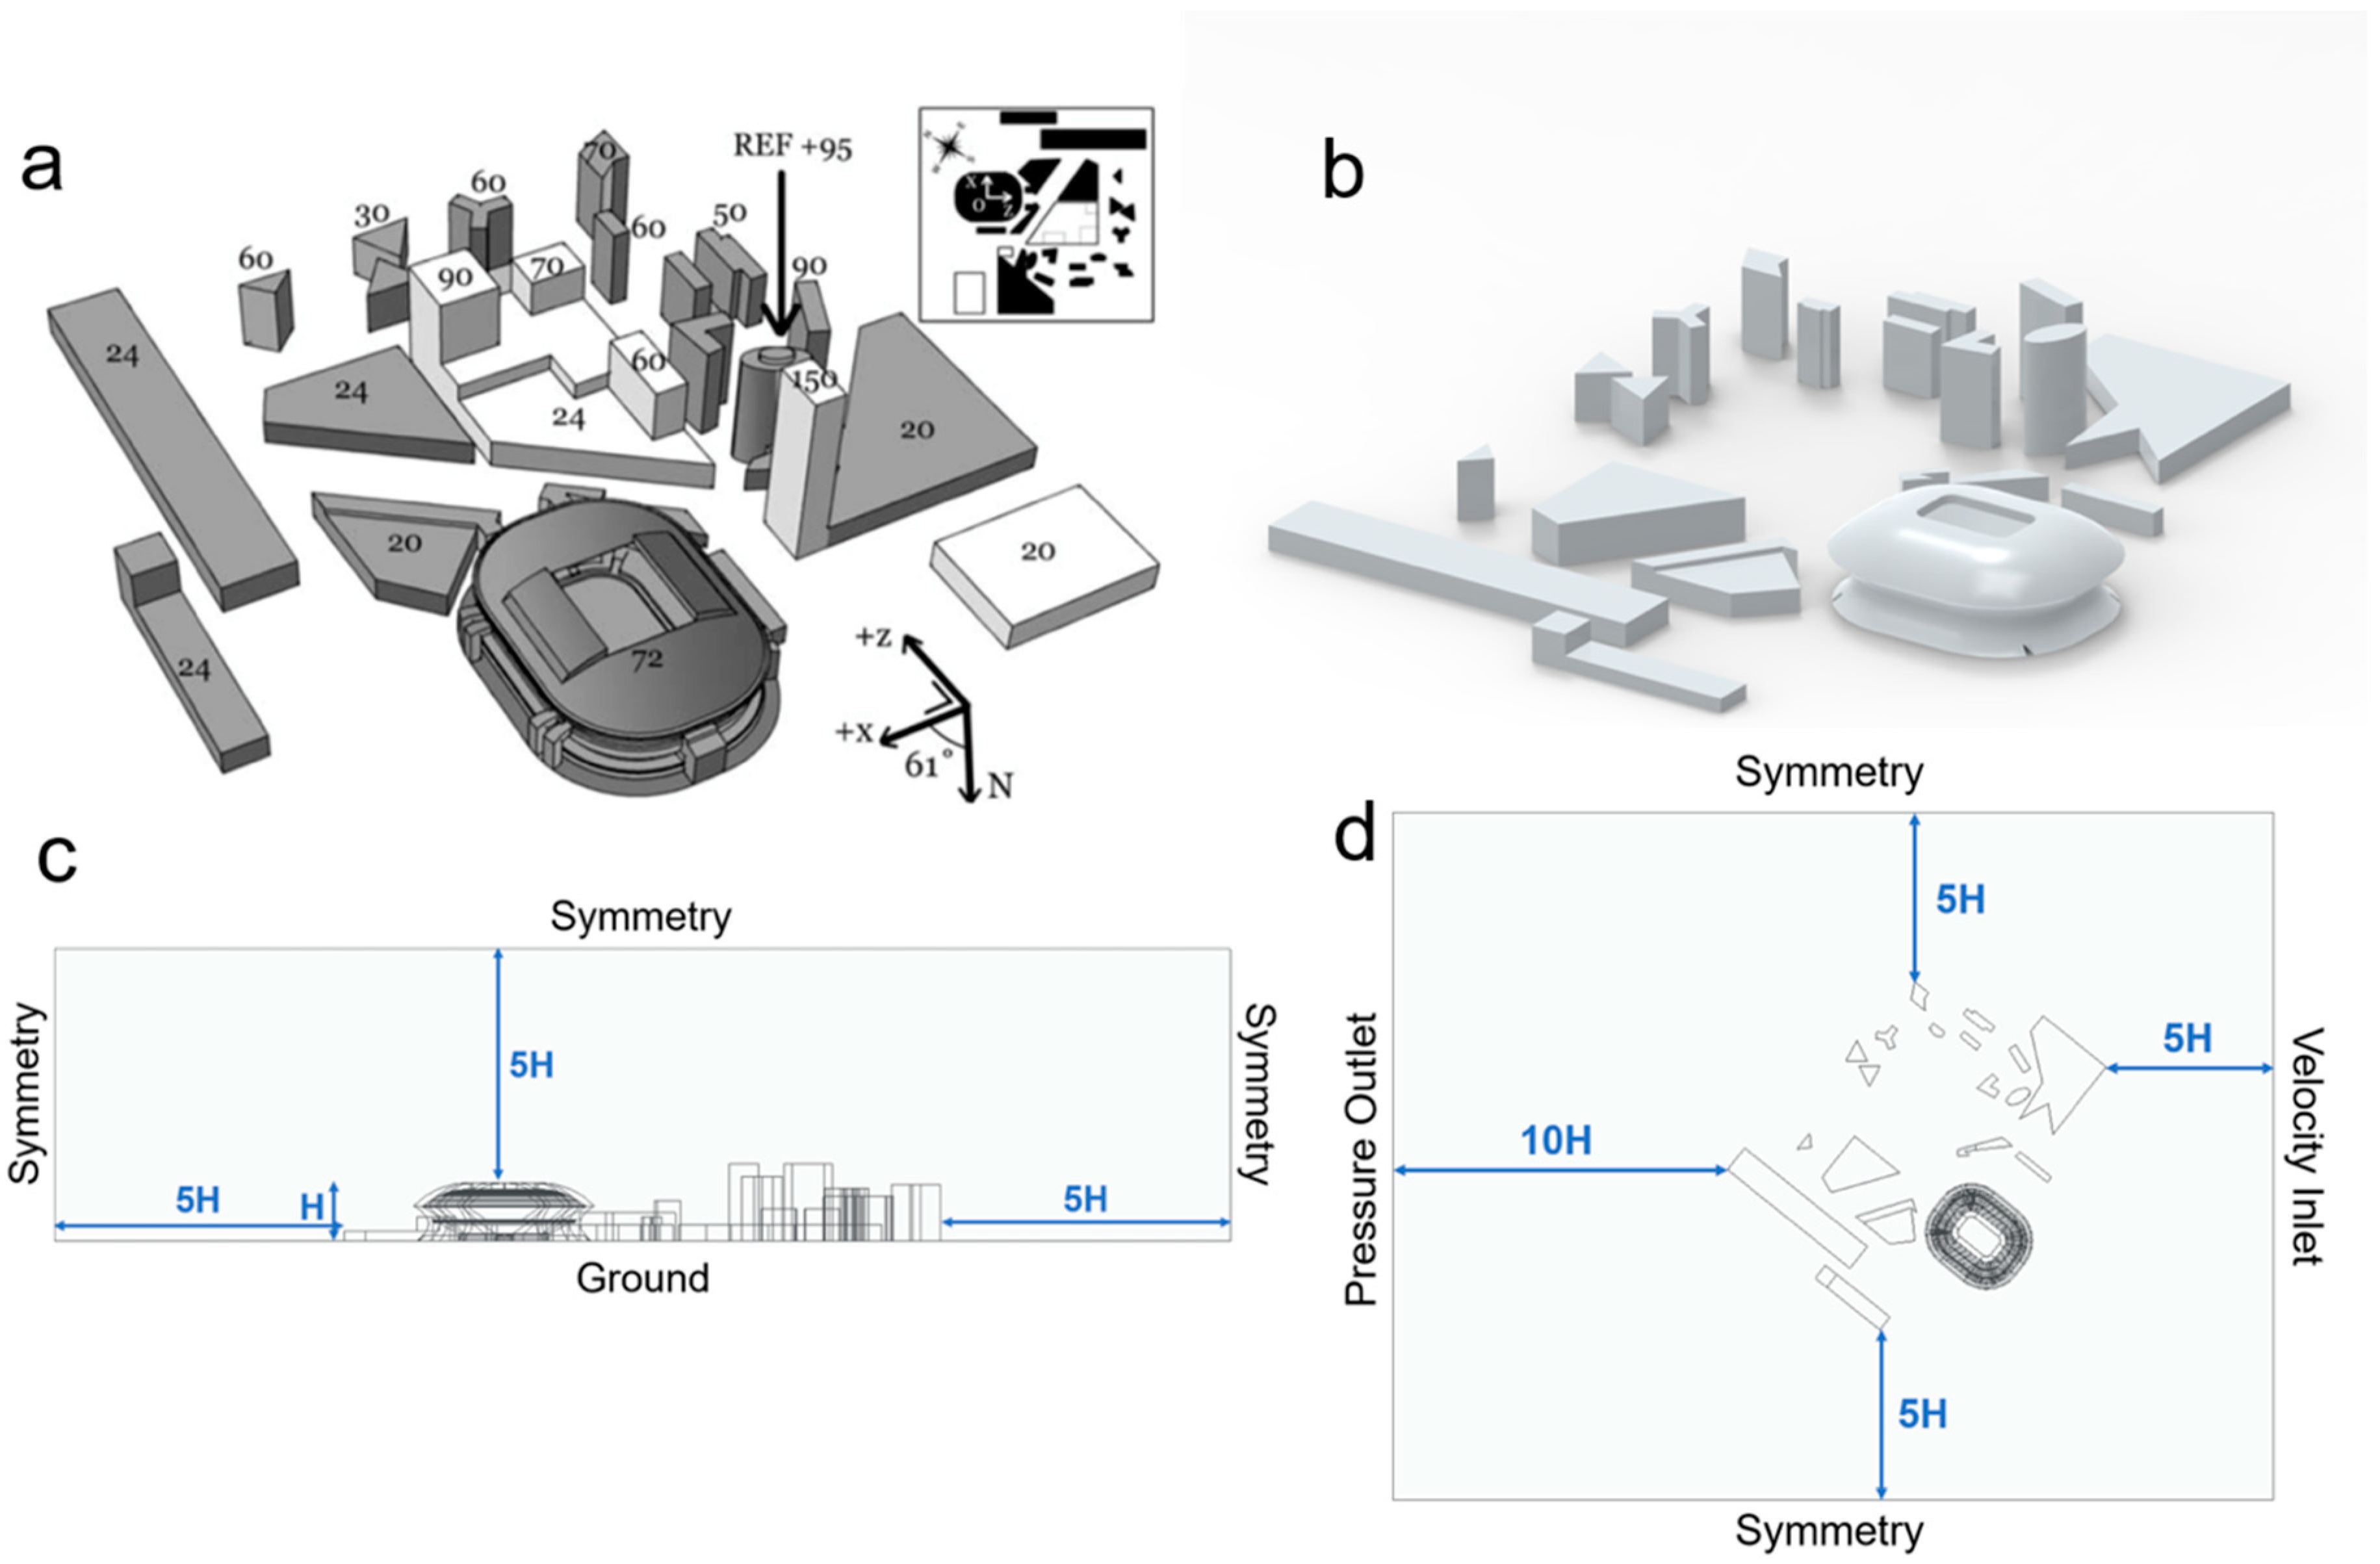
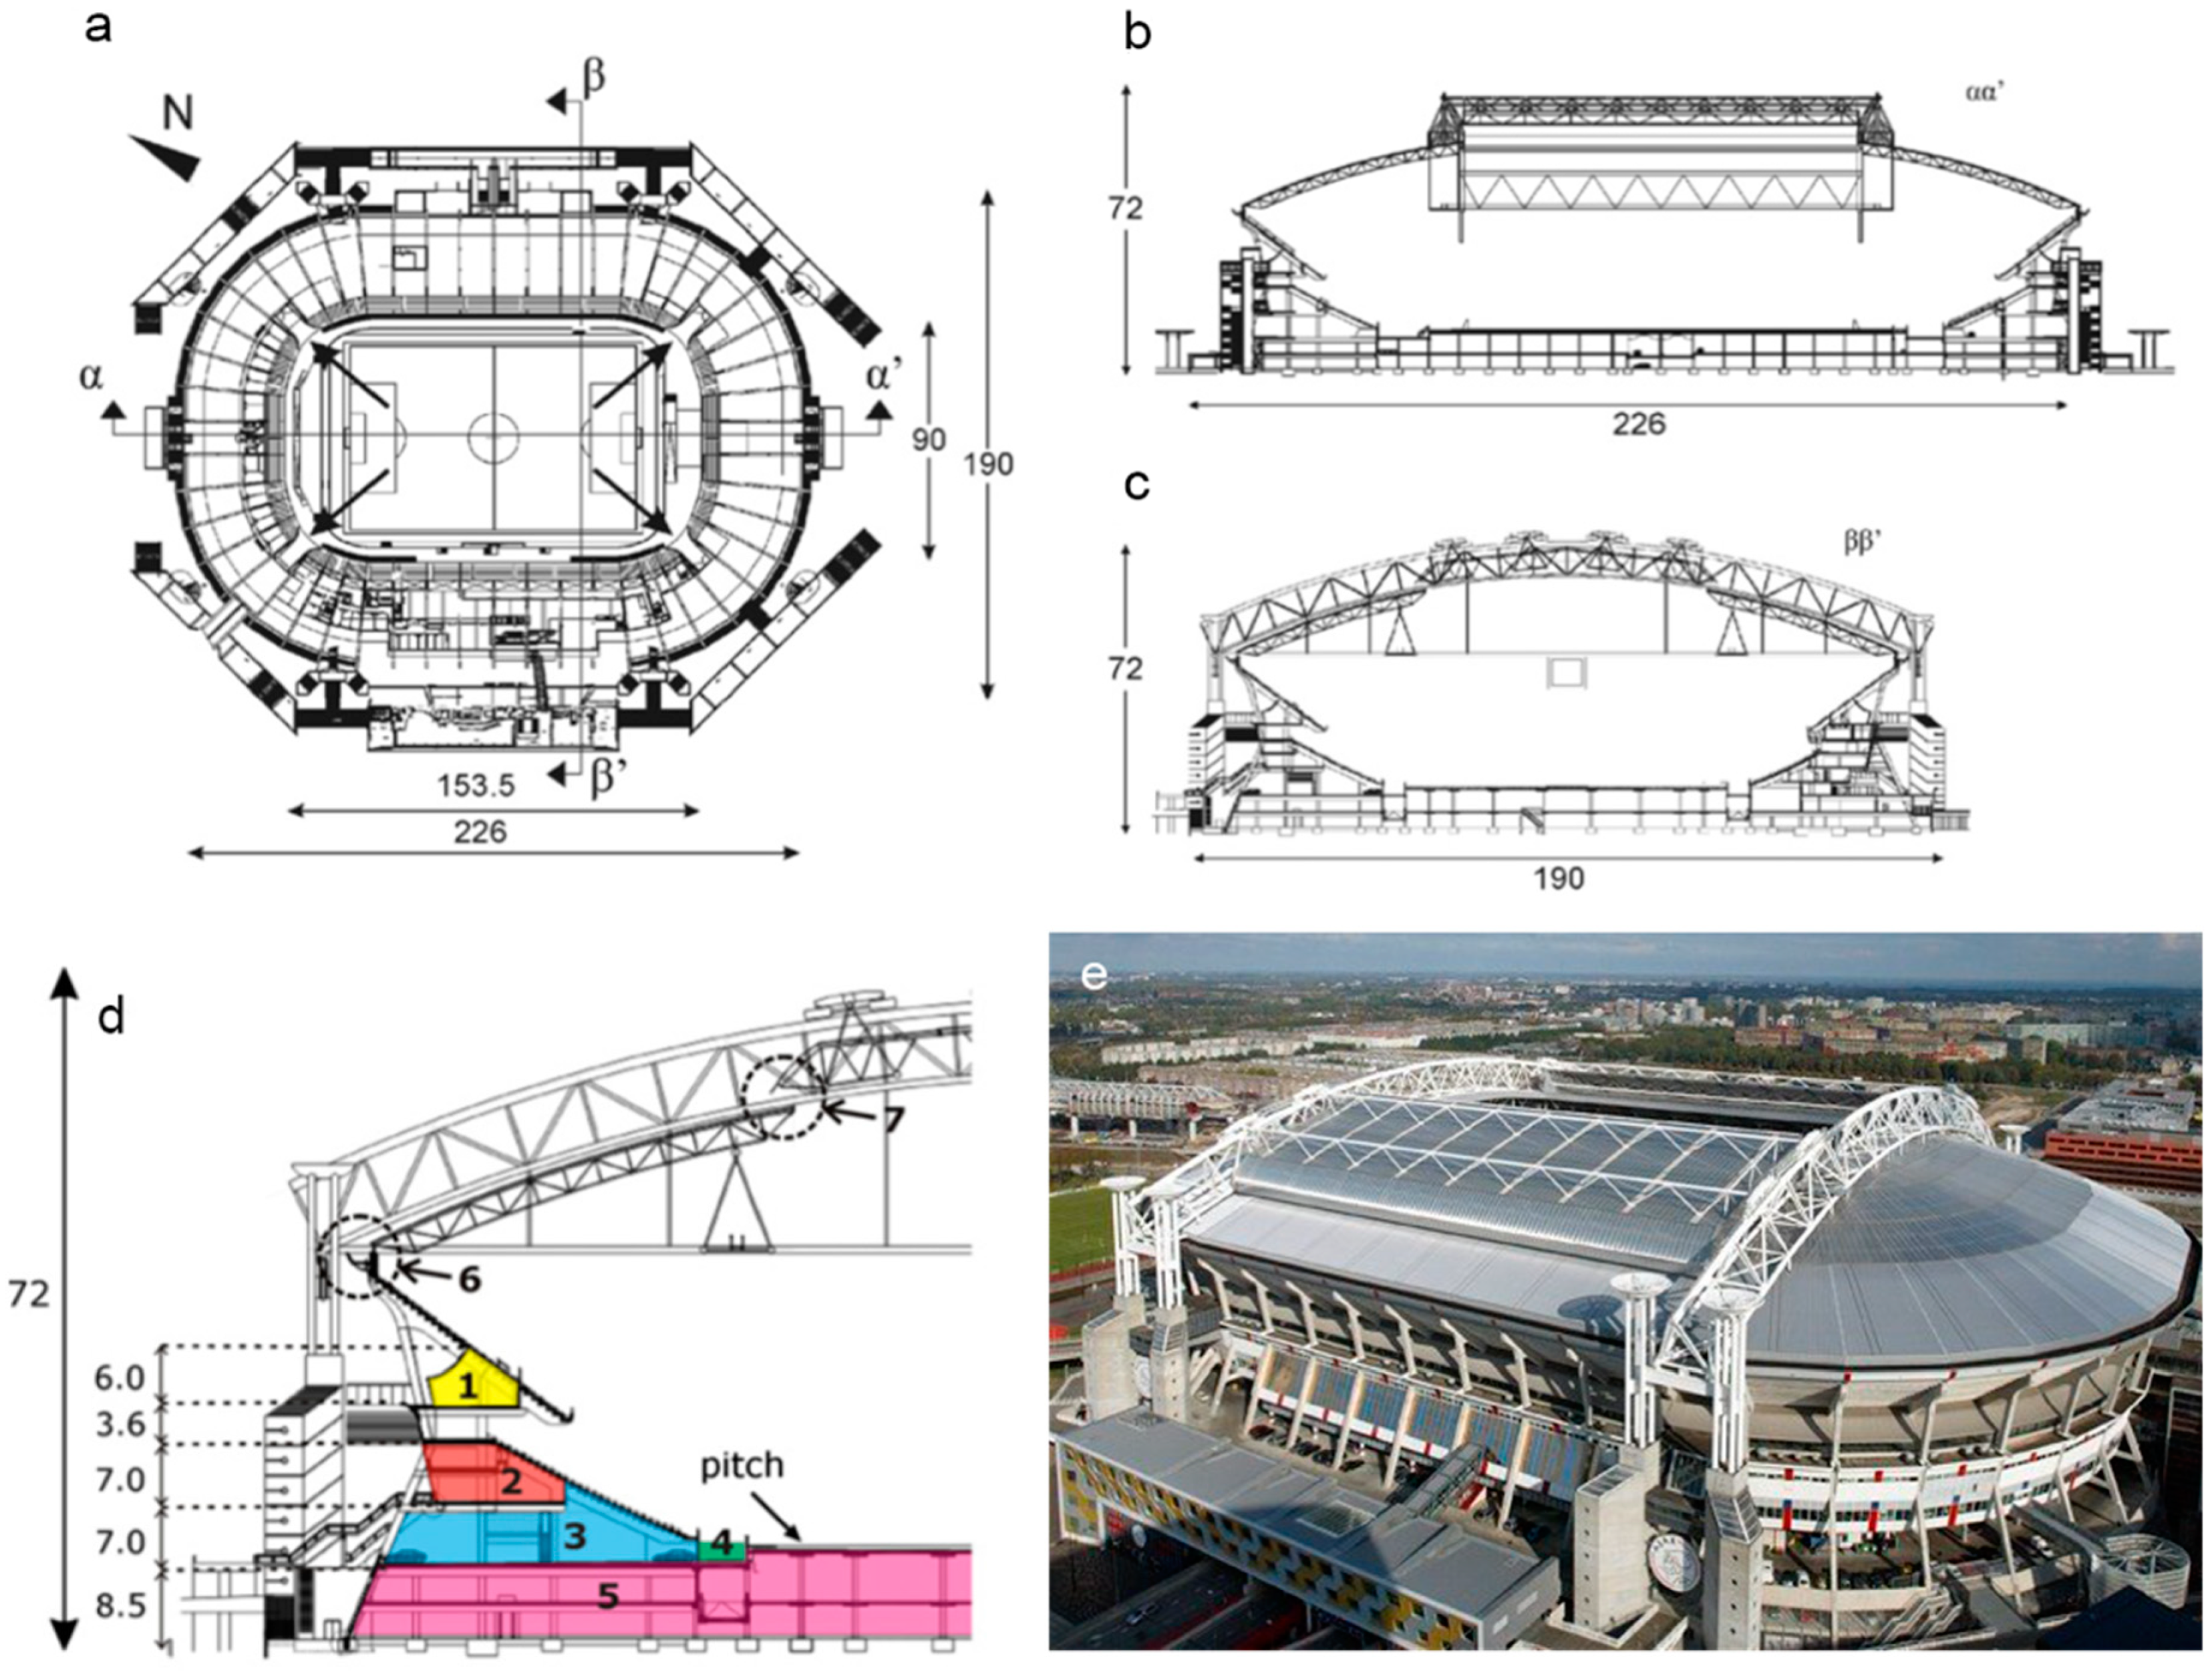
2.1. Development of Model Geometry and Computational Domain
2.2. Details of Computational Grid
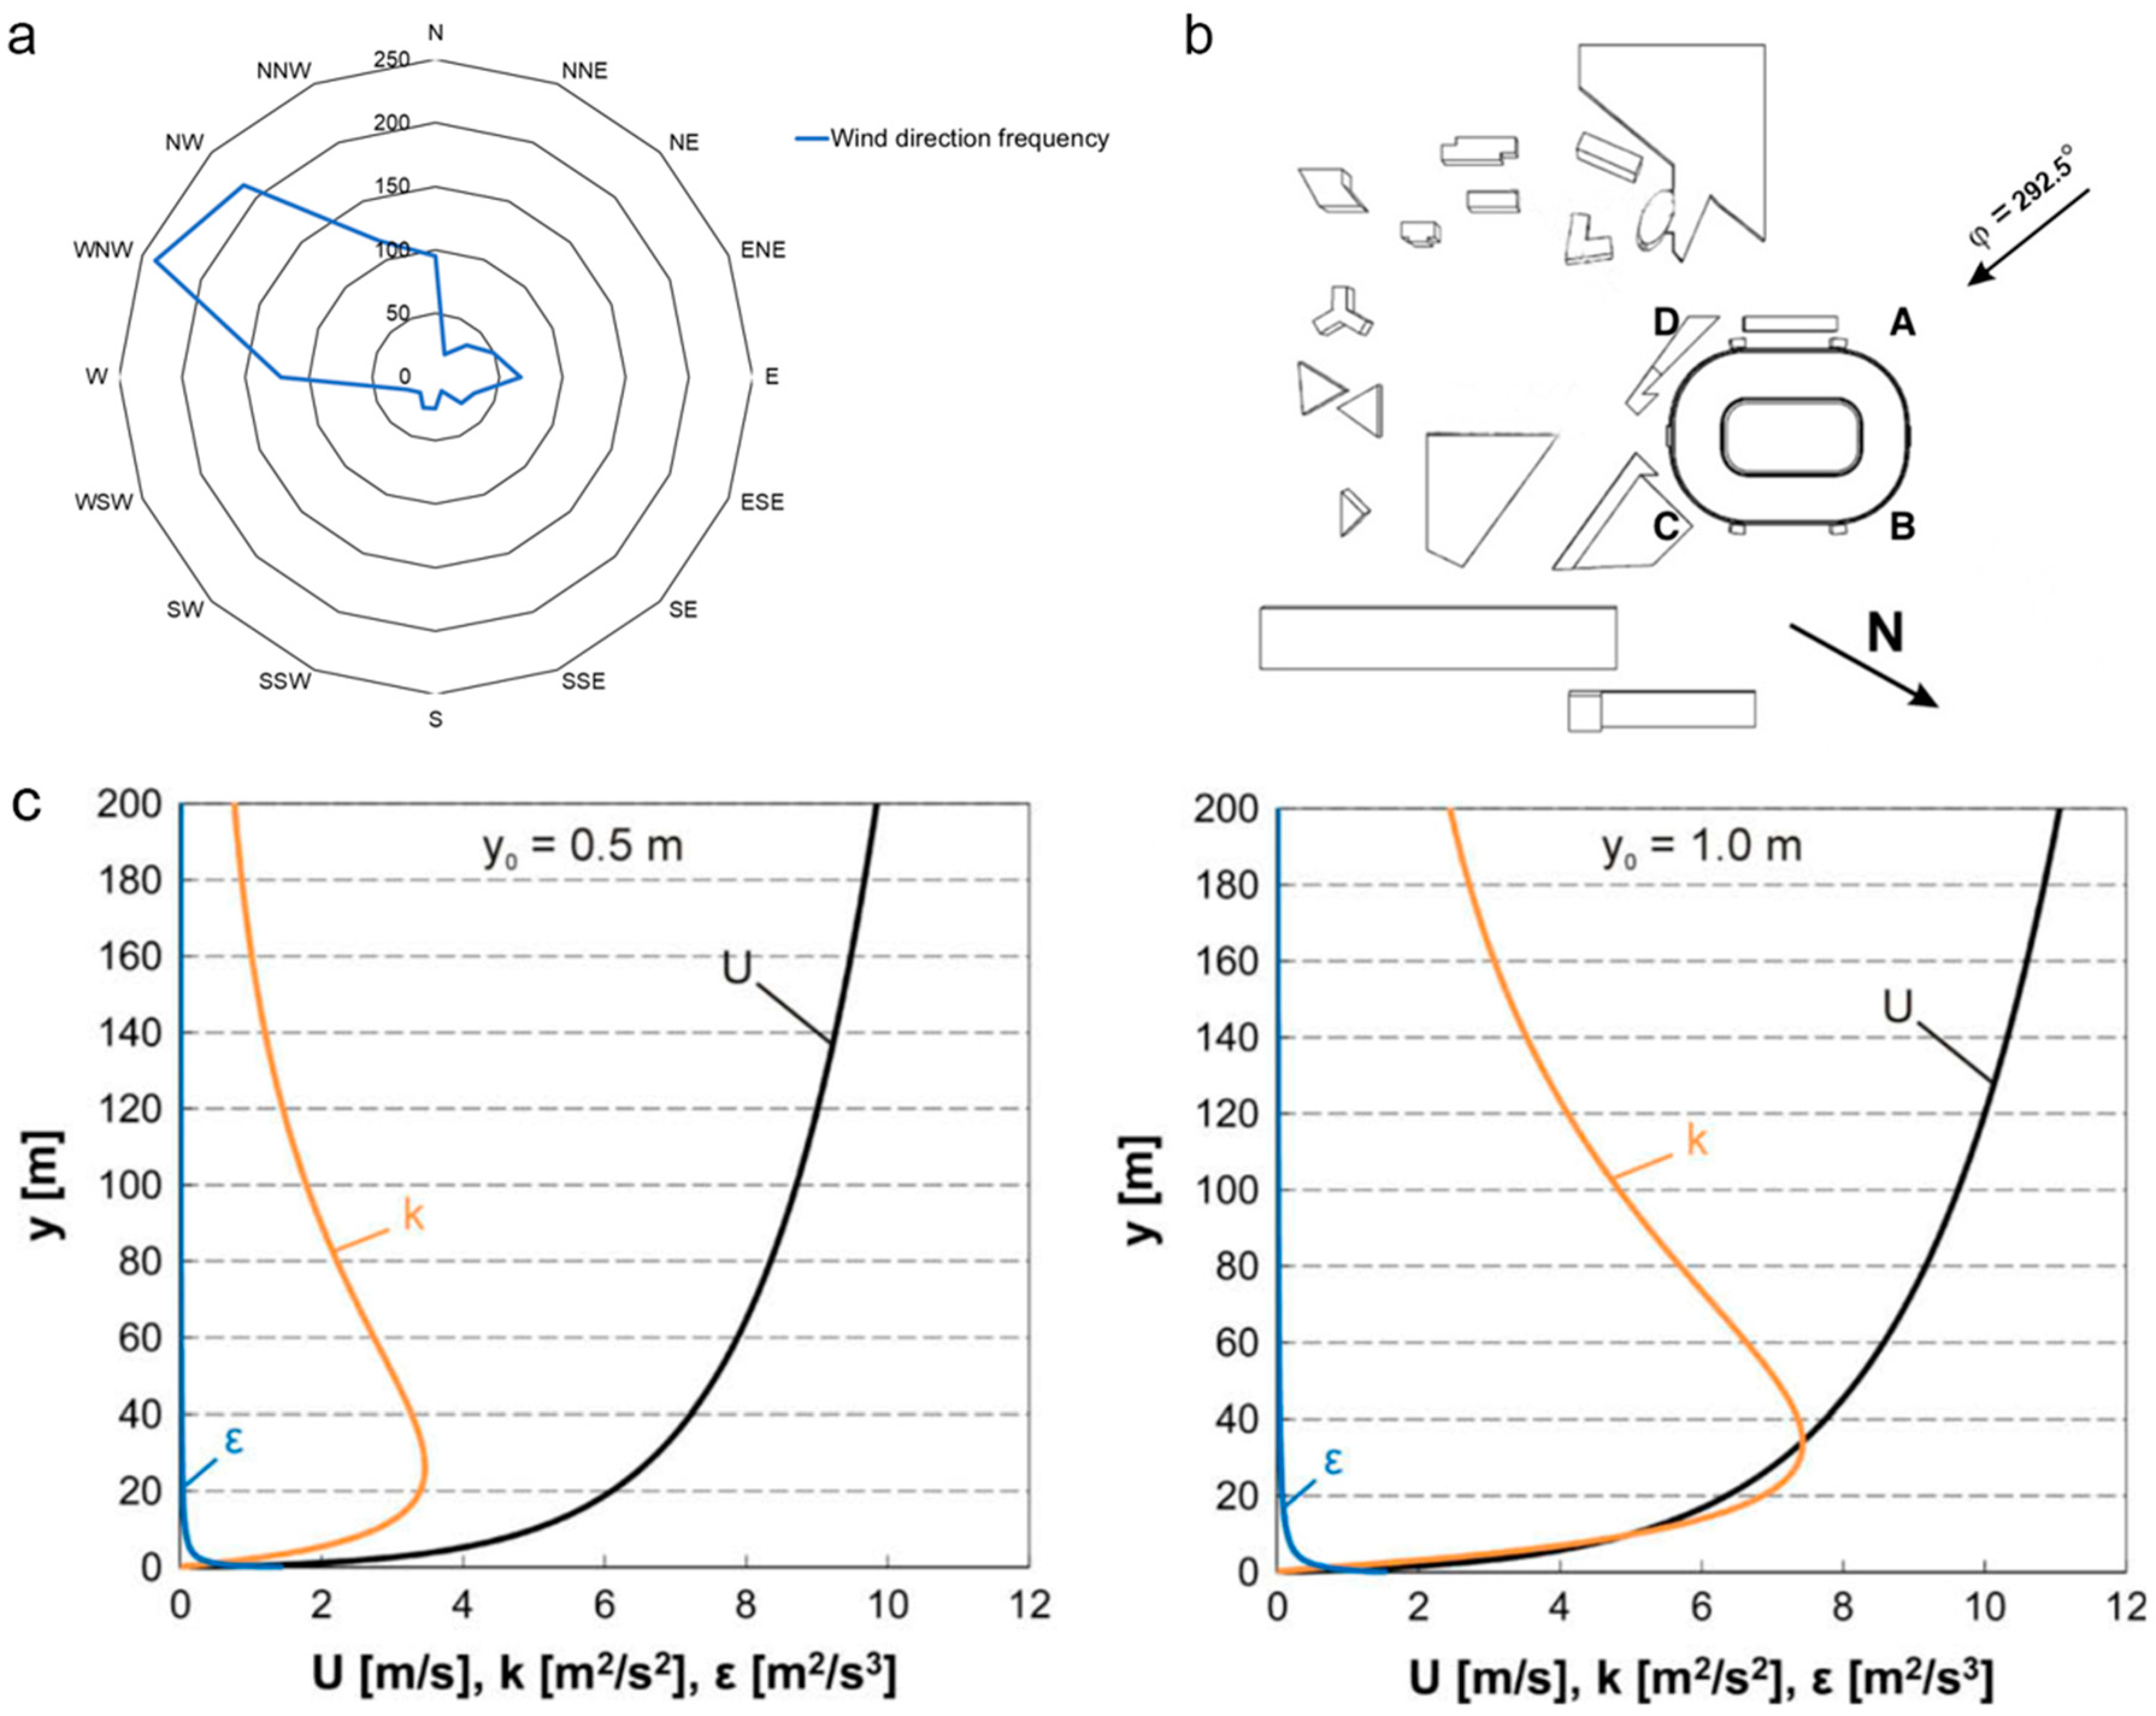
2.3. Boundary Conditions
2.4. Fluent Setup
2.5. Building Energy Simulation (BES) Modelling
- Heat storage in the air (Equation (7)).
- Convection from the room surfaces (Equation (8)).
- Heat transfer by air movement (Equation (9)).
- The convective portion of casual heat gains.
- The convective portion of any plant (heating, ventilation, air-conditioning (HVAC) systems) input.
- Heat conduction out of the building element (Equations (5) and (6)).
- Convection to the surface from the room air (Equation (8)).
- Thermal radiation exchanged with the radiant temperature node (Equation (10)).
- Solar gain absorbed by the surface.
- The radiant portion of casual heat gains to the surface.
- The radiant portion of plant (HVAC systems) input to the surface.
- Heat conduction out of the building element (Equations (5) and (6)).
- Convection to the surface from the outside air (Equation (8)).
- Thermal radiation exchanged with the external environment (Equation (11)).
- Solar gain absorbed by the surface.
- Water vapour transfer by the air movement.
- The latent portion of casual heat gains.
- The dynamics of water vapour storage in the air.
- Any plant humidification or dehumidification from HVAC systems.
3. Results and Discussions
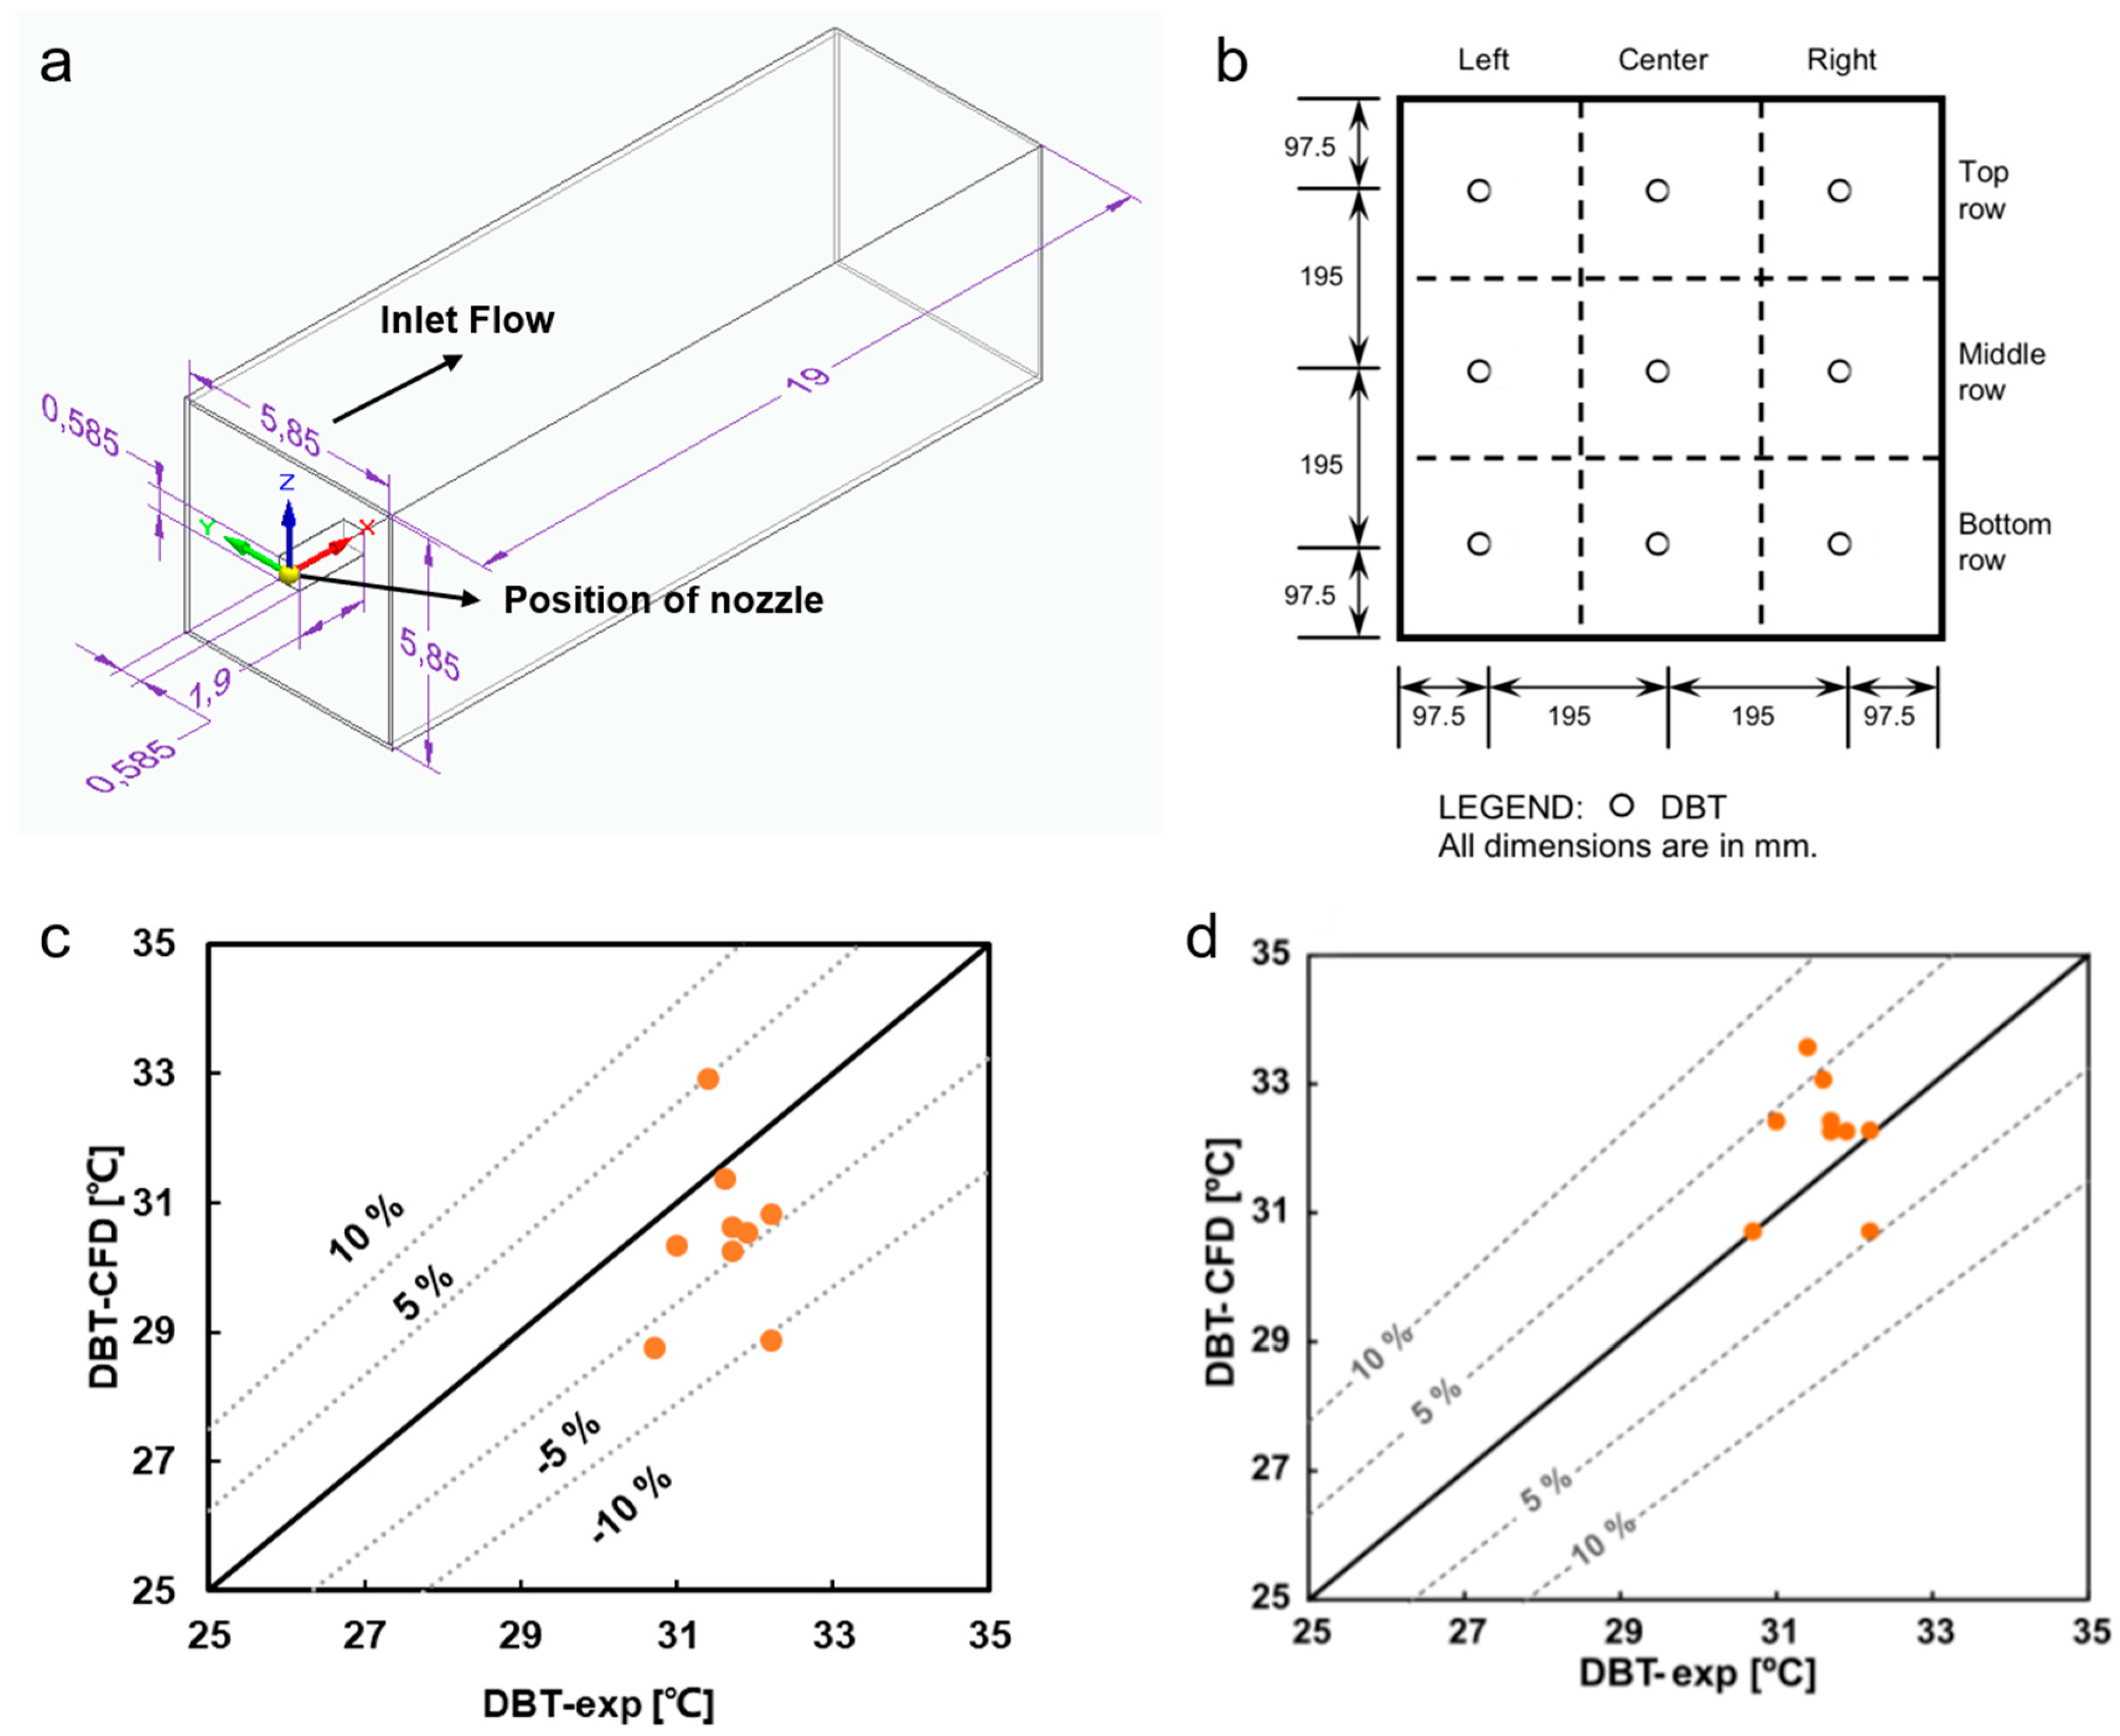
3.1. Stadium and Surrounding Environment Modelling Validation
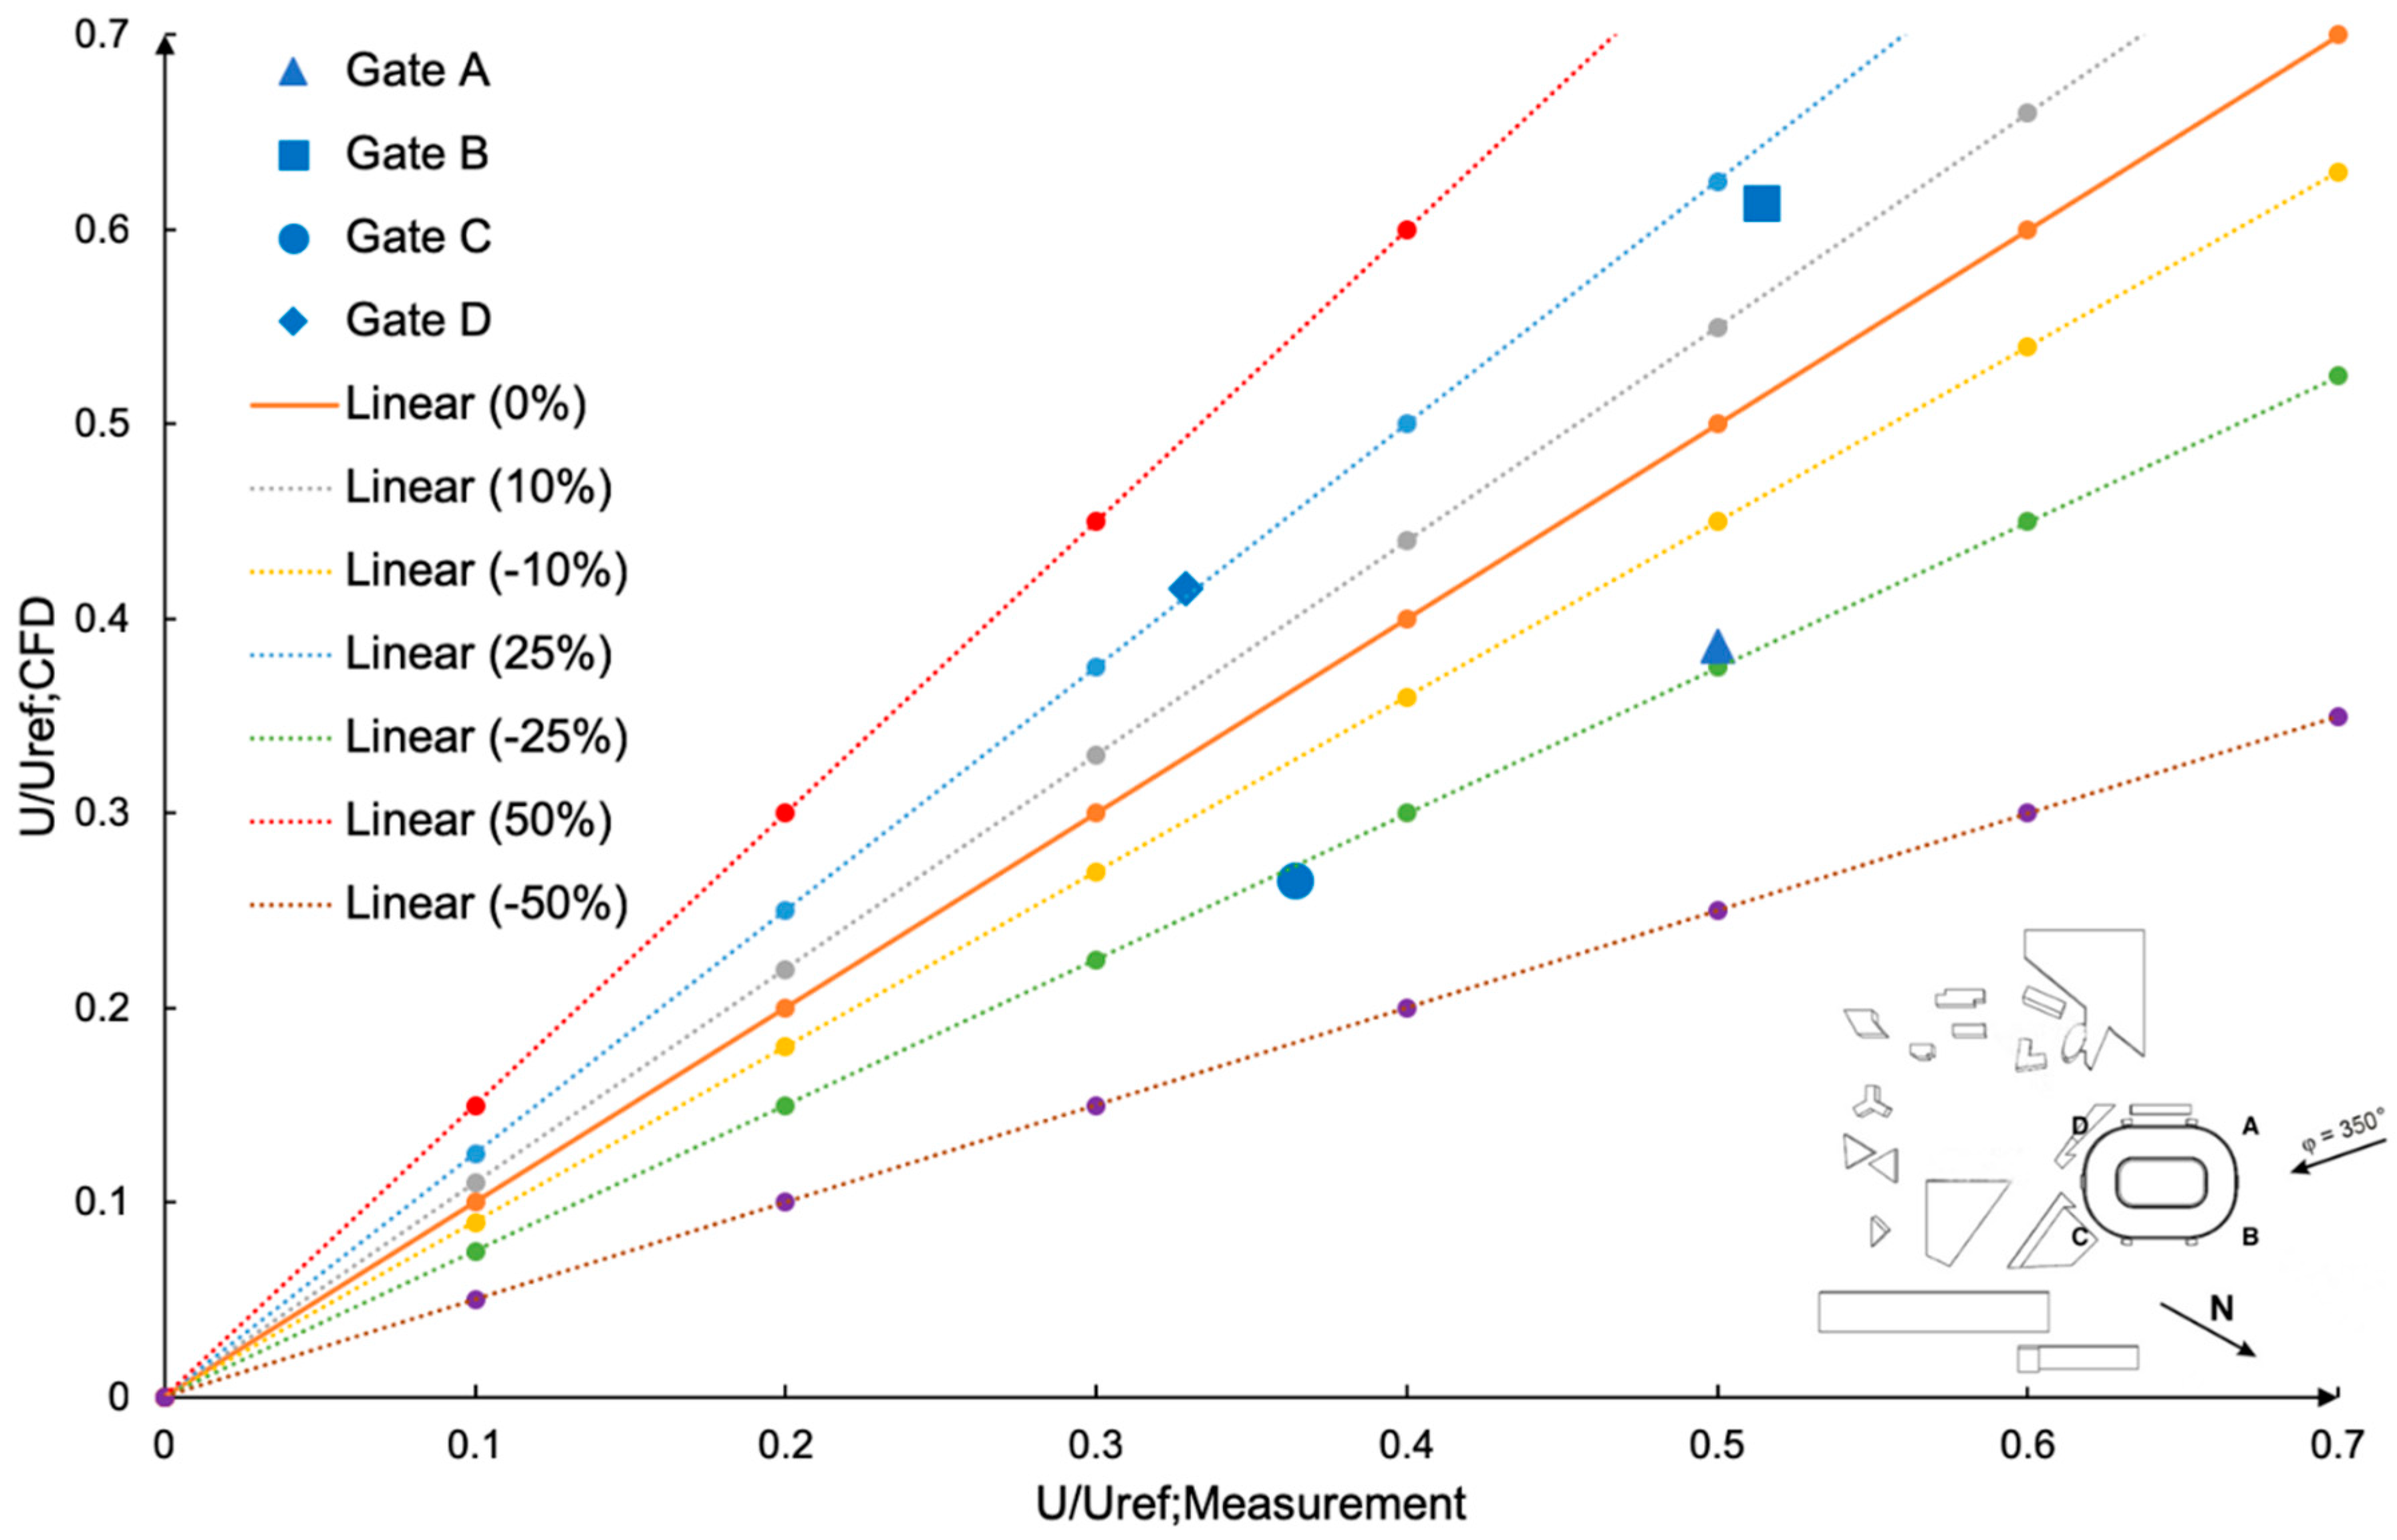
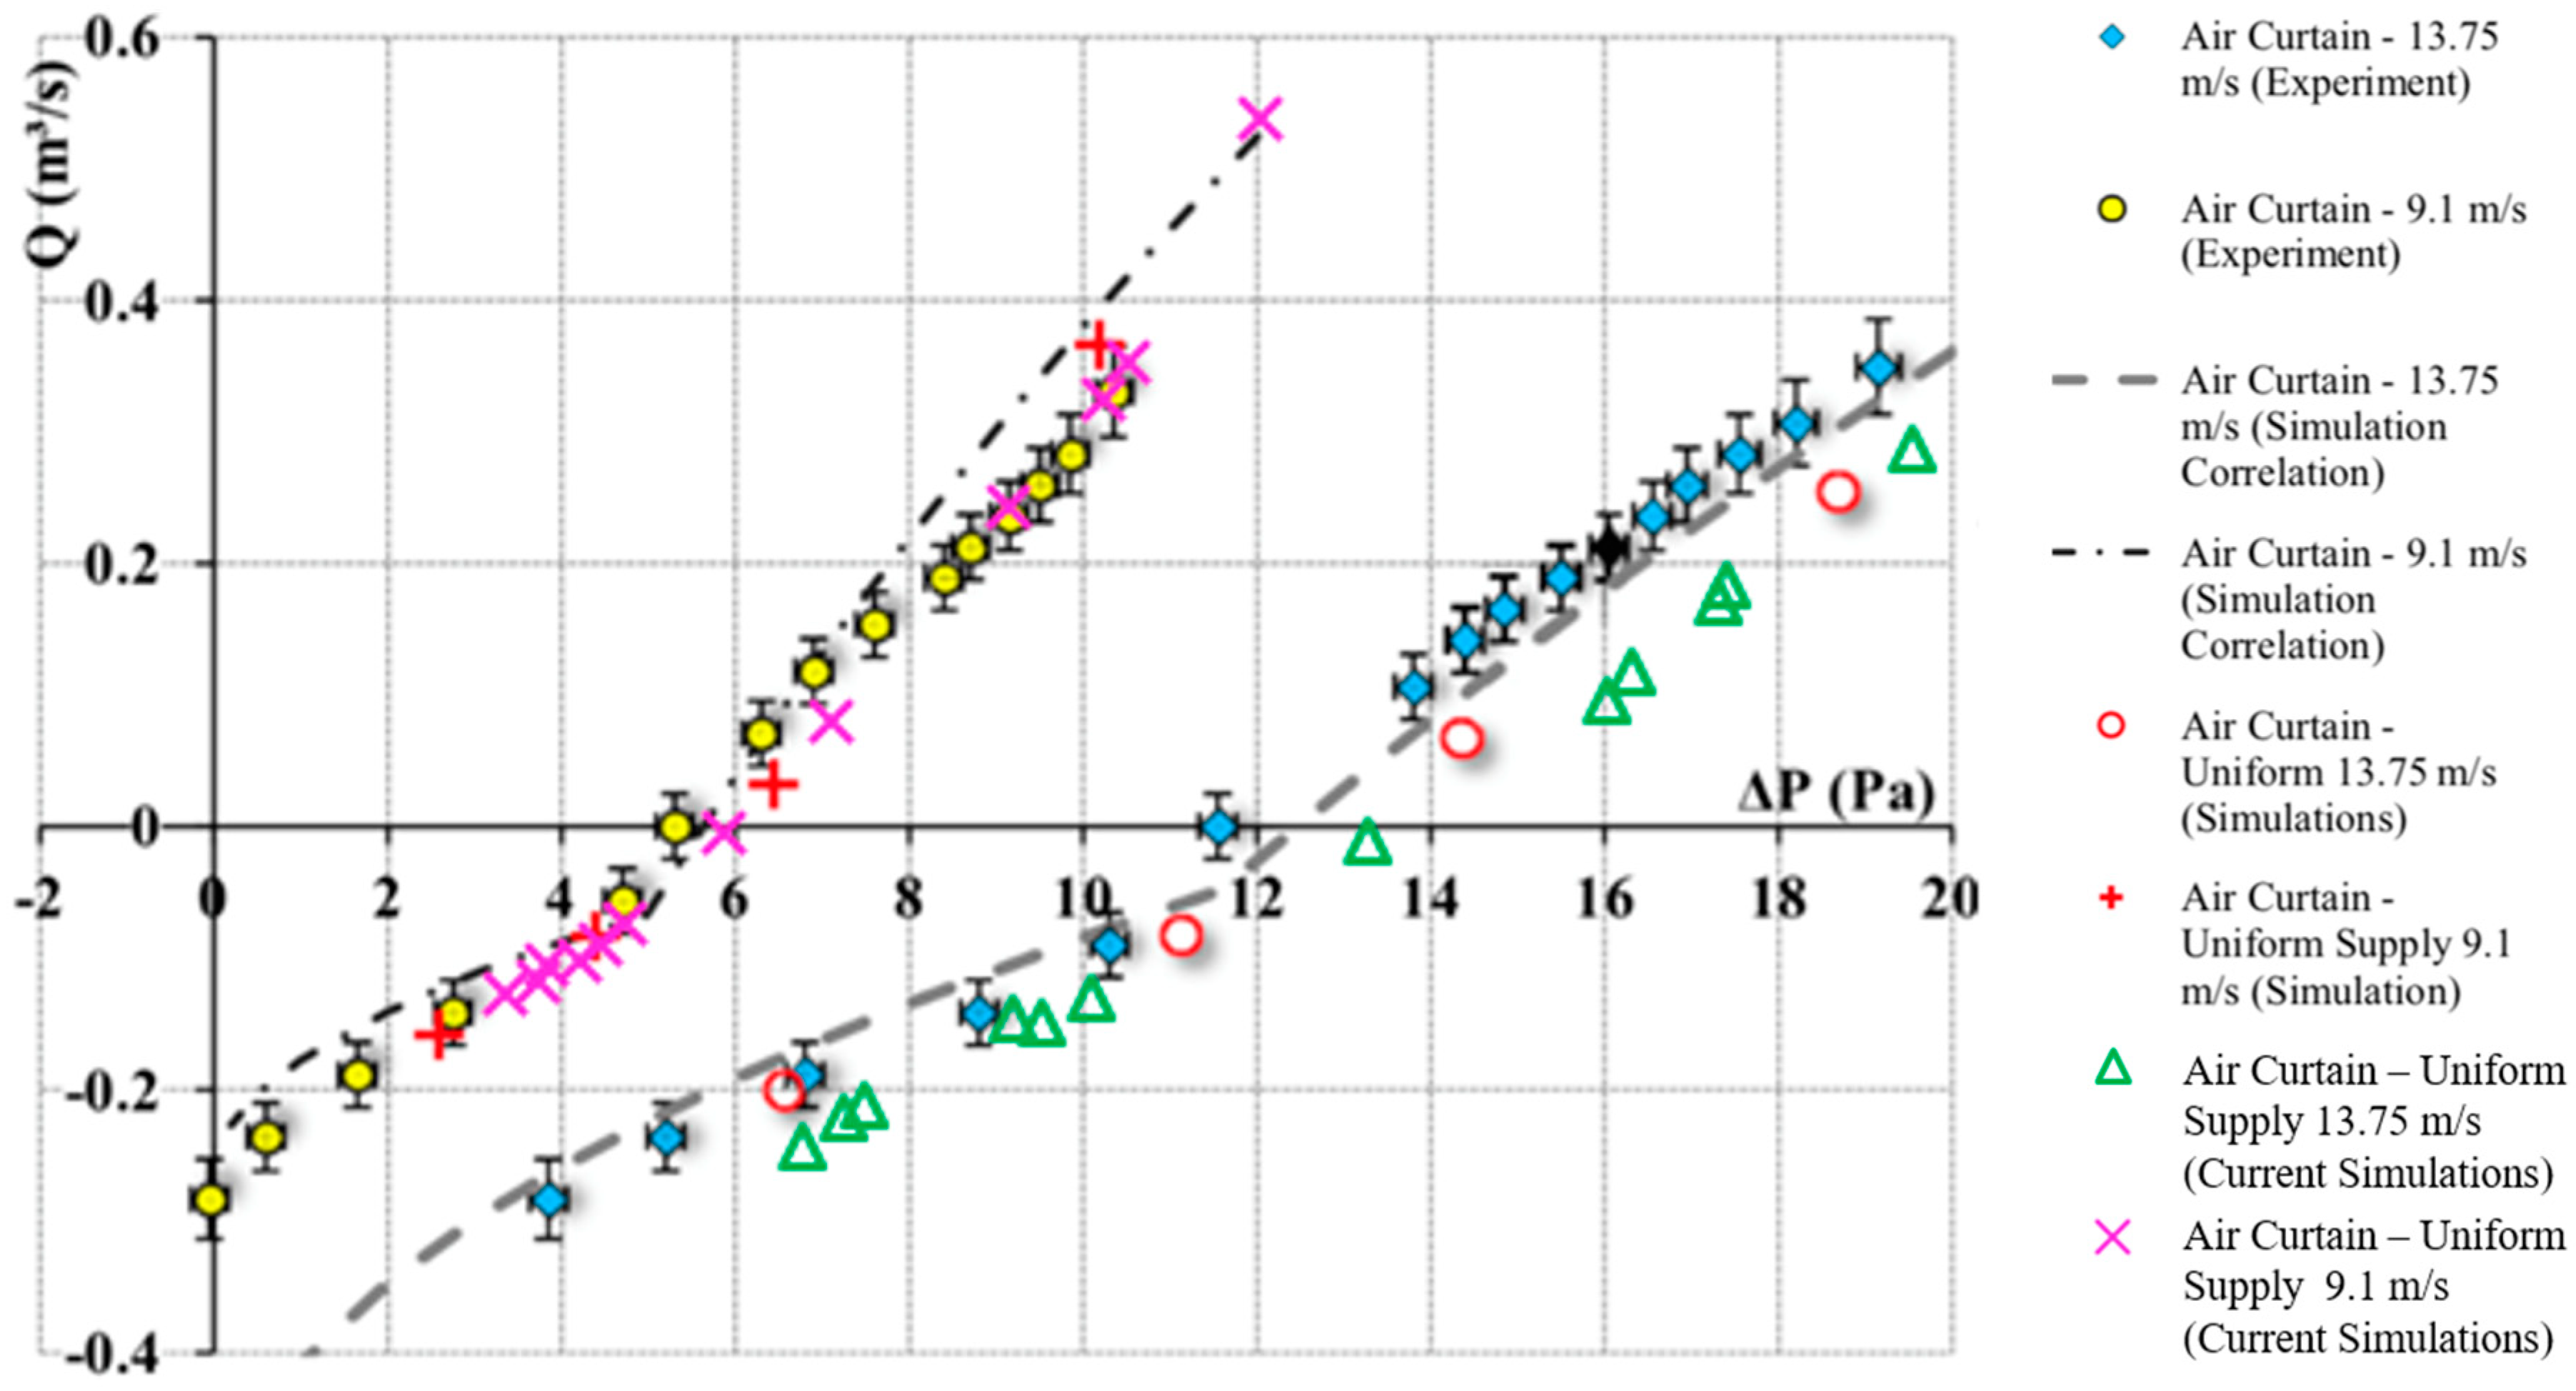
3.2. Cooling Jets and Air Curtains Modelling Method Validation
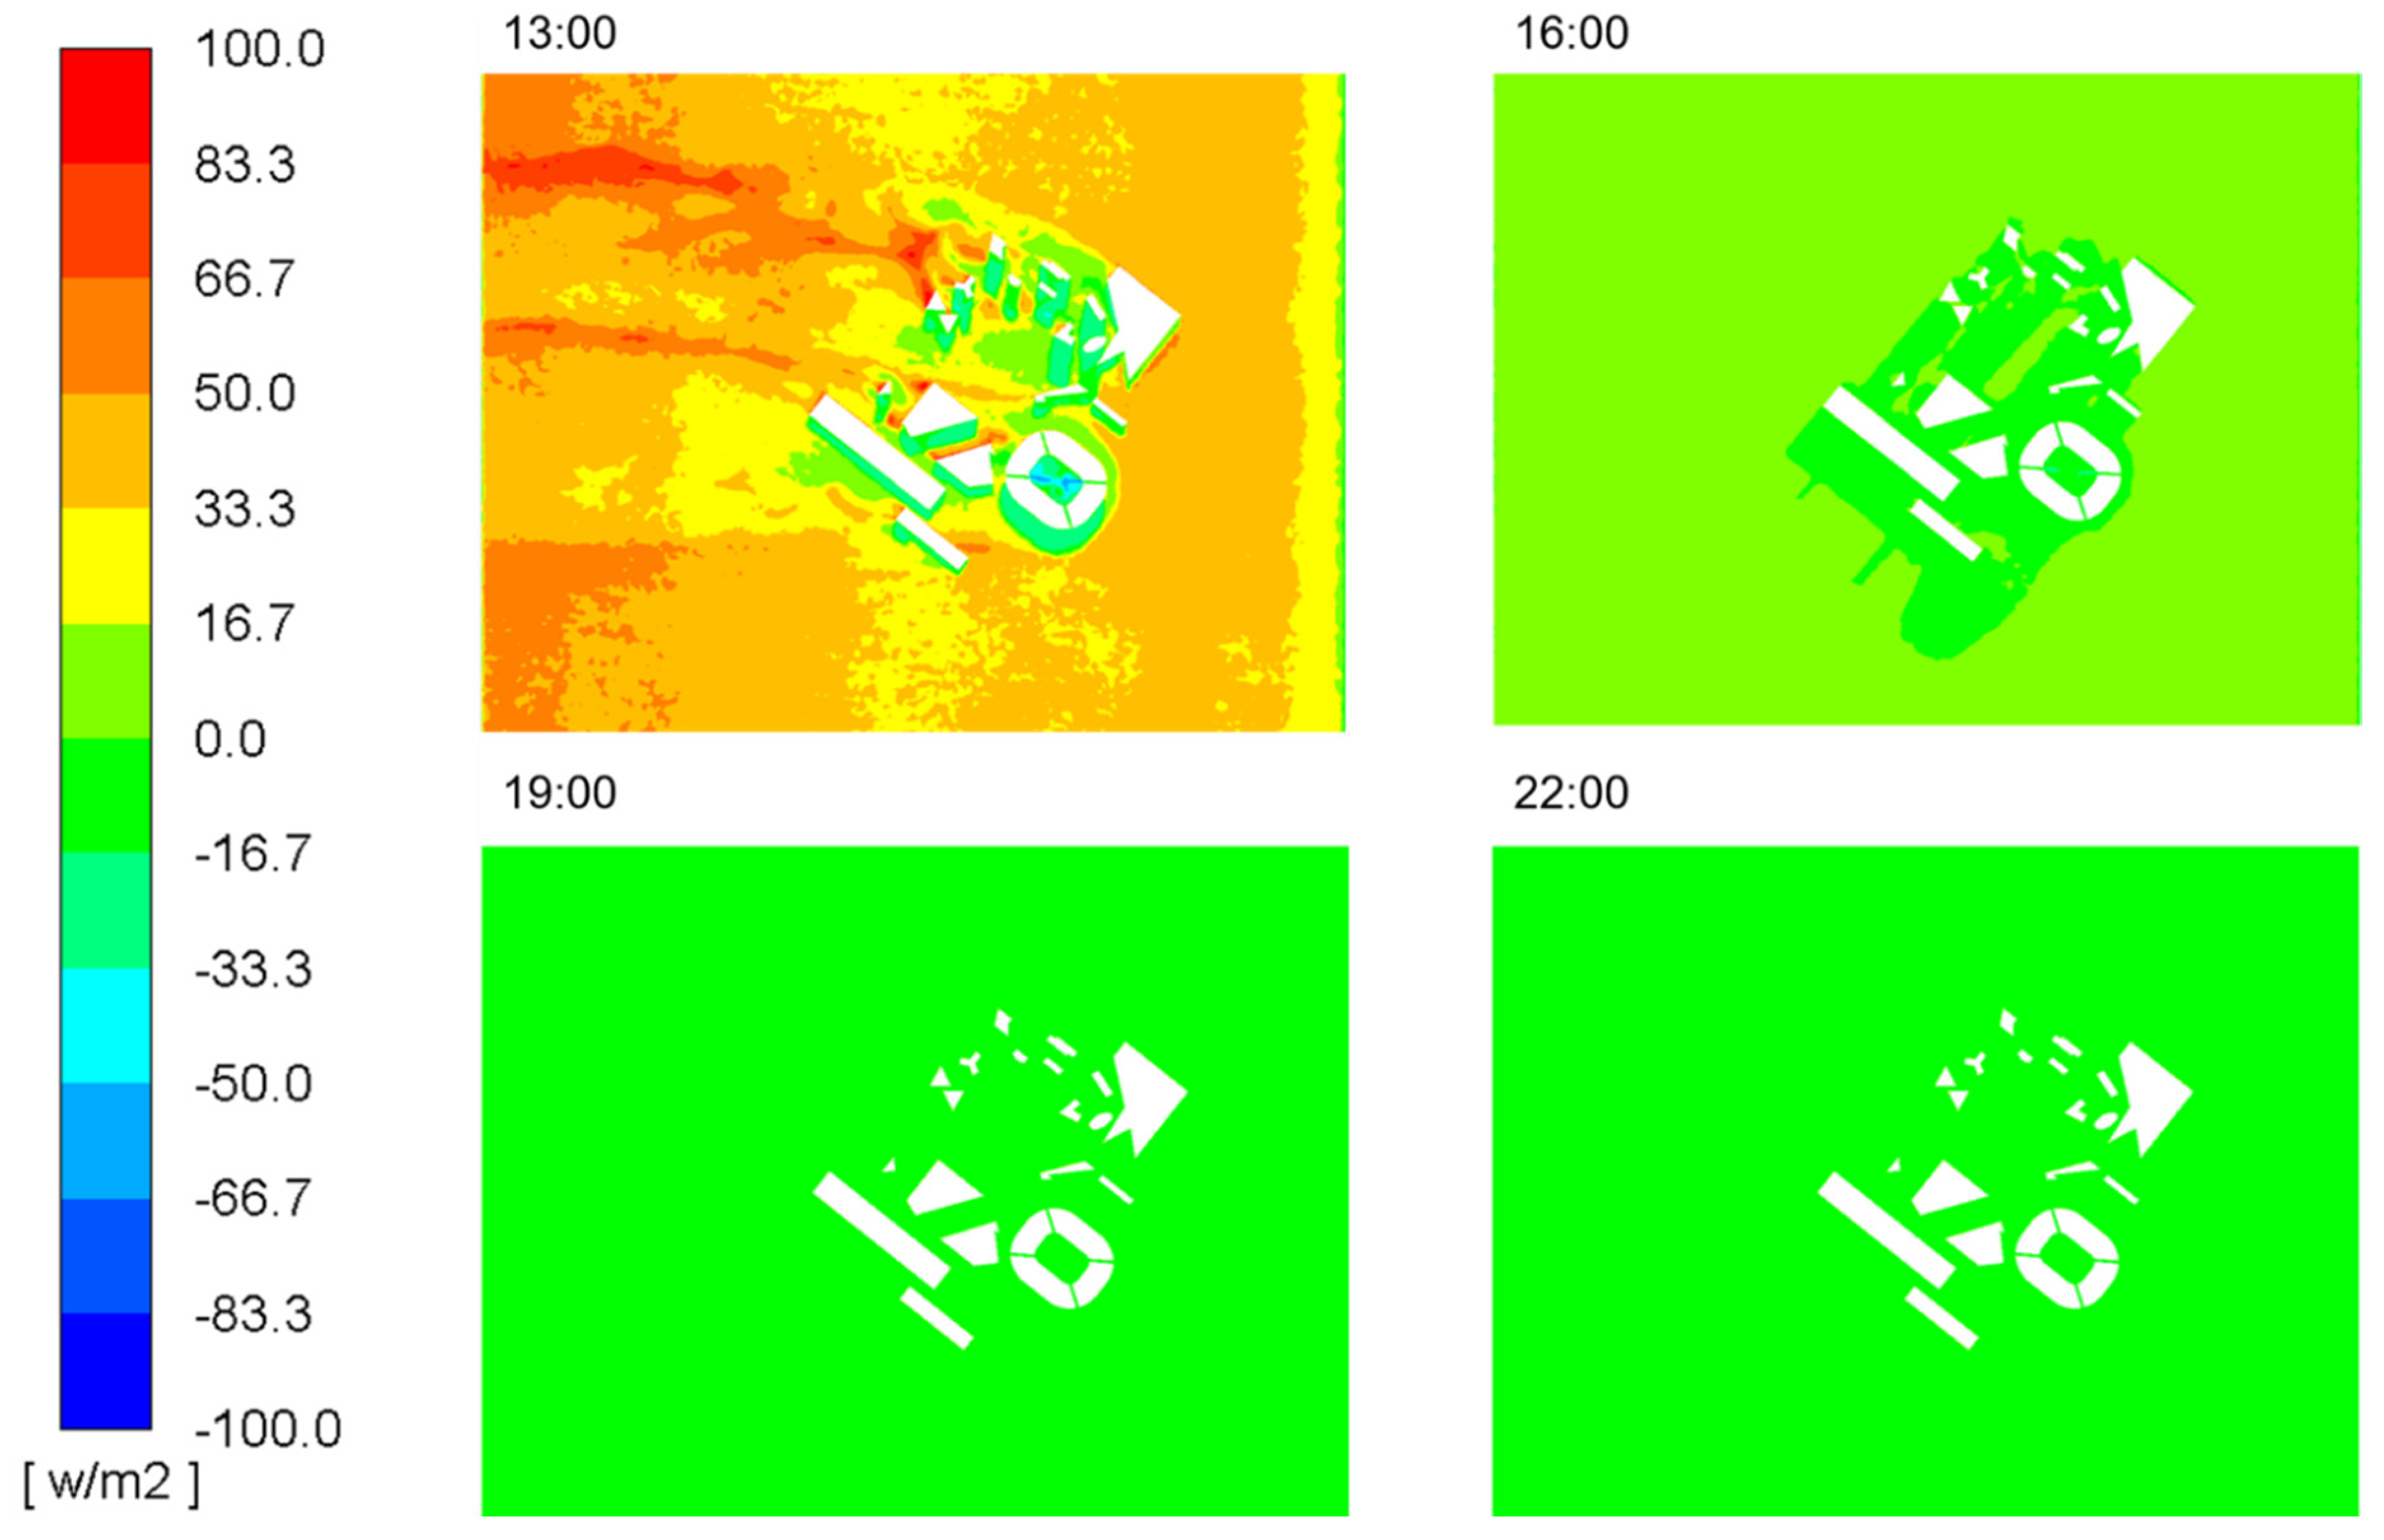
3.3. Solar Radiation Simulation Results
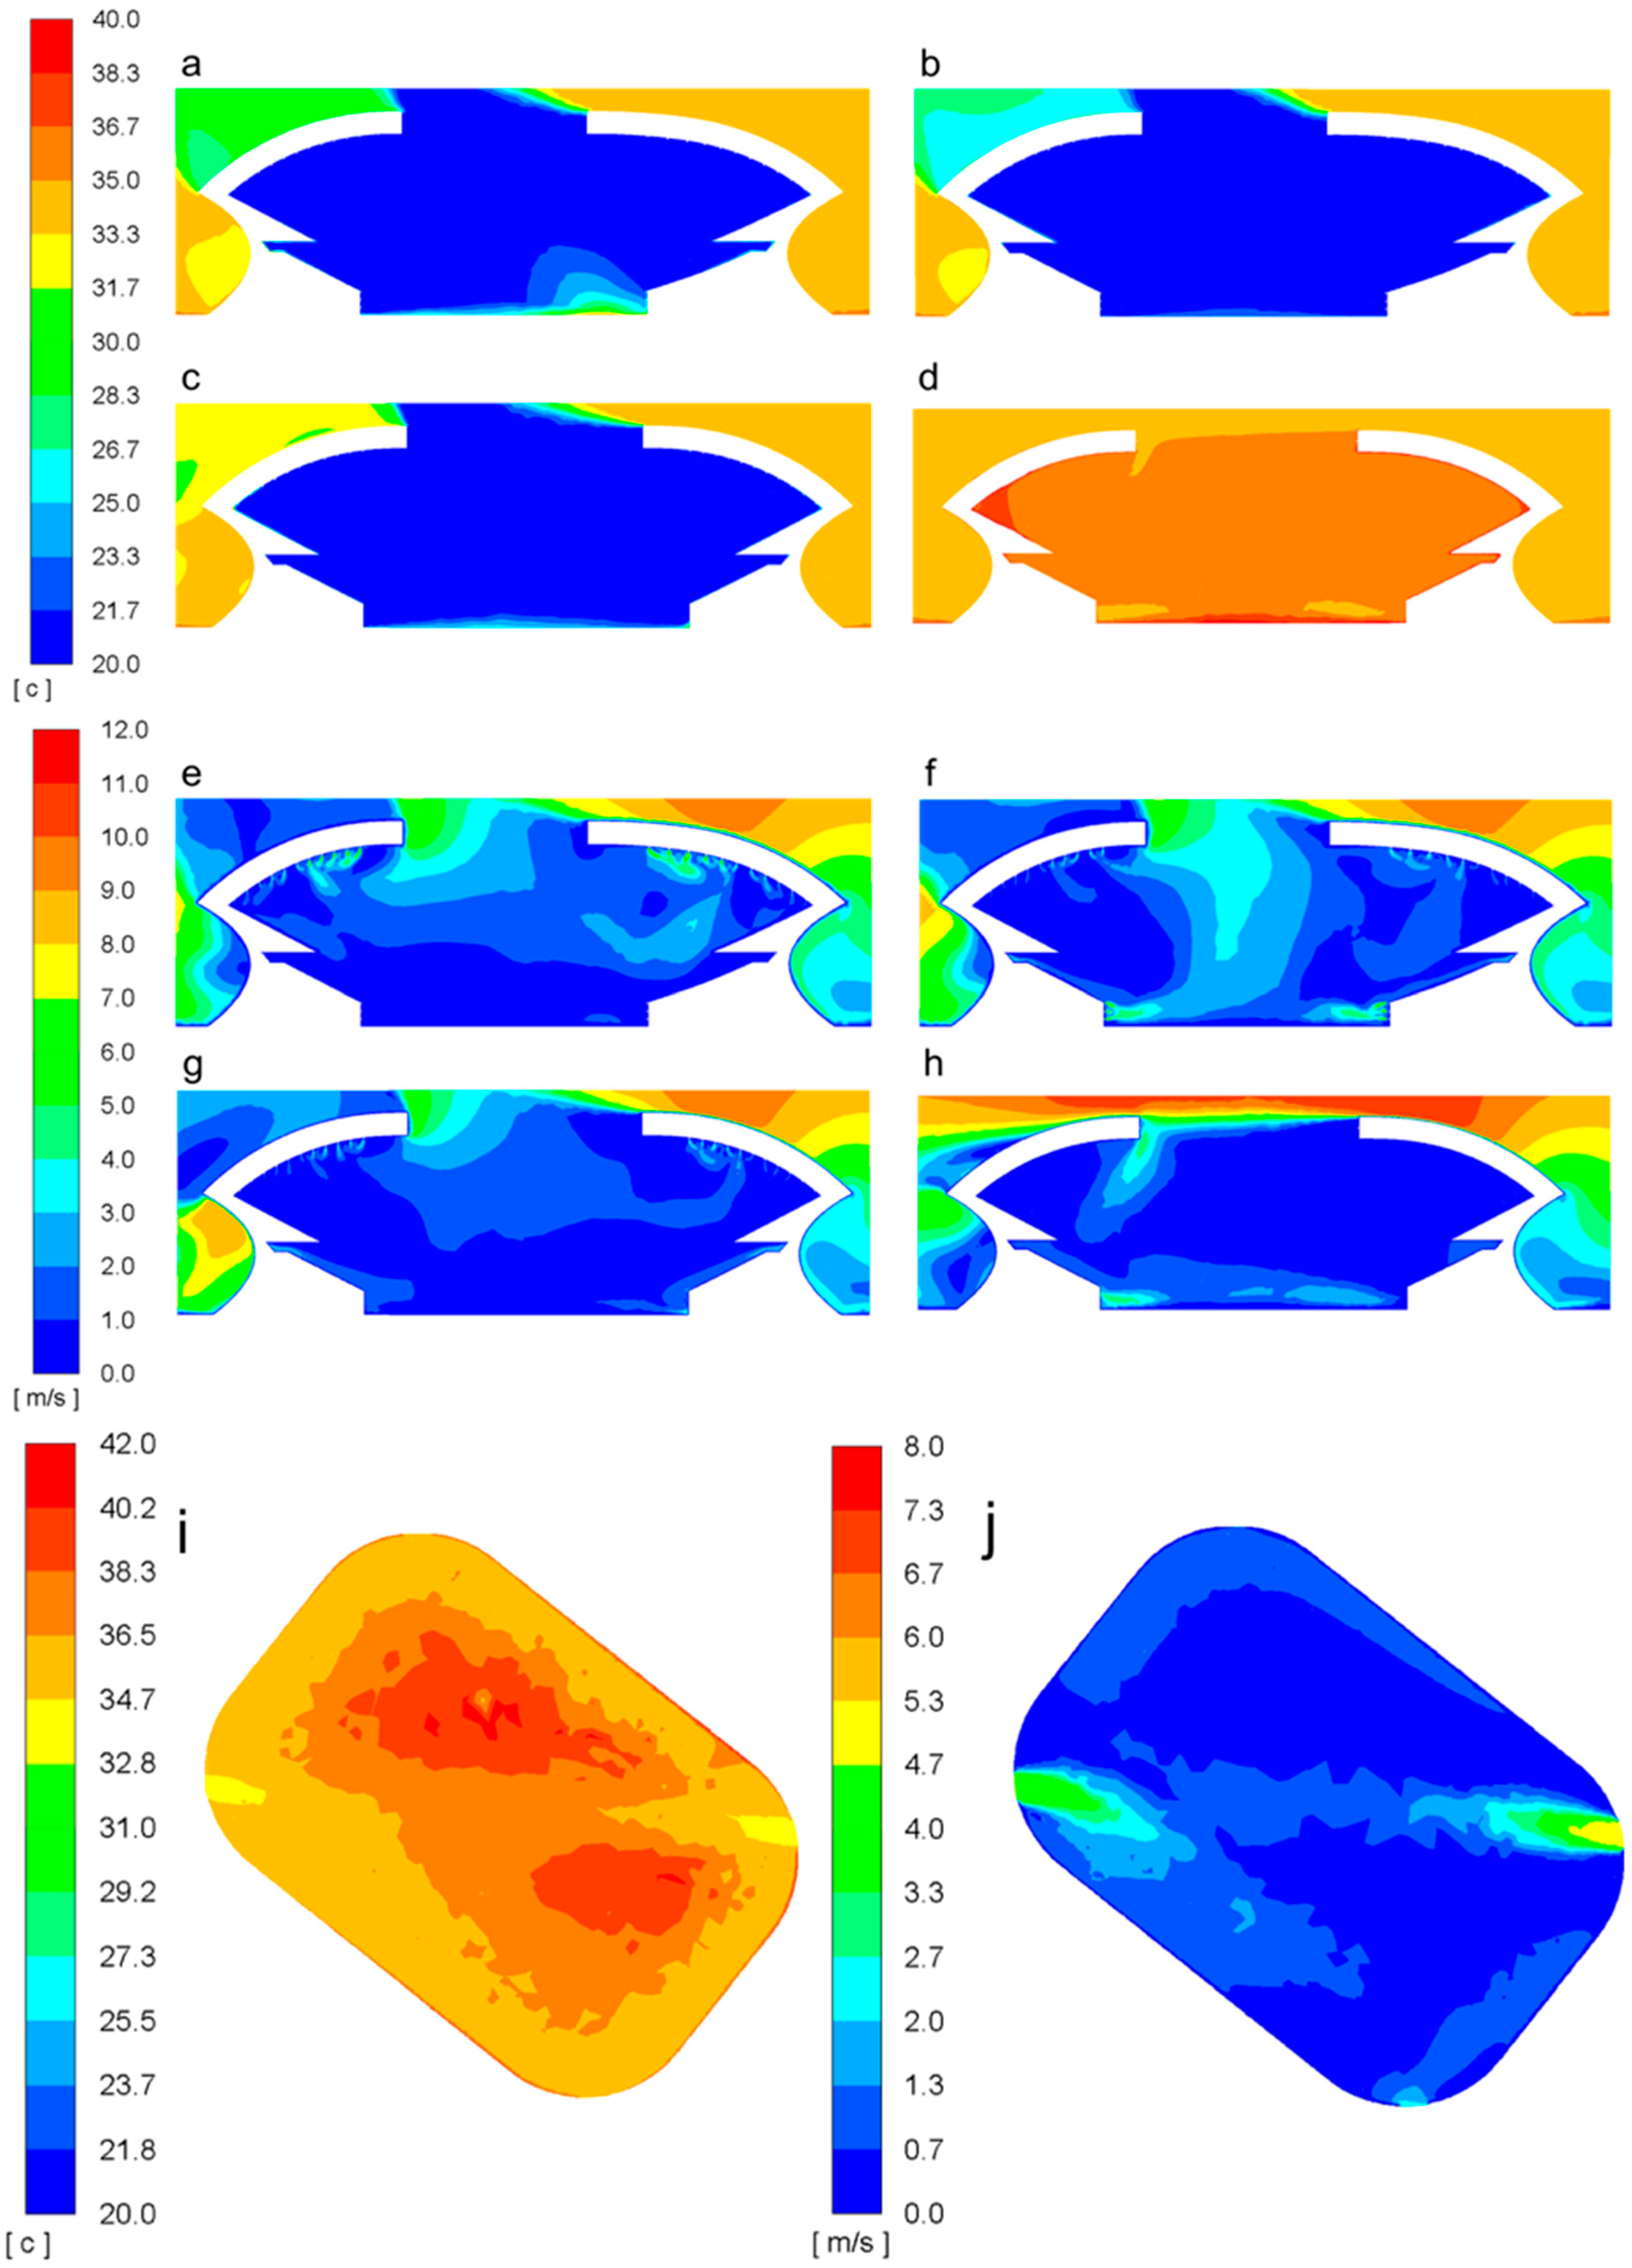
3.4. Influence of Vertical Jets Supply Velocity on Pitch Thermal Conditions
3.5. Influence of Horizontal Jets Supply Velocity on the Pitch Thermal Conditions
3.6. Influence of Air Curtains Supply Velocity on the Pitch Thermal Conditions
3.7. Comparison between Cooling Configurations and Baseline Configuration
4. Conclusions and Future Work
Author Contributions
Funding
Acknowledgments
Conflicts of Interest
References
- Talavera, A.M.; Al-Ghamdi, S.G.; Koç, M. Sustainability in mega-events: Beyond Qatar 2022. Sustainability 2019, 11, 6407. [Google Scholar] [CrossRef]
- FIFA.com. Available online: https://www.fifa.com/mm/document/afsocial/environment/01/57/12/66/2006fwcgreengoallegacyreport_en.pdf (accessed on 26 November 2018).
- Saffouri, F.; Bayram, I.S.; Koç, M. Quantifying the cost of cooling in Qatar. In Proceedings of the 9th IEEE-GCC Conference and Exhibition, Manama, Bahrain, 8–11 May 2017. [Google Scholar]
- FIFA.com. Available online: https://www.fifa.com/mm/document/tournament/competition/01/37/17/76/stadiumbook2010_buch.pdf (accessed on 26 November 2018).
- FIFA.com. Available online: https://www.fifa.com/worldcup/news/2022-fifa-world-cup-to-be-played-in-november-december-2568172 (accessed on 26 November 2018).
- The American Society of Heating, Refrigeration and Air-conditioning Engineers (ASHRAE). ASHRAE Weather Data 2017; ASHRAE: Atlanta, GA, USA, 2017; p. 929. [Google Scholar]
- Boero, A.; Agyenim, F. Modeling and simulation of a small-scale solar-powered absorption cooling system in three cities with a tropical climate. Int. J. Low-Carbon Technol. 2020, 15, 1–16. [Google Scholar] [CrossRef]
- Sekhar, C.; Anand, P.; Schiavon, S.; Tham, K.W.; Cheong, D.; Saber, E.M. Adaptable cooling coil performance during part loads in the tropics—A computational evaluation. Energy Build. 2018, 159, 148–163. [Google Scholar] [CrossRef]
- Anand, P.; Cheong, D.; Sekhar, C. Computation of zone-level ventilation requirement based on actual occupancy, plug and lighting load information. Indoor Built Environ. 2020, 29, 558–574. [Google Scholar] [CrossRef]
- Irshad, K.; Habib, K.; Basrawi, F.; Saha, B.B. Study of a thermoelectric air duct system assisted by photovoltaic wall for space cooling in tropical climate. J. Energy 2017, 119, 504–522. [Google Scholar] [CrossRef]
- Van Hooff, T.; Blocken, B. Coupled urban wind flow and indoor natural ventilation modelling on a high-resolution grid: A case study for the Amsterdam Arena Stadium. Environ. Model. Softw. 2010, 25, 51–65. [Google Scholar] [CrossRef]
- Van Hooff, T.; Blocken, B. On the effect of wind direction and urban surroundings on natural ventilation of a large semi-enclosed stadium. Comput. Fluids 2010, 39, 1146–1155. [Google Scholar] [CrossRef]
- Van Hooff, T.; Blocken, B. Full-scale measurements of indoor environmental conditions and natural ventilation in a large semi-enclosed stadium: Possibilities and limitations for CFD validation. J. Wind Eng. Ind. Aerodyn. 2012, 104, 330–341. [Google Scholar] [CrossRef]
- Sofotasiou, P. Aerodynamic Optimization of Sports Stadiums towards Wind Comfort. Ph.D. Thesis, University of Sheffield, Sheffield, UK, January 2017. Available online: http://etheses.whiterose.ac.uk/id/eprint/17820 (accessed on 20 October 2018).
- Sofotasiou, P.; Hughes, B.R.; Calautit, J.K. Qatar 2022: Facing the FIFA World Cup climatic and legacy challenges. Sustain. Cities Soc. 2015, 14, 16–30. [Google Scholar] [CrossRef]
- Sofotasiou, P.; Hughes, B.R.; Calautit, J.K. Thermal performance evaluation of semi-outdoor sport stadia: A case study of the upcoming 2022 FIFA World Cup in Qatar. In Proceedings of the ASHRAE Hellenic Chapter, 3rd International Conference “Energy in Buildings 2014”, Athens, Greece, 15 November 2014. [Google Scholar]
- Ghani, S.; ElBialy, E.A.; Bakochristou, F.; Gamaledin, S.M.A.; Rashwan, M.M.; Hughes, B. Thermal performance of stadium’s Field of Play in hot climates. Energy Build. 2017, 139, 702–718. [Google Scholar] [CrossRef]
- Khalil, E.E.; Ashmawy, M.E. The challenge of cooling football stadiums in Qatar. CIBSE J. 2017. Available online: https://www.cibsejournal.com/technical/sporting-success-a-study-of-air-conditioning-stadiums-in-qatar/ (accessed on 17 March 2019).
- Zhong, F.; Calautit, J.K.; Hughes, B.R. Analysis of the influence of cooling jets on the wind and thermal environment in football stadiums in hot climates. Build. Serv. Eng. Res. Technol. 2019, 1–25. [Google Scholar] [CrossRef]
- The American Society of Heating, Refrigeration and Air-conditioning Engineers (ASHRAE). 2017 ASHRAE Handbook Fundamentals; ASHRAE: Atlanta, GA, USA, 2017. [Google Scholar]
- Luo, N.; Li, A.; Gao, R.; Zhang, W.; Tian, Z. An experiment and simulation of smoke confinement utilizing an air curtain. Saf. Sci. 2013, 59, 10–18. [Google Scholar] [CrossRef]
- Giráldez, H.; Pérez Segarra, C.D.; Oliet, C.; Oliva, A. Heat and moisture insulation by means of air curtains: Application to refrigerated chambers. Int. J. Refrig. 2016, 68, 1–14. [Google Scholar] [CrossRef]
- Foster, A.M.; Swain, M.J.; Barrett, R.; D’Agaro, P.; Ketteringham, L.P.; James, S.J. Three-dimensional effects of an air curtain used to restrict cold room infiltration. Appl. Math. Model. 2007, 31, 1109–1123. [Google Scholar] [CrossRef]
- Lecaros, M.; Elicer-Cortés, J.C.; Fuentes, A.; Felis, F. On the ability of twin jets air curtains to confine heat and mass inside tunnels. Int. Commun. Heat Mass Transf. 2010, 37, 970–977. [Google Scholar] [CrossRef]
- Wang, B.; Yu, J.; Ye, H.; Liu, Y.; Guo, H.; Tian, L. Study on present situation and optimization strategy of infiltration air in a train station in winter. Procedia Eng. 2017, 205, 2517–2523. [Google Scholar] [CrossRef]
- Hayes, F.C.; Stoecker, W.F. Design data for air curtains. Trans. ASHRAE 1969, 75, 168–180. [Google Scholar]
- Wang, L.; Zhong, Z. An approach to determine infiltration characteristics of building entrance equipped with air curtains. Energy Build. 2014, 75, 312–320. [Google Scholar] [CrossRef]
- Goubran, S.; Qi, D.; Saleh, W.F.; Wang, L.; Zmeureanu, R. Experimental study on the flow characteristics of air curtains at building entrances. Build. Environ. 2016, 105, 225–235. [Google Scholar] [CrossRef]
- Qi, D.; Goubran, S.; Wang, L.; Zmeureanu, R. Parametric study of air curtain door aerodynamics performance based on experiments and numerical simulations. Build. Environ. 2018, 129, 65–73. [Google Scholar] [CrossRef]
- Blocken, B.; Persoon, J. Pedestrian wind comfort around a large football stadium in an urban environment: CFD simulation, validation and application of the new Dutch wind nuisance standard. J. Wind Eng. Ind. Aerodyn. 2009, 97, 255–270. [Google Scholar] [CrossRef]
- Franke, J.; Hellsten, A.; Schlünzen, H.; Carissimo, B. Best Practice Guideline for the CFD Simulation of Flows in the Urban Environment; COST Office: Brussels, Belgium, 2007; pp. 16–18. Available online: https://www.semanticscholar.org/paper/BEST-PRACTICE-GUIDELINE-FOR-THE-CFD-SIMULATION-OF-Franke-Hellsten/bc39516aba1e74f7d8ed7391b4ff9e5a9ceeecf2 (accessed on 2 May 2019).
- Bartzis, J.G.; Vlachogiannis, D.; Sfetsos, A. Thematic area 5: Best practice advice for environmental flows. QNET-CFD Netw. Newsl. 2004, 2, 34–39. [Google Scholar]
- Cowan, I.R.; Castro, I.P.; Robins, A.G. Numerical considerations for simulations of flow and dispersion around buildings. J. Wind Eng. Ind. Aerodyn. 1997, 67, 535–545. [Google Scholar] [CrossRef]
- Blocken, B.; Stathopoulos, T.; Carmeliet, J. CFD simulation of the atmospheric boundary layer: Wall function problems. Atmos. Environ. 2007, 41, 238–252. [Google Scholar] [CrossRef]
- Casey, M.; Wintergerste, T. Quality and Trust in Industrial CFD, 1st ed.; European Research Community on Flow, Turbulence and Combustion: Brussels, Belgium, 2000. [Google Scholar]
- ANSYS, Inc. Fluent User’s Guide 18.2; ANSYS, Inc.: Canonsburg, PA, USA, 2017. [Google Scholar]
- Weather Online. Available online: https://www.weatheronline.co.uk/weather/maps/city (accessed on 18 March 2019).
- Blumberg, D.G.; Greeley, R. Field studies of aerodynamic roughness length. J. Arid Environ. 1993, 25, 39–48. [Google Scholar] [CrossRef]
- Launder, B.E.; Spalding, D.B. The numerical computation of turbulent flows. Comput. Methods Appl. Mech. Eng. 1974, 3, 269–289. [Google Scholar] [CrossRef]
- Cebeci, T.; Bradshaw, P. Momentum Transfer in Boundary Layers; Hemisphere Publ. Co.: Washington, DC, USA, 1977. [Google Scholar]
- Incropera, F.P. Introduction to Heat Transfer, 5th ed.; John Wiley & Sons: Franklin Township, NJ, USA, 2007. [Google Scholar]
- Shih, T.H.; Liou, W.W.; Shabbir, A.; Yang, Z.; Zhu, J. A new k-ε eddy viscosity model for high Reynolds number turbulent flows. Comput. Fluids 1995, 24, 227–238. [Google Scholar] [CrossRef]
- Mochida, A.; Tominaga, Y.; Murakami, S.; Yoshie, R.; Ishihara, T.; Ooka, R. Comparison of various k-ε models and DSM to flow around a high-rise building—Report of AIJ cooperative project for CFD prediction of wind environment. Wind Struct. 2002, 5, 227–244. [Google Scholar] [CrossRef]
- Franke, J.; Hirsch, C.; Jensen, A.G.; Krüs, H.W.; Schatzmann, M.; Westbury, P.S.; Miles, S.D.; Wisse, J.A.; Wright, N.G. Recommendations on the use of CFD in wind engineering. In Proceedings of the COST Action C14, Rhode-Saint-Genèse, Belgium, 5–7 May 2004; Available online: https://www.researchgate.net/profile/Carlo_Gualtieri/post/is_it_irrational_to_validate_a_system_of_equations_for_CFD_with_one_data/attachment/59d6467ec49f478072eae72e/AS%3A273834991652864%401442298757032/download/Franke_2004.pdf (accessed on 2 May 2019).
- Kick-off Times Confirmed for 2022 FIFA World Cup in Qatar. Available online: https://punditarena.com/football/mcorry/kick-off-qatar-world-cup-fifa/ (accessed on 12 January 2020).
- Perez-Astudillo, D.; Bachour, D. DNI, GHI and DHI ground measurements in Doha, Qatar. Energy Procedia 2014, 49, 2398–2404. [Google Scholar] [CrossRef]
- Integrated Environmental Solutions, Inc. Apachesim calculation methods Virtual Environment 6.3; Integrated Environmental Solutions, Inc.: Glasgow, Scotland.
- Sureshkumar, R.; Kale, S.R.; Dhar, P.L. Heat and mass transfer processes between a water spray and ambient air–I. Experimental data. Appl. Therm. Eng. 2008, 28, 349–360. [Google Scholar] [CrossRef]
- Montazeri, H.; Blocken, B.; Hensen, J.L.M. Evaporative cooling by water spray systems: CFD simulation, experimental validation and sensitivity analysis. Build. Environ. 2015, 83, 129–141. [Google Scholar] [CrossRef]
- Simpson, M. Computerised Design of Stadiums. In Stadium and Arena Design, 2nd ed.; Culley, P., Pascoe, J., Eds.; Institution of Civil Engineers (ICE): London, UK, 2015; pp. 119–132. [Google Scholar]


| CFD Boundary Conditions | |
|---|---|
| Domain inlet | Velocity-inlet with a wind profile of y0 = 1 m; inflow temperature of 34.2 °C. |
| Domain Outlet | Pressure-outlet with gauge pressure of 0 Pa; backflow temperature of 34.2 °C. |
| Ground (wall) | ks = 0.59 m Cs = 0.5; heat flux of 36.40 W/m2; material is set up as soil (ρ = 1400 kg/m3; Cp = 1480 J/kgK; k = 0.75 W/mK) [41] |
| Stadium (wall) | ks = 0 m Cs = 0.5; heat flux of 11.25 W/m2; material is set up as concrete (ρ = 2400 kg/m3; Cp = 880 J/kgK; k = 0.3 W/mK) [41] |
| Surrounding buildings (wall) | ks = 0 m Cs = 0.5; heat flux of 3.10 W/m2; material is set up as concrete (ρ = 2400 kg/m3; Cp = 880 J/kgK; k = 0.3 W/mK) [41] |
| Air curtains/Cooling jets | Velocity-inlets with constant velocity magnitudes and temperatures [15,24]. |
| Fluent Simulation Setup | |
|---|---|
| Simulation condition | Steady state |
| Turbulence model | Realizable k-ε model with standard wall functions and full buoyancy effect |
| Radiation model 1 | Discrete ordinates (DO) model |
| Solar load model | Solar ray tracing model |
| Solar calculator | |
| Longitude and latitude | 51.53° E 25.29° N |
| Timezone (±GMT) | GMT +3 |
| Date and time | November 21st 13:00, 16:00, 19:00 and 22:00 (GMT +3) |
| Solar irradiation method | Fair weather conditions |
| Sunshine factor | 0.3 |
| Solution method | Pressure-velocity coupling |
| Scheme | SIMPLE |
| Spatial discretization | Second-order discretization schemes |
| Under-relaxation factors | Default values |
| Convergence Criteria | None (Continuity, x, y, z velocities, energy, turbulent kinetic energy k and turbulent dissipation rate ε are monitored) |
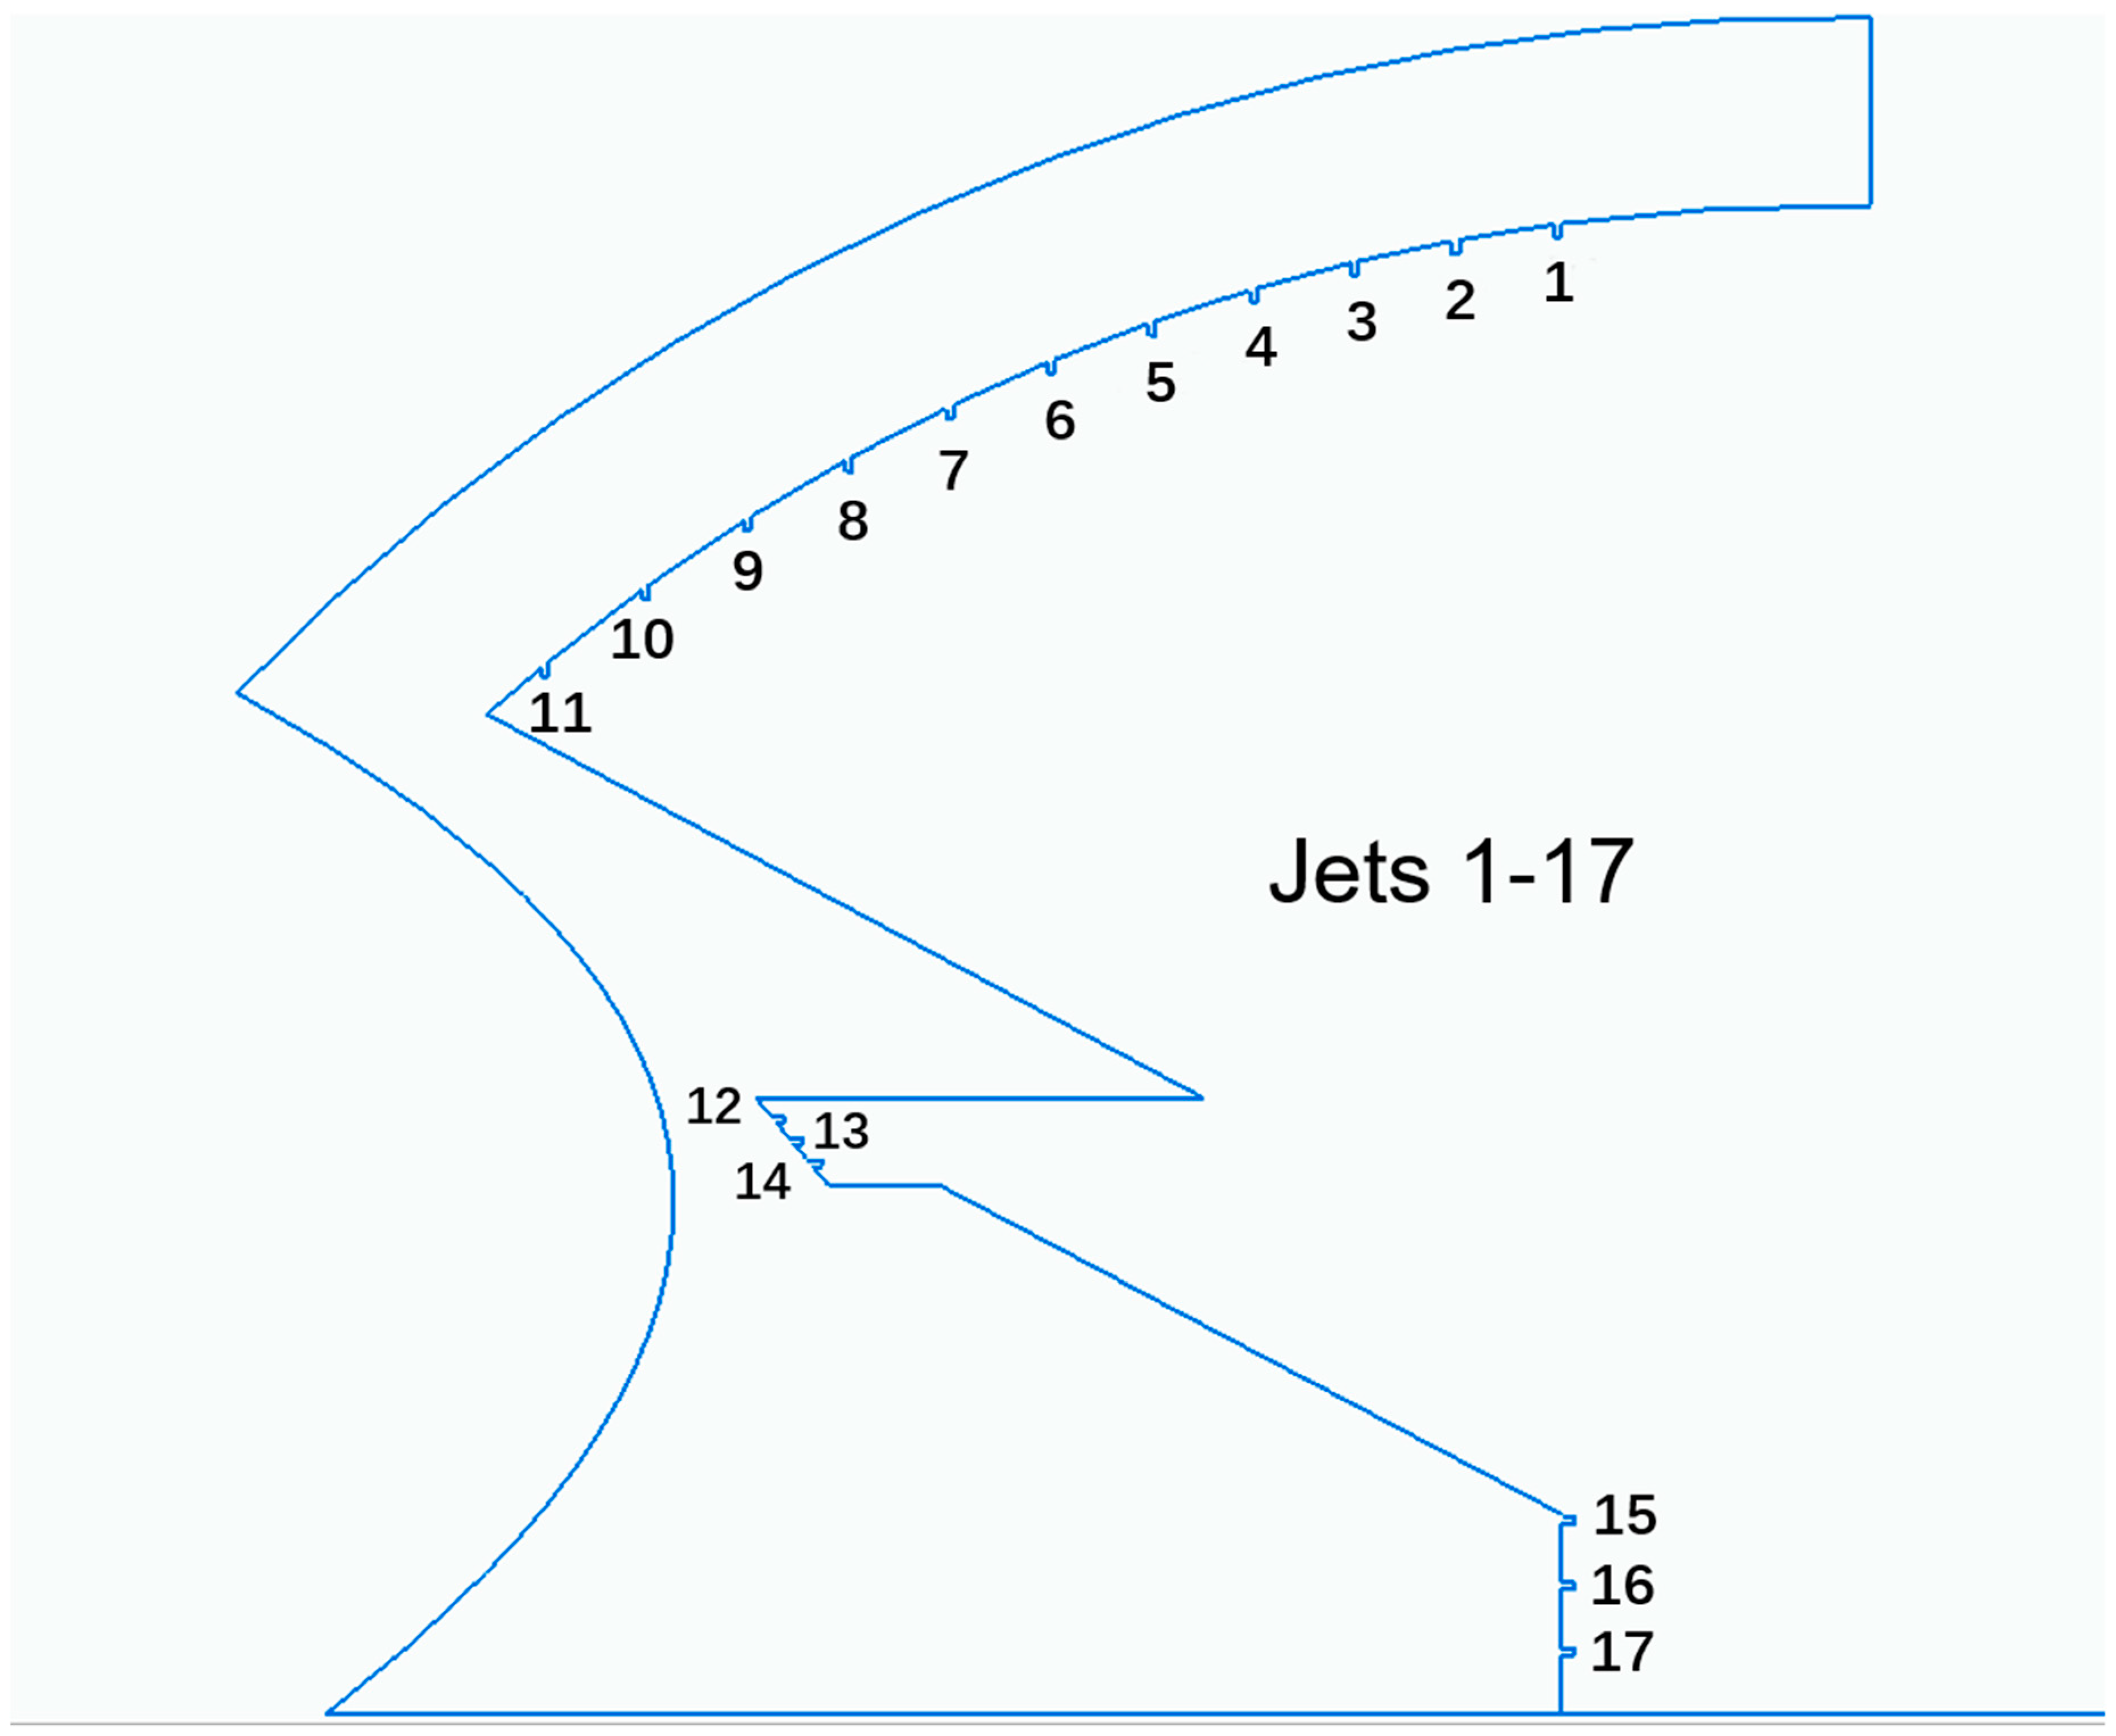
| Cooling Configuration 1 | |||
|---|---|---|---|
| Scenario 1 | Location | Supply velocity (m/s) | Supply temperature () |
| Jets 1–5 | Above upper tiers | 6 | 20 |
| Jets 6–8 | Above upper tiers | 3 | 20 |
| Jets 9–10 | Above upper tiers | 2 | 20 |
| Jets 11 | Above upper tiers | 1 | 20 |
| Scenario 2 | Location | Supply velocity (m/s) | Supply temperature () |
| Jets 1–5 | Above upper tiers | 8 | 20 |
| Jets 6–8 | Above upper tiers | 4 | 20 |
| Jets 9–10 | Above upper tiers | 2 | 20 |
| Jets 11 | Above upper tiers | 1 | 20 |
| Scenario 3 | Location | Supply velocity (m/s) | Supply temperature () |
| Jets 1–5 | Above upper tiers | 12 | 20 |
| Jets 6–8 | Above upper tiers | 6 | 20 |
| Jets 9–10 | Above upper tiers | 4 | 20 |
| Jets 11 | Above upper tiers | 2 | 20 |
| Cooling configuration 2 | |||
| Scenario 4 | Location | Supply velocity (m/s) | Supply temperature () |
| Jets 1–5 | Above upper tiers | 6 | 20 |
| Jets 6–8 | Above upper tiers | 3 | 20 |
| Jets 9–10 | Above upper tiers | 2 | 20 |
| Jets 11 | Above upper tiers | 1 | 20 |
| Jets 12–14 | At the back of lower tiers | 4 | 20 |
| Jets 15–17 | Around the pitch zone | 6 | 20 |
| Scenario 5 | Location | Supply velocity (m/s) | Supply temperature () |
| Jets 1–5 | Above upper tiers | 6 | 20 |
| Jets 6–8 | Above upper tiers | 3 | 20 |
| Jets 9–10 | Above upper tiers | 2 | 20 |
| Jets 11 | Above upper tiers | 1 | 20 |
| Jets 12–14 | At the back of lower tiers | 4 | 20 |
| Jets 15–17 | Around the pitch zone | 10 | 20 |
| Scenario 6 | Location | Supply velocity (m/s) | Supply temperature () |
| Jets 1–5 | Above upper tiers | 6 | 20 |
| Jets 6–8 | Above upper tiers | 3 | 20 |
| Jets 9–10 | Above upper tiers | 2 | 20 |
| Jets 11 | Above upper tiers | 1 | 20 |
| Jets 12–14 | At the back of lower tiers | 4 | 20 |
| Jets 15–17 | Around the pitch zone | 12 | 20 |
| Cooling configuration 3 | |||
| Scenario 7 | Location | Supply velocity (m/s) | Supply temperature () |
| Jets 1–5 | Above upper tiers | 6 | 20 |
| Jets 6–8 | Above upper tiers | 3 | 20 |
| Jets 9–10 | Above upper tiers | 2 | 20 |
| Jets 11 | Above upper tiers | 1 | 20 |
| Jets 12–14 | At the back of lower tiers | 4 | 20 |
| Air curtain 1 | Gate A | 10 | 20 |
| Air curtain 2 | Gate B | 10 | 20 |
| Air curtain 3 | Gate C | 10 | 20 |
| Air curtain 4 | Gate D | 10 | 20 |
| Scenario 8 | Location | Supply velocity (m/s) | Supply temperature () |
| Jets 1–5 | Above upper tiers | 6 | 20 |
| Jets 6–8 | Above upper tiers | 3 | 20 |
| Jets 9–10 | Above upper tiers | 2 | 20 |
| Jets 11 | Above upper tiers | 1 | 20 |
| Jets 12–14 | At the back of lower tiers | 4 | 20 |
| Air curtain 1 | Gate A | 15 | 20 |
| Air curtain 2 | Gate B | 15 | 20 |
| Air curtain 3 | Gate C | 15 | 20 |
| Air curtain 4 | Gate D | 15 | 20 |
| Scenario 9 | Location | Supply velocity (m/s) | Supply temperature () |
| Jets 1–5 | Above upper tiers | 6 | 20 |
| Jets 6–8 | Above upper tiers | 3 | 20 |
| Jets 9–10 | Above upper tiers | 2 | 20 |
| Jets 11 | Above upper tiers | 1 | 20 |
| Jets 12–14 | At the back of lower tiers | 4 | 20 |
| Air curtain 1 | Gate A | 20 | 20 |
| Air curtain 2 | Gate B | 20 | 20 |
| Air curtain 3 | Gate C | 20 | 20 |
| Air curtain 4 | Gate D | 20 | 20 |
| Opening | CFD Mean Velocity UCFD (m/s) | UCFD/Uref 1 | Experimental Mean Velocity Uexp (m/s) | Uexp/Uref 1 | Error |
|---|---|---|---|---|---|
| Gate A | 3.09 | 0.39 | 4.00 | 0.50 | −0.23 |
| Gate B | 4.91 | 0.61 | 4.11 | 0.51 | 0.19 |
| Gate C | 2.13 | 0.27 | 2.91 | 0.36 | −0.27 |
| Gate D | 3.32 | 0.42 | 2.63 | 0.33 | 0.26 |
| Radiative Heat Flux | 13:00 | 16:00 | 19:00 | 22:00 |
|---|---|---|---|---|
| Ground (W/m2) | 36.40 | 3.99 | −0.42 | −0.42 |
| Stadium (W/m2) | 11.25 | 9.52 | 7.23 | 7.23 |
| Surrounding (W/m2) | 3.10 | 4.91 | 2.95 | 2.95 |
| Cooling Jet Scenario | Thermal Comfort Estimation (PMV/PPD) | Energy Consumption per Match (MWh) | ||
|---|---|---|---|---|
| Upper Tiers | Lower Tiers | Pitch | ||
| Scenario 1 | −0.91/22% | −0.16/6% | 2.55/94% | 39.6 |
| Scenario 2 | −1.23/37% | −0.54/11% | 2.36/90% | 50.9 |
| Scenario 3 | −1.23/37% | −0.91/22% | 2.10/81% | 79.1 |
| Scenario 4 | −0.91/22% | −1.23/37% | 1.63/58% | 64.7 |
| Scenario 5 | −0.91/22% | −1.23/37% | 1.06/29% | 72.7 |
| Scenario 6 | −0.91/22% | −1.23/37% | 0.35/8% | 76.6 |
| Scenario 7 | −0.91/22% | −1.42/47% | 1.40/46% | 53.6 |
| Scenario 8 | −0.91/22% | −1.42/47% | 1.23/37% | 53.8 |
| Scenario 9 | −0.91/22% | −1.42/47% | 1.02/27% | 54.0 |
© 2020 by the authors. Licensee MDPI, Basel, Switzerland. This article is an open access article distributed under the terms and conditions of the Creative Commons Attribution (CC BY) license (http://creativecommons.org/licenses/by/4.0/).
Share and Cite
Zhong, F.; Calautit, J. An Integrated Cooling Jet and Air Curtain System for Stadiums in Hot Climates. Atmosphere 2020, 11, 546. https://doi.org/10.3390/atmos11050546
Zhong F, Calautit J. An Integrated Cooling Jet and Air Curtain System for Stadiums in Hot Climates. Atmosphere. 2020; 11(5):546. https://doi.org/10.3390/atmos11050546
Chicago/Turabian StyleZhong, Fangliang, and John Calautit. 2020. "An Integrated Cooling Jet and Air Curtain System for Stadiums in Hot Climates" Atmosphere 11, no. 5: 546. https://doi.org/10.3390/atmos11050546
APA StyleZhong, F., & Calautit, J. (2020). An Integrated Cooling Jet and Air Curtain System for Stadiums in Hot Climates. Atmosphere, 11(5), 546. https://doi.org/10.3390/atmos11050546