Abstract
Trees are especially useful biological indicators. We tested the suitability of tree leaves (Common Lime) to assess PM5 and PM10 deposition in the three summer months of 2018 in Debrecen city, Hungary. We also tested the usefulness of the cheap and simple gravimetric method to assess the PM deposition, and compared to the expensive, but standard laser diffraction method. We found significant differences between the concentrations of PM10 deposited on tree leaves, and on dust traps. A significant difference was found in the concentration of PM5 only in July. A significant difference was also found in the concentration of PM10 among months based on leaves and dust traps. For PM5 there was a significant difference among months based on leaves deposition. We found a significant positive correlation between the PM10 concentration deposited on leaves and on dust traps. A positive correlation was found between the concentration of PM based on the gravimetric and laser diffraction measurement methods. Our findings pointed out the particulate material’s washing by rain from leaves; thus, dust deposition on the surface of leaves is limited. Our results demonstrated that trees play an important role in the mitigation of air pollution, and they are a useful indicator of PM deposition for biomonitoring studies.
1. Introduction
Air pollution is one of the main environmental problems nowadays, influencing both human health and climate change [1,2]. Among air pollutants the increasing particulate matter emission is a serious air pollution problem due to the rapid urbanization and industrialization [3,4]. Thus, the study of these air pollutants is also an important aspect of human health and environmental pollution. Air particulate matter can get into the atmosphere in a passive way from sandy areas, such as deserts or bare plough lands of agricultural areas, or in an active way from anthropogenic sources (industrial emissions, traffic, house furnace). The ratio of these sources vary by areas; the population in the cities is exposed to pollution caused by human activities like industrial emission and traffic load [5], or by natural loads [6,7]. Lonati and Giugliano [8] reported that the 50% ratio of the whole PM originated from traffic load in Milan, Italy. Pant and Harrison [9] estimated even up to 80% of the road traffic contribution to the whole PM concentration. Anthropogenic sources mainly contain soot and dust produced during human activities and fossil fuel combustion, road traffic, exhaust, and non-exhaust sources (tire, brake, and road surface abrasion) [10]. At the same time, the natural source of PM is also important: ratio of sandy areas is 20% in Hungary; other sources, like Saharan dust load is also common in Hungary [11,12,13]. Furthermore, increase of aridity is also reported on global scale and in Hungary [14,15]; thus, due to climate change, natural sources of dust pollution can have larger relevance and can occur more frequently in a year [16,17,18,19].
There are active and passive sampling methods for dust load monitoring. A standard method is passive dust trapping: a bracket and a tube with a standard surface is used in practical measurements to determine dust load of an area in environmental engineering [20]. This method requires appropriate scenes to be mounted, and in cities it often can be a problem; devices should be undisturbed during the measurement periods. Usually neither mounting nor disturbance can be ensured. An ecologically feasible method is to use tree leaves as dust collectors [21,22,23]. Biological monitoring is especially useful because the determination of singular pollutants in the atmosphere does not provide relevant information about the additive effects of chemicals on living organisms. Biomonitoring is a common method for effective and inexpensive assessment of urban air quality [22,24,25,26]. Trees are present in every city and they act as pollution sinks [27]. Indeed, plant leaves are biological filters that absorb PM and heavy metals [28,29]; leaf deposited PM is partly absorbed through cuticle digestion or stoma penetration [30]. At the same time, the deposition process may be influenced by the physiological and ecological characteristics of plants, environmental conditions, altitude, wind speed and direction, rainfall, season, and accumulation period [31].
Hungary, and especially Debrecen city is exposed to severe dust pollution due to its surrounding agricultural areas of intensive management on sandy soils [32]. Dust pollution is also the function of wind speed [33,34], and the large windstorms, usually in spring, have a direct effect on Debrecen’s immission level, especially when the plough lands’ surfaces are not covered with vegetation. According to the Hungarian Immission Measurement Network [35], there were 21 days when the PM10 concentration exceeded the 100 μg/m3, the double of the European standard [36], between the time period 1 January–30 April 2020. Besides, Saharan dust is a further load in the existing threat and increases the number of days when the air pollution is critical due to dust [37]. Official measurements collect data about only the aerosols, which is valuable, but the number of stations is limited. Deposited dust measurements are conducted only if needed for a certain task (e.g., before larger industrial investments). Tree leaves can provide information without any previous planning and installation of dust traps; thus, we performed an experiment aiming to determine the precision and efficiency of the tree leaf-based dust concentration. During the experiment we used common lime (Tilia x europaea L.). Trees of common lime (Tilia x europaea L.) have been planted in urban landscapes since at least the beginning of the 17th century in most European countries [38]. Thus, it is a popular and highly abundant tree species used for urban landscaping in Europe [39]. Lime trees are in general resistant to biotic and abiotic stress, so they are considered a good bioindicator species, and accumulator of pollutants [40].
The aim of our study was to test the differences between particulate material concentration measured with dust traps, and deposited on leaves based on two particle fraction (PM5 and PM10) in three months from two sampling heights, and with two determination methods (gravimetric and laser diffraction method). Our hypotheses are the following: (i) there is no difference in the concentration of PM between dust traps and leaves, (ii) there are no differences in PM concentration in the studied months, (iii) there are no differences in PM concentration depending on the sampling heights, and (iv) there is a correlation between the PM concentrations measured by the gravimetric method, and laser diffraction method, suggesting the suitability of these methods.
2. Experiments
Common Lime (Tilia europaea) was chosen to collect leaf samples and particulate material samples with trapping in three summer months of 2018 in the campus of the University of Debrecen, Hungary. In every month 60 leaves were collected from two different heights (1.80 and 3.60 m) in three replicates. Leaves were pooled before the analyses. Similarly to the leaves, particulate material samples were also collected from two heights (1.80 and 3.60 m) with three replicates of the same tree.
The collected leaves were put into a 500 mL plastic box and 250 mL of deionized water was added, then the samples were shaken for 10 min. This suspension was filtered through a 150 μm sieve. The leaves were washed with 50 mL deionized water again [22,26]. This 300 mL of suspension was filtered through two different filter papers with a vacuum filter machine (N 811 KN.18 Laboport). The retention diameter of the first filter paper was larger than 6.5 µm (Munktell 392, Ahlstrom) and the concentration of PM10 was measured. While, the retention diameter of the second filter paper was larger than 2.5 µm (Munktell 391, Ahlstrom); thus, the concentration of PM5 was measured. For the gravimetric method, the weight of filter paper was measured before and after the filtration to determinate the concentration of PM. For the laser diffraction method, the same preparation procedure was used. The particle size distribution of PM was determined by laser granulometry with a Mastersizer 2000 (Malvern Instruments) diffraction laser particle sizer.
Statistica 7.0 software package (StatSoft, Inc., Tulsa, OK, USA) was used during the calculations. The normal distribution was tested with the Shapiro–Wilk test. Homogeneity of variances was tested with the Levene’s test. Most variables did not follow the normal distribution; thus, we applied non-parametric tests in the statistical evaluation. The concentration of PM on the surface of leaves and in traps was compared based on the particle size and different height by the Mann–Whitney U test, while in the case of months the Kruskal–Wallis test was used. Spearman correlation was used to study the correlation between concentration of PM in leaves and traps, and the gravimetric and laser diffraction method [41].
3. Results
We found significant differences in the concentration of PM between tree leaves and dust traps based on the PM10 in each month (July: t = 4.805, p < 0.001, August: t = 3.528, p = 0.005, September t = 5.818, p < 0.001) (Figure 1). We found significant differences in PM5 between tree leaves and dust traps only in July (July: t = 3.339, p = 0.008, August: t = 0.544, p = 0.598, September t = 1.947, p = 0.083) (Figure 2). Based on the concentration of PM a significant difference was found among months, based on the PM10 from leaves, and dust traps and PM5 from leaves (PM10 in traps: F = 5.727, p = 0.015; PM10 on leaves: F = 11.220, p = 0.001; PM5 in traps: F = 1.806, p = 0.200; PM5 on leaves: F = 15.195, p < 0.001) (Figure 1). There were no significant differences in PM between sampling heights (Figure 3).
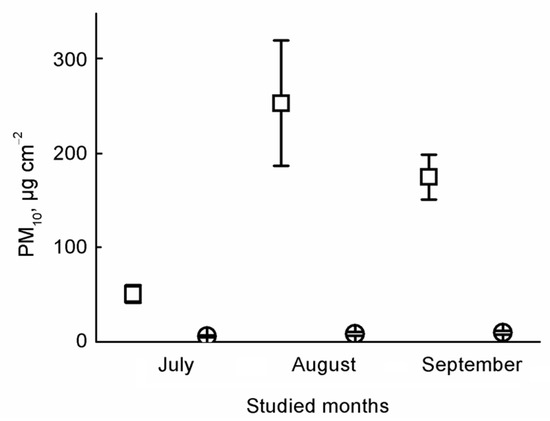
Figure 1.
Average (± standard error) concentrations of PM10 in the leaves and traps. Notations: open square means PM10 concentrations in traps, open circle means PM10 concentrations on leaves.
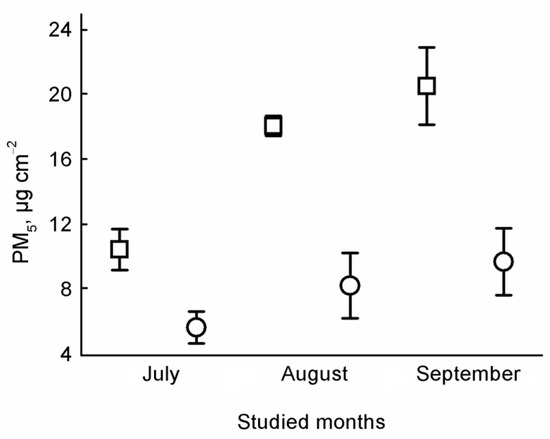
Figure 2.
Average (± standard error) concentrations of PM5 in the leaves and traps. Notations: open square means PM5 concentrations in traps, open circle means PM5 concentrations on leaves.
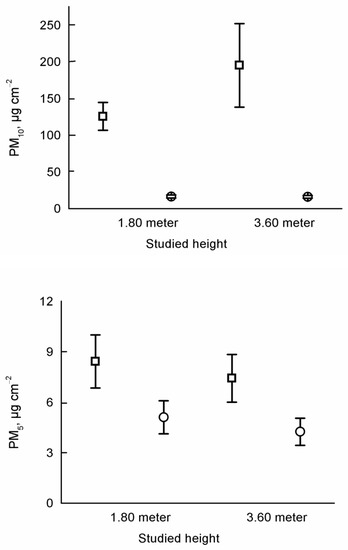
Figure 3.
Average (± standard error) concentrations of PM in the different sampling heights. Notations: open square means PM5 concentrations in traps, open circle means PM5 concentrations on leaves.
We found a significant positive correlation (r = 0.611, p = 0.009) in PM10 (Figure 4) deposited on leaves and dust traps. There was no significant correlation (r = 0.018, p = 0.946) in PM5 deposited on leaves and dust traps (Figure 5). There was a significant positive correlation (r = 0.739, p < 0.001) between the concentration of PM determined by gravimetric and laser diffraction methods only on leaves (r = −0.576, p = 0.082) (Figure 6). There was no correlation between the PM concentration determined by gravimetric and laser diffraction methods in the case of traps (r = −0.329, p = 0.297) (Figure 7).
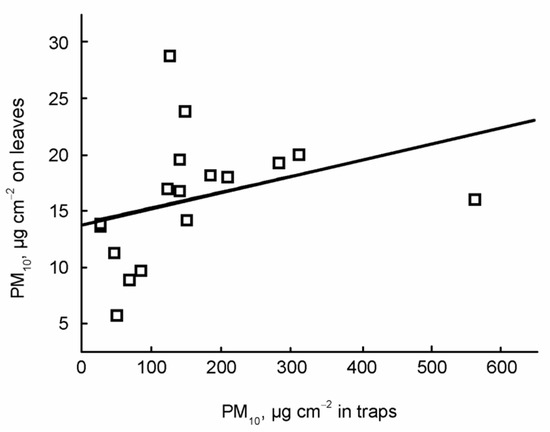
Figure 4.
Scatter plot of PM concentration on leaves and dust traps based on the PM10. The regression line is also indicated.
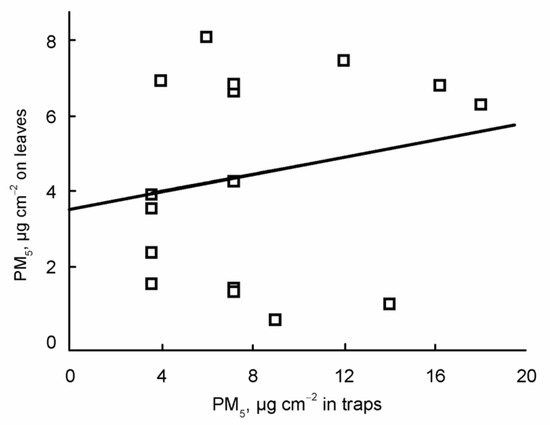
Figure 5.
Scatter plot of the PM concentration on leaves and dust traps based on the PM. The regression line is also indicated.
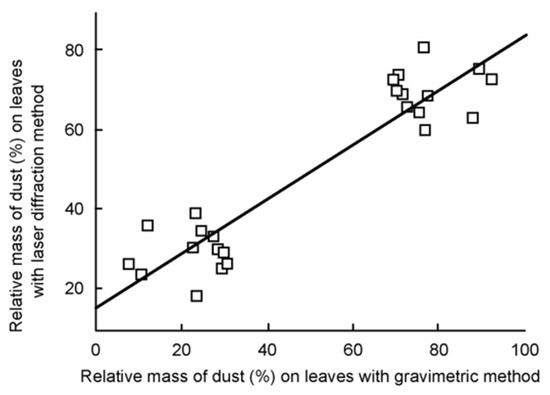
Figure 6.
Scatter plot of the studied methods based on the concentration of PM on leaves. The regression line is also indicated.
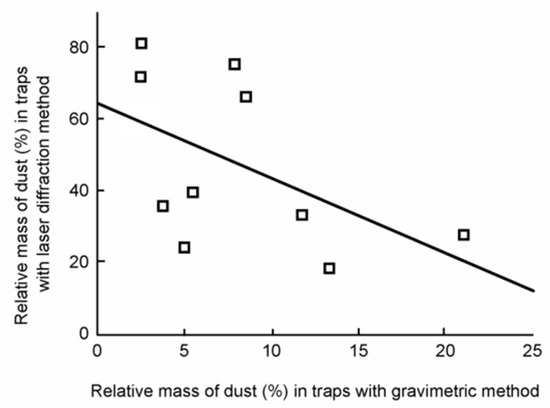
Figure 7.
Scatter plot of the studied methods based on the concentration of PM in traps. The regression line is also indicated.
4. Discussion
Dust deposition on trees is a complex and dynamic process because of wet and dry deposition processes, and chemical reactions [42]. Our findings demonstrated that leaves are useful indicators of PM deposition similar to dust traps. In general, we found that the concentration of PM differed between tree leaves and dust traps and between months, and the PM concentration was also different based on the distribution size of fractions. There was no effect of height on the PM concentration. We found a positive correlation between leaves and dust traps based on the PM5 concentration and also a correlation was found between PM concentration from leaves based on the gravimetric and laser diffraction methods.
We found higher PM10 concentration than PM5, contradicting earlier reports. Most of the removed particulate matter was in the large size fraction for the leaves, but little belonged to the smallest size fraction in the study by Przybysz et al. [43]. Song et al. [44] found that the particles less than 2.5 μm accounted for 96% of the total number of particles on the leaf. Yan et al. [45] also studied the size distribution of dust by urban plants and the majority of the particles had a diameter ≤10 μm and 54.8% was ≤2.5 μm. Hwang et al. [46] studied five tree species and their findings showed the greatest capability of removing airborne particles of submicron and ultrafine sizes. Similar to other findings, Sgrigna et al. [47] also demonstrated a higher value for fine dust deposition than large dust by the dust deposition study of Quercus ilex leaves. Mo et al. [48] studied the deposition of dust on the leaves of 35 species and all plants accumulated dust of different particle sizes (fine, coarse, and large). Blanusa et al. [49] tested the leaf trapping and retention of particles by five tree species; they found remarkable differences in the particle size distribution only in Quercus species. This suggests that species is also an important factor in the dust deposition.
Deposition of PM on trees primarily results from sedimentation under gravity and impaction under the influence of wind and there is less effect of rapidly fluctuating meteorology on the deposition [50]. However, we found significant differences among studied months. Our findings also indicate that the leaf deposited PM can be washed out by heavy rain or blown off by strong wind, and then a new deposition starts on the leaf surface [3]. Our results demonstrated that there is no effect of height on the PM concentration. In contrast, Rai and Panda [51] found that atmospheric dust accumulation varies with height. Prusty et al. [52] also demonstrated the influence of height on dust accumulation is also important factor.
Gravimetric method is the reference method for the measurement of particulate matter [53,54]. Variability of the measurements may be caused by cut off diameters, flow rates, materials of the filters, water content of aerosol, volatilization loss of volatile species of aerosols [53]. Although it is a reference method, gravimetric monitoring is labor-intensive, as it requires pre/post-conditioning and manual weighing of filters, and therefore it is not ideal for routine compliance measurements [55]. Shin et al. [53] found that the PM10 concentration by beta-ray absorption was higher than gravimetric method and the correlation between them was low. Gebicki and Szymanska [54] also studied the difference between PM10 dust concentration determined by gravimetric and b-absorption methods where dust concentration was measured via the increase in the absorption of beta-rays by particles collected on the filter. Their field test showed that average extended uncertainty of the measurements from the b-absorption method determined with respect to the gravimetric method was at the level of 20% [51]. In spite of them, our measurements showed a positive correlation between gravimetric and laser diffraction methods in the case of leaf surface absorbed PM.
Earlier studies demonstrated that the season has significant effect on emission of PM. Coal burning was a dominant source of seasonal heating, thus, in winter the PM10 concentration was significantly higher than in summer [56,57]. Evidently, dust deposition on the surface of leaves is remarkable only during the vegetation season. Thus, using leaves to assess PM pollution is limited.
The most important aspects of method selection for deposited dust load determination are the cost and the applicability. The standard method requires cheap dust traps (the only criterion is their equal surface) installed at a given height at representative locations; thus, it is not relatively more expensive than collecting leaves, i.e., the price can be negligible. However, the applicability in an urban environment can be a limit as appropriate locations may have issues with representativity (measurements can be biased by local sources) or representative locations are not suitable to mount them due to possible destruction or disturbance. Furthermore, as Szabó et al. [58] pointed out, even the standard method has reliability issues: e.g., insects, birds’ excrement, or tree leaves fallen into the trap can bias the exact determination of deposited dust, traps can be stolen or, as the practice showed, people can put inappropriate objects into the tubes (e.g., cigarette stubs). Besides, the standard method needs prior planning (installing the traps before the measurements), while leaf surfaces collect dust independently of humans. Although tree leaves did not show the same results, according to the results, tree leaves can provide a reliable alternative in areas where the application of the standard method can have issues with the installation or possible disturbance.
5. Conclusions
Our findings demonstrated that dust trapping by leaves is an effective and eco-friendly way to alleviate dust and particulate material pollution in urban areas. Leaves are a useful indicator of PM deposition for biomonitoring studies and settlement plans of cities. We justified our hypotheses that there was no difference in the concentration of PM between dust traps and leaves, and there are differences in concentration of PM based on studied months. There were no differences based on the sampling heights and there was a correlation between the results of used gravimetric and laser diffraction methods based on the concentration of PM as our predicted hypothesis. The correlation between leaves and dust traps based on the concentration of PM5 indicates that the efficiency of two collection methods (leaf and dust trapping) was similar in the case of fine particle material. Our results also demonstrated that the gravimetric method is sufficient to measure the leaf trapping concentration of PM, as we found a strong correlation between gravimetric and laser diffraction measurements. The findings of our study also confirm that trees play an important role in the mitigation of air pollution in urban habitats.
Author Contributions
Sampling and laboratory analysis, V.É.M.; data analysis: E.S.; writing—original draft preparation, E.S.; writing—review and editing, S.S. and B.T. All authors have read and agreed to the published version of the manuscript.
Funding
The research was supported by the TNN123457, OTKA K 116639, KH 126481 and KH 126477 grants.
Conflicts of Interest
The authors declare no conflict of interest.
References
- Ayres, J.; Maynard, E.L.; Richards, R. (Eds.) Air Pollution and Health, 1st ed.; Imperial College Press: London, UK, 2006; ISBN 9781860941917. [Google Scholar]
- Seinfeld, J.H.; Pandis, S. Atmospheric Chemistry and Physics: From Air Pollution to Climate Change, 2nd ed.; Wiley-Interscience: New Jersey, NJ, USA, 2006. [Google Scholar]
- Cai, M.; Xin, Z.; Yu, X. Spatio-temporal variations in PM leaf deposition: A meta-analysis. Environ. Pollut. 2017, 231, 207–218. [Google Scholar] [CrossRef] [PubMed]
- Notardonato, I.; Manigrasso, M.; Pierno, L.; Settimo, G.; Protano, C.; Vitali, M.; Mattei, V.; Martellucci, S.; Fiore, C.D.; Boccia, P.; et al. The importance of measuring ultrafine particles in urban air quality monitoring in small cities. Geogr. Pannonica 2019, 23, 347–358. [Google Scholar] [CrossRef]
- Molnár, V.É.; Simon, E.; Tóthmérész, B.; Ninsawat, S.; Szabó, S. Air pollution induced vegetation stress—The Air Pollution Tolerance Index as a quick tool for city health evaluation. Ecol. Indic. 2020, 113, 106234. [Google Scholar] [CrossRef]
- Varga, G.; Roettig, C.B. Identification of Saharan dust particles in Pleistocene dune sand-paleosol sequences of fuerteventura (Canary Islands). Hung. Geogr. Bull. 2018, 67, 121–141. [Google Scholar] [CrossRef]
- Querol, X.; Tobías, A.; Pérez, N.; Karanasiou, A.; Amato, F.; Stafoggia, M.; Pérez García-Pando, C.; Ginoux, P.; Forastiere, F.; Gumy, S.; et al. Monitoring the impact of desert dust outbreaks for air quality for health studies. Environ. Int. 2019, 130, 104867. [Google Scholar] [CrossRef]
- Lonati, G.; Giugliano, M. Size distribution of atmospheric particulate matter at traffic exposed sites in the urban area of Milan (Italy). Atmos. Environ. 2006, 40, 264–274. [Google Scholar] [CrossRef]
- Pant, P.; Harrison, R.M. Estimation of the contribution of road traffic emissions to particulate matter concentrations from field measurements: A review. Atmos. Environ. 2013, 77, 78–97. [Google Scholar] [CrossRef]
- Jia, Y.Y.; Wang, Q.; Liu, T. Toxicity research of PM2.5 compositions in vitro. Int. J. Environ. Res. Public Health 2017, 14, 232. [Google Scholar] [CrossRef]
- Borsy, Z.Z. Blown sand territories in Hungary. Geomorphology 1991, 90, 1–14. [Google Scholar]
- Kiss, T.; Lóki, J. Parabolic dunes of the Southern Nyírség. In Landscapes and Landforms of Hungary; Lóczy, D., Ed.; Springer: Dordrecht, Hollandia, 2015; pp. 263–271. ISBN 978-3-319-08997-3. [Google Scholar]
- Szoboszlai, Z.; Kertész, Z.; Szikszai, Z.; Borbély-Kiss, I.; Koltay, E. Ion beam microanalysis of individual aerosol particles originating from Saharan dust episodes observed in Debrecen, Hungary. Nucl. Instrum. Methods Phys. Res. Sect. B Beam Interact. Mater. Atoms 2009, 267, 2241–2244. [Google Scholar] [CrossRef]
- Pongrácz, R.; Bartholy, J.; Kis, A. Estimation of future precipitation conditions for Hungary with special focus on dry periods. Idojaras 2014, 118, 305–321. [Google Scholar]
- Spinoni, J.; Szalai, S.; Szentimrey, T.; Lakatos, M.; Bihari, Z.; Nagy, A.; Németh, Á.; Kovács, T.; Mihic, D.; Dacic, M.; et al. Climate of the Carpathian Region in the period 1961–2010: Climatologies and trends of 10 variables. Int. J. Climatol. 2014, 35, 1322–1341. [Google Scholar] [CrossRef]
- Achakulwisut, P.; Anenberg, S.C.; Neumann, J.E.; Penn, S.L.; Weiss, N.; Crimmins, A.; Fann, N.; Martinich, J.; Roman, H.; Mickley, L.J. Effects of Increasing Aridity on Ambient Dust and Public Health in the U.S. Southwest Under Climate Change. GeoHealth 2019, 3, 127–144. [Google Scholar] [CrossRef]
- Huang, J.; Wang, T.; Wang, W.; Li, Z.; Yan, H. Climate effects of dust aerosols over East Asian arid and semiarid regions Jianping. J. Geophys. Res. Atmos. 2014, 119, 1–19. [Google Scholar] [CrossRef]
- Négyesi, G.; Lóki, J.; Buró, B.; Bertalan-Balázs, B.; Pásztor, L. Wind erosion researches in hungary – past, present and future possibilities. Hung. Geogr. Bull. 2019, 68, 223–240. [Google Scholar] [CrossRef]
- Pásztor, L.; Négyesi, G.; Laborczi, A.; Kovács, T.; László, E.; Bihari, Z. Integrated spatial assessment of wind erosion risk in Hungary. Nat. Hazards Earth Syst. Sci. 2016, 16, 2421–2432. [Google Scholar] [CrossRef]
- Qiang, M.; Lang, L.; Wang, Z. Do fine-grained components of loess indicate westerlies: Insights from observations of dust storm deposits at Lenghu (Qaidam Basin, China). J. Arid Environ. 2010, 74, 1232–1239. [Google Scholar] [CrossRef]
- Friese, C.A.; van der Does, M.; Merkel, U.; Iversen, M.H.; Fischer, G.; Stuut, J.B.W. Environmental factors controlling the seasonal variability in particle size distribution of modern Saharan dust deposited off Cape Blanc. Aeolian Res. 2016, 22, 165–179. [Google Scholar] [CrossRef]
- Simon, E.; Braun, M.; Vidic, A.; Bogyó, D.; Fábián, I.; Tóthmérész, B. Air pollution assessment based on elemental concentration of leaves tissue and foliage dust along an urbanization gradient in Vienna. Environ. Pollut. 2011, 159, 1229–1233. [Google Scholar] [CrossRef]
- Braun, M.; Margitai, Z.; Leermakers, A.T.B. Martine Environmental Monitoring Using Linden Tree Leaves As Natural Traps of Atmospheric Deposition: A Pilot Study in Transilvania, Romania. AGD Landsc. Environ. 2007, 1, 24–35. [Google Scholar]
- Allajbeu, S.; Qarri, F.; Marku, E.; Bekteshi, L.; Ibro, V.; Frontasyeva, M.V.; Stafilov, T.; Lazo, P. Contamination scale of atmospheric deposition for assessing air quality in Albania evaluated from most toxic heavy metal and moss biomonitoring. Air Qual. Atmos. Heal. 2017, 10, 587–599. [Google Scholar] [CrossRef]
- Margitai, Z.; Simon, E.; Fábián, I.; Braun, M. Inorganic chemical composition of dust deposited on oleander (Nerium oleander L.) leaves. Air Qual. Atmos. Health 2017, 10, 339–347. [Google Scholar] [CrossRef]
- Simon, E.; Baranyai, E.; Braun, M.; Cserháti, C.; Fábián, I.; Tóthmérész, B. Elemental concentrations in deposited dust on leaves along an urbanization gradient. Sci. Total Environ. 2014, 490, 514–520. [Google Scholar] [CrossRef] [PubMed]
- Baranyai, E.; Simon, E.; Braun, M.; Tóthmérész, B.; Posta, J.; Fábián, I. The effect of a fireworks event on the amount and elemental concentration of deposited dust collected in the city of Debrecen, Hungary. Air Qual. Atmos. Heal. 2015, 8, 359–365. [Google Scholar] [CrossRef] [PubMed]
- Burkhardt, J.; Pariyar, S. Particulate pollutants are capable to “degrade” epicuticular waxes and to decrease the drought tolerance of Scots pine (Pinus sylvestris L.). Environ. Pollut. 2014, 184, 659–667. [Google Scholar] [CrossRef] [PubMed]
- Gajbhiye, T.; Pandey, S.K.; Lee, S.S.; Kim, K.H. Size fractionated phytomonitoring of airborne particulate matter (PM)and speciation of PM bound toxic metals pollution through Calotropis procera in an urban environment. Ecol. Indic. 2019, 104, 32–40. [Google Scholar] [CrossRef]
- Chaudhary, I.J.; Rathore, D. Dust pollution: Its removal and effect on foliage physiology of urban trees. Sustain. Cities Soc. 2019, 51, 101696. [Google Scholar] [CrossRef]
- Schleicher, N.J.; Norra, S.; Chai, F.; Chen, Y.; Wang, S.; Cen, K.; Yu, Y.; Stüben, D. Temporal variability of trace metal mobility of urban particulate matter from Beijing—A contribution to health impact assessments of aerosols. Atmos. Environ. 2011, 45, 7248–7265. [Google Scholar] [CrossRef]
- Pásztor, L.; Laborczi, A.; Takács, K.; Szatmári, G.; Illés, G.; Fodor, N.; Négyesi, G.; Bakacsi, Z.; Szabó, J. Spatial distribution of selected soil features in Hajdú-Bihar county represented by digital soil maps. Landsc. Environ. 2016, 10, 203–213. [Google Scholar] [CrossRef]
- Lázár, I.; Csákberényi-Nagy, G.; Túri, Z.; Kapocska, L.; Tóth, T.; Barnabás Tóth, J. Analysis of Factors Affecting Wind-Energy Potential in Low Built-Up Urban Environments. In Proceedings of the Air and Water Components of the Environment, Cluj-Napoca, Romania, 21–22 March 2014; Pandi, G., Moldovan, F., Eds.; Babes-Bolyai University: Cluj-Napoca, Romania, 2014; pp. 369–376. [Google Scholar]
- Négyesi, G.; Lóki, J.; Buró, B.; Szabó, S. Effect of soil parameters on the threshold wind velocity and maximum eroded mass in a dry environment. Arab. J. Geosci. 2016, 9, 588. [Google Scholar] [CrossRef]
- Air Quality Automatic Measure in Hungary. Available online: http://www.levegominoseg.hu/automata-merohalozat?AspxAutoDetectCookieSupport=1 (accessed on 30 April 2020).
- Environment Air Quality Standards in the European Commission. Available online: https://ec.europa.eu/environment/air/quality/standards.htm (accessed on 30 April 2020).
- Varga, G. Changing nature of Saharan dust deposition in the Carpathian Basin (Central Europe): 40 years of identified North African dust events (1979–2018). Environ. Int. 2020, 139, 105712. [Google Scholar] [CrossRef] [PubMed]
- Marques de Sá, J. Applied Statistics Using SPSS, STATISTICA, MATLAB and R., 2nd ed.; Springer: Porto, Portugal, 2007; ISBN 978-3-540-71971-7. [Google Scholar]
- Bengtsson, R. Variation in common lime(Tilia x europaea L.) in Swedish Gardensof the 17th and 18th centuries. Acta Univ. Agric. Suec. 2005, 2005, 64–106. [Google Scholar]
- Cekstere, G.; Osvalde, A. A study of chemical characteristics of soil in relation to street trees status in Riga (Latvia). Urban For. Urban Green. 2013, 12, 69–78. [Google Scholar] [CrossRef]
- Ţenche-Constantinescu, A.M.; Madoşa, E.; Chira, D.; Hernea, C.; Ţenche-Constantinescu, R.V.; Lalescu, D.; Borlea, G.H. Tilia spp.-Urban Trees for Future. Not Bot Horti Agrobot. 2015, 43, 259–264. [Google Scholar] [CrossRef]
- Bottalico, F.; Chirici, G.; Giannetti, F.; De Marco, A.; Nocentini, S.; Paoletti, E.; Salbitano, F.; Sanesi, G.; Serenelli, C.; Travaglini, D. Air Pollution Removal by Green Infrastructures and Urban Forests in the City of Florence. Agric. Agric. Sci. Procedia 2016, 8, 243–251. [Google Scholar] [CrossRef]
- Przybysz, A.; Sæbø, A.; Hanslin, H.M.; Gawroński, S.W. Accumulation of particulate matter and trace elements on vegetation as affected by pollution level, rainfall and the passage of time. Sci. Total Environ. 2014, 481, 360–369. [Google Scholar] [CrossRef]
- Song, Y.; Maher, B.A.; Li, F.; Wang, X.; Sun, X.; Zhang, H. Particulate matter deposited on leaf of five evergreen species in Beijing, China: Source identification and size distribution. Atmos. Environ. 2015, 105, 53–60. [Google Scholar] [CrossRef]
- Yan, J.; Lin, L.; Zhou, W.; Han, L.; Ma, K. Quantifying the characteristics of particulate matters captured by urban plants using an automatic approach. J. Environ. Sci. 2016, 39, 259–267. [Google Scholar] [CrossRef]
- Hwang, H.J.; Yook, S.J.; Ahn, K.H. Experimental investigation of submicron and ultrafine soot particle removal by tree leaves. Atmos. Environ. 2011, 45, 6987–6994. [Google Scholar] [CrossRef]
- Sgrigna, G.; Sæbø, A.; Gawronski, S.; Popek, R.; Calfapietra, C. Particulate Matter deposition on Quercus ilex leaves in an industrial city of central Italy. Environ. Pollut. 2015, 197, 187–194. [Google Scholar] [CrossRef]
- Mo, L.; Ma, Z.; Xu, Y.; Sun, F.; Lun, X.; Liu, X.; Chen, J.; Yu, X. Assessing the capacity of plant species to accumulate particulate matter in Beijing, China. PLoS ONE 2015, 10, 1–18. [Google Scholar] [CrossRef] [PubMed]
- Blanusa, T.; Fantozzi, F.; Monaci, F.; Bargagli, R. Leaf trapping and retention of particles by holm oak and other common tree species in Mediterranean urban environments. Urban. For. Urban. Green. 2015, 14, 1095–1101. [Google Scholar] [CrossRef]
- Tallis, M.; Taylor, G.; Sinnett, D.; Freer-Smith, P. Estimating the removal of atmospheric particulate pollution by the urban tree canopy of London, under current and future environments. Landsc. Urban Plan. 2011, 103, 129–138. [Google Scholar] [CrossRef]
- Rai, P.K.; Panda, L.L.S. Leaf dust deposition and its impact on Biochemical aspect of some Roadside. Int. Res. J. Environ. Sci. 2014, 3, 14–19. [Google Scholar]
- Prusty, B.A.K.; Mishra, P.C.; Azeez, P.A. Dust accumulation and leaf pigment content in vegetation near the national highway at Sambalpur, Orissa, India. Ecotoxicol. Environ. Saf. 2005, 60, 228–235. [Google Scholar] [CrossRef] [PubMed]
- Shin, S.E.; Jung, C.H.; Kim, Y.P. Analysis of the measurement difference for the PM 10 concentrations between beta-ray absorption and gravimetric methods at gosan. Aerosol Air Qual. Res. 2011, 11, 846–853. [Google Scholar] [CrossRef]
- Gebicki, J.; Szymańska, K. Comparative field test for measurement of PM10 dust in atmospheric air using gravimetric (reference) method and β-absorption method (Eberline FH 62-1). Atmos. Environ. 2012, 54, 18–24. [Google Scholar] [CrossRef]
- Tasić, V.; Jovašević-Stojanović, M.; Vardoulakis, S.; Milošević, N.; Kovačević, R.; Petrović, J. Comparative assessment of a real-time particle monitor against the reference gravimetric method for PM 10 and PM 2.5 in indoor air. Atmos. Environ. 2012, 54, 358–364. [Google Scholar] [CrossRef]
- Song, Y.; Zhang, M.; Cai, X. PM10 modeling of Beijing in the winter. Atmos. Environ. 2006, 40, 4126–4136. [Google Scholar] [CrossRef]
- Srimuruganandam, B.; Shiva Nagendra, S.M. Application of positive matrix factorization in characterization of PM10 and PM2.5 emission sources at urban roadside. Chemosphere 2012, 88, 120–130. [Google Scholar] [CrossRef]
- Andreychouk, V. (Ed.) Dissertation Comissions of Cultural Landscape: Methods of Landscape Research; Polish Academy of Sciences Institute of Geography and Spatial Organization, Polish Geographical Society: Sosnowiec, Poland, 2008; pp. 113–126. [Google Scholar]
© 2020 by the authors. Licensee MDPI, Basel, Switzerland. This article is an open access article distributed under the terms and conditions of the Creative Commons Attribution (CC BY) license (http://creativecommons.org/licenses/by/4.0/).