Abstract
Newly improved formulations of the bare soil evaporation and the surface temperature are presented, using the multilayer land surface scheme TERRA of the Consortium for Small-scale Modeling (COSMO) atmospheric model. The simulations were carried out in offline mode with atmospheric forcing data from the Meteorological Observatory Lindenberg–Richard-Aßmann-Observatory of the German Meteorological Service. The results show that the bare soil evaporation simulated by the reference version of TERRA is substantially overestimated under wet conditions, and underestimated under dry conditions. Furthermore, the amplitude of the diurnal cycle of the surface temperature is systematically underestimated. In contrast, the diurnal cycles of the temperatures in the soil are overestimated instead. The new description of the bare soil evaporation in TERRA is based on a resistance formulation analogue to Ohm’s law, while the surface temperature is now based on the skin temperature formulation by Viterbo and Beljaars. The new formulation improves the simulated bare soil evaporation substantially. In particular, the overestimation under wet conditions is reduced, also acting against an extensive drying of the soil during the annual cycle. Additionally, the underestimation under dry conditions is reduced as well. Furthermore, the simulated amplitude of the diurnal cycle of the surface temperature is substantially increased. In particular, a nocturnal warm bias is systematically reduced. In addition to this, the new formulations were also applied in coupled mode in the COSMO model, resulting in improved diurnal cycles of near-surface temperature and dew point.
1. Introduction
The processes at the land surface significantly affect the conditions in the low-level atmosphere. They control the surface radiation budget and turbulent heat fluxes and therefore determine how much energy and water is available to heat and moisten the air over land. This has a considerable effect not only on the low-level temperature and humidity but also on the structure of the planetary boundary layer and even on precipitation [1]. In particular, the soil water content was found to be a key quantity determining the interactions between land surface and atmosphere [2].
Therefore, a realistic representation of the land surface processes in atmospheric models is essential. However, the bare soil evaporation simulated by the multilayer land surface scheme TERRA of the Consortium for Small-scale Modeling (COSMO) mesoscale atmospheric model [3] was found to be systematically overestimated under wet conditions and underestimated under dry conditions. The problem of accurately simulating the bare soil evaporation was also addressed by other authors recently [4,5].
Beside these deficiencies in the bare soil evaporation, it turned out that the diurnal temperature range, i.e., the difference between the daily maximum and minimum temperature, at the surface is systematically underestimated. On the other hand, the diurnal temperature range in the soil is overestimated. Consequently, also other components of the energy and water cycles at the surface exhibit systematic model errors. This applies to e.g., the turbulent heat fluxes or the soil water content. This is partly due to the fact that in TERRA the vegetation is not sufficiently represented in the surface energy balance [6,7]. The plants cannot have a different (canopy) temperature than the ground. The incoming solar radiation is directly used to heat the soil; there is no shading exerted by the vegetation insulating the ground against the solar radiation. The shading was already described by e.g., Deardorff [8] who introduced a shielding factor which is related to the vegetation cover. Furthermore, it was demonstrated e.g., by Schulz et al. [9] and Vogel et al. [10] that introducing a separate energy budget for the canopy improves the surface temperature simulated by the soil-vegetation system.
Recently, further attempts were made to address such biases in near-surface forecasts [7,11]. This is essential, since the COSMO model has a variety of applications. First of all, it is used for numerical weather prediction (NWP) and climate projections [12]. It is the basis for weather warnings, e.g., in case of extreme weather events, like heatwaves [13,14] but also droughts and floods. Further applications are in hydrology, agriculture, forestry, and furthermore, renewable energies, road conditions and also urban modelling [15]. All these fields rely on a high accuracy of the forecasts of near-surface temperature and humidity. In particular, their diurnal cycles in terms of maximum and minimum values and amplitude are crucial for many applications. It is expected that due to land surface-atmosphere feedback mechanisms, an improved simulation of the near-surface variables and therefore the turbulent heat fluxes may improve also several other aspects of the model forecasts.
In this study, two substantial improvements of TERRA with respect to the bare soil evaporation and the canopy temperature are presented. The erroneous formulation of the bare soil evaporation is replaced by a resistance-based scheme which reduces the water flux under wet conditions and enhances it under dry conditions [16]. Furthermore, in the attempt to choose a canopy description of intermediate level of complexity, which is consistent with the one of TERRA and does not introduce several new parameters which need to be determined, like e.g., the Community Land Model [17] would do, the so-called skin temperature formulation [18] was selected and implemented in TERRA [19].
2. Model Description
The COSMO model [3,6] is a nonhydrostatic limited-area atmospheric prediction model, which is developed and maintained by the COSMO consortium (http://www.cosmo-model.org). It is designed for both operational NWP and various scientific applications on the meso- and meso- scale.
The COSMO model is based on the primitive thermohydrodynamical equations describing compressible flow in a moist atmosphere. The model equations are formulated in rotated geographical coordinates and a generalized terrain following height coordinate. A variety of physical processes, such as radiation, cloud microphysics, convection, and land surface processes, are taken into account by parameterization schemes. The governing equations are integrated using the mode-splitting approach to split up the equations into a longer model time step for the processes on larger time scales such as advection and the tendencies from the physical parameterizations, and into a short time step for the fast sound wave processes. Several options for a two time-level 2nd and 3rd order Runge–Kutta split-explicit scheme are available [20].
The physical parameterization schemes include the multilayer land surface model TERRA [6,7]. It simulates the energy and water balance at the land surface and in the ground, providing the land surface temperature and humidity as lower boundary conditions for computing the energy and water fluxes between surface and atmosphere. In TERRA, all processes are modeled one-dimensionally in the vertical; no lateral interactions between adjacent soil columns are considered.
The soil temperature is calculated by the heat conduction equation, while the soil water content is predicted by the Richards equation. Both equations are discretized by a multilayer scheme using the same layer depths for both temperature and water content. This allows one to include the freezing and thawing of soil water or ice, respectively. The layer depths can be specified by the user. In operational NWP applications, usually eight soil layers are used. The depths of their lower boundaries are as follows: 0.01 m, 0.03 m, 0.09 m, 0.27 m, 0.81 m, 2.43 m, 7.29 m, and 21.87 m. This layer discretization is also used in the offline simulations presented in this study. The temperature of the lowest layer acts as lower boundary condition of the heat conduction equation. It is usually set to a climatological annual mean value of the near-surface temperature. At the interface between surface and atmosphere, the surface energy balance equation is solved, yielding the new surface temperature. Currently, the surface temperature in TERRA is represented by the temperature of the uppermost soil layer. There is no additional temperature of the leaves or the canopy [7]. The surface energy balance equation takes into account the total surface net radiation, the sensible and latent heat flux, and the ground heat flux. The atmospheric energy fluxes constitute the upper boundary condition of the soil heat conduction equation. The current representation of the surface temperature as well as the new skin temperature in TERRA are described in Section 3.
Precipitation reaching the ground is separated into infiltration or surface runoff. The simulation of the water vapour flux, returning moisture from the ground back to the atmosphere, depends on the land use. For vegetated areas, transpiration from the vegetation is computed, taking into account the plant physiological properties, and for nonvegetated areas, bare soil evaporation is computed. The total moisture flux, the evapotranspiration, at a grid element is calculated as an area-weighted average of the individual fluxes. In the standard model configuration of TERRA, the formulations of both components of the evapotranspiration are based on the Biosphere-Atmosphere Transfer Scheme (BATS) [21]. The current BATS-based formulation of the bare soil evaporation, as well as the new resistance-based scheme are described in Section 3. The snow pack is simulated with a single-layer snow model, taking into account snow ageing with respect to albedo and density.
3. Bare Soil Evaporation and Surface Temperature
3.1. Bare Soil Evaporation
3.1.1. Current Formulation
In the current model version of TERRA, the bare soil evaporation is based on the Biosphere-Atmosphere Transfer Scheme [21]. Originally, the formulation was designed for a two-layer model using the force-restore method. The water flux is given by
is the average soil water content normalized by the pore volume in the upper m of the soil. (see below) is similar, but for the upper m of the soil. is the density of water. is calculated by
with
where the soil water suction (negative potential) at saturation is m and the fraction of saturated soil filled by water . The parameters B and depend on the soil type (see Table 11.1 in [6]). D is
is given by
with m s−1.
3.1.2. New Formulation
The new description of the bare soil evaporation in TERRA is based on a resistance formulation analogue to Ohm’s law (for a review see e.g., Schulz et al. [9]):
and are the density and the specific humidity of air, respectively. is the saturation specific humidity at the surface. denotes the aerodynamic resistance, the soil resistance. The latter is given by
where is the minimum soil resistance, with s m−1. is the volumetric soil water content of the uppermost soil layer in TERRA, while and are air dryness point and field capacity, respectively. The term in the brackets represents the soil water stress. When the soil gets dry, the soil resistance increases, which consequently reduces the evaporation.
3.2. Surface Temperature
3.2.1. Current Formulation
In the current model version of TERRA, the surface temperature is represented by the temperature of the uppermost soil layer [6]. The surface energy balance equation has the following form:
where is the heat capacity per unit area, and t is the time. and are the net shortwave and longwave radiation flux, respectively, while and H denote the latent and sensible heat flux and G the ground heat flux.
3.2.2. New Formulation
The new description of the surface temperature in TERRA is based on the skin temperature formulation by Viterbo and Beljaars [18]. They introduced an additional temperature of the leaves or the canopy, the skin temperature , as a representation of the vegetation in the surface energy balance:
The behavior of this equation is mainly determined by the new parameter , the skin layer conductivity. Large values represent a strong coupling between the skin temperature and the surface temperature of the mineralic soil; their diurnal cycles stay similar. In contrast, small values of describe a weak coupling; the diurnal cycle of can become considerably larger than the one of . The leaves can become warmer during day and cooler during night. This can improve the surface temperature simulated by the soil-vegetation system.
In the current implementation of the skin temperature formulation in TERRA, grid elements covered with snow are excluded. They can be included as part of a further model development.
4. Experiments and Observational Data
4.1. Lindenberg/Falkenberg
In order to analyze the behavior of the new formulations of the bare soil evaporation and the skin temperature described in Section 3, experiments with the multilayer land surface scheme TERRA in offline mode were carried out. This methodology is described, e.g., by Chen et al. [22] or Schulz et al. [9]. For this purpose, TERRA was forced with a set of atmospheric observations, which are downward shortwave and longwave radiation, total precipitation, near-surface wind speed, air temperature, and specific humidity. For this study, observations from the boundary layer field site Falkenberg were used, providing the atmospheric forcing variables as mentioned before, as well as several quantities for model validation, such as e.g., surface latent heat flux or temperature at the surface and in the ground.
Falkenberg is a site at the Meteorological Observatory Lindenberg–Richard-Aßmann-Observatory of the German Meteorological Service (Deutscher Wetterdienst, DWD), located about 5 km south of the observatory. It is a grass land site representative of farmland surfaces in the heterogeneous rural landscape typical for large parts of northern central Europe [23,24]. It has been in continuous operation since 1998 with a main focus on the near-surface boundary layer and soil processes. A detailed description of the measurement conditions, instrumentation, data acquisition, and the comprehensive quality control procedures is given by Beyrich and Adam [25].
The offline simulations were carried out for complete years: 2014 for the bare soil evaporation and 2011 for the skin temperature. These years are arbitrarily chosen; the results are qualitatively the same for any other year (not shown). For both parameterizations, two TERRA simulations were performed, a reference and an experiment, using the current or the new formulations of bare soil evaporation and skin temperature, respectively. The main land surface parameter values needed to appropriately describe the Falkenberg site within TERRA are given in Table 1.

Table 1.
Main land surface parameter values in TERRA representing the Falkenberg site. and are the minimum and maximum vegetation ratio, representing grass at rest and during the growing season. and are the respective values but for the leaf area index. The transitions between these values in spring and autumn are prescribed by a sinusoidal fit. and are the surface albedos for grass and bare soil, and and are the turbulent roughness lengths for grass and bare soil, respectively.
They are based on measurements and estimates adapted to the site conditions. The annual cycles of vegetation ratio (i.e., the fractional area of a grid element covered by vegetation) and leaf area index (LAI, the ratio of leaf to ground area) were prescribed by a sinusoidal fit for the transitions between their minimum and maximum values in spring and autumn, while the roughness length was kept constant in time. The predominant vegetation species are perennial ryegrass (Lolium perenne) and red fescue (Festuca rubra). For these grass species, an albedo value of 0.18 was used. The soil texture especially prevailing at the radiation measurement spot is dominated by sandy pale soil (Eutric Podzoluvisol) [26], for which an albedo value of 0.2 was used. The prescribed albedo values are in good agreement with experimental findings for this site described by Beyrich and Adam [25]. Although the meadow of the site is mowed several times a year to keep the vegetation height below 20 cm, the impact of the surrounding crop fields on the 10-m wind speed was represented by a slightly increased roughness length of 0.03 m on annual average.
The additional parameter value needed for the skin temperature formulation, the skin layer conductivity, was estimated as W m−2 K−1. This compares well with the original value of 7 W m−2 K−1 by Viterbo and Beljaars [18].
4.2. Central Europe
In addition to the offline experiments, the effects of the new formulations of the bare soil evaporation and the skin temperature are investigated in three-dimensional coupled model mode. In contrast to the offline set-up, here in coupled mode, the land surface can feedback to the atmosphere [27]. Therefore, it can be analyzed whether changes at the land surface may have an impact on near-surface atmospheric variables, such as humidity or temperature.
For this study, COSMO-D2 was used, the version of the COSMO model applied for operational NWP at DWD [28]. The model domain covers central Europe at a horizontal resolution of 0.02° with 65 atmospheric layers. The COSMO model version 5.6a was used. Lateral boundary conditions were provided by the global model at DWD for the simulation period from 11 February to 25 March 2019. Two COSMO experiments were carried out, the first one with the unmodified model as reference and the second one using the new formulations of bare soil evaporation and skin temperature. The simulations were evaluated by the operational verification system at DWD.
5. Results of Numerical Experiments
5.1. Offline Mode
5.1.1. Bare Soil Evaporation
The current description of the bare soil evaporation based on BATS [21] and the new scheme based on a resistance formulation are compared, using the multilayer land surface scheme TERRA in offline mode by applying the methodology as described in Section 4.1. Figure 1 shows the latent heat flux from bare soil at Falkenberg in February 2014 as simulated by the current and the new scheme in TERRA. The latent heat flux, and hence the evaporation, from bare soil is substantially reduced by the resistance method compared to BATS. At the same time, the latent heat flux from vegetation, which is equivalent to the transpiration, is very close to zero at Falkenberg in February in both model versions (see Figure 2). This is a reasonable result because the LAI and therefore the transpiration by grass are small in the model during this period.
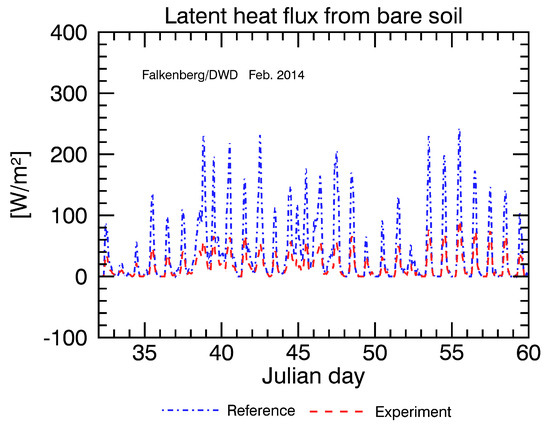
Figure 1.
Diurnal cycles of the latent heat flux from bare soil at Falkenberg on 1–28 February 2014 (Julian day 32–59) as simulated by the reference version of TERRA based on BATS [21] and by the new scheme based on a resistance formulation (experiment).
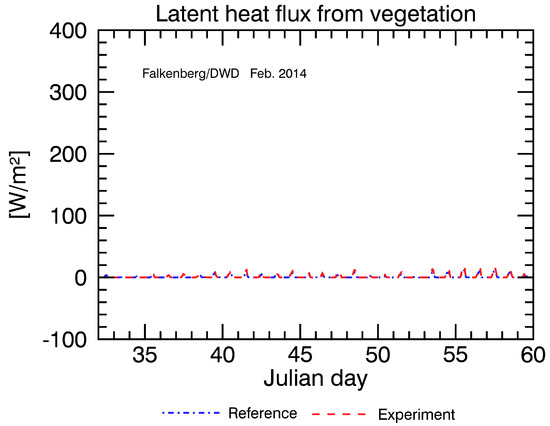
Figure 2.
Same as Figure 1 but for the latent heat flux from vegetation.
From Figure 1 and Figure 2 it becomes clear that the total latent heat flux is highly dominated by the component from bare soil. This is illustrated by Figure 3. Furthermore, the current model version based on BATS considerably overestimates the latent heat flux during day by a factor of three or more. The reduced bare soil evaporation simulated by the resistance method improves the total latent heat flux substantially; the simulated diurnal cycles match the measurements much better. The insufficient accuracy of BATS in TERRA may be explained by the fact that the scheme was adapted, or tuned, to the two-layer land surface scheme [29] of the former model generation at DWD. Apparently, this cannot directly be transferred to the current multilayer land surface scheme. In this latter step, there was an attempt made to emulate the former upper soil layer of the force-restore method with a depth of about 0.1 m, by the new multilayer scheme. This means that the water contents of the upper three layers are aggregated, representing the soil water content of the upper 0.09 m (see the variable “” in Section 3.1.1), for computing the soil water stress acting on the bare soil evaporation. In contrast to this, in the new scheme only the uppermost soil layer is used for representing the soil water stress (see Section 3.1.2), allowing for a much more efficient regulation of the evaporation.
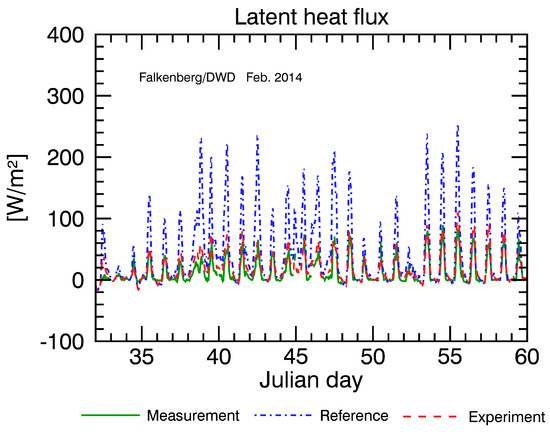
Figure 3.
Diurnal cycles of the total latent heat flux as measured at Falkenberg in February 2014 compared to the results of the reference version of TERRA based on BATS and of the new scheme based on a resistance formulation (experiment).
The improvement of the simulated bare soil evaporation has positive consequences also for other components of the energy and water cycle. Due to the reduced latent heat flux by the resistance method, the simulated daily maximum surface temperatures are increased, as shown in Figure 4 for the last ten days of February 2014. By this, a cold bias in the BATS-based simulation, amounting to up to 2 °C in the daily maximum temperatures, is corrected for to a very good extent. During night, both model versions are very similar, both characterized by a warm bias of 1–2 °C in the simulated daily minimum temperatures. This means that the simulated amplitude of the diurnal cycles of the surface temperature is underestimated by both model versions, although less by the new one. This behavior may be further improved by introducing a skin temperature in the model, as presented in Section 5.1.2. Furthermore, due to the reduced evaporation simulated by the resistance method, the soil stays wetter, as depicted in Figure 5. While in the BATS version the soil is suffering from a severe drying in late winter and spring and has problems in recovering the water content in autumn towards the winter, the new formulation reduces the drying of the soil considerably, and the annual cycle of the simulated soil moisture is significantly improved.
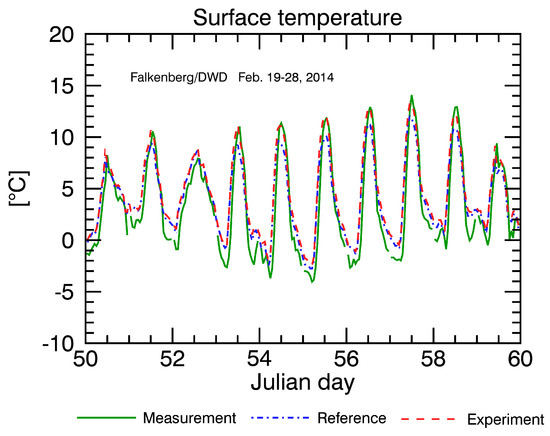
Figure 4.
Diurnal cycles of the surface temperature as measured at Falkenberg on 19–28 February 2014 (Julian day 50–59) compared to the results of the reference version of TERRA based on BATS and of the new scheme based on a resistance formulation (experiment).
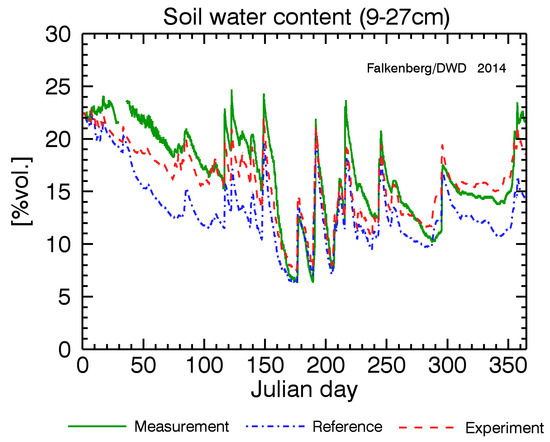
Figure 5.
Annual cycle of the soil water content at a depth of 9–27 cm as measured at Falkenberg during 2014 compared to the results of the reference version of TERRA based on BATS and of the new scheme based on a resistance formulation (experiment).
In contrast to February 2014 (Figure 1), the situation becomes different in May. Now, the bare soil evaporation is not always reduced by the resistance method compared to BATS; under drier soil conditions it is increased instead. This is indicated in Figure 6, e.g., in the second half of May (Julian day 141–146). As illustrated by Figure 7, the current model version considerably underestimates the latent heat flux during these days; this is improved by the new formulation.
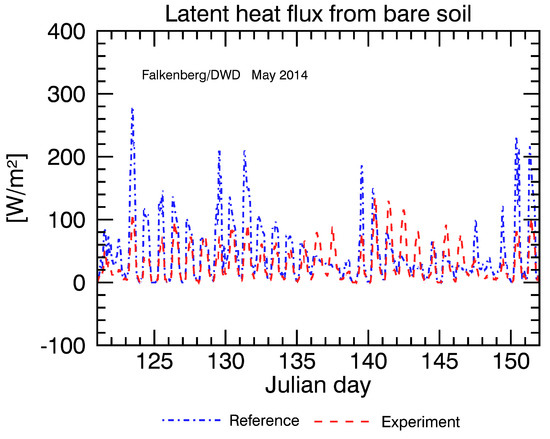
Figure 6.
Same as Figure 1 but for 1–31 May 2014 (Julian day 121–151).
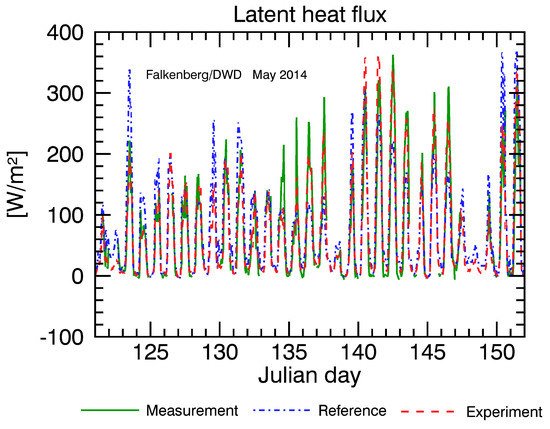
Figure 7.
Same as Figure 3 but for May 2014.
In summary, the simulated total latent heat flux, and hence the evapotranspiration, is considerably improved by the new resistance formulation for the bare soil evaporation in TERRA, compared to the current BATS-type method. This applies to wet conditions where the evaporation is reduced, as well as to dry conditions where it is increased. The new formulation was tested not only for Lindenberg but also for other sites (not shown), like e.g., Fauga-Mauzac (Toulouse, France) or Sodankylä (Finland), working well also there. These sites represent a variety of climate conditions, therefore it can be expected that the resistance-based formulation for the bare soil evaporation works generally well for different domains on the globe.
5.1.2. Surface Temperature
The current description of the surface temperature, being simply represented by the temperature of the uppermost soil layer and the newly implemented description which is based on the skin temperature formulation by Viterbo and Beljaars [18] are compared, again using the multilayer land surface scheme TERRA in offline mode. In both experiments, the new resistance-based formulation of the bare soil evaporation is used, as described in Section 5.1.1. Figure 8 shows the diurnal cycles of the surface temperature as observed at Falkenberg during May 2011. It is also called brightness temperature, and it is derived from the measured upward thermal radiation over the grass, hence representing partly ground and partly grass temperature.
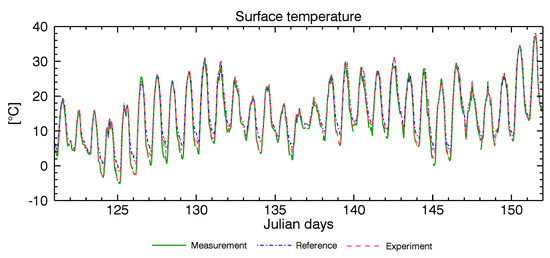
Figure 8.
Diurnal cycles of the surface temperature as measured at Falkenberg on 1–31 May 2011 (Julian day 121–151) compared to the results of the reference version of TERRA and of the new scheme based on the skin temperature formulation by Viterbo and Beljaars [18] (experiment).
Figure 8 also shows that the amplitude of the diurnal cycle of the surface temperature is systematically underestimated in the reference version of TERRA. While the daily maximum temperatures match the observation well, the daily minimum temperatures show a clear warm bias of up to 4 °C. This is explained by the model characteristic, that the surface temperature is represented by the temperature of the uppermost soil layer. It has a layer depth of 0.01 m which means that it exhibits a “thermal inertia”. Therefore, the simulated surface temperature is not able to represent the full diurnal temperature range of a skin temperature “seen” by the atmosphere over vegetated areas. This is a systematic model shortcoming which is discussed in detail, e.g., by Schulz et al. [7,9].
This result indicates that in TERRA a representation of the vegetation in the surface energy balance is needed. A vegetation temperature, in literature also called canopy temperature, is missing. As mentioned before, the so-called skin temperature formulation was selected and implemented in TERRA. With this, the amplitude of the diurnal cycle of the surface temperature is substantially increased and much closer to the measurements (see Figure 8). In particular, the nocturnal warm bias is systematically reduced.
An additional systematic model deficiency of TERRA is that the insulating effects by the vegetation, including the shading, with respect to the subcanopy land surface, are not represented, as the incoming solar radiation is directly used in the surface energy balance equation. Therefore, the surface ground heat flux and correspondingly the amplitudes of the diurnal cycles of the soil temperatures are systematically overestimated in TERRA (see Figure 9 and Figure 10). With the skin temperature formulation they are considerably reduced and much closer to the measurements.
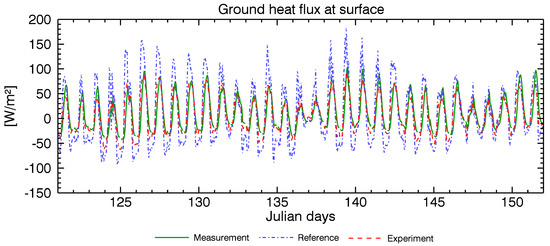
Figure 9.
Same as Figure 8 but for the surface ground heat flux.
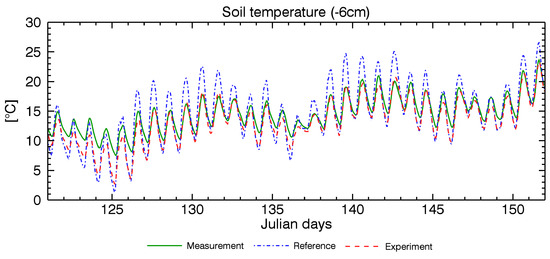
Figure 10.
Same as Figure 8 but for the soil temperature at a depth of 6 cm.
5.2. Coupled Mode
In addition to the offline experiments, the effects of the new formulations of the bare soil evaporation and the skin temperature are investigated with the COSMO atmospheric model in three-dimensional coupled mode. Two experiments were carried out, the first one with the unmodified model as reference and the second one using the two new formulations.
Figure 11 shows a comparison of this experiment with the reference simulation. The experimental period is 11 February to 25 March 2019, i.e., six weeks. The figure shows the domain-averaged diurnal cycles of the dew point temperature, atmospheric temperature, and relative humidity, all at 2 m above ground, averaged over the whole period. The experiment is substantially drier, as seen in the dew point temperature and relative humidity. This is mainly due to the new formulation of bare soil evaporation which corrects for the systematically overestimated water fluxes of the reference model version. Furthermore, the simulated amplitude of the diurnal cycle of the 2-m temperature is increased in the experiment. This is partly due to the decrease of the latent heat flux and its cooling effect and partly due to the skin temperature formulation.

Figure 11.
Domain-averaged diurnal cycles of the dew point temperature (TD2M, left panel), atmospheric temperature (T2M, central panel), and relative humidity (RH2M, right panel), all at 2 m above ground, averaged over the whole experimental period from 11 February to 25 March 2019. The COSMO reference version is depicted in black, the experiment in red.
The reference model version shows a substantial moist bias which is almost completely removed in the experiment using the new formulations of the bare soil evaporation and the skin temperature (see Figure 12). A pronounced cold bias during daytime in the reference model is considerably reduced in the experiment. The root mean square errors of the humidity and temperature fields are significantly reduced during almost the whole day by up to about 15% for the dew point temperature and about 18% for the atmospheric temperature.
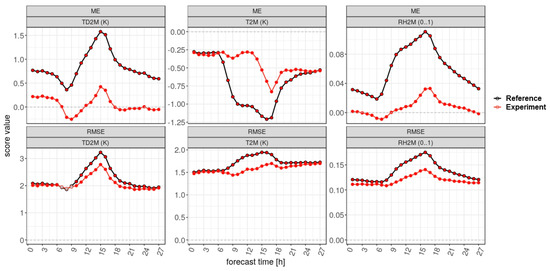
Figure 12.
Same as Figure 11 but for the mean error (ME), or bias, and the root mean square error (RMSE) of TD2M, T2M, and RH2M. Filled circles indicate that the differences are statistically significant.
6. Conclusions
Newly improved formulations of the bare soil evaporation and the surface temperature were implemented and tested in the multilayer land surface scheme TERRA of the COSMO atmospheric model.
In the current reference version of TERRA, the bare soil evaporation is based on BATS [21]. Originally, the formulation was designed for a two-layer model using the force-restore method. Later it was transferred to the current multilayer land surface scheme. This may explain the model deficiencies of the current version of TERRA that the simulated bare soil evaporation is substantially overestimated under wet conditions and underestimated under dry conditions. The new description of the bare soil evaporation is based on a resistance formulation analogue to Ohm’s law (for a review see e.g., Schulz et al. [9]). Here, an important aspect is that it represents the soil water stress based on the uppermost soil layer only, regulating the simulated evaporation more realistically when the soil water content is changing.
A further shortcoming of the current version of TERRA is the insufficient representation of vegetation in the surface energy balance [6,7]. There is no energy budget including a canopy temperature for the vegetation layer. Instead, the surface temperature in TERRA is represented by the temperature of the uppermost soil layer. Besides this, the insulating effects by the vegetation at the subcanopy land surface are missing as well, as the incoming solar radiation is directly used in the surface energy balance equation. As a consequence, the simulated amplitude of the diurnal cycle of the surface temperature is systematically underestimated, while the diurnal cycles of the heat fluxes and temperatures in the soil are overestimated, instead. This means that the other components of the surface energy and water balances are biased as well. The new description of the surface temperature in TERRA is based on the skin temperature formulation by Viterbo and Beljaars [18]. Here, an additional temperature of the canopy, the skin temperature, represents the vegetation in the surface energy balance.
The systematic deficiencies of the simulated bare soil evaporation and surface temperature were found in the reference version of TERRA in offline mode, as well as in coupled mode. This shows, once more, the potential of a land surface scheme run in offline mode as a tool for studying, analyzing, and understanding the governing processes in the system, which may allow for better understanding the behavior of the land surface scheme when interactively coupled to an atmospheric model.
The new formulations of bare soil evaporation and skin temperature were evaluated in offline mode and in coupled mode. The first measure improves particularly the diurnal cycles of the evapotranspiration or the surface latent heat flux, respectively, compared to the BATS implementation. Under wet conditions, the substantially overestimated bare soil evaporation is considerably reduced; under dry conditions the underestimated evaporation is enhanced. These improvements have positive effects also for other components of the energy and water cycle. A severe drying problem with BATS throughout the entire year, particularly in spring and autumn, was considerably improved. Furthermore, pronounced moist and cold biases in the near-surface atmosphere during daytime were significantly reduced. On the other hand, the skin temperature formulation improves in particular the simulated amplitude of the diurnal cycle of the surface temperature. An underestimation of the diurnal 2-m temperature range by up to 4 °C at Falkenberg in the reference version of TERRA was substantially improved. At the same time, the overestimation of the surface ground heat flux and the amplitudes of the diurnal cycles of the soil temperatures were considerably reduced.
Now, the substantially improved land surface scheme TERRA can be used for all sorts of applications. First of all, as a component of an atmospheric model, it is applied in NWP and in climate modeling. A high accuracy of the forecasts of near-surface temperature and humidity is required by many customers. For some, certain temperature threshold values are very important. For instance, the blossoms of cherry trees and other fruit trees are very sensitive against frost. One night is enough to damage a large fraction of the blossoms, therefore a reliable frost forecast is crucial. The production of ice wine starts at temperatures of −8 °C at the vineyard and below, also here a precise forecast is needed. For estimating the road conditions, again the freezing point is important.
Another interesting field for atmospheric model forecasts is renewable energies. The energy production by photovoltaic panels depends heavily on the incoming solar radiation and therefore on the dust in the atmosphere. Recently, in a project at DWD, it was demonstrated that due to the improved formulation of the bare soil evaporation, the sand of the Sahara becomes drier, allowing for increased dust emissions during storms, which consequently improves the simulated Sahara dust concentrations and radiation budgets over Europe [30]. Another example, here in the field of energy production by wind power plants, is the evening transition from unstable to stable conditions in the stratification of the lower atmosphere. With an improved diurnal cycle of the simulated surface temperature, these transitions and the related vertical wind profiles can be forecasted more accurately.
Furthermore, a realistic representation of the land surface temperature is very important for weather warnings, e.g., in case of extreme weather events, like heatwaves. This applies to a wide range of timescales, from short-range NWP and subseasonal to seasonal prediction up to climate timescales. The problem becomes particularly difficult when short-term heatwaves become superimposed on and potentially amplified by a general trend of climate change [14]. The issue of rising temperatures is very present in the field of urban modeling. Here, an important quantity is the difference between the surface temperature in urban areas and the one in the surrounding rural areas and its diurnal evolution. This is the so-called urban heat island effect. Typically, this difference is small during daytime, while during the night the urban areas stay warmer than the rural areas, often by several degrees. Obviously, for this kind of study [15], a realistic description of the land surface temperature is needed, in this case with an accurately simulated cooling of the rural areas at night.
In order to further improve TERRA, the description of the vegetation itself should be addressed, regarding particularly the simulation of the transpiration with all its stress factors. These factors try to limit the vapor flux according to the environmental conditions, depending on the land use classes. Furthermore, a more realistic representation of the phenological cycle of the vegetation is needed, which was already shown by earlier studies [31]. These topics will be addressed in the future.
Author Contributions
Conceptualization, J.-P.S. and G.V.; data curation, G.V.; formal analysis, J.-P.S. and G.V.; investigation, J.-P.S. and G.V.; methodology, J.-P.S.; resources, J.-P.S. and G.V.; software, J.-P.S. and G.V.; validation, J.-P.S. and G.V.; visualization, G.V.; writing—original draft, J.-P.S.; writing—review and editing, J.-P.S. All authors have read and agreed to the published version of the manuscript.
Funding
This research received no external funding.
Acknowledgments
The authors thank Udo Rummel, Deutscher Wetterdienst, Meteorological Observatory Lindenberg, for providing the observational data from Lindenberg. We acknowledge two anonymous reviewers who made valuable comments to improve the manuscript.
Conflicts of Interest
The authors declare no conflict of interest.
References
- Arora, V. Modeling vegetation as a dynamic component in soil-vegetation-atmosphere transfer schemes and hydrological models. Rev. Geophys. 2002, 40, 1006. [Google Scholar] [CrossRef]
- Koster, R.D.; Dirmeyer, P.A.; Hahmann, A.N.; Ijpelaar, R.; Tyahla, L.; Cox, P.; Suarez, M.J. Comparing the degree of land–atmosphere interaction in four atmospheric general circulation models. J. Hydrometeorol. 2002, 3, 363–375. [Google Scholar] [CrossRef]
- Steppeler, J.; Doms, G.; Schättler, U.; Bitzer, H.-W.; Gassmann, A.; Damrath, U. Meso-gamma scale forecasts using the nonhydrostatic model LM. Meteorol. Atmos. Phys. 2003, 82, 75–96. [Google Scholar] [CrossRef]
- Balsamo, G.; Boussetta, S.; Dutra, E.; Beljaars, A.; Viterbo, P.; Van den Hurk, B. Evolution of Land Surface Processes in the IFS; ECMWF Newsletter 127; European Centre for Medium-Range Weather Forecasts: Reading, UK, 2011; pp. 17–22. [Google Scholar]
- Albergel, C.; Balsamo, G.; de Rosnay, P.; Muñoz-Sabater, J.; Boussetta, S. A bare ground evaporation revision in the ECMWF land-surface scheme: evaluation of its impact using ground soil moisture and satellite microwave data. Hydrol. Earth Syst. Sci. 2012, 16, 3607–3620. [Google Scholar] [CrossRef]
- Doms, G.; Förstner, J.; Heise, E.; Herzog, H.-J.; Mironov, D.; Raschendorfer, M.; Reinhardt, T.; Ritter, B.; Schrodin, R.; Schulz, J.-P.; et al. A Description of the Nonhydrostatic Regional COSMO Model. Part II: Physical Parameterization; Deutscher Wetterdienst: Offenbach, Germany, 2011; 154p. [Google Scholar]
- Schulz, J.-P.; Vogel, G.; Becker, C.; Kothe, S.; Rummel, U.; Ahrens, B. Evaluation of the ground heat flux simulated by a multi-layer land surface scheme using high-quality observations at grass land and bare soil. Meteorol. Z. 2016, 25, 607–620. [Google Scholar] [CrossRef]
- Deardorff, J.W. Efficient prediction of ground surface temperature and moisture, with inclusion of a layer of vegetation. J. Geophys. Res. 1978, 83, 1889–1903. [Google Scholar] [CrossRef]
- Schulz, J.-P.; Dümenil, L.; Polcher, J.; Schlosser, C.A.; Xue, Y. Land surface energy and moisture fluxes: Comparing three models. J. Appl. Meteorol. 1998, 37, 288–307. [Google Scholar] [CrossRef]
- Vogel, G.; Shrestha, P.; Schulz, J.-P.; Becker, C.; Rummel, U. Modelluntersuchungen zum Einfluss der solaren Abschattung auf die Erdbodentemperaturen in Falkenberg; MOL-RAO Aktuell 3/2015; Deutscher Wetterdienst: Lindenberg, Germany, 2015; 2p. [Google Scholar]
- Haiden, T.; Sandu, I.; Balsamo, G.; Arduini, G.; Beljaars, A. Addressing Biases in Near-Surface Forecasts; ECMWF Newsletter 157; European Centre for Medium-Range Weather Forecasts: Reading, UK, 2018; pp. 20–25. [Google Scholar]
- Rockel, B.; Will, A.; Hense, A. The regional climate model COSMO-CLM (CCLM). Meteorol. Z. 2008, 17, 347–348. [Google Scholar] [CrossRef]
- Mueller, B.; Seneviratne, S.I. Hot days induced by precipitation deficits at the global scale. Proc. Nat. Acad. Sci. USA 2012, 109, 12398–12403. [Google Scholar] [CrossRef] [PubMed]
- Schiermeier, Q. Europe’s mega-heatwave boosted by climate change. Nature 2019, 571, 155. [Google Scholar] [CrossRef] [PubMed]
- Bucchignani, E.; Mercogliano, P.; Garbero, V.; Milelli, M.; Varentsov, M.; Rozinkina, I.; Rivin, G.; Blinov, D.; Kirsanov, A.; Wouters, H.; et al. Analysis and Evaluation of TERRA_URB Scheme: PT AEVUS Final Report; COSMO Technical Report 40; Deutscher Wetterdienst: Offenbach, Germany, 2019; 60p. [Google Scholar]
- Schulz, J.-P.; Vogel, G. An evaluation of the simulated bare soil evaporation of an atmospheric model. In Proceedings of the EGU General Assembly, Vienna, Austria, 17–22 April 2016. [Google Scholar]
- Oleson, K.W.; Lawrence, D.M.; Bonan, G.B.; Drewniak, B.; Huang, M.; Koven, C.D.; Levis, S.; Li, F.; Riley, W.J.; Subin, Z.M.; et al. Technical Description of Version 4.5 of the Community Land Model (CLM); Technical Note NCAR/TN-503+STR; National Center for Atmospheric Research: Boulder, CO, USA, 2013; 420p. [Google Scholar]
- Viterbo, P.; Beljaars, A.C.M. An improved land surface parameterization scheme in the ECMWF model and its validation. J. Clim. 1995, 8, 2716–2748. [Google Scholar] [CrossRef]
- Schulz, J.-P.; Vogel, G. An improved representation of the land surface temperature including the effects of vegetation in the COSMO model. In Proceedings of the EGU General Assembly, Vienna, Austria, 23–28 April 2017. [Google Scholar]
- Baldauf, M.; Seifert, A.; Förstner, J.; Majewski, D.; Raschendorfer, M.; Reinhardt, T. Operational convective-scale numerical weather prediction with the COSMO model: Description and sensitivities. Mon. Weather Rev. 2011, 139, 3887–3905. [Google Scholar] [CrossRef]
- Dickinson, R.E. Modeling evapotranspiration for three-dimensional global climate models: Climate processes and climate sensitivity. In American Geophysical Union Geophysical Monograph; Hansen, J.E., Takahashi, K., Eds.; American Geophysical Union: Washington, DC, USA, 1984; pp. 58–72. [Google Scholar]
- Chen, T.H.; Henderson-Sellers, A.; Milly, P.C.D.; Pitman, A.J.; Beljaars, A.C.M.; Polcher, J.; Abramopoulos, F.; Boone, A.; Chang, S.; Chen, F.; et al. Cabauw experimental results from the Project for Intercomparison of Land-surface Parameterization Schemes. J. Clim. 1997, 10, 1194–1215. [Google Scholar] [CrossRef]
- Neisser, J.; Adam, W.; Beyrich, F.; Leiterer, U.; Steinhagen, H. Atmospheric boundary layer monitoring at the Meteorological Observatory Lindenberg as a part of the “Lindenberg Column”: Facilities and selected results. Meteorol. Z. 2002, 11, 241–253. [Google Scholar] [CrossRef]
- Richter, S.H.; Rummel, U.; Weisensee, U. Ausgewählte Ergebnisse von Bodenfeuchtemessungen am Meteorologischen Observatorium Lindenberg; Arbeitsergebnisse Nr. 84; Beyrich, F., Ed.; Deutscher Wetterdienst–Forschung und Entwicklung: Offenbach am Main, Germany, 2006; 46p. [Google Scholar]
- Beyrich, F.; Adam, W.K. Site and Data Report for the Lindenberg Reference Site in CEOP—Phase 1; Berichte des Deutschen Wetterdienstes No. 230; Deutscher Wetterdienst–Forschung und Entwicklung: Offenbach am Main, Germany, 2007; 55p. [Google Scholar]
- Hierold, W.; Schumacher, U.; Ziethen, R.; Becker, D. Ergebnisse der bodenkundlichen Kartierung zum Messfeld Falkenberg des Meteorologischen Observatoriums Lindenberg des DWD; Internal Report; Deutscher Wetterdienst: Lindenberg, Germany, 1997; 26p. [Google Scholar]
- Schulz, J.-P.; Dümenil, L.; Polcher, J. On the land surface-atmosphere coupling and its impact in a single-column atmospheric model. J. Appl. Meteor. 2001, 40, 642–663. [Google Scholar] [CrossRef]
- Baldauf, M.; Gebhardt, C.; Theis, S.; Ritter, B.; Schraff, C. Beschreibung des operationellen Kürzestfristvorhersagemodells COSMO-D2 und COSMO-D2-EPS und seiner Ausgabe in die Datenbanken des DWD; Deutscher Wetterdienst: Offenbach, Germany, 2018; 115p. [Google Scholar]
- Jacobsen, I.; Heise, E. A new economic method for the computation of the surface temperature in numerical models. Contr. Atmos. Phys. 1982, 55, 128–141. [Google Scholar]
- Steiner, A.; Bachmann, V.; Förstner, J. PerduS—Photovoltaikertragsreduktion durch Saharastaub. Projektzwischenbericht; Internal Report; Deutscher Wetterdienst: Offenbach, Germany, 2017; 26p. [Google Scholar]
- Schulz, J.-P.; Vogel, G.; Ahrens, B. A New Leaf Phenology for the Land Surface Scheme TERRA of the COSMO Atmospheric Model; COSMO Newsletter 15; Deutscher Wetterdienst: Offenbach, Germany, 2015; pp. 21–29. [Google Scholar]
© 2020 by the authors. Licensee MDPI, Basel, Switzerland. This article is an open access article distributed under the terms and conditions of the Creative Commons Attribution (CC BY) license (http://creativecommons.org/licenses/by/4.0/).