Article

Evaluation for Characteristics of Tropical Cyclone Induced Heavy Rainfall over the Sub-basins in The Central Hokkaido, Northern Japan by 5-km Large Ensemble Experiments

by
Tsuyoshi Hoshino
1,*,
Tomohito J. Yamada
2 and
Hiroaki Kawase
3
1
Graduate school of Engineering, Hokkaido University, N13 W8, Kita-ku, Sapporo, Hokkaido 060-8628, Japan
2
Faculty of Engineering, Hokkaido University, N13 W8, Kita-ku, Sapporo, Hokkaido 060-8628, Japan
3
Meteorological Research Institute, Japan Meteorological Agency, 1-1, Nagamine, Tsukuba, Ibaraki 305-0052, Japan
*
Author to whom correspondence should be addressed.
Atmosphere 2020, 11(5), 435; https://doi.org/10.3390/atmos11050435
Submission received: 15 March 2020 / Revised: 17 April 2020 / Accepted: 22 April 2020 / Published: 25 April 2020

Abstract

:
Previous studies have shown that the acceleration of global warming will increase the intensity of rainfall induced by tropical cyclones (TCs) (hereinafter referred to as “TC-induced rainfall”). TC-induced rainfall is affected by TC position and topography (slope shape and direction). Thus, TC-induced rainfall is expected to vary by sub-basin due to varying topographies. However, these relationships have not been explained, as historical TCs, which occurred several decades earlier, do not exhaustively encompass all TC positions that could potentially affect each basin. We used large ensemble regional climate model experiments with 5 km grid spacing, which enabled us to prepare a huge TC database for understanding the characteristics of TC-induced rainfall over sub-basins. We quantified the characteristics of TC-induced rainfall (rainfall volume, relationship between TC position and rainfall intensity, and contribution of TC intensity on rainfall) over four sub-basins in the Tokachi River basin, central Hokkaido, northern Japan. The results reveal differences in TC-induced rainfall characteristics between the sub-basins. In addition, the large ensemble data under a future climate scenario were used to evaluate future changes in the characteristics of TC-induced rainfall for each sub-basin.

Graphical Abstract

1. Introduction

The acceleration of global warming will affect the frequency and intensity of extreme weather events such as tropical cyclones (TCs). TCs are the primary cause of heavy rainfall events in Japan. Thus, predicting changes in rainfall caused by TCs (hereinafter, referred to as “TC-induced rainfall”) attributable to global warming will be essential for estimating future flood risks. Previous studies (e.g., Walsh et al. [1]; Yoshida et al. [2]; Knutson et al. [3]) have examined the impact of global warming on TC frequency and intensity. These studies used ensemble simulations with a general circulation model (GCM) and concluded that the occurrence of high-intensity TCs will increase in many areas as the number of global TCs decreases. Several studies have investigated the effects of global warming on TC-induced rainfall. Walsh et al. [1] concluded that the acceleration of global warming will cause TC-induced rainfall to increase. Projections made by the GCM also showed similar trends (Knutson et al. [3]; Manganello et al. [4]; Kitoh and Endo [5]). Pseudo global warming simulations have also shown that TCs could heighten their intensity with increased wind and rainfall under warmer weather conditions (Kanada et al. [6]; Nayak and Takemi [7]; Hill and Lackmann [8]).
TC-induced rainfall is dependent on factors such as topography, TC intensity, and vertical shear (Lonfat et al. [9]). In particular, orographic (topographically affected) rainfall is eminent when landmarks such as steep mountain ranges divide a basin. Thus, rainfall volumes over a river basin can vary considerably according to the track of the TC. A particularly heavy rainfall occurred around the Hidaka mountain range in the Tokachi River basin, central Hokkaido, the northernmost island of Japan (Figure 1), as Typhoon Lionrock made its approach in 2016. Nguyen-Le and Yamada [10] utilized meteorological simulations of the typhoon to show that the heavy rainfall in the Tokachi River basin represented an orographic rainfall, which was significantly impacted by the Hidaka Mountains. In cases where mountains comprise a majority of the national landscape, such as in Japan, a basin is composed of several small sub-basins divided by the mountainous topography. The rainfall intensity caused by TC position and TC intensity varies between sub-basins as adjacent sub-basins can vary in slope shape and direction. Thus, to understand and predict risks of TC-induced rainfall over sub-basins, rainfall, and TC data (position and intensity) are required. However, these risks have not been explained from existing observational data as historical TCs that occurred several decades earlier do not exhaustively encompass all TC positions that could potentially affect each basin.
In recent years, a large ensemble climate dataset was released as the Database for Policy Decision Making for Future Climate Change (d4PDF), which consists of several thousand years of simulation with both a historical climate and climates following the progression of global warming (Mizuta et al. [11]). This database was prepared using the GCM and the regional climate model (RCM). The RCM experiment targeted the regions over Japan and its surroundings under historical and warmer climatic conditions. The historical condition experiment targeted 60 years (1951–2010) with 50 ensemble members (total 3000 years), and the warmer climate experiment targeted 60 years with six sea surface temperature patterns and 15 ensemble members (total 5400 years). The warmer climatic condition of the database was based on the RCP8.5 scenario prepared by phase 5 of the Coupled Model Inter-comparison Project (CMIP5) (Taylor et al. [12]). This database is suitable for estimating future changes in infrequent and extreme weather events. Yoshida et al. [2] showed that TC climatology (number of TC genesis, frequency of TC passing, and intensity) of the d4PDF was consistent with actual observations. Endo et al. [13] examined changes in the annual maximum daily rainfall (Rx1d) based on d4PDF and showed that Rx1d will increase in entire East Asia, under future climatic conditions with particularly notable increases in rainfall across northern Japan. Furthermore, Kitoh and Endo [5] suggested that for TC-induced rainfall, the 90th to 99th percentile value of Rx1d recorded in d4PDF will tend to increase in future. They showed that TC-induced Rx1d will have a large variance in future climates, hinting at the potential for extremely large rainfall events. Hatsuzuka et al. [14] also used d4PDF to demonstrate the effect of climate change on TC-induced rainfall in Japan. They showed that the effect of increased atmospheric moisture content is dominant over the effect of an increase of TC-induced rainfall and that the effect of increased TC intensity on TC-induced rainfall is stronger over east- and north-facing slopes.
In this study, we prepared large ensemble regional climate model experiments with higher grid spacing than RCM experiment in d4PDF using the Non hydrostatic Regional Climate Model (NHRCM) [15] which enabled us to arrive at a huge TC database for understanding the characteristics of TC-induced rainfall over sub-basins. We quantified the characteristics of TC-induced rainfall (rainfall volume, relationship between TC position and rainfall intensity, and contribution of TC intensity on rainfall) over the four sub-basins in the Tokachi River basin, central Hokkaido, northern Japan. In addition, the dataset under future climatic conditions was used to evaluate future changes in the characteristics of TC-induced rainfall over each sub-basin. Section 2 describes the target river basins and the data used in the analysis, including the rainfall and TC track data sourced from actual observations and the d4PDF, and experimental design of the dynamical downscaling (DDS). Section 3 shows TC-induced rainfall volumes, the relationship between TC position and rainfall intensity, and the effect of TC intensity on rainfall over the target sub-basins. Finally, Section 4 presents a discussion and summary.

2. Data

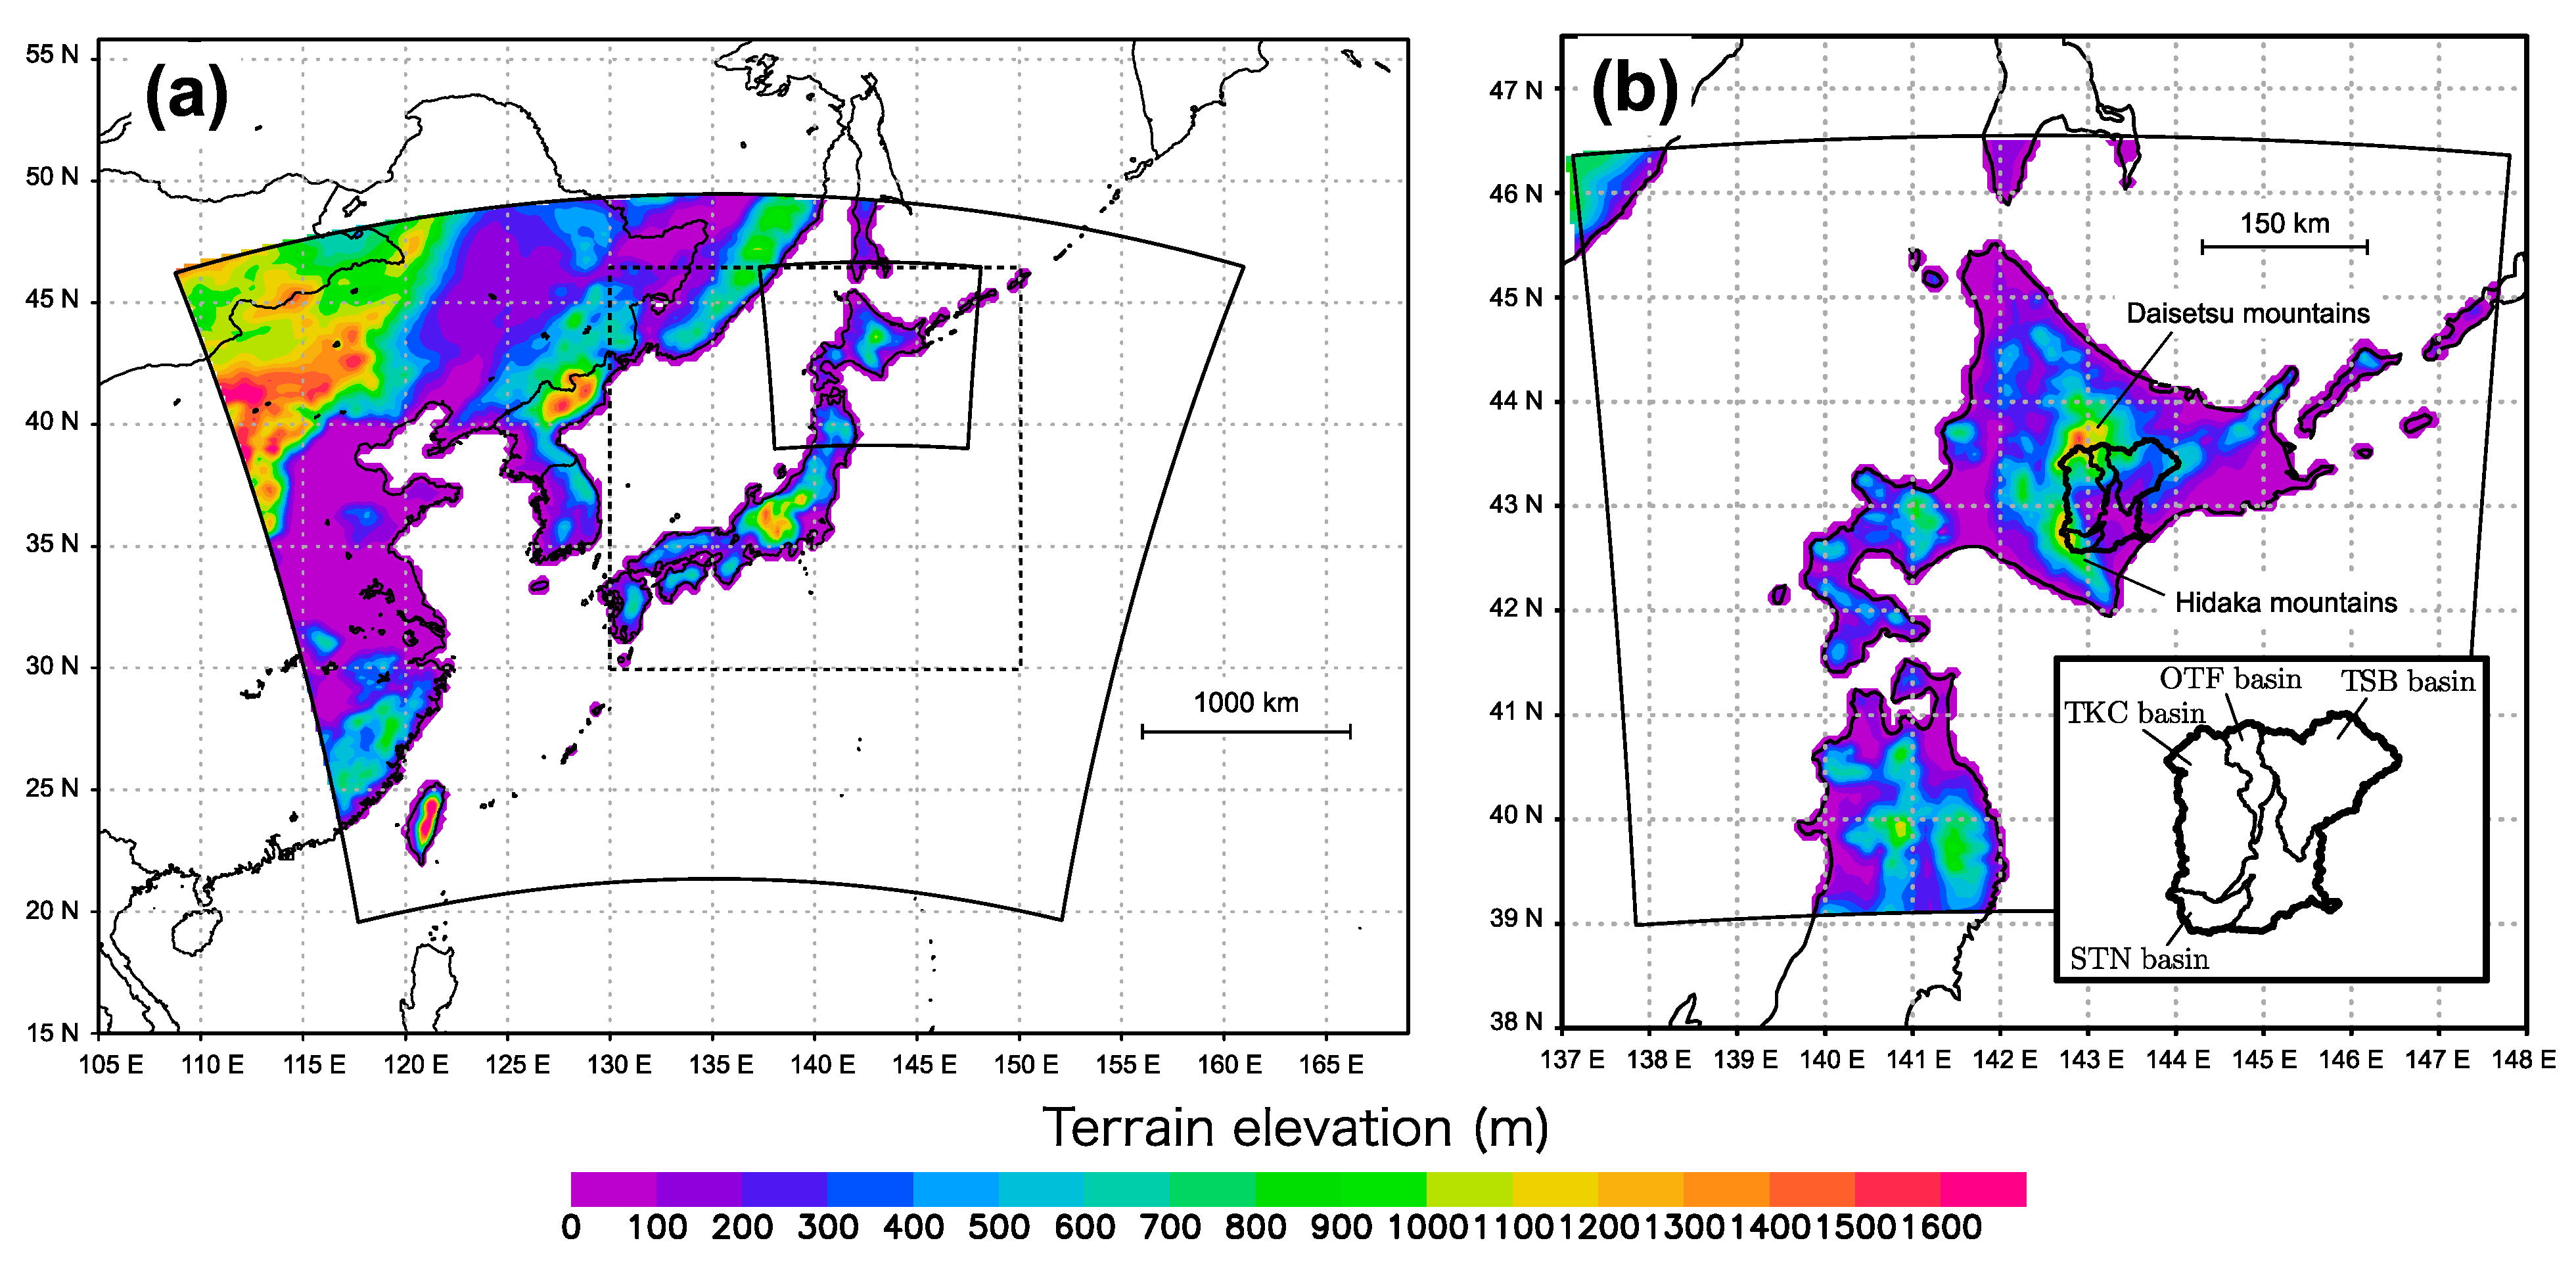
2.1. Target River Basins

The target river basins for this study are the Tokachi River sub-basins, which are located in the northernmost island in Japan (Figure 1). The Tokachi River basin is defined by the Hidaka and Daisetsu mountains, which are the east-side and north-side boundaries of the basin, respectively. The target sub-basins are the sub-basin of the Tokachi River (TKC basin; the catchment area at the Obihiro reference point and the north-west of the Tokachi River basin including the Daisetsu mountains and the Hidaka mountains), the Otofuke River basin (OTF basin; the catchment area at the Otofuke reference point and the northern part of the Tokachi River basin including the Daisetsu mountains), the Satsunai River basin (STN basin; the catchment area at the Nantaibashi reference point; the south-western part of the Tokachi River basin and including the Hidaka mountains), and the Toshibetsu River basin (TSB basin; the catchment area at the Toshibetsu reference point and the north-eastern part of the Tokachi River basin including relatively low mountains) (Figure 1). The area is similar for the TKC basin (2677.8 km2) and TSB basin (2715.2 km2), as well as for the OTF basin (707.9 km2) and STN basin (608.1 km2).

2.2. Simulated and Observed Rainfall Data

We used two sets of observed rainfall data to calculate basin-averaged 72 h rainfall volume and basin-averaged hourly rainfall intensity. One dataset is the daily rainfall data from 1951 to 2010, which was measured by a ground-based rain gauge managed by the Japan Meteorological Agency (JMA) and the Ministry of Land, Infrastructure, Transport and Tourism (MLIT). The other dataset is the hourly rainfall data from 1976 to 2018 based on the dense observation networks of the Automated Meteorological Data Acquisition System (AMeDAS) and Water Information System managed by the JMA and MLIT, respectively. These 43 years were selected as the AMeDAS and Water Information System have been operational from 1976 and 1998, respectively. The basin-averaged 72 h rainfall volume was calculated from the daily rainfall data using the Thiessen polygon method. The 72-h rainfall volume was adopted for river planning in the target river basins. The basin-averaged hourly rainfall intensity was calculated as the mean of observed hourly rainfall.
In this study, we utilized the Database for Policy Decision Making for Future Climate Change (d4PDF) (Mizuta et al. [11]) which consists of simulations from the atmospheric GCM (AGCM) called the Meteorological Research Institute AGCM, version 3.2 (MRI-AGCM3.2) [16] with a horizontal resolution of approximately 60 km (d4PDF-60km), and dynamical downscaling (DDS) of the results of the GCM to a horizontal resolution of 20 km using the RCM targeted over Japan (d4PDF-DS20) (Figure 1). The experimental settings of d4PDF consist of a past climatic condition (past experiment; 50 ensembles × 60 years (1951–2010)) and a 4 °C warmer climatic condition (+4K experiment; 6 sea surface temperature patterns × 15 ensembles × 60 years), which has a 4 °C warmer global mean air temperature than the preindustrial period. The sea surface temperature (SST) used in the past experiment was obtained from the Centennial Observation-Based Estimates of SST, version 2 (COBE-SST2) [17]. Small perturbations based on SST analysis error were added to initial conditions of the SST to prepare ensemble members. The SST used in the +4K experiment consists of the six patterns based on RCP8.5 experiments conducted under the phase 5 of the CMIP5 (Taylor et al. [12]). The details of experimental settings of the d4PDF are presented in Mizuta et al. [11]. This study used the d4PDF regional experiment data downscaled to a 5 km resolution (d4PDF-DS5) for the rainfall volumes and data extracted from d4PDF-60km for the TC positions.
To prepare rainfall data that accurately reflect basin and topography shapes with respect to the target sub-basins, this study employed dynamical downscaling (DDS) to convert annual maximum rainfall events from d4PDF-DS20 to a horizontal resolution of 5 km. The target rainfall event was defined as an event in d4PDF-DS20 for each year, between June 1 and December 1, where rainfall amounts reached the maximum value in 72 h over the TKC basin. This study defined the rainfall events as annual maximum rainfall events. For DDS, we employed the NHRCM [15], which was used to make the d4PDF-DS20. We set the target area of the DDS to 800 × 800 km around Hokkaido (Figure 1). Furthermore, we set the number of calculation grids to 161 × 161 in the horizontal direction and 50 in the vertical direction. The Kain-Fritsch convective parameterization scheme [18] was used for the DDS. The other physical schemes, such as microphysics, land surface, and boundary layer schemes, were the same as those used in Kawase et al. [19]. The grid-mean topography was used in this study, while Kawase et al. [19] used the envelope-type mountains. This study utilized values from the d4PDF-DS20 to set the initial and boundary conditions for the calculation. The target period for the DDS was set to 15 days, including the annual maximum rainfall occurrence period in each year. The DDS was performed for a total of 3000 events for the past experiment and 5400 events for the +4K experiment. This study excluded the spin-up period of 5 days from 15 days and considered 10 days as the target period and used rainfall data from these 10 days to detect maximum 72 h cumulative rainfall events over the sub-basins. We verified that the target period (the 10 days) included heavy rainfall events over all the four sub-basins, though the DDS target corresponded to the annual maximum rainfall events over the TKC basin. Figure S1 shows that annual maximum 72 h rainfall volume over the sub-basins and the difference in the date of occurrence between the TKC basin and each of the other three sub-basins, obtained from observed daily rainfall data (from 1951–2010). The figure indicates that the difference in the date of occurrence for almost all the heavy rainfall events (at least the rainfall events whose rainfall volume were over the 90th percentile) was 1 day or less than 1 day. This result suggests that the d4PDF-DS5 also includes heavy rainfall events over the three other sub-basins and can be used to evaluate heavy rainfall over all the target sub-basins.

2.3. Tropical Cyclone Tracking Data

This study utilized TC track data (Yoshida et al. [2]) extracted from d4PDF-60km. The tracking algorithm is based on Murakami et al. [20]. The data was prepared using d4PDF-60km, and corresponds to 6 h intervals. Yoshida et al. [2] showed that TC climatology (number of TC genesis, frequency of TC passing, and intensity) of the d4PDF is consistent with actual observations. This study utilized tracking data linearly interpolated at 1 h intervals to accurately obtain the relationship between TC position and rainfall intensity. The Japan Meteorological Agency Regional Specialized Meteorological Center (RSMC) best-track dataset was used as observed TC track data. These data are given in several hourly intervals. In this study, we used linearly interpolated data at 1 h intervals, similarly to the d4PDF TC track data.

3. Results

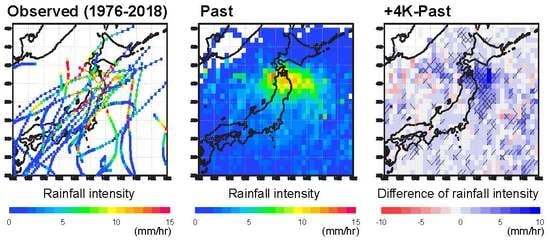
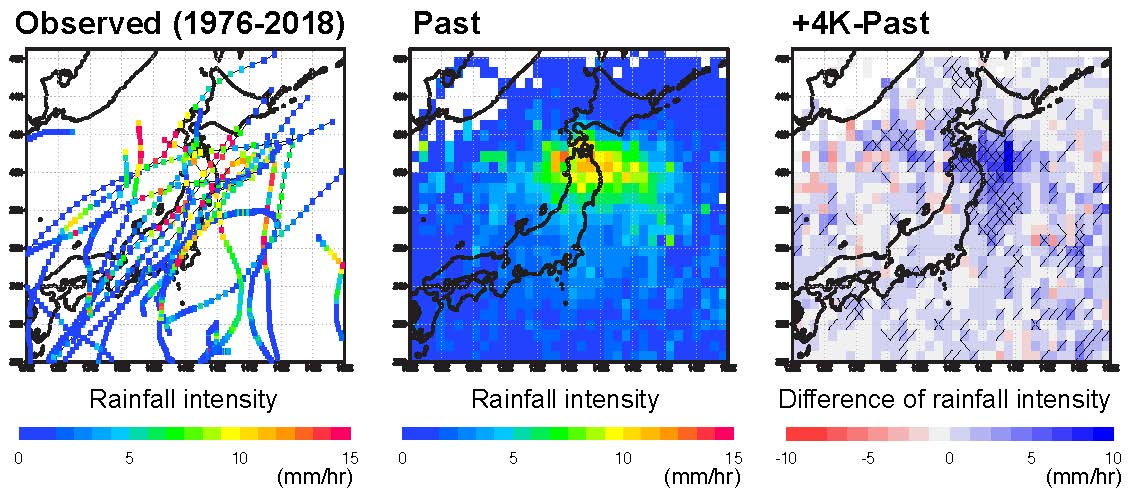
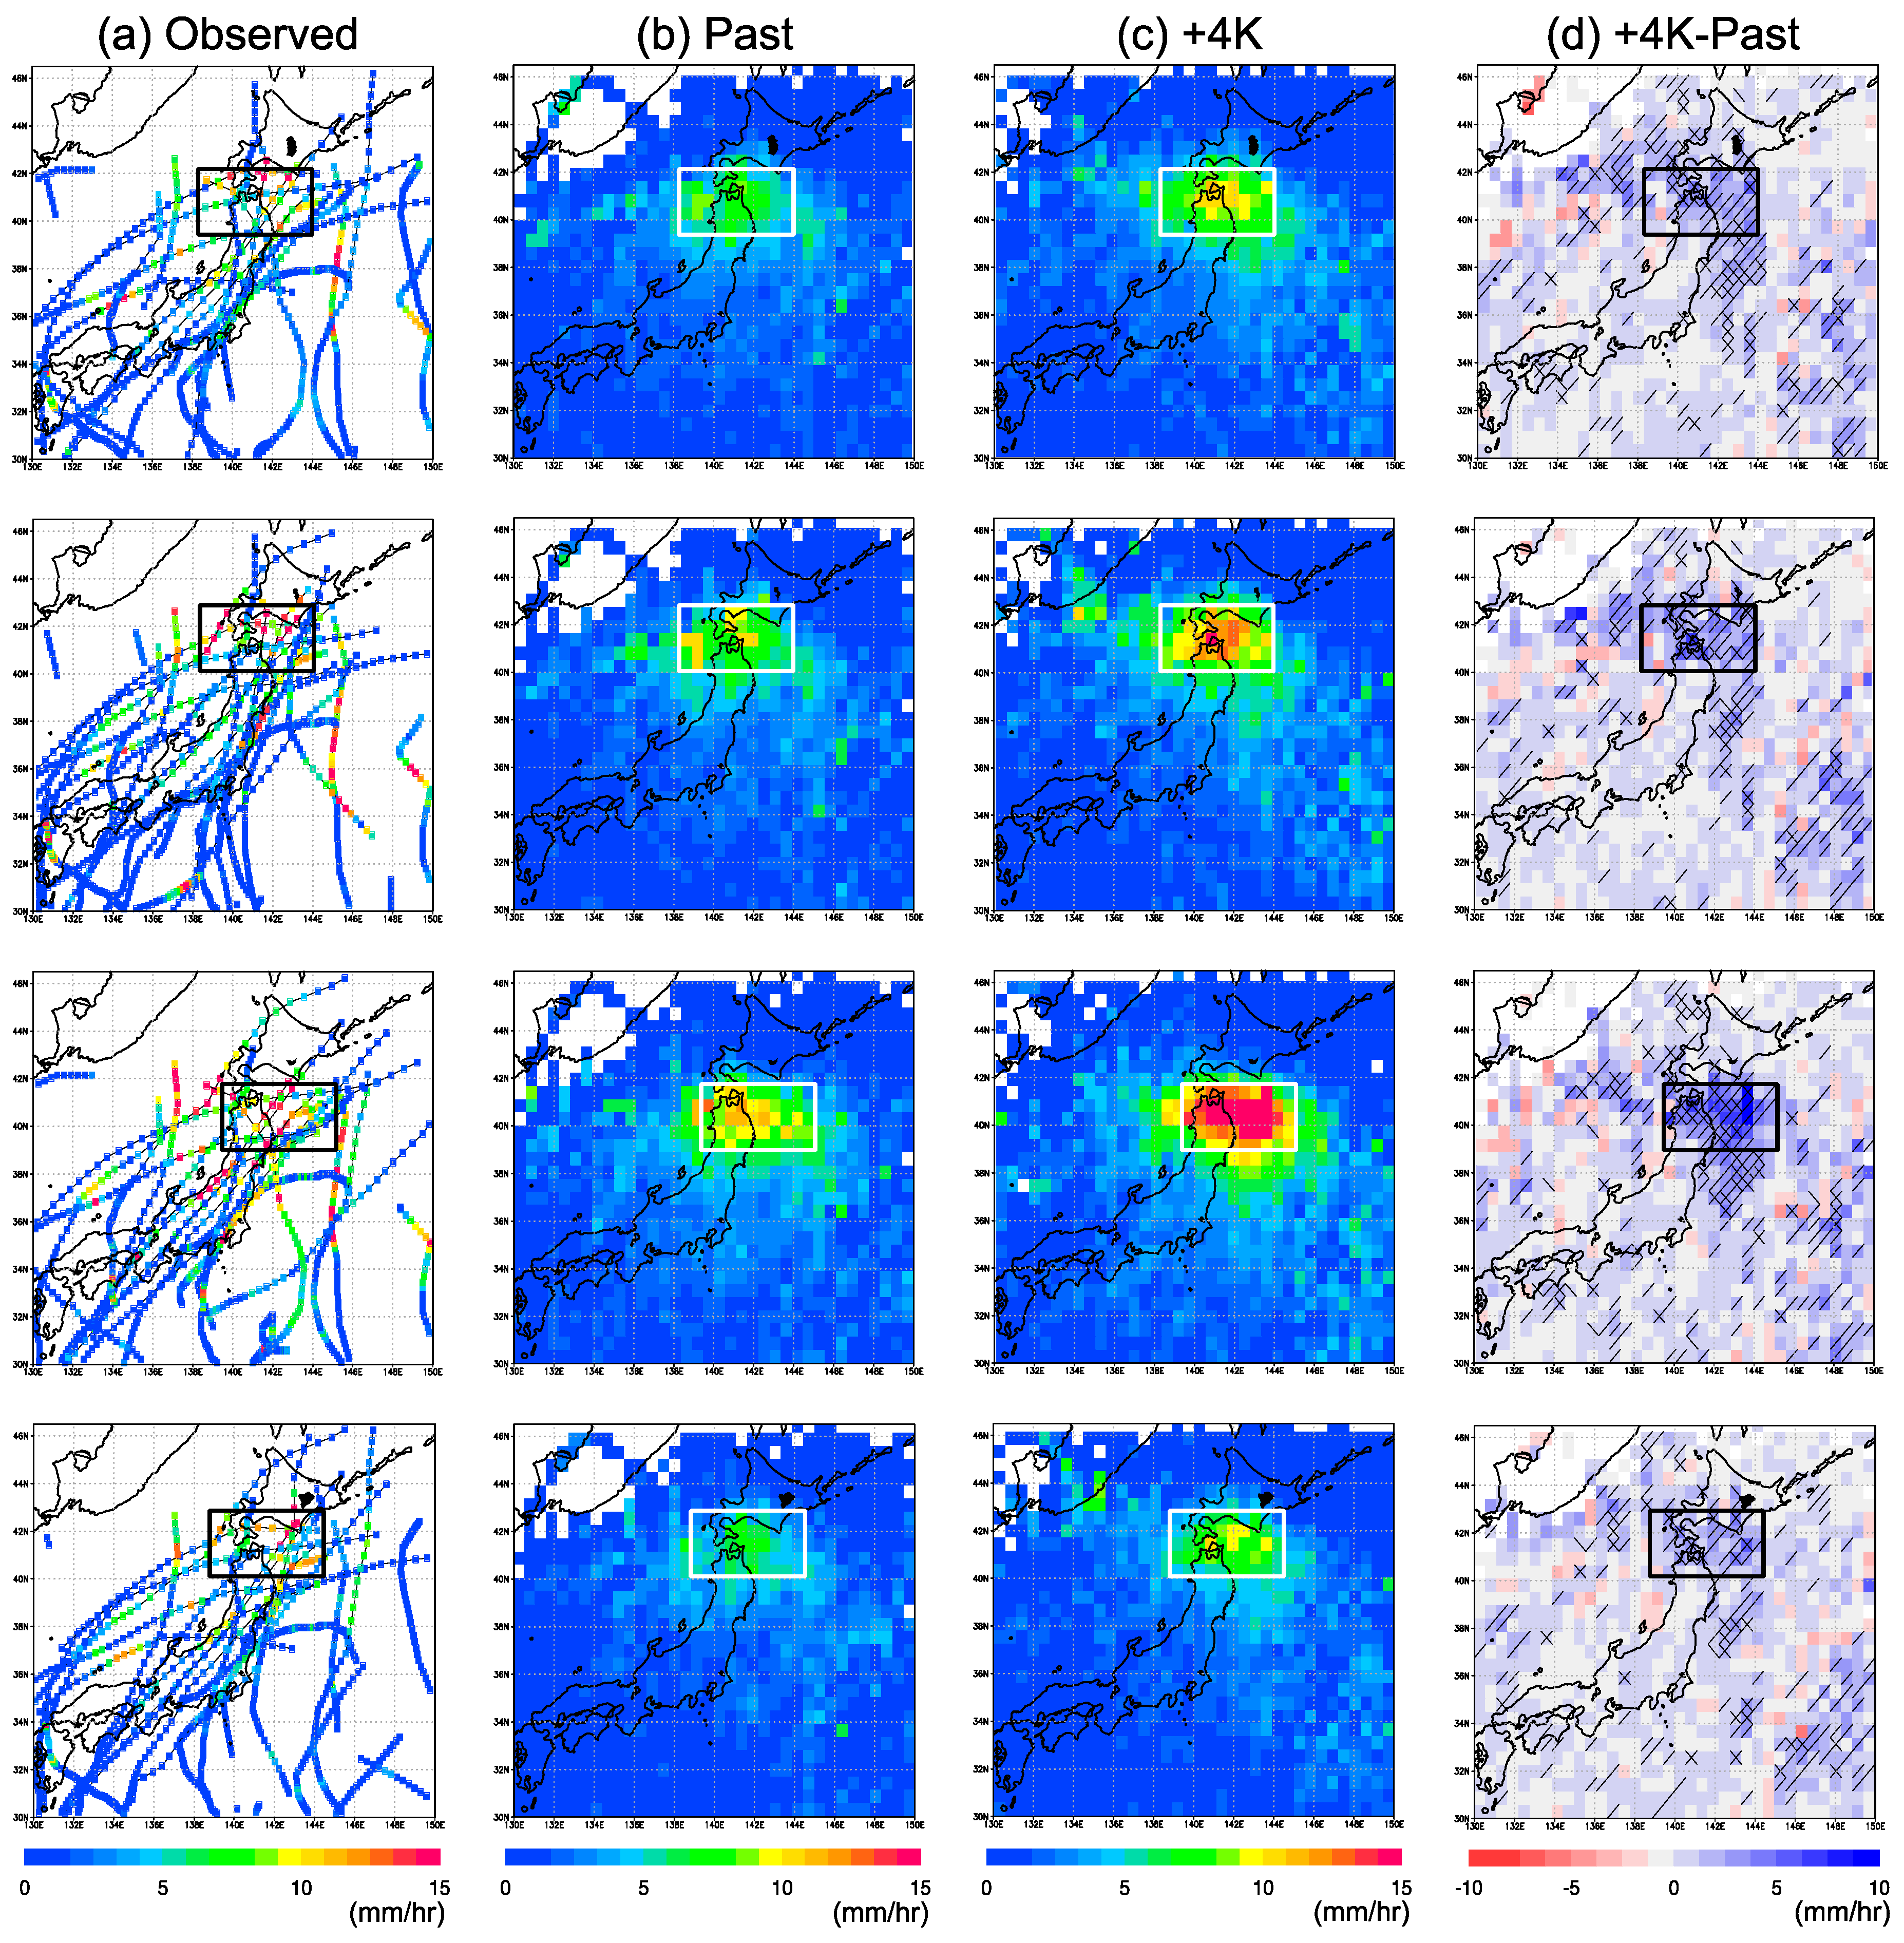
3.1. Comparison between Observation and d4PDF-DS5 (Past Experiment)

This study classified annual maximum 72 h rainfall events into TC-induced rainfall events and non-TC-induced rainfall events. The annual maximum 72 h rainfall events for which the corresponding TCs were located near Japan (Figure 1, dashed line) within the 72-h period were defined as TC-induced rainfall events. All other events were classified as non-TC-induced rainfall events. Below, we compare TC-induced and non-TC-induced annual maximum 72 h rainfall for the actual observations and the past experiment. Table 1 shows the total number of TC-induced and non-TC-induced events and the percentage of TC-induced events among all events. Despite a difference of 6.6 percentage points between the observed and ensemble median value, the observed values were within the 5th and 95th percentile values of the individual ensemble members. The range between the 5th and 95th percentile was approximately 20%. This result means the proportion of TC-induced annual maximum rainfall event in 60 years has large uncertainty and frequency as the annual maximum rainfall cannot be estimated with certainty from only several decades of recorded history.
Figure 2 shows the 90th percentile of TC-induced and non-TC-induced annual maximum rainfall volumes and their ratios. The rainfall volume was different for each basin. The difference in actual rainfall between the heaviest rainfall basin (STN basin) and the least rainfall basin (TSB basin) in a TC-induced event was 80 mm/72 h and for a non-TC-event was 50 mm/72 h. The ratios between the TC-induced and non-TC-induced rainfall volume were similar (1.27–1.29) for all the basins in the past experiment. The results also show that the d4PDF-5km from the past experiment had enough reproducibility to be able to predict rainfall volume because the observed and past experiment values were similar and the observed values largely fell within the 5th and 95th percentile intervals of the ensemble members.
Figure 3 illustrates the relationship between TC position and hourly rainfall intensity over the sub-basins. The points in Figure 3a show the 72 h cyclone tracks for the events producing annual maximum TC-induced rainfall in each river basin over 43 years (1976 to 2018). The colors indicate the basin-average rainfall intensity over the river basins when the cyclone was at the point indicated. Figure 3a shows that among all TCs, those located to the south-west of the Tokachi River basin caused the heaviest rainfall over the target sub-basins. However, the small sample size of observed data for annual maximum rainfall events over 43 years makes it difficult to assess the relationship between the TC position and rainfall intensity. Figure 3b shows the simulated result averaged over all cyclone tracks in the ensemble on a 0.56-deg lat-lon grid from d4PDF-DS5 for the past experiment. These figures show that all sub-basins experience a similar increase in rainfall intensity owing to the influence of TC on the region south-west of the Tokachi River basin (hereinafter, the high-rainfall-intensity area is referred to as a “hotspot”). This area is located along the track of Typhoon Lionrock (2016), which caused heavy rainfall over the Tokachi River basin (199.3 mm/72 h over the TKC basin). The location and magnitude of the hotspot differed by basin. As compared to the TKC basin, the center of the hotspot shifted approximately 30 km north of the OTF basin and 100 km south of the STN basin. However, the areas of the hotspots overlapped, indicating that the same TC tended to cause heavy rainfalls over each target basin. The rainfall intensity in the hotspot increased by approximately 3 mm/h and 5 mm/h over the OTF basin and STN basin, respectively. In contrast, we observed that the hotspot and the rainfall intensity magnitude over the TSB basin were the same as those over the TKC basin. The figure also shows that the spatial change of rainfall intensity around the hotspots is gradual. This result indicates that the 0.56 deg lat-lon grid is fine enough to evaluate relationship between TC position and hourly rainfall intensity over the target basins.

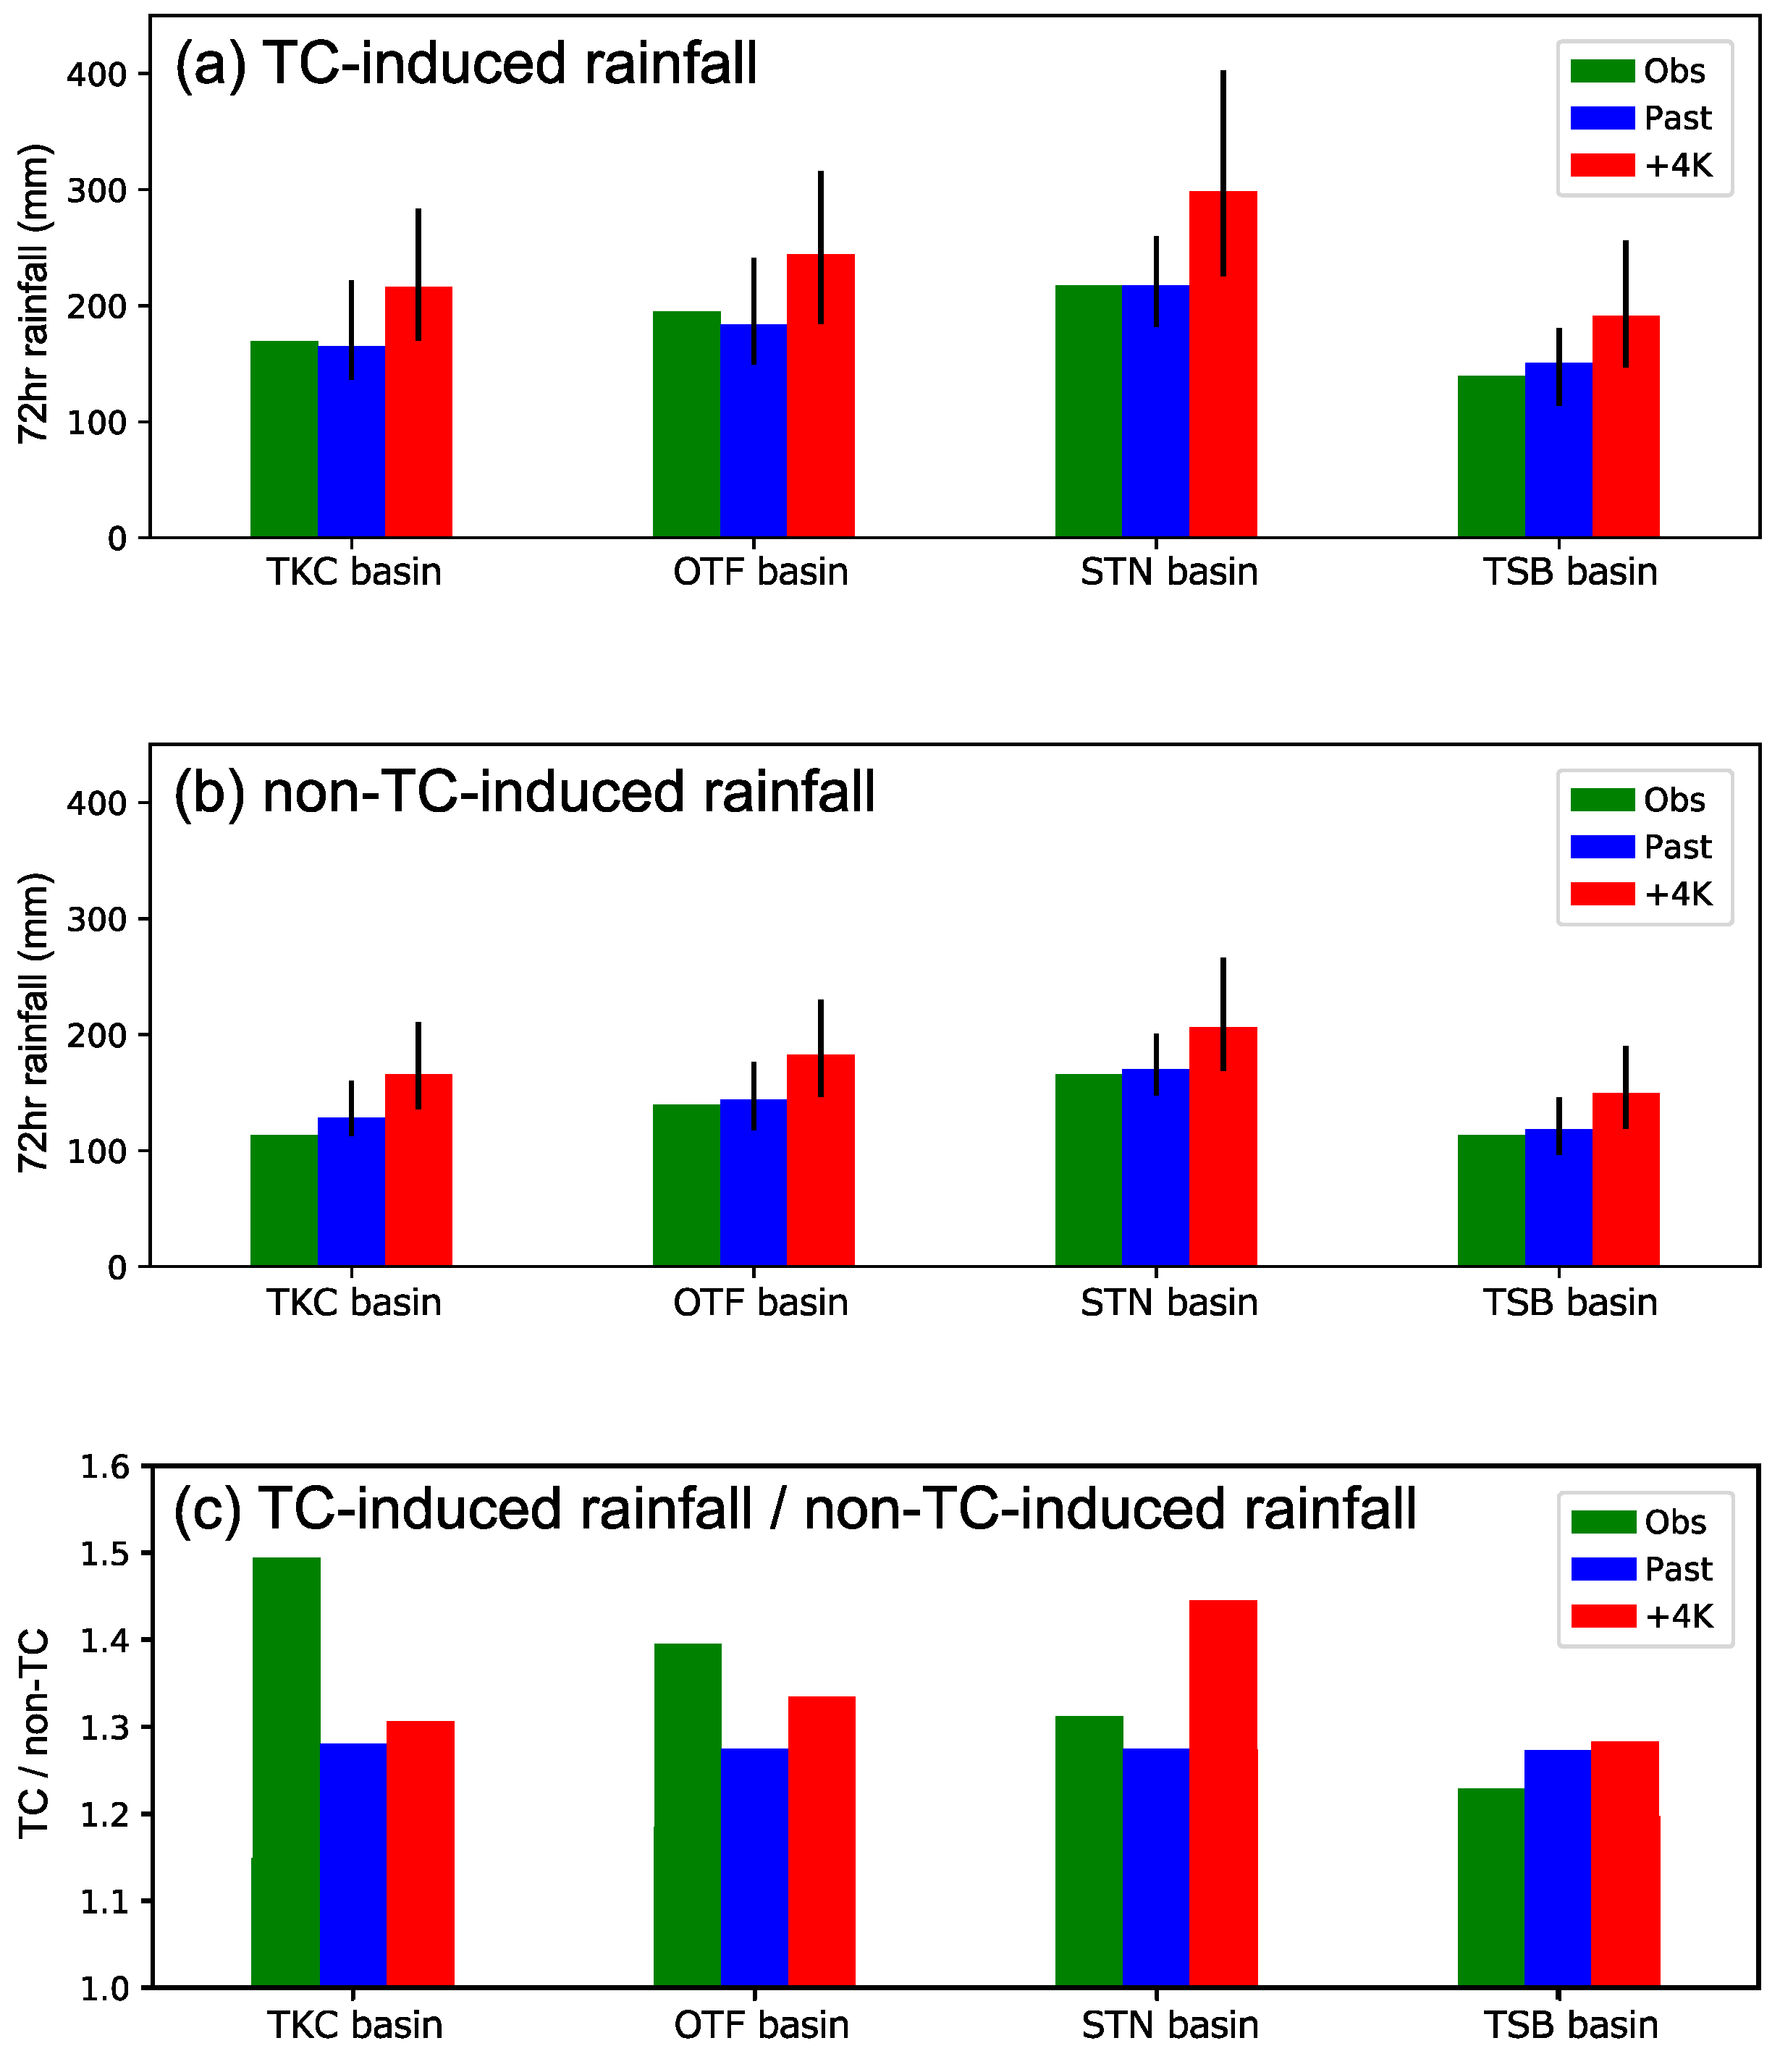
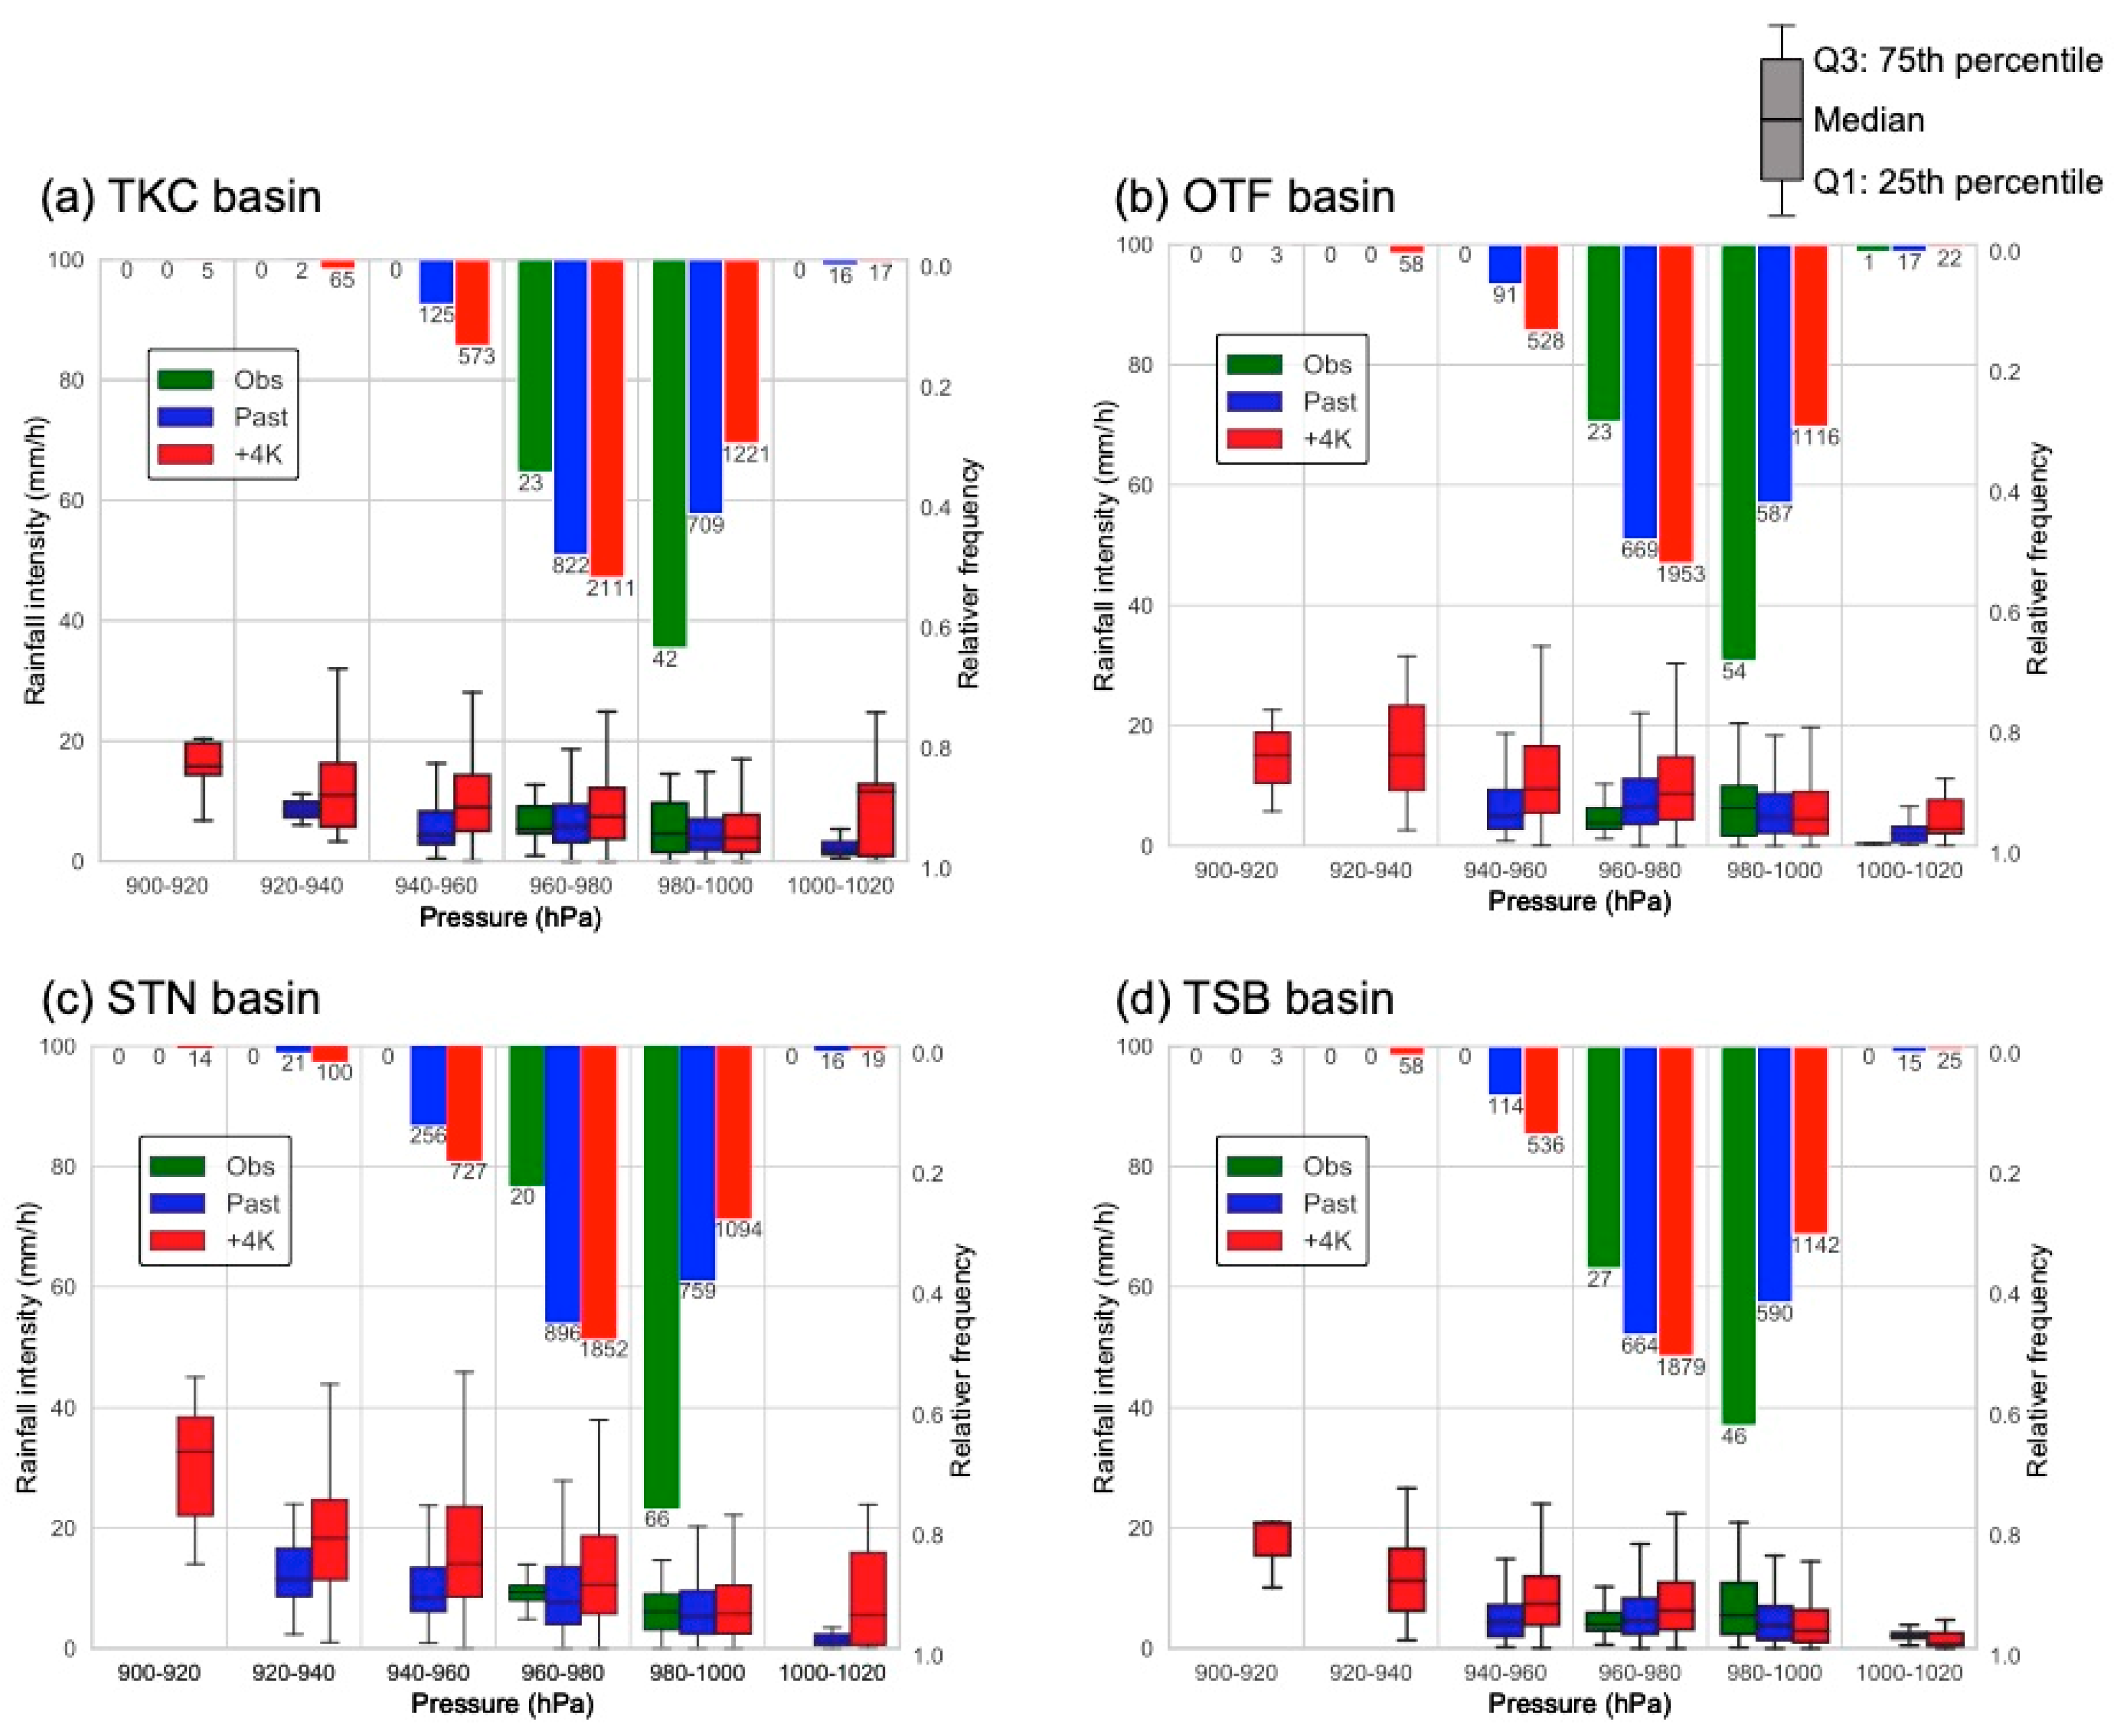
3.2. Future Change of TC-induced Rainfall

Below, we compare TC-induced and non-TC-induced annual maximum rainfall between the Past and +4K experiments. Table 1 shows that the proportion of TC-induced annual maximum rainfall event decreased by approximately 8 percentage points in the +4K experiment. This is consistent with previous studies that concluded that the frequency of TCs will decrease in the northwest Pacific (e.g., Walsh et al. [1]; Yoshida et al. [2]; Knutson et al. [3]).
Figure 2 shows that the 90th percentile of TC-induced and non-TC-induced rainfall increases due to global warming over every basin. Remarkably, despite the increased volumes for non-TC-induced events being 30–40 mm/72 h, those of TC-induced events were 40–80 mm/72 h. The result also shows that the increment in the TC-induced rainfall volumes is different for each sub-basin. The difference in the TC-induced rainfall volume over the STN basin was the biggest at 80.9 mm/72 h, and that of the TSB basin was the smallest at 41.0 mm/72 h. Figure 2 also shows that the ratio between the TC-induced and non-TC-induced rainfall volume was the highest for the STN basin. This suggests that the influence of global warming on TC-induced heavy rainfall is the strongest for the STN basin.
Figure 3c is same as Figure 3b but represents the +4K experiment. The figure shows that there is the hotspot whose position is almost the same as that in the past experiment for each sub-basin, though the rainfall intensity is different. Figure 3d shows the differences between the past experiment and +4K experiment (the +4K experiment minus the past experiment). An increasing trend was observed for rainfall intensity over every sub-basin when a TC was located in the hotspot. The STN basin exhibited the most notable rainfall intensification, with the rainfall intensity increasing from 5 mm/h to 10 mm/h in the hotspot. This shows that in the future, the target sub-basins should be on higher alert when a TC approaches.
This study examined the differences between the TC-induced rainfall in the hotspots of the Past and +4K experiments by separating the increase of the TC-induced rainfall into the effect of TC intensification and atmospheric moisture increase, following previous studies (Hasegawa and Emori [21]; Hatsuzuka et al. [14]). Figure 4 shows the frequency (top bars extending downward) and basin-averaged rainfall intensity (lower box and whiskers) of TCs as a function of central pressure when located in the hotspots of each basin (green denotes the observed, blue the past experiment, and red the +4K experiment). The hotspot regions are indicated by the boxes in Figure 3 for the TKC basin (138.40° E–144.00° E, 39.52° N–42.32° N), OTF basin (138.40° E–144.00° E, 40.08° N–42.88° N), STN basin (139.52° E–145.12° E, 38.96° N–41.76° N) and TSB basin (138.96° E–144.56° E, 40.08° N–42.88° N). The result of d4PDF-DS5 showed that the strongest TCs (lowest pressure TCs) tend to produce the heaviest rainfall over all the basins. However, the observed data, which is less than 30 samples in the 940–960 hPa range, showed a different trend from the d4PDF-DS5 for all the basins. The trend was seen in the TKC and STN basin but not in the OTF and TSB basins. The figure shows an increase in the strong TC frequency in the +4K experiment, which leads to more frequent heavy rainfall events (hereinafter, the effect is called “dynamic change”). The figure also shows that the heavier rainfall tends to occur between the same strength TCs (hereinafter, the effect is called “thermodynamic change”). The dynamic and thermodynamic changes both contribute to intensification of the TC-induced rainfall over all the basins. Both changes were strongest in the STN basin.

4. Discussion and Summary

This study elucidates the TC-induced rainfall characteristics (rainfall volume, relationship between TC position and rainfall intensity, and contribution of TC intensity on rainfall intensity) over the sub-basins of the Tokachi River, using the large ensemble regional climate model experiments with a 5 km grid spacing. The comparison of TC-induced annual maximum 72 h rainfall volume shows that the d4PDF-5km from the past experiment has enough reproducibility to be able to predict rainfall volume. The differences of the TC-induced rainfall volume (90th percentile of TC-induced annual maximum 72 h rainfall volume) between each basin were quantified from actual observations and d4PDF-DS5 of the past experiment. The difference between the STN basin and TSB basin was the largest (30 mm/72 h) in the past experiment. The relationship between TC position and hourly rainfall intensity over the sub-basins was examined from d4PDF-DS5. The result showed that among all TCs, those located to the south-west of the Tokachi River basin (hotspot) caused strong rainfall over the target sub-basins. These relationships are difficult to assess from the small sample size during the observation period. However, the relationships were accurately assessed by using d4PDF-DS5.
In warmer climates, the proportion of TC-induced annual maximum rainfall events is projected to decrease by approximately 8 percentage points. However, the risk of heavy rainfall from TCs is projected to increase, based on the +4K experiments that simulated increased rainfall intensity during these events. The increased volumes of the 90th percentile of TC-induced rainfall were relatively high and had a wider variation over each sub-basin as compared to those from the past experiment. In particular, the future change of the TC-induced rainfall volume over the STN basin was the highest (80 mm/72 h). In the +4K experiment, there was an increasing trend of rainfall intensity over every sub-basin when TCs were located in their hotspots. The STN basin, where the past experiment exhibited high rainfall intensity owing to the influence of the TC, showed a remarkable increase in rainfall intensity. This study examined the differences of the TC-induced rainfall in the hotspot between the past and +4K experiments. The result shows that both dynamic and thermodynamic changes contribute to intensify the TC-induced rainfall over the basins and that both the changes were strongest over the STN basin.
By using a large volume of high-resolution ensemble data, it was possible to assess the characteristics of the TC-induced rainfall over the sub-basins. This type of analysis had previously been difficult to conduct using just the observational data. The combination of this relationship with the TC track forecast can be used to assess the hazards from heavy rainfall over each sub-basin in advance. The advanced rainfall information should be useful for dam control (discharge control before heavy rainfall occurrence). The characteristics of the TC-induced rainfall examined under this study can help evaluate flood damage scenarios in terms of the TC-track and TC-intensity. In addition, the data can also contribute to adaptation planning by focusing on a target rainfall level for each sub-basin. The use of data with climatic conditions that reflect advanced global warming made it possible to assess which sub-basins will experience prominent increases in the TC-induced rainfall under the future climate.

Supplementary Materials

The following information is available online at https://www.mdpi.com/2073-4433/11/5/435/s1, Figure S1: Differences in the date of annual maximum 72 h rainfall occurrence between the TKC basin and the other sub-basin and the 72 h rainfall volume over the four sub-basins.

Author Contributions

Conceptualization, T.H. and T.J.Y.; methodology, T.H. and T.J.Y.; software, T.H. and H.K.; validation, T.H.; formal analysis, T.H.; investigation, T.H.; resources, T.H., T.J.Y. and H.K.; data curation, T.H.; writing—original draft preparation, T.H.; writing—review and editing, T.H., T.J.Y. and H.K.; visualization, T.H.; supervision, T.J.Y.; funding acquisition, T.J.Y. and T.H. All authors have read and agreed to the published version of the manuscript.

Funding

This research is supported by the Social Implementation of Climate change Adaptation Technology (SICAT) project of the Ministry of Education, Culture, Sports, Science and Technology (MEXT) of Japan; JSPS KAKENHI Grant Number 17K14728, 19H02241, 19H00963; and the River Center of Hokkaido.

Acknowledgments

This study utilized the database for Policy Decision making for Future climate change (d4PDF), which was produced under the SOUSEI program. The Earth simulator was used in this study for dynamical downscaling under the “Strategic Project with Special Support (Grand Challenge)” of Japan Agency for Marine-Earth Science and Technology (JAMSTEC).

Conflicts of Interest

The authors declare no conflict of interest.

References

  1. Walsh, K.J.E.; McBride, J.L.; Klotzbach, P.J.; Balachandran, S.; Camargo, S.J.; Holland, G.; Knutson, T.; Kossin, J.; Lee, T.-C.; Sobel, A.; et al. Tropical cyclones and climate change. Wiley Interdiscip. Rev. Clim. Chang. 2015, 7, 65–89. [Google Scholar] [CrossRef]
  2. Yoshida, K.; Sugi, M.; Mizuta, R.; Murakami, H.; Ishii, M. Future Changes in Tropical Cyclone Activity in High-Resolution Large-Ensemble Simulations. Geophys. Res. Lett. 2017, 44, 9910–9917. [Google Scholar] [CrossRef]
  3. Knutson, T.; Sirutis, J.J.; Zhao, M.; Tuleya, R.E.; Bender, M.; Vecchi, G.; Villarini, G.; Chavas, D. Global Projections of Intense Tropical Cyclone Activity for the Late Twenty-First Century from Dynamical Downscaling of CMIP5/RCP4.5 Scenarios. J. Clim. 2015, 28, 7203–7224. [Google Scholar] [CrossRef] [Green Version]
  4. Manganello, J.V.; Hodges, K.I.; Dirmeyer, B.; Kinter, J.L.; Cash, B.A.; Marx, L.; Jung, T.; Achuthavarier, D.; Adams, J.M.; Altshuler, E.L.; et al. Future Changes in the Western North Pacific Tropical Cyclone Activity Projected by a Multidecadal Simulation with a 16-km Global Atmospheric GCM. J. Clim. 2014, 27, 7622–7646. [Google Scholar] [CrossRef]
  5. Kitoh, A.; Endo, H. Future Changes in Precipitation Extremes Associated with Tropical Cyclones Projected by Large-Ensemble Simulations. J. Meteorol. Soc. Jpn. 2019, 97, 141–152. [Google Scholar] [CrossRef] [Green Version]
  6. Kanada, S.; Tsuboki, K.; Aiki, H.; Tsujino, S.; Takayabu, I. Future Enhancement of Heavy Rainfall Events Associated with a Typhoon in the Midlatitude Regions. Sola 2017, 13, 246–251. [Google Scholar] [CrossRef] [Green Version]
  7. Nayak, S.; Takemi, T. Dynamical Downscaling of Typhoon Lionrock (2016) for Assessing the Resulting Hazards under Global Warming. J. Meteorol. Soc. Jpn. 2019, 97, 69–88. [Google Scholar] [CrossRef] [Green Version]
  8. Hill, K.A.; Lackmann, G.M. The Impact of Future Climate Change on TC Intensity and Structure: A Downscaling Approach. J. Clim. 2011, 24, 4644–4661. [Google Scholar] [CrossRef]
  9. Lonfat, M.; Rogers, R.; Marchok, T.; Marks, F. A Parametric Model for Predicting Hurricane Rainfall. Mon. Weather. Rev. 2007, 135, 3086–3097. [Google Scholar] [CrossRef]
  10. Nguyen-Le, D.; Yamada, T.J. Simulation of Tropical Cyclone 201610 (Lionrock) and its Remote Effect on Heavy Rainfall in Hokkaido. J. Jpn. Soc. Civ. Eng. Ser. B1 (Hydraulic Eng.) 2017, 73, I_199–I_204. [Google Scholar] [CrossRef] [Green Version]
  11. Mizuta, R.; Murata, A.; Ishii, M.; Shiogama, H.; Hibino, K.; Mori, N.; Arakawa, O.; Imada, Y.; Yoshida, K.; Aoyagi, T.; et al. Over 5,000 Years of Ensemble Future Climate Simulations by 60-km Global and 20-km Regional Atmospheric Models. Bull. Am. Meteorol. Soc. 2017, 98, 1383–1398. [Google Scholar] [CrossRef]
  12. Taylor, K.E.; Stouffer, R.J.; Meehl, G.A. An Overview of CMIP5 and the Experiment Design. Bull. Am. Meteorol. Soc. 2012, 93, 485–498. [Google Scholar] [CrossRef] [Green Version]
  13. Endo, H.; Kitoh, A.; Mizuta, R.; Ishii, M. Future Changes in Precipitation Extremes in East Asia and Their Uncertainty Based on Large Ensemble Simulations with a High-Resolution AGCM. Sola 2017, 13, 7–12. [Google Scholar] [CrossRef] [Green Version]
  14. Hatsuzuka, D.; Sato, T.; Yoshida, K.; Ishii, M.; Mizuta, R. Regional Projection of Tropical-Cyclone-Induced Extreme Precipitation around Japan Based on Large Ensemble Simulations. Sola 2020, 16, 23–29. [Google Scholar] [CrossRef] [Green Version]
  15. Sasaki, H.; Kurihara, K.; Takayabu, I.; Uchiyama, T. Preliminary Experiments of Reproducing the Present Climate Using the Non-hydrostatic Regional Climate Model. Sola 2008, 4, 25–28. [Google Scholar] [CrossRef] [Green Version]
  16. Mizuta, R.; Yoshimura, H.; Murakami, H.; Matsueda, M.; Endo, H.; Ose, T.; Kamiguchi, K.; Hosaka, M.; Sugi, M.; Yukimoto, S.; et al. Climate Simulations Using MRI-AGCM3.2 with 20-km Grid. J. Meteorol. Soc. Jpn. 2012, 90, 233–258. [Google Scholar] [CrossRef] [Green Version]
  17. Hirahara, S.; Ishii, M.; Fukuda, Y. Centennial-Scale Sea Surface Temperature Analysis and Its Uncertainty. J. Clim. 2014, 27, 57–75. [Google Scholar] [CrossRef]
  18. Kain, J.S.; Fritsch, J.M. Convective Parameterization for Mesoscale Models: The Kain-Fritsch Scheme. In The Representation of Cumulus Convection in Numerical Models; Emanuel, K.A., Raymond, D.J., Eds.; Meteorological Monographs; American Meteorological Society: Boston, MA, USA, 1993; pp. 165–170. [Google Scholar]
  19. Kawase, H.; Sasai, T.; Yamazaki, T.; Ito, R.; Dairaku, K.; Sugimoto, S.; Sasaki, H.; Murata, A.; Nosaka, M. Characteristics of Synoptic Conditions for Heavy Snowfall in Western to Northeastern Japan Analyzed by the 5-km Regional Climate Ensemble Experiments. J. Meteorol. Soc. Jpn. 2018, 96, 161–178. [Google Scholar] [CrossRef] [Green Version]
  20. Murakami, H.; Mizuta, R.; Shindo, E. Future changes in tropical cyclone activity projected by multi-physics and multi-SST ensemble experiments using the 60-km-mesh MRI-AGCM. Clim. Dyn. 2011, 39, 2569–2584. [Google Scholar] [CrossRef] [Green Version]
  21. Hasegawa, A.; Emori, S. Tropical Cyclones and Associated Precipitation over the Western North Pacific: T106 Atmospheric GCM Simulation for Present-day and Doubled CO2 Climates. Sola 2005, 1, 145–148. [Google Scholar] [CrossRef] [Green Version]
Figure 1. Simulation area and the target basins. (a) The outer solid line indicates the calculation area for d4PDF-DS20. The inner solid line indicates the simulation area for d4PDF-DS5. The dashed line indicates the TC-detection area. (b) The thick line indicates the entire Tokachi River basin. The inner solid lines indicate the area of the target sub-basins (TKC basin, OTF basin, STN basin, and TSB basin). The outer solid line indicates the simulation area for d4PDF-DS5. The colors represent the terrain elevation used in the dynamical downscaling.
Atmosphere 11 00435 g001
Figure 2. The 90th percentile of annual maximum 72 h rainfall volume of (a) TC-induced rainfall events and (b) non-TC-induced rainfall events. The bars indicate median values and error bars show the 5th–95th percentile of ensemble members. (c) The ratios between median value of TC-induced and non-TC-induced rainfall volume (TC/non-TC).
Atmosphere 11 00435 g002
Figure 3. Area-averaged rainfall intensity over the sub-basins at the TC position. From the left: (a) Observed data (1976–2018), (b) past experiment, (c) +4K experiment, and (d) +4K experiment minus past experiment (diagonal lines (upper right to lower left) represent grids that satisfy a 5% significance level using Welch’s t-test, diagonal lines (upper left to lower right) represent grids on which rainfall intensifies under the all six sea surface temperature patterns from the +4K experiment). From the top: area-average rainfall over the TKC basin, OTF basin, STN basin, and TSB basin. The black fills indicate the target basins. The solid line boxes indicate the hotspot for each basin; the TKC basin (138.40° E–144.00° E, 39.52° N–42.32° N), OTF basin (138.40° E–144.00° E, 40.08° N–42.88° N), STN basin (139.52° E–145.12° E, 38.96° N–41.76° N) and TSB basin (138.96° E–144.56° E, 40.08° N–42.88° N).
Atmosphere 11 00435 g003
Figure 4. Basin-averaged rainfall intensity as a function of central pressure of TCs (shown in boxplot) and relative frequency of the central pressure of TCs (shown in bars) when the TC is located in the hotspot of (a) TKC basin, (b) OTF basin, (c) STN basin, and (d) TSB basin. The upper whisker of the box plot is the heaviest rainfall intensity smaller than 1.5(Q3-Q1) above the Q3. Similarly, the lower whisker of the box plot is the smallest dataset number larger than 1.5(Q3-Q1) below the Q1. The numbers of corresponding cases are shown in bars placed at the bottom of the plot.
Atmosphere 11 00435 g004
Table 1. The number of TC-induced and non-TC-induced events within each annual maximum 72 h rainfall event over the TKC basin (lines 1 and 2). The proportions (%) of TC-induced events are shown in Line 3. Median values of the ensemble members are shown (the 5th and 95th percentile values of the ensemble members are within the parenthesis). The number of total events in the Past and +4K experiments are shown in lines 1 and 2.
Number/ProportionObserved
(1951–2010)
Past+4K
Number of TC-induced events2622 (15.45–27)
Total: 1082/3000
17 (9–22)
Total: 1429/5400
Number of Non-TC-induced events3438 (33–44.55)
Total: 1918/3000
43 (38–51)
Total: 3971/5400
Proportion of TC-induced events43.336.7 (25.8–45.0)28.3 (15.0–36.7)

