Abstract
The 24th Olympic and Paralympic Winter Games will take place in Beijing in 2022. All three competition zones are vulnerable to extreme cold surges (ECSs), owing to the occurrence of the East Asian winter monsoon. In this paper, a representative competition domain (37.5–42.5° N, 110–120° E) is adopted, with a view to avoiding the differences in both the geographies and the thresholds of ECSs among different zones by considering the probability of simultaneous occurrences. Since 2009, the ECSs in the domain have displayed higher frequency and extremity. Based on all ECS cases in the domain, the dominant circulation is revealed by a quasi “reverse-Ω” pattern, with two strong ridges over the east of the Ural Mountain and the Okhotsk Sea, and a broad, deep trough in East Asia. The influencing sources of the ECSs at the domain could be traced to the Novaya Zemlya by a day-by-day backward analysis. The oblique latitude/longitude–time profiles of both the 500 hPa geopotential height and the 850 hPa air temperature anomalies from the source to the domain clearly indicate that the pre-signal could have a leading influence that exceeds ten days, with a slow accumulation in the first stage and a rapid outburst in the second stage.
1. Introduction
Extreme cold surges (ECS) are one of the most severe meteorological disasters in the middle latitudes of the Northern Hemisphere in the winter season. Both statistical results and individual cases have explored that their frequency has been higher in recent decades than that in the first ten years of the 21st century in Eurasia and North America, owing to the Arctic warming or Arctic amplification, a phenomenon caused by the abrupt decrease in Arctic sea ice [1,2,3,4,5,6,7,8,9]. North China is situated in the center of the East Asian winter monsoon (EAWM) region. Every year, the ECSs invade this region, even reaching southern China from high latitudes. The sharp temperature drops and the icy cold north winds cause disastrous effects on this region in many aspects, and lead to huge economic losses. For example, a “boss level” ECS in January 2016 seriously affected transportation and public lives, and led to a loss of more than 20 billion dollars [8,10,11]. Similar events occurred in 2018 and 2020, both of which brought severe freezing disasters to the northern regions of China—especially North China [12,13].
ECSs can also cause severe injury to athletes during athletic training and competition. Analyses indicates that the risk of cold injuries in winter sports tends to increase in colder weather with a strong wind chill, especially for outdoor events in mountainous areas [14]. Outdoor games are also significantly affected by adverse weather events. Athletes and spectators of sporting events are sometimes exposed to extreme meteorological conditions, which may affect them in a negative way [15]. Strong winds, heavy snowfall, and low visibility caused by ECS might delay or postpone events associated with the Winter Olympic Games [16,17,18]. Beijing, China will host the 24th Olympic and Paralympic Winter Games (BJ2022) from 4 to 20 February and from 4 to 13 March 2022, respectively (BJ2022 in the following). According to the weather and wind analysis report issued by the Beijing Organizing Committee of the Olympic Games, there are six weather patterns notably affecting the game schedule in total, four of which are closely related to ECSs [19]. Owing to the influence of the EAWM, the three competition zones of BJ2022 (Beijing, Yanqing and Zhangjiakou) are all vulnerable to the extreme cold.
Negative impacts on both the economy and public health from the ECSs indicate the importance of a forecast with a more advanced leading time, especially one which is longer than a week. An important aspect of a weather forecast is to explore the originating sources and influencing times of cold surges (CSs). Early in the 1950s, the pioneering research of Gu [20] and Tao [21] revealed three CS sources and their tracks affecting China. Ding and Krishnamurti [22] explored the three major tracks of the Siberian High, traversing China by investigating the heat budget of the High based on 19 strong cases over a five-year period. Zhu et al. [23] pointed out that the major CS sources could be tracked to the Barents Sea, the Kara Sea, and southern Iceland. The CSs from the first source have the strongest intensity and highest frequency.
The above results have already been used in operational weather forecasts in China on a mid-range timescale, since a tentative experience in 1956 [20]. Before numerical models were widely applied, the forecasting of ECSs in China was mostly subjective and was based mainly on synoptic patterns [24,25,26,27]. In the 21st century, and especially in recent decades, numerical weather prediction models have been the dominant approach for ECS forecasts and warnings [28,29,30,31]. However, an objective assessment of the forecasts of typical ECS cases indicates that they still present a huge challenge for forecasts with a leading time of more than a week [30,32,33]. These difficulties encourage us to look for the pre-signals of the ECSs that may occur in the BJ2022 competition zones and their maximal leading times of influence. Thus, in the following paper, we first introduce the basic features of the ECSs in the three competition zones of BJ2022 in Section 3, after a brief introduction to the dataset in Section 2. Composites of the circulations of ECS are shown in Section 4, and in Section 5 we trace the sources of ECSs before their occurrence. Our conclusions and a discussion can be found in Section 6.
2. Data and Method
Daily mean temperature data from 2513 weather stations from 1981–2019 were extracted from the Daily Meteorological Dataset of Basic Meteorological Elements of China National Surface Weather Stations (V3.0), which is issued by the China Meteorological Administration [34]. In this version, both the quality of the data and their and spatial resolution (number of stations) have been greatly improved. The dataset has been quality controlled and used in operational meteorological services and scientific studies in China. A total of 1871 stations with complete data for December–February between 1981 and 2019 were selected for this study, including three representative stations at the competition zones of BJ2022. The atmospheric circulation data were extracted from the NCEP/NCAR(National Centers for Environmental Prediction/National Center for Atmospheric Research) daily reanalysis project, including geopotential heights (GPHs) and air temperatures at various vertical levels from 1000 to 100 hPa, and wind fields at 850 hPa [35,36]. As the winter period crosses over from one year to another, it is referred to in the study as the year for February, e.g., winter 2019 means December 2018–February 2019. The period of climatology used for the anomaly is 1981–2010. An ECS (CS) event for a station (domain) is defined as a temperature drop exceeding the fifth (10th) percentile of all the daily temperature drops over two successive days [37].
3. Characteristics of ECSs at BJ2022 Competition Zones
The 24th Olympic and Paralympic Winter Games will take place in 2022 at three competition zones in the Beijing urban area, Yanqing and Zhangjiakou. In this paper, three meteorological stations in Chaoyang (in Beijing urban area, 39.95° N, 116.20° E, World Meteorological Organization station code #54513), Yanqing (40.45° N, 115.97° E, #54406) and Zhangjiakou (40.77° N, 114.92° E, #54401) were selected to represent the three zones, respectively. The geographical distribution of the three stations is outlined in Figure 1. All three stations are located in North China, which is situated in the EAWM region, where the surface temperatures are mainly controlled by a northwesterly wind in winter, and are especially affected by cold spells along the west and northwest paths from high latitudes [22,38]. North China is also one of the most frequent centers of CSs in China [39,40].

Figure 1.
The maximum, the fifth and 10th percentiles of temperature drops (unit: °C) for extreme cold surges (ECSs) (noted as 5%) and CS (10%) events at Chaoyang (abbreviated to “CY”), Yanqing (“YQ”) and Zhangjiakou (“ZJK”).
In China, the thresholds for cold air events of a certain type are unified for all stations in the whole country according to the current national standard. For example, a moderate or severe cold air process is defined by a decrease in the daily mean temperature of more than 6 °C or 8 °C in 48 h [41,42]. However, the extent of the temperature drop can be quite different during periods of cold air movement, owing to the individual latitude and topography. That is to say, the significant spatial differences between different regions should be taken into consideration when establishing a threshold. For the three competition zones, their altitudes vary from 36 m to 726 m. Thus, relative threshold temperature drops for CS and ECS for the three stations are adopted in this paper and are shown in Figure 1. The temperature drop is calculated as the temperature difference between the second day and the first day. For an ECS (CS) event, the value of the temperature drop is positive. ECSs are more extreme events than CSs. An ECS event for a station (domain) is defined as a temperature drop exceeding the fifth percentile of all the daily temperature drops over two successive days, while a CS event is defined as a temperature drop exceeding the 10th percentile. Therefore, the thresholds for ECS events are higher than those for CS events. The thresholds of ECS (CS) events are 5 °C (4.3 °C) at Yanqing, 5.8 °C (4.7 °C) at Zhangjiakou, and 4.8 °C (4.0 °C) at Chaoyang, respectively. Zhangjiakou has the highest threshold, owing to its mountainous climate, while Chaoyang has the lowest value, due to the urban effect. The maximum temperature drop records for Yanqing, Zhangjiakou and Chaoyang stations in the period 1981–2019 are 9.7 °C (22 February 1991), 12.9 °C (10 December 1990) and 9.4 °C (4 December 2008), respectively.
Figure 2 shows the spatial distribution of the ECS frequency at each station on all ECS-occurring days at each competition zone in the 39-year period. The distributions are quite similar in the three panels. High frequencies (20–29 times) are found in the middle and lower reaches of the Yellow River and its north part in each panel, and a frequency of over 30 times can be found in North China, particularly at the coordinates 110–120° E, 37.5–42.5° N (shown in Figure 2a by a dashed box). From Figure 2, it could also be presumed that the temperature drop extremes in this domain have a high consistency with the ECSs at the three zones. To verify this, the probabilities of the occurrence of ECS type, CS type and all other types of temperature drop events at the three competition stations, in terms of a fifth percentile temperature decrease in the domain, are provided (Figure 3). For all the ECS events in the representative domain of BJ2022, the probability of temperature drops (including ECS and CS types) observed in each station is 100%. This means that if an ECS event is identified in the representative domain of BJ2022, the temperature in each station must drop. For all ECS events occurring in this domain, the probability of ECS events in each station varies from 45% to 51%, and the probability of CS events varies from 66% to 77%, respectively. This result indicates that this domain represents each competition zone well and can overcome the topographical differences between the three zones. Therefore, in the following sections, the domain (110–120° E, 37.5–42.5° N) is considered as a whole for ECSs in the BJ2022 competition zones.
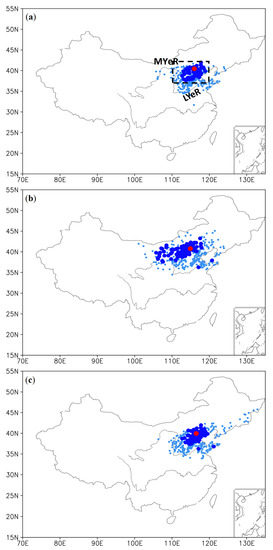
Figure 2.
Spatial distribution of the ECS frequency (unit: times) at each station on all ECS occurring days at each competition zone during winter in 1981–2019 for (a) Yanqing, (b) Zhangjiakou, (c) Chaoyang). The small light blue dots represent frequencies of 20–29 times and the big dark blue dots represent frequencies above 30 times. The red dots in (a–c) denote the positions of the three stations. (a) Middle reaches of the yellow river (“MYeR”) and lower reaches of the Yellow River (“LYeR”). The dashed box in (a) means the domain representing the three competition zones.
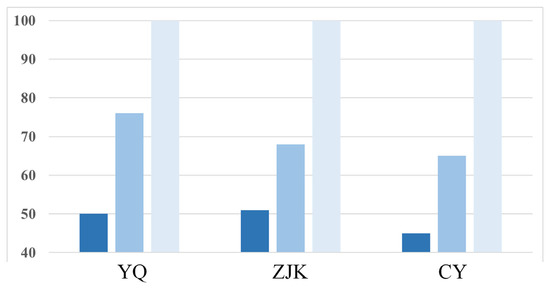
Figure 3.
Probabilities (unit: %) of occurrences for ECS type (dark blue), CS type (blue) and all temperature drop types (light blue) at each station in case of a temperature decrease below the fifth percentile threshold in the domain. (YQ: Yanqing, ZJK: Zhangjiakou, CY: Chaoyang).
To examine the primary features of temperatures and their drops over the representative domain of BJ2022, the frequency of ECSs, the mean winter temperature anomalies and the maximal temperature drop values are displayed together in Figure 4. The mean temperature in the domain shows a linear increasing trend in the 1980s and 1990s [43], which is then replaced by a clear interannual variability from the 2000s onwards. This is consistent with the variation in the global mean surface temperatures [44,45,46,47,48,49,50]. However, the occurrence of extreme temperature drops in this domain has not resulted in a similar variation in the temperature. In the past ten years, their frequency has not shown a decreasing trend. The variation in maximal temperature drops each winter also indicates that the extremity of the ECSs in recent decades has enhanced. This result is also consistent with the increasing cold extremes during the wintertime in the mid-latitude land regions of the Northern Hemisphere during the so-called hiatus period [47]. The highest frequency of ECSs occurring in the domain was five, which was observed in 2009. This was almost double the climatology, with a record-breaking drop of 8.8 °C on 22 January 2009. However, during this winter, the mean temperature was 0.9 °C above normal. From Figure 4, it can also be seen that, among the top ten greatest temperature drops during the 39 winters, six occurred after 2009. This means that, in spite of the recent warming trend of the mean temperature in the competition zones, the ECS events are more frequent and more extreme.
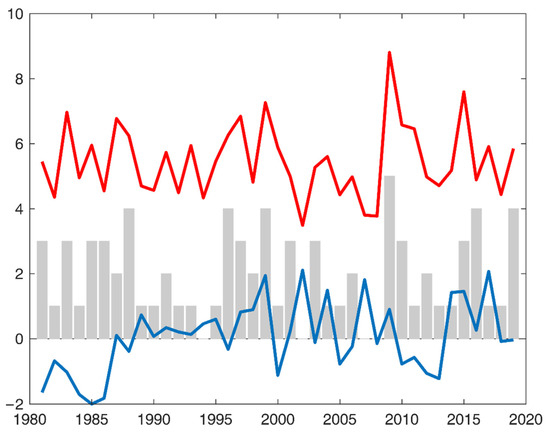
Figure 4.
Frequency of ECSs (bar, unit: times/winter), mean winter temperature anomalies (blue line, unit: °C) and maximal temperature drops (red line, unit: °C) over the representative domain of 24th Olympic and Paralympic Winter Games (BJ2022).
4. Dominant Circulation Patterns of the ECSs in the Competition Zones of BJ2022
Figure 5 shows the averaged 500 hPa GPH and the anomalies, 850 hPa air temperature anomalies and the horizontal wind anomalies on the occurring days of all ECSs. The circulation distribution displays a typical quasi “reverse-Ω” pattern, with two strong ridges located over the east of the Ural Mountain and the Okhotsk Sea, respectively. Between the two ridges, there is a broad deep trough in East Asian regions. As summarized by Zhu et al. [23], there are three circulation patterns favorable for ECSs invading China, among which the quasi “reverse-Ω” type can account for about 70%–80%. From Figure 5, the GPH anomaly center with maximum values exceeding 80 gpm is located in west Siberia, east of the Ural Mountain. The secondary positive anomaly center lies over the ocean east of Japan. The negative GPH anomaly center is situated in th eastern sector of East Asia, with minimum values less than −120 gpm. This pattern is accompanied by anticyclonic–cyclonic–anticyclonic wind anomalies at 850 hPa in the ridge–trough–ridge regions at 500 hPa. The notable gradient between the ridge over the Siberian region (or a much stronger Siberian High on the surface) and the East Asia trough causes much stronger northerly winds and causes sharp temperature decreases in the region. The competition zones of BJ2022 are in the strongest northerly wind anomaly center in the lower troposphere, and are also in the center of the negative temperature anomalies. On ECS-occurring days, the minimum temperature anomalies can reach −8 °C, as shown in Figure 5.
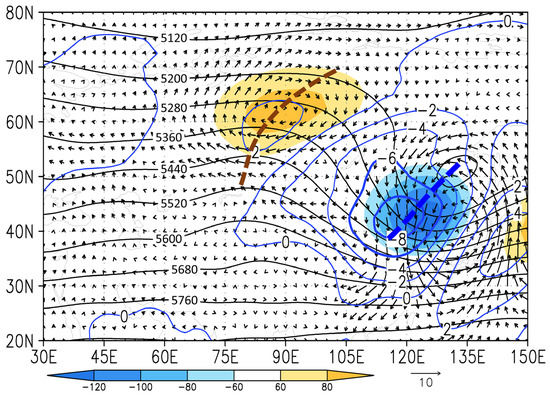
Figure 5.
Composites of the 500 hPa geopotential height (GPH) (black contours, unit: gpm) and its anomalies (shadings, unit: gpm), 850 hPa air temperature anomalies (blue contours, unit: °C) and horizontal wind anomalies (arrows, unit: m/s) on the occurring days of all ECSs in the domain. The thick brown and blue dashed lines mean the ridge and trough.
To demonstrate the vertical structural features of the general circulations causing ECS events within the competition domain, composites of the longitude–height profiles of all ECS-occurring days at 40 °N (central latitude of the domain), for both GPHs and air temperatures, are displayed in Figure 6. Here, normalization is adopted in order to eliminate the vertical differences in the variables. Distinct negative GPH values below −1 are found in East Asia between 115–130° E from 850 hPa to 300 hPa, with a center in the middle troposphere at 600–500 hPa (Figure 6a). This vertical distribution indicates that the deep trough over the domain plays an important role in the cold extremes, a factor which has been widely explored in previous studies [51,52,53,54].
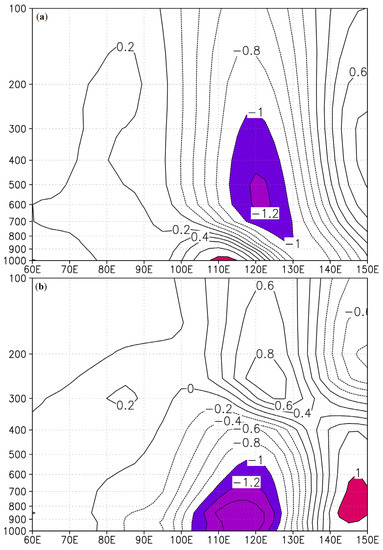
Figure 6.
Composites of the longitude–height profiles on all the ECS-occurring days at 40° N for normalized GPH (a) and temperature (b). Shading means values above one and below −1.
For air temperatures, negative values are found in a large region from northern China to Japan, between 80–135° E from the surface to the middle troposphere, while positive values are found in the upper troposphere (Figure 6b). In contrast to the GPHs, the negative center with a normalization below −1.4 is located in the lower troposphere between 1000 and 850 hPa. This distribution also indicates that the circulation causing a sharp temperature drop is a deep system that appears in the mid–low troposphere; however, the most significant signals exist at lower levels. Based on this distribution and the synoptic analysis of the operational weather forecast, in the following sections we focus on the 850 hPa temperatures and 500 hPa GPH.
5. Dominant Pre-Signals Causing the ECSs at BJ2022 Competition Zones
As mentioned above, there are three sources of the cold spells invading China, i.e., the Barents Sea, the Kara Sea, and southern Iceland. Most of the cold spells originate from these sources, propagate southeastward and enter East Asia through the Siberian region [23]. However, the invading times of these sources have not been provided in previous studies, and the results in Zhu et al. [23] focused on cold spells invading the whole of China. To identify the dominant source for the ECSs at the competition zones of BJ2022, composites of normalized temperatures at 850 hPa and the probabilities with normalizations below −1 at different leading times by all ECS cases are displayed in Figure 7. “LD0” in the first panel indicates the distribution on the ECS-occurring days, “LD2”, “LD4”, “LD6”, “LD8” and “LD10” in other panels indicate the composites at leading times of 2, 4, 6, 8 and 10 days, respectively.
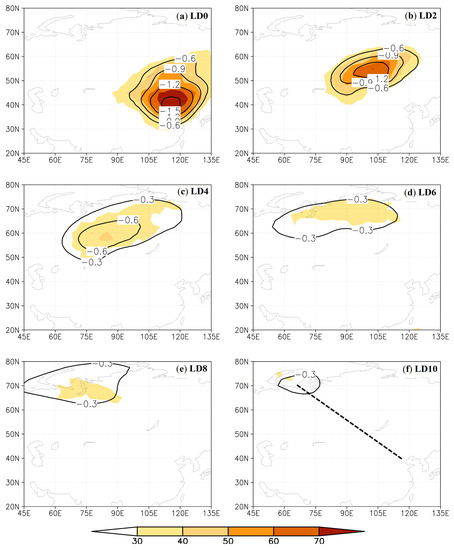
Figure 7.
Composites of the normalized temperatures (contours, only below −0.3 are shown) and probabilities of the normalization below −1 (shadings, only above 30% are shown, unit: %) at 850 hPa on all the ECS-occurring days; (a) 2 days (b), 4 days (c), 6 days (d), 8 days (e) and 10 days (f) prior to the occurrence at the competition zones of BJ2022. The dashed line in (f) denotes the cross-sectional path of the subsequent analysis in Figure 9.
On the ECS-occurring days (LD0), most of East Asia is affected by the strong cold air, and normalized temperatures below −0.6 come from from the south of Lake Baikal to 30° N, with more than a 50% probability of normalization below −1. The competition zones are in the negative center, with values below −1.5 and probabilities of more than 70%. This means that the occurrence of ECSs at the competition zones is accompanied by a large-scale temperature drop. Negative temperature centers are traced by a two-day interval from ten to two days prior to the ECS occurrence. On two days before the occurrence (LD2), both the negative temperature center and the maximal probability center appear in the west of Lake Baikal, nearly 1700 km north west of the competition zones. Compared to Figure 7a, both the intensity of the negative temperature center and the probability center are weakened, with a minimum of −1.2 and a maximum of 60%, respectively. The negative temperature center appears over the Ob river four days before the occurrence, which is more northwesterly than the center two days before (in Figure 7b). With this leading time, the composite normalized value is about −0.6. The maximum probability also decreases to 30%. Between six and eight days prior to ECS occurrence at the competition zones, a negative center with normalized values less than −0.3 still exists in the east of the Novaya Zemlya, and a probability above 30% is maintained. Despite the decreased intensity, the pre-signals can still be traced in a northwesterly direction, back to the ocean around the Novaya Zemlya, ten days prior to the ECS occurrence.
Consistent ECS sources and invading paths are clearly displayed in the composites of the 500 hPa GPH for all ECSs at the competition zones in Figure 8. The ECSs are directly caused by the strong northerly winds situating in the western area of the deep trough. Thus, compared to the negative air temperature center in Figure 7, the center in each panel in Figure 8 is positioned in a slightly more easterly direction. On the occurring day and two days before, the centers of negative GPH are maintained below −1.2, and more than 60% of probabilities have a normalization less than −1. Four days before the occurrence of the ECSs, the trough weakens with a minimal value of −0.6. An identical center of −0.3 could also be traced near the Novaya Zemlya ten days before the occurrence, which is the same as the 850 hPa air temperatures in Figure 7.
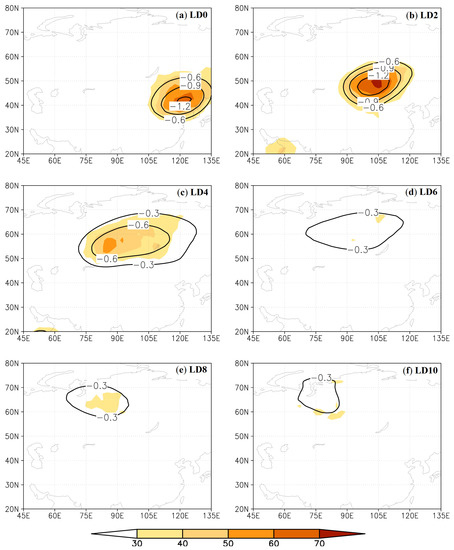
Figure 8.
As in Figure 7, but for 500 hPa GPH. (a) 2 days (b), 4 days (c), 6 days (d), 8 days (e) and 10 days (f) prior to the occurrence at the competition zones of BJ2022.
To obtain the longest potential advancing influences from the Novaya Zemlya, as revealed in Figure 7 and Figure 8, oblique Hovmoller diagrams of both the 500 hPa GPH and the 850 hPa air temperature anomalies along the invading track (the dashed line in Figure 7f) are given in Figure 9. To obtain a longer pre-signal for the ECS events, the leading time is extended to 19 days before the occurrences. From this figure, it can be clearly seen that both circulation anomalies propagate from the east of the Novaya Zemlya to the competition zones. The negative GPH anomalies below −40 gpm can be traced westward, back to 70°–80° E, 14 days before the ECS occurrences in the domain, and the anomalies below −100 gpm can be found 4 days before. The negative GPH anomalies were maintained over the east of the Novaya Zemlya from 14 to 8 days before the occurrence. This indicates that the cold air undergoes an accumulation process, and then moves in a southeasterly direction rapidly, with an abrupt outburst. The evolution of the GPH anomalies means that the trough or the low-pressure circulations originating over the Novaya Zemlya can be regarded as pre-signals of the ECSs in the competition zones. The temperature anomalies along the path show the same evolution, with negative values below −2 °C at 70°–80° E, 9 days before the occurrence. The negative center intensifies as it propagates toward East Asia. Three days before the ECS occurrence, the temperature anomalies decrease to −7 °C. However, the pre-signals of both GPH and air temperature weaken beyond ten days, with the temperature pre-signal weakening significantly.
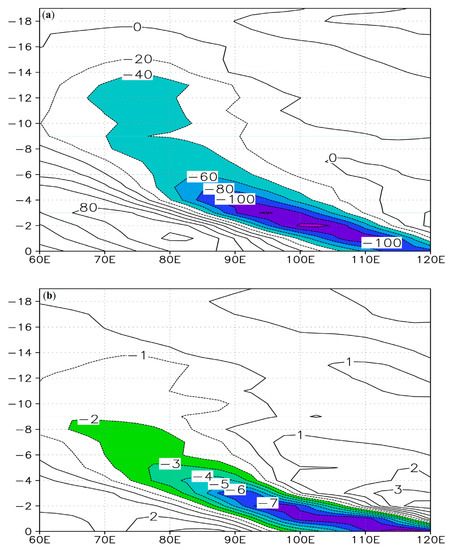
Figure 9.
Composites of the Hovmoller diagrams from the competition zones of BJ2022 to the Novaya Zemlya for (a) 500-hPa GPH anomalies (unit: gpm), (b) 850-hPa air temperature anomalies (unit: °C) by all ECS cases. The negative values on the y-axis represent the lead day prior to ECS occurrence. Th shading represents values below −40 gpm in (a) and below −2 °C in (b).
6. Discussion and Conclusions
ECSs are one of the most severe meteorological disasters that occur in the winter season. Due to the effects of the EAWM, North China is one of the most frequent ECS centers in China. In each year, the region suffers in many aspects, such as agriculture, transportation, electricity and public health. In 2022, the 24th Olympic and Paralympic Winter Games will take place at three competition zones in the Beijing urban area, Yanqing and Zhangjiakou, which are all located in North China and are vulnerable to ECSs. ECSs can even cause severe injury to the athletes during outdoor athletic training and competitions, and can delay or postpone matches. Therefore, it is quite necessary to explore the new characteristics of ECSs in the competition zones in recent years and to explore their possible influencing sources.
In this paper, we used the fifth percentile of all the daily temperature drops over two successive days as the threshold for an ECS event, instead of a unified value for all stations in the current operational standard. Considering the fact that both the geography and the thresholds of ECSs are different in the three zones, a representative competition domain of 37.5–42.5° N, 110–120° E is first adopted to avoid discrepancies. For all ECS events in the representative domain, the probability of temperature drops observed in each station is 100%, indicating that the temperature in each station will drop. For all the ECS events occurring in the domain, the probability of ECS and CS events in each station varies from 45% to 51% and from 66% to 77%, respectively. The probability of simultaneous ECS occurrences indicates the domain represents the three zones well. Since 2009, the ECSs in the domain have possessed a higher frequency and extremity, which is consistent with the increase in the cold extremes in the mid-latitude land regions of the Northern Hemisphere in recent decades [47]. Based on all ECS cases in the domain, the structure of both GPHs and air temperatures from 1000 to 100 hPa were diagnosed. The anomalous centers of the former and the latter are located at 600–500 hPa and 1000–850 hPa, respectively. The dominant circulation was revealed by a quasi “reverse-Ω” pattern, with two strong ridges over the east of the Ural Mountain and the Okhotsk Sea, and a broad deep trough in East Asia. The significant abnormal northerly winds in the west of the trough cause sharp temperature drops in the domain directly. By conducting a day-by-day backward composite analysis, the influencing source of the ECSs at the domain were traced to the Novaya Zemlya. An oblique latitude/longitude–time profile from the source to the domain was also used to clearly explore the pre-signals and the leading times. The results indicate that the trough and the low temperature over the source could have a leading influence that exceeds ten days, with a slow accumulation in the first stage and a rapid outburst in the second stage.
A number of forecast methods have been developed and applied to identify extreme weather events at various world forecast centers [55,56,57,58]. Owing to the difficulty in detecting influencing circulations at high latitudes, the development of a forecast one week before an ECS occurrence is still a global challenge [59]. This has been proved by objective verification results for typical ECS cases [32,60]. However, a highly accurate forecast with this leading time is still urgently needed, especially for the outdoor Winter Olympic Games [19,61]. In recent years, low-frequency synoptic signals at high latitudes have been tested in an extended range forecast of temperatures [62,63]. For the forecast of extreme events, a combined dynamical–statistical approach is considered to be a possible method [57]. The aim of this paper is to reveal the dominant circulation patterns and the possible pre-signals of ECSs. A future study will examine a combination of these pre-signals and dynamical model outputs in order to establish a method for the extended-range forecast of ECSs at longer leading times.
Author Contributions
Conceptualization, H.G. and T.D.; methodology, H.G.; software, H.G. and T.D.; formal analysis, H.G. and T.D.; investigation, H.G., T.D. and Y.Y.; resources, H.G.; data curation, Y.Y. and T.D.; writing—original draft preparation, H.G. and T.D.; writing—review and editing, H.G. and T.D.; visualization, H.G., T.D. and Y.Y.; supervision, H.G. All authors have read and agreed to the published version of the manuscript.
Funding
This research was funded by the National Key R&D Program of China (Grant number 2018YFC1505603).
Acknowledgments
The authors are grateful to NCEP/NCAR for providing reanalysis data.
Conflicts of Interest
The authors declare no conflict of interest.
References
- Cohen, J.L.; Furtado, J.C.; Barlow, M.A.; Alexeev, V.A.; Cherry, J.E. Arctic warming, increasing snow cover and widespread boreal winter cooling. Environ. Res. Lett. 2012, 7, 014007. [Google Scholar] [CrossRef]
- Liu, J.; Curry, J.A.; Wang, H.; Song, M.; Horton, R.M. Impact of declining Arctic sea ice on winter snowfall. Proc. Natl Acad. Sci. USA 2012, 109, 4074–4079. [Google Scholar] [CrossRef] [PubMed]
- Tang, Q.; Zhang, X.; Yang, X.; Francis, J.A. Cold winter extremes in northern continents linked to Arctic sea ice loss. Environ. Res. Lett. 2013, 8, 014036. [Google Scholar] [CrossRef]
- Mori, M.; Watanabe, M.; Shiogama, H. Robust Arctic sea-ice influence on the frequent Eurasian cold winters in past decades. Nat. Geosci. 2014, 7, 869–873. [Google Scholar] [CrossRef]
- Ma, S.M.; Zhu, C.W.; Liu, B.Q.; Zhou, T.J.; Ding, Y.H.; Orsolini, Y.J. Polarized response of East Asian winter temperature extremes in the era of Arctic warming. J. Clim. 2018, 31, 5543–5557. [Google Scholar] [CrossRef]
- Tian, B.; Fan, K.; Yang, H. East Asian winter monsoon forecasting schemes based on the NCEP’s climate forecast system. Clim. Dyn. 2018, 51, 2793–2805. [Google Scholar] [CrossRef]
- Dai, H.X.; Fan, K.; Liu, J.P. Month-to-month variability of winter temperature over Northeast China linked to sea ice over the Davis Strait-Baffin Bay and the Barents-Kara Sea. J. Clim. 2019, 32, 6365–6384. [Google Scholar] [CrossRef]
- Ma, S.M.; Zhu, C.W. Extreme cold wave over East Asia in January 2016: A possible response to the larger internal atmospheric variability induced by Arctic warming. J. Clim. 2019, 32, 1203–1216. [Google Scholar] [CrossRef]
- Cohen, J.; Zhang, X.; Francis, J.; Francis, J.; Jung, T.; Kwok, R.; Overland, J.; Ballinger, T.J.; Bhatt, U.S.; Chen, H.W.; et al. Divergent consensuses on Arctic amplification influence on midlatitude severe winter weather. Nat. Clim. Chang. 2020, 10, 20–29. [Google Scholar] [CrossRef]
- Liu, N.J.; Li, Q.; Ma, Y.L. Analysis of natural disasters in the first quarter of 2016. Disaster Reduct. China 2016, 9, 60–63. [Google Scholar]
- Sun, Y.; Hu, T.; Zhang, X.; Wan, H.; Stott, P.; Lu, C. Anthropogenic Influence on the Eastern China 2016 Super Cold Surge. Bull. Am. Meteorol. Soc. 2018, 99, S123–S127. [Google Scholar] [CrossRef]
- Liu, N.J.; Zhang, D.; Wang, Y. Major natural disasters in China in 2018. Disaster Reduct. China 2019, 5, 18–23. [Google Scholar]
- Monthly Climate Impact Assessment Report in China. Available online: https://cmdp.ncc-cma.net/influ/moni_china.php (accessed on 14 March 2020).
- Castellani, J.W.; Young, A.J. Health and performance challenges during sports training and competition in cold weather. Br. J. Sports Med. 2012, 46, 788–791. [Google Scholar] [CrossRef] [PubMed]
- Matzarakis, A.; Frohlich, D.; Bermon, S.; Adami, P.E. Visualization of climate factors for sports events and activities-The Tokyo 2020 Olympic Games. Atmosphere 2019, 10, 572. [Google Scholar] [CrossRef]
- Horel, J.; Potter, T.; Dunn, L.; Steenburgh, W.J.; Eubank, M.; Splitt, M.; Onton, D.J. 2002: Weather support for the 2002 winter Olympic and Paralympic Games. Bull. Am. Meteorol. Soc. 2002, 83, 227–240. [Google Scholar] [CrossRef]
- Kiktev, D.; Joe, P.; Isaac, G.A.; Montani, A.; Frogner, I.L.; Nurmi, P.; Bica, B.; Milbrandt, J.; Tsyrulnikov, M.; Astakhova, E.; et al. FROST-2014: The Sochi winter Olympics international project. Bull. Am. Meteorol. Soc. 2017, 98, 1908–1929. [Google Scholar]
- Lee, Y.; Lee, G.; Joo, S.; Ahn, K.D. Observational study of surface wind along a sloping surface over mountainous terrain during winter. Adv. Atmos. Sci. 2018, 35, 276–284. [Google Scholar] [CrossRef]
- Wang, J.; Yu, C.W. Beijing 2022 Weather Report; China Meteorology Press: Beijing, China, 2019. [Google Scholar]
- Gu, Z.C. A preliminary study on the mid-range forecast of cold wave in autumn and winter in China. Acta. Meteorol. Sin. 1956, 2, 127–134. [Google Scholar]
- Tao, S.Y. Study on East Asian cold waves in China during recent 10 years (1949-1959). Acta. Meteorol. Sin. 1959, 30, 226–230. [Google Scholar]
- Ding, Y.H.; Krishnamurti, T.N. Heat budget of the Siberian high and the winter monsoon. Mon. Weather Rev. 1987, 115, 2428–2449. [Google Scholar] [CrossRef]
- Zhu, Q.G.; Lin, J.R.; Shou, S.W.; Tang, D.S. Principles and Methods of Meteorology; China Meteorology Press: Beijing, China, 2010. [Google Scholar]
- Yu, H.S.; Li, X.D. Spectral classification and prediction of cold wave. Meteorol. Mon. 1985, 2, 11–13. [Google Scholar]
- Xu, G.H. Method of Cold wave mid-range forecast. Meteorol. Mon. 1985, 2, 6–10. [Google Scholar]
- Yu, H.S.; Li, X.D.; Zhang, F.F.; Chen, S.M. The mid-range synoptic statistical characteristics and forecast model of cold wave. Meteorol. Mon. 1987, 10, 33–36. [Google Scholar]
- Li, K.L. A new mid- and long-range cold wave forecast with similar parameter and 500 hPa pentad grid data. Meteorol. Mon. 1996, 3, 40–42. [Google Scholar]
- Lu, F.C.; Juang, H.M.H.; Liao, C.C. A numerical case study of the passage of a cold surge across Taiwan. Meteorol. Atmos. Phys. 2007, 95, 27–52. [Google Scholar] [CrossRef]
- Di Liberto, T.; Colle, B.A.; Georgas, N.; Blumberg, A.F.; Taylor, A.A. Verification of a multimodel storm surge ensemble around New York city and Long Island for the cool season. Weather Forecast. 2011, 26, 922–939. [Google Scholar] [CrossRef]
- Qi, L.; Ma, Q.; Zhang, W.J. Verification of forecasting capability of cold wave process in the winter of 2011/2012 with GRAPES. Trans. Atmos. Sci. 2017, 40, 791–802. [Google Scholar]
- Benjamin, S.G.; Brown, J.M.; Brunet, G.; Lynch, P.; Saito, K.; Schlatter, T.W. 100 years of progress in forecasting and NWP applications. Meteorol. Monogr. 2018, 59, 1–67. [Google Scholar] [CrossRef]
- Tao, Y.W.; Dai, K.; Dong, Q. Extreme analysis and ensemble prediction verification on cold wave process in January 2016. Meteorol. Mon. 2017, 43, 1176–1185. [Google Scholar]
- Wei, Z.G.; Zhu, X.; Dong, W.J.; Liu, Y.J.; Chen, G.Y.; Liu, Y.J. Evaluation on forecasts of a cold wave in China and its Eurasian cold air activity by CFSv2 system in November 2015. Plateau Meteorol. 2019, 38, 673–684. [Google Scholar]
- Ren, Z.H.; Yu, Y.; Zou, F.L.; Xu, Y. Quality detection of surface historical basic meteorological data. J. Appl. Meteorol. Sci. 2012, 23, 739–747. [Google Scholar]
- Kalnay, E.; Kanamitsu, M.; Kistler, R.; Collins, W.; Deaven, D.; Gandin, L.; Joseph, D. The NCEP/NCAR 40-year reanalysis project. Bull. Am. Meteorol. Soc. 1996, 77, 437–471. [Google Scholar] [CrossRef]
- Kistler, R.; Kalnay, E.; Collins, W.; Saha, S.; White, G.; Woollen, J.; Chelliah, M.; Ebisuzaki, W.; Kanamitsu, M.; Kousky, V.; et al. The NCEP-NCAR 50-year reanalysis: Monthly means CD-ROM and documentation. Bull. Am. Meteorol. Soc. 2001, 82, 247–268. [Google Scholar] [CrossRef]
- Wang, Z.Y.; Zou, X.K.; Gao, R. Monitoring Indices of Low Temperature Extremes and Temperature Drop Extremes. 2017. Available online: http://std.samr.gov.cn/gb/search/gbDetailed?id=71F772D81DE5D3A7E05397BE0A0AB82A (accessed on 25 January 2020).
- Wang, Z.M. Tracks and Characteristics Analysis of Strong Cold Air Invading Northern China during Winter Half Year. Ph.D. Thesis, Nanjing University of Information Science & Technology, Nanjing, China, 2018. [Google Scholar]
- Ma, S.Q.; Li, F.; Wang, Q.; Yang, K.M.; Sun, Z.F.; Wang, X.W. Cold Surge and Frost; China Meteorology Press: Beijing, China, 2009. [Google Scholar]
- Ding, Y.H. Climate in China; Science Press: Beijing, China, 2013. [Google Scholar]
- Wang, Z.Y.; Si, D.; Duan, L.Y. Monitoring Indices of Cold Air Processes. 2017. Available online: http://hbba.sacinfo.org.cn/stdDetail/df0f5ef16f2dd5f69ee048674ceda3cb (accessed on 25 January 2020).
- Wei, R.Q.; Zong, Z.P.; Tang, Y. Grade of Cold Wave; 2017. Available online: http://std.samr.gov.cn/gb/search/gbDetailed?id=71F772D81F9BD3A7E05397BE0A0AB82A (accessed on 25 January 2020).
- Wang, J.; Jiang, D.K.; Zhang, Y.J. Analysis on spatial and temporal variation of extreme climate events in North China. Chin. J. Agrometeorol. 2012, 33, 166–173. [Google Scholar]
- Hartmann, D.L.; Tank, A.M.K.; Rusticucci, M.; Alexander, L.V.; Brönnimann, S.; Charabi, Y.A.R.; Dentener, F.J.; Dlugokencky, E.J.; Easterling, D.R.; Kaplan, A.; et al. 2013: Observations: Atmosphere and Surface. In Climate Change 2013: The Physical Science Basis; Contribution of Working Group I to the Fifth Assessment Report of the Intergovernmental Panel on Climate Change; Stocker, T.F., Qin, D., Plattner, G.-K., Tignor, M., Allen, S.K., Boschung, J., Nauels, A., Xia, Y., Bex, V., Midgley, P.M., Eds.; Cambridge University Press: Cambridge, UK; New York, NY, USA, 2013. [Google Scholar]
- Trenberth, K.; Fasullo, J.; Branstator, G.; Phillips, A.S. Seasonal aspects of the recent pause in surface warming. Nat. Clim. Chang. 2014, 4, 911–916. [Google Scholar] [CrossRef]
- Fyfe, J.; Meehl, G.; England, M.; Mann, M.E.; Santer, B.D.; Flato, G.M.; Hawkins, E.; Gillett, N.P.; Xie, S.P.; Kosaka, Y.; et al. Making sense of the early-2000s warming slowdown. Nat. Clim. Chang. 2016, 6, 224–228. [Google Scholar] [CrossRef]
- Johnson, N.C.; Xie, S.P.; Kosaka, Y.; Li, X.C. Increasing occurrence of cold and warm extremes during the recent global warming slowdown. Nat. Commun. 2018, 9, 1724. [Google Scholar] [CrossRef]
- Gong, H.N.; Wang, L.; Chen, W. Multidecadal Changes in the Influence of the Arctic Oscillation on the East Asian Surface Air Temperature in Boreal Winter. Atmosphere 2019, 10, 757. [Google Scholar] [CrossRef]
- Hu, X.M.; Sejas, S.A.; Cai, M.; Taylor, P.C.; Deng, Y.; Yang, S. Decadal evolution of the surface energy budget during the fast warming and global warming hiatus periods in the ERA-interim. Clim. Dyn. 2019, 52, 2005–2016. [Google Scholar] [CrossRef]
- Wang, L.; Deng, A.Y.; Huang, R.H. Wintertime internal climate variability over Eurasia in the CESM large ensemble. Clim. Dyn. 2019, 52, 6735–6748. [Google Scholar] [CrossRef]
- Wang, L.; Chen, W. An Intensity Index for the East Asian Winter Monsoon. J. Clim. 2014, 27, 2361–2374. [Google Scholar] [CrossRef]
- Hao, X.; Li, F.; Sun, J.Q. Assessment of the response of the East Asian winter monsoon to ENSO-like SSTAs in three USCLIVAR Project models. Int. J. Climatol. 2016, 36, 847–866. [Google Scholar] [CrossRef]
- Wu, S.; Sun, J.Q. Variability in zonal location of winter East Asian jet stream. Int. J. Climatol. 2017, 37, 3753–3766. [Google Scholar] [CrossRef]
- Yu, S.; Sun, J.Q. Potential factors modulating ENSO’s influences on the East Asian trough in boreal winter. Int. J. Climatol. 2020. [Google Scholar] [CrossRef]
- Zsótér, E. Recent developments in extreme weather forecasting. ECMWF Newsl. 2006, 107, 8–17. [Google Scholar]
- Zhu, Y.J.; Cui, B. NAEFS mean, spread and probability forecasts. NOAA/NCEP Rep. 2007, 4. [Google Scholar]
- Gao, L.; Chen, J.; Zheng, J.W.; Chen, Q.L. Progress in researches on ensemble forecasting of extreme weather based on numerical models. Adv. Earth Sci. 2019, 34, 706–716. [Google Scholar]
- Lalaurette, F. Early detection of abnormal weather conditions using a probabilistic extreme forecast index. Q. J. Roy. Meteorol. Soc. 2003, 129, 3037–3057. [Google Scholar] [CrossRef]
- Jana, S.; Thordis, T.; Noel, K.; Nathalie, S.; Lisa, V.A.; Gabriele, H.; Sonia, I.S.; Robert, V.; Zhang, X.B.; Francis, W.Z. Understanding, modeling and predicting weather and climate extremes: Challenges and opportunities. Weather Clim. Extrem. 2017, 18, 65–74. [Google Scholar]
- Guan, H.; Zhu, Y. Development of Verification Methodology for Extreme Weather Forecasts. Weather Forecast. 2017, 32, 479–491. [Google Scholar] [CrossRef]
- Vasil’ev, E.V.; Dmitrieva, T.G. Forecasting extreme weather phenomena and processes during the test events and Sochi-2014 Olympic and Paralympic Games. Russ. Meteorol. Hydrol. 2015, 40, 513–522. [Google Scholar] [CrossRef]
- Chen, G.J.; Wei, F.Y.; Yao, W.Q.; Zhou, X. Extended range forecast experiments of persistent winter low temperature indexes based on intra-seasonal oscillation over southern China. Acta Meteorol. Sin. 2017, 75, 400–414. [Google Scholar]
- Yang, Q.M. A study of the extended-range forecast for the low frequency temperature and high temperature weather over the lower reaches of Yangtze River Valley in summer. Adv. Earth Sci. 2018, 33, 385–395. [Google Scholar]
© 2020 by the authors. Licensee MDPI, Basel, Switzerland. This article is an open access article distributed under the terms and conditions of the Creative Commons Attribution (CC BY) license (http://creativecommons.org/licenses/by/4.0/).