Abstract
Through an empirical investigation of the historical relationship between the destination climate and tourist arrivals in the Caribbean, this study presents the first revealed preference evaluation of a climate index informed by tourists’ stated climatic preferences for coastal-beach tourism (i.e., a sun-sand-surf or 3S travel market). The goal of this multi-organization collaboration was to examine the potential application of a newly designed climate index—the Holiday Climate Index (HCI):Beach—for three Caribbean destinations (Antigua and Barbuda, Barbados, Saint Lucia). This paper provides an overview of the evolution of climate indices, including the development of the (HCI):Beach. To test the validity of climate indices for a beach travel market, daily climate ratings based on outputs from the Tourism Climate Index and the HCI were correlated with monthly arrivals data from Canada (a key source market) at an island destination scale. The results underscore the strength of the new index, with each destination scoring consistently higher using the HCI:Beach, including a stronger relationship (R2) between index scores and tourist arrivals. These findings demonstrate the value of combining stated and revealed preference methodologies to predict tourism demand and highlight opportunities for future research.
1. Introduction
Considered one of the most tourism dependent regions in the world, the Caribbean attracts over 26 million international land-based arrivals per year (2% of the global market) [1], which contributes over $57 billion (or 15%) to the region’s GDP and employs over 2.4 million people [2]. A major tourism resource, and one of the primary reasons visitors choose the Caribbean for their holidays, is the tropical climate [3,4,5]. Caribbean air temperatures range from 25–33 °C, sea temperatures from 26–30 °C, with a dry sunny season from December through April (i.e., peak tourism season) [6]. The regional climate is projected to change, with the Caribbean anticipated to be among the first and worst to be impacted by climate change [6,7], threatening the “very product” of Caribbean tourism [8]. Despite increasing sectoral awareness of the vulnerability of tourism to climate change [9,10], the impacts faced by the tourism sector at the regional and destination country scale remain uncertain [11], with the Caribbean islands among the least understood [12]. Tourism stakeholders, including the Caribbean Tourism Organization (CTO) and the Caribbean Hotel and Tourism Association (CHTA), are prioritizing new ways to utilize increasingly available climate information to inform decision-making that minimizes climatic risk and maximizes opportunities and operational efficiencies [13]. Concurrently, regional climate service providers, such as the World Meteorological Organization (WMO)-designated Regional Climate Center (RCC) hosted by the Caribbean Institute for Meteorology and Hydrology (CIMH), are responding to sectoral demand through support of the design and application of climate-smart products and services [14,15] as part of the RCC’s region-wide implementation of the Global Framework for Climate Services [16,17]. The region’s sole tourism-specific climate information product, the quarterly Caribbean Tourism Climatic Bulletin, has been operationally coproduced since 2017 by the CTO, the CHTA, and the CIMH and offers qualitative consensus-based expert statements of potential tourism impacts up to three months in advance based on a review of monitoring and forecast products [18]. However, the application of integrated quantitative approaches, particularly the development of tailored spatially and temporally explicit climate information products, which are valuable tools that can aid public and private sector tourism decision makers [19], are needed in the Caribbean. The CTO, in association with the CIMH, engaged an interdisciplinary international research team, with the goal of examining the potential application of a newly designed climate index for coastal tourism in the Caribbean region.
The relationship between climate and tourism demand has long been discussed in the tourism literature [20,21,22,23], including the direct impact of climate change, which is projected to alter the length and quality of tourism seasons in the Caribbean, raising the question as to whether the region will become ‘too hot’ for tourism [4,24]. Tourism climate indices, which serve to characterize the holistic suitability of a destination’s climate for tourism, have been widely applied to compare the climate resources among destinations and project the potential impact of changing climate resources at various geographical scales (destination, continental, global) (see [25] for a comprehensive overview). Despite the prevalence and advancements of climate indices as a tool for evaluating climatic resources for tourism, limited research compares index ratings with observed visitation patterns at the destination scale. Multiple calls have been made in the literature to test the validity of indices with tourists and other tourism industry performance indicators [24,25,26,27].
Through an empirical investigation of the historical relationship between destination climate and tourist arrivals in the Caribbean, this study presents the first revealed preference evaluation of climate index informed by tourists’ stated climatic preferences for coastal-beach tourism (i.e., a sun-sand-surf or 3S travel market). To test the validity of climate indices for this travel market, monthly arrivals data at the Caribbean island destination scale were combined with daily climate ratings based on the outputs from two well-cited tourism climate indices: The Tourism Climate Index (TCI) [28] and the Holiday Climate Index (HCI) [25]. An overview of the evolution of climate indices for the tourism sector is provided, followed by an outline of the development of the HCI:Beach index. Utilizing the multi-national tourist climate preference survey data that is available in the literature, the differential specification of the HCI:Beach from HCI:Urban is defined. Daily ratings for the TCI and HCI:Beach are calculated for three Caribbean 3S destinations (Antigua and Barbuda, Barbados, Saint Lucia) and correlated with monthly arrivals data from January 2008 to December 2017. The findings are discussed in the context of previous index-based analyses, underscoring the need for tools and techniques that can efficiently and effectively translate weather/climate products into salient information for sectoral decision-making. Importantly, this research will underscore the strength of the new HCI:Beach and the value of combining stated and revealed preference methodologies to predict tourism demand.
2. Evolution of Climate Indices for Tourism
Tourism climate indices aim to reflect the influence of annual climate distributions at a given location, showing periods of peak climatic conditions as desired by tourists. Mieczkowski [28] developed the Tourism Climate Index (TCI), which was the first composite index to evaluate the suitability of climate for tourism activities and has subsequently become the most widely applied (see [25] for a comprehensive overview). The Mieczkowski index equation is given as TCI = 2 × (4CID + CIA + 2P +2S + W), where CID is the daytime comfort index (rating score from −6 to 10 based on a combination of the maximum daily temperature and minimum daily relative humidity); CIA is the daily comfort index (rating score from −6 to 10 based on a combination of the mean daily temperature and mean daily relative humidity); P is the precipitation (rating score from 0 to 10 based on mm of rain), and S is the sunshine (rating score from 0 to 10 based on hours of sunshine) and W is the wind (rating score from 0 to 10 based on m/s wind speeds). The weights (multipliers) included in the equation were subjectively determined and are not based on either tourist-stated climate preferences or tourism data (revealed preference). This equation was established for general sightseeing and not for specific tourism segments (e.g., beach/coastal tourism). Mieczkowski’s seminal paper showed the January global TCI map and the distribution of index ratings, with areas within 10 and 30 degrees north of the equator classified as excellent to very good/good and areas outside these boundaries shifting from acceptable to unfavorable with increasing latitude. Similar TCI rating maps were provided for all seasons. Subsequent studies have revealed several theoretical weaknesses of the TCI as an indicator of climate suitability for tourism, including its inappropriate application for the specific climatic conditions required by beach/coastal tourism [24,29,30,31]. A central weakness of the TCI is the subjective rating and weighting scheme based on Mieczkowski’s expert opinion. For example, the overemphasis on thermal comfort (50% of the index weight; 40% CID and 10% CIA) does not align with stated preference studies that have found precipitation to be of equal importance, particularly for a beach holiday [24,29,30,32]. The temperatures defined in the TCI as optimal for tourism also do not reflect the stated preferences of beach tourists [24,30,31].
Concurrent to the development and application of the TCI, there has been a growing body of research in applied climatology and biometeorology journals, with over 2000 climate indices documented [33]. However, much like Meizkowski’s TCI, there is a heavy focus on thermal comfort. For example, the physiological equivalent temperature (PET) is arguably one of most popular indices (and widely applied in tourism studies), capturing a combination of daily air temperature, relative humidity, wind velocity, mean cloud cover, and other variables [34,35,36]. Other indices include Air Equivalent-Effective Temperature (EET—air temperature, relative humidity and wind velocity) and Air Radiation Equivalent-Effective Temperature (REET—combination of air temperature, relative humidity, wind velocity, and solar radiation intensity). However, these bioclimatic indices do not reflect the specific needs and preferences of travelers, with tourists’ preferences in specific markets like beach tourism found to be up to 18 °C warmer than the conventional bioclimatic indices [31,32]. Moreover, climate indices (TCI, PET, EET, REET), as currently used, do not consider factors that affect destination choice, such as (real and perceived) risks associated with the region’s record of extreme conditions (e.g., tropical storms, heavy rain, or wind), nor do they account for consideration of localized adaptations that may change the climate resource and alter visitor comfort levels (e.g., higher air temperatures can be off-set by air-conditioning, building design, landscaping designed to create shade, increased availability of misters, and water-based recreational opportunities) [4].
Indices designed for the specific climatic conditions required by beach/coastal tourism have emerged subsequent to the TCI, including the Beach Climate Index (BCI) [37] and Modified Climate Index for Tourism (MCIT) [38], which modified the original TCI, and the Mean Historical Climate Index for Cuba [39]. Regrettably, these indices have not made use of the growing literature on beach tourists’ preferences to develop the variable rating scales and relative weighting of climatic variables, and have done limited to no empirical testing (e.g., based on single survey samples at best). The exception is the Holiday Climate Index (HCI) [25], which was objectively designed to be specified for major tourism segments and destination types, incorporating all three facets of climate important to leisure tourism activities (as defined by [40]): Thermal comfort (TC), which is a combination of the maximum temperature (°C) and mean relative humidity (%); aesthetic (A) (cloud cover %); and physical (P), which is a combination of the precipitation (mm) and windspeed (km/h). Each climatic variable in the HCI is rated on a scale from 0 to 10, with an overall HCI index score of 0 (potentially dangerous for tourists, e.g., extreme heat/cold stress, very high winds or precipitation) to 100 (ideal for tourism). Unlike other indices, an ideal rating in the HCI requires that all three facets (TC, A, P) are within the range of conditions most preferred by the majority of tourists on a beach holiday, with excellent and very good categories signifying that some facets are within the range of conditions ranked highest by the majority of tourists, and scores less than 40 representative of conditions deemed unacceptable for a beach holiday by the majority of tourists.
3. Design of the HCI:Beach
The HCI:Urban specification [25] was modified using the decade of research on coastal tourists’ stated climatic preferences (Table 1) to design HCI:Beach, which is represented using the following equation: HCI:Beach = 2(TC) + 4(A) + (3(P) + W).

Table 1.
Daily climatic optimal and unacceptable threshold conditions for beach tourism.
Both the TCI and HCI utilize an additive approach, whereby each of the sub-indices is weighted to represent the proportional contribution of each climatic variable, with variable weights established by expert judgement (TCI) or tourists’ stated preferences (HCI:Urban and HCI:Beach). As shown in Table 2, the key difference between urban and beach tourists is that the majority of beach tourists surveyed in the Caribbean state cloud cover to be the most important climatic resource (40% weighting), with thermal comfort ranked third (20%) [24]. It is also important to note that in Mieczkowski’s original index [28], the daytime comfort index was weighted as 40% of the index and evening comfort was weighted as 10% of the index. Given that beach tourism is predominately a daytime activity, with air conditioning almost universal in tourist accommodation in the 30 years since the TCI was developed, evening comfort is not included as a separate weighted component in the HCI:Beach.
Table 2.
Comparison of the sub-index weights by climate index.
When comparing the thermal comfort rating of the TCI, HCI:Urban, and HCI:Beach (Table 3), the greatest differences occur at higher temperatures, with beach tourists preferring warmer conditions. For example, at 30 °C, the HCI:Beach rating is 10 versus a rating of 6 and 7 with the TCI and HCI:Urban, respectively. For the aesthetic facet, the TCI uses the number of sunshine hours in a day versus the HCI, which uses the percentage of cloud cover due to the absence of sunshine data from many meteorological stations.
Table 3.
Comparison of the thermal comfort rating schemes.
The rating scheme developed for the HCI:Beach aesthetic facet assigns the highest score to days with 15% to 25% cloud cover versus the TCI, which assigns the highest score for days with clear skies (i.e., 0% cloud cover) (Table 4). The key difference between HCI:Beach and HCI:Urban is that beach tourists prefer slightly more cloud cover, with slightly higher rankings assigned accordingly. For the lowest rating of the aesthetic facet, the TCI assigns a score of 0 to daily sunshine hours (i.e., 100% cloud cover), whereas the survey results demonstrate that tourists are accepting of all cloud cover conditions, including 100% cloud cover, and therefore there is no score of 0 on the HCI:Urban or HCI:Beach aesthetic scale.
Table 4.
Comparison of the aesthetic facet rating schemes.
In terms of precipitation, there are significant differences between the TCI and HCI (Table 5). For example, the HCI assigns a higher score under all amounts of rain greater than 0.5mm, such that daily precipitation less than 3mm is scored a 9 in the HCI versus a rating of 5 to 9 with the TCI. Another key difference is that when daily rain is greater than 25 mm, a penalty function is triggered (assigning a rating of −1) to signal the overriding effect rain has on tourism demand, as shown in revealed preference studies of beach tourists [41,42,43,44,45]. In terms of the HCI:Beach versus HCI:Urban, both are similar, with the exception of the ratings for moderate precipitation amounts (6–11 mm), with beach tourists more resilient to rain versus tourists on an urban holiday. Rutty and Scott [4] hypothesize that this resilience is likely due to the predictable and cooling effect of late-afternoon showers in the tropical locations where most coastal tourism surveys have been conducted. Additional surveys in other prominent beach destinations that do not have this regular microclimate feature remains a need for future research.
Table 5.
Comparison of the physical facet of precipitation rating schemes.
For wind, the TCI has four different rating schemes for wind (normal, trade wind, hot climate, wind chill), each with a unique rating based on daily maximum temperatures. Given that the purpose of this study is to assess beach tourism, the wind chill is excluded in the comparison to HCI (Table 6). Since temperature (thermal comfort) and aesthetics are already accounted for in the other sub-indices, HCI:Urban and HCI:Beach include only one rating scheme with eight wind speed categories but slightly different wind speed scores.
Table 6.
Comparison of the physical facet of wind rating schemes.
4. Methods
Since the onset of mass tourism in the mid-20th century, the Caribbean has been a popular holiday destination and is now considered one of the most economically tourism-dependent regions in the world [2]. Although Caribbean islands offer a variety of natural and cultural tourism attractions, the 3S tourism product has dominated for decades [3,5]. The Caribbean has therefore been a focus of several tourist climate preference studies [24,31,46,47,48] and was selected for the first application of the HCI:Beach because of its continuing importance as a global beach destination.
Climate data for the period of January 2008 to December 2017 was made available through the Caribbean Institute for Meteorology and Hydrology (CIMH). Destination observations were provided at the daily level and included temperature, rainfall, relative humidity, windspeed, and cloud cover. However, due to data limitations, specifically a lack of windspeed and cloud cover data, only Antigua and Barbuda, Barbados, and Saint Lucia were included in this study, which represents approximately 5% (1.3 million) of the regional tourism arrivals. The distribution of annual temperatures is highly consistent across the Caribbean region as a whole (e.g., annual temperatures range of less than 2 °C in the extreme south to 5 °C at high elevations in the far north), with less than a 2.5 °C difference in mean or maximum monthly temperatures and less than 4mm in the mean monthly precipitation at any time throughout the year across the three study sites [49]. For the three islands with available windspeed and cloud cover data, there is similarly very little variability, with less than a 7 km/h and 8% difference in monthly windspeeds and cloud cover, respectively.
The TCI, HCI:Urban, and HCI:Beach were calculated at a daily scale for each of the three destinations and then correlated with monthly land-based arrivals. Canada is a key source market for the Caribbean region, with a growth rate that outperformed all other source markets (+5.7%) in 2018, with a total of 3.9 million visits (or 15% of the total Caribbean arrivals) [50]. Given the importance of Canada as a key source market for the Caribbean, Canadian monthly tourism arrivals data for the same timeframe as the climate dataset (January 2008 to December 2017) were obtained from the Caribbean Tourism Organization (CTO). The arrivals data were processed from visa information forms submitted by travelers upon entry to each Caribbean country. Data provided by the CTO were disaggregated by residency status at the destination country. Expatriate visitors were excluded from the analysis to limit possible bias (i.e., traveling for non-leisure purposes). Residents from the Canadian provinces of Manitoba and Saskatchewan were combined to form the Prairie region (218,804 departures), and the eastern maritime provinces (Prince Edward Island, Nova Scotia, New Brunswick, and Newfoundland) were combined to form the Atlantic region (246,983 departures). Ontario (3,068,096), Quebec (667,595), Alberta (358,520), and British Columbia (177,305) were all assessed as individual provinces.
For all three of the climate indices, a combination of daily temperature and relative humidity for the thermal comfort component is required. Based on the findings from Anderson et al. [51] that nearly all thermal comfort indices are very highly correlated with each other, the Canadian Humidex (or humidity index) was selected to calculate the thermal component of the TCI, HCI:Urban, and HCI:Beach because it is the standard index used by Canadian meteorologists to describe how hot the weather feels to the average person [52]. This is also consistent with the work of Scott et al. [11] and Matthews et al. [27], who used the Canadian Humidex in their tourism index optimization research.
The R-squared (R2) coefficient (i.e., linear regression model) was used to test the relative strength of the relationships between arrivals and the climate index ratings. R2 values are expressed herein as values between 0.00 and 1.0, with a value of 0.0 indicative that none of the variability in the data around its mean is explained by the linear model versus a value closer to 1.0 being indicative that the variability in the data can be fully explained by the model. R2 values were classified along a five-point scale ranging from weak (0.0–0.2), modest (0.2–0.4), moderate (0.4–0.6), moderately strong (0.6–0.8), to strong (>0.8).
5. Results
The most popular months to visit the Caribbean, based on monthly mean arrivals data, are from December to March, with the lowest arrivals during the summer months (June, July, August, September) (Figure 1). Next, the TCI, HCI:Urban, and HCI:Beach index scores were calculated for each day in the 10-year study period for Antigua and Barbuda, Barbados, and Saint Lucia to assess the empirical relationship between index scores and arrivals. For each country, the monthly index value is the mean of daily scores. As shown in Figure 1, there is little annual variability in the TCI scores, with scores ranging from 32 to 63 (unfavorable to good). The lowest TCI scores occur in July and October (scoring 30–35), which is the result of both the higher weight placed on the thermal comfort sub-index, as well as the higher temperatures that occur during these months, which is not considered as optimum for sightseeing tourism. The highest scores occur during the peak tourism season from December to March (acceptable to good) when average daytime high temperatures are 27 to 29 °C. Importantly, unlike the HCI, not a single month in any of these three Caribbean destinations score as excellent using the TCI, which stands in direct contrast with the mean monthly arrivals data.

Figure 1.
Mean monthly scores at Caribbean destinations for the (a) Tourism Climate Index (TCI), (b) Holiday Climate Index(HCI): Urban, and (c) HCI: Beach.
When using the HCI index (HCI:Urban and HCI:Beach, respectively) for the three destination countries, each island scores consistently high (good to excellent) and better reflects the arrivals data to the region. The HCI:Beach scores the highest of the three indices, ranging from 60–87 (good to excellent) for most months of the year, with a slight decline in scores between June and November (58–63 or acceptable to good) due to higher temperatures and increased precipitation of the rainy season.
In addition to the HCI:Beach scoring consistently higher based on the mean monthly index values, it also scores the highest when examining the daily distribution of climatic resources (Figure 2). The boxplot highlights the interquartile range (25%–75%) for the number of days with different index scores across the three Caribbean destinations, with the TCI scoring the lowest overall, followed by HCI:Urban and then HCI:Beach. Importantly, only the daily index scores for the TCI consider the three destinations as having marginal to unfavorable climates versus the HCI:Beach, with daily scores from good to excellent.
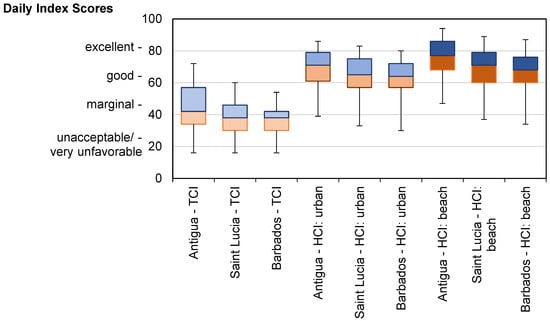
Figure 2.
Daily index scores for TCI, HCI:Urban, and HCI:Beach for Caribbean destinations (whiskers represent the 5th and 95th percentiles).
Moreover, Figure 3 highlights that the daily index scores using the TCI does not accurately describe the Caribbean climate as a main tourism attraction, with 44% of the days in Antigua and Barbuda, 55% of days in Barbados, and 58% of days in Saint Luca scoring between impossible to unacceptable (0–39), and only 1% of the days in Antigua and Barbuda considered ideal for tourism, with no days in Barbados and Saint Lucia considered ideal. Using the HCI index, none of the days are considered impossible for tourism, with less than 10% of the days scoring as unfavorable. The HCI:Beach consistently scores all three destinations the highest, with up to 41% of the days in Antigua and Barbuda considered excellent for tourism, followed by Saint Lucia (21%) and Barbados (15%).
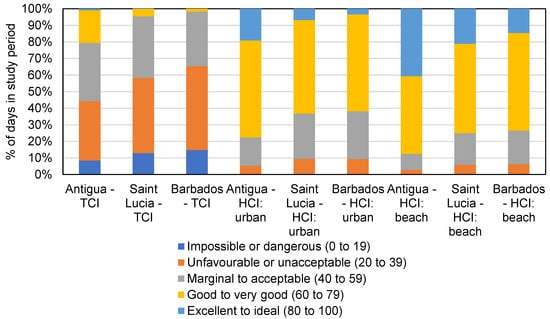
Figure 3.
Percent of daily index scores in each category for TCI, HCI:Urban, and HCI:Beach for Caribbean destinations.
The results of the regression analysis (Table 7) indicate that there is a mild to moderate fit at the monthly level for arrivals from Canadian source markets to the three destinations for the TCI and HCI:Urban. The HCI:Beach outperforms the other two indices in every case except for travel to Antigua and Barbuda from Quebec, whereby HCI:Beach ties TCI and HCI:Urban, as well as travel to Antigua and Barbuda from the Martimes, with HCI:Beach outperforming HCI:Urban but not the TCI (marginal difference of R2 = 0.47 vs. 0.48, respectively). For Canadian arrivals as a whole, there is a moderately strong relationship found between the TCI and arrivals to Saint Lucia (R2 = 0.63) and even stronger for HCI:Beach (R2 = 0.69). Moderate correlations are also noted for all indices and arrivals to Antigua and Barbuda and Barbados, but with the strongest relationship recorded with the HCI:Beach.
6. Discussion
The HCI was developed to address the key limitations of the TCI [25], including the subjectivity in the index’s weighting and rating systems, overconcentration on the thermal sub-index, absence of an overriding physical variable, and the widespread application of the index across destinations despite increasing empirical evidence of the specific climatic requirements of major tourism segments. The HCI:Beach meets all the recommended elements of a robust index set out by de Freitas et al. [26], in that it is theoretically sound (e.g., integrates the effects of thermal, physical, and aesthetic climate variables), is based on tourists’ climatic preferences for specific tourism segments (i.e., thresholds and weighting for HCI:Beach are based on existing studies summarized in Table 1), is simple to calculate with widely available data (e.g., requiring standard meteorological data that is readily available from national datasets), easy to understand (e.g., simple rating system of 0–100 with an associated descriptor of climatic condition from impossible-ideal), and perhaps most importantly, it is empirically tested (comparing mean monthly and daily scores with tourist arrivals).
When comparing the HCI:Beach to the TCI and HCI:Urban to assess current climatic resources for three popular beach destinations in the Caribbean, each location was scored consistently higher by the HCI:Beach, including a stronger relationship (R2) between index scores and tourist arrivals. As discussed, according to TCI, not a single month in these three destination countries has even a very good climate for tourism and December is considered marginal to good. These descriptions of the climate resources of the region do not align with tourist perceptions, peak tourism arrivals, nor marketing during the high season. The structural design of the indices is the cause for the differences, particularly the difference in the weighting of the thermal comfort sub-index and the overriding impact of precipitation in the summer months of June-August. These findings align with the growing body of stated preference research, with survey results consistently underscoring the importance of physical parameters in addition to a wider range of thermally acceptable conditions in a beach environment (Table 1).
In an online survey disseminated by the Caribbean Tourism Organization [53], 96% of regional and national tourism sector planners indicated that a climate information product that can help inform how climatic conditions in the Caribbean impact tourism arrivals would be highly useful for making operational and/or strategic decisions. The HCI:Beach could therefore be employed to help guide destination marketing efforts (e.g., optimize specific marketing advertisements for activities that align with the climatic preferences), as well as inform capacity and pricing (e.g., to forecast occupancy and plan human resources accordingly). An important constraint to the widespread operationalization of the HCI:Beach in the wider Caribbean is the limited availability of data needed to calculate climate indices for all destination countries in the Caribbean (e.g., daily wind speed and cloud cover data was only available for Antigua and Barbuda, Barbados, and Saint Lucia).
Although positive correlations between tourism climate indices and tourist arrivals have also been found in other studies (e.g., Japan [54], China [55]), tourism climate indices have not yet been designed specifically to predict tourism demand and do not generate quantitative predictions about tourism arrivals to specific destinations. Therefore, the application of indices like the TCI, which also have known conceptual limitations and do not represent some salient tourism market segments like beach tourism, to projections of arrivals under changed climate scenarios (e.g., Mediterranean, Southeast Asia, South Pacific) remain uncertain at best. The development of data-driven climate indices for specific tourism markets (domestic and international), particularly those considered to be particularly influenced by climate variability, remains an important area of continued research and climate services development, with positive correlations between arrivals data and indices an initial movement in the right direction.
Research has found that the outbound tourism demand is also sensitive to seasonal and inter-annual climate variability, variably pushing demand from home to destination countries [23,56,57,58,59,60]. Because virtually all applications of climate indices for tourism have assessed the conditions at the destination (i.e., climate-pull factor) without climate-push factors at source markets, an opportunity also exists to test the relationship between climate indices and source markets to understand better how climate-push factors might drive arrivals to a destination that is climatically different. For example, a low HCI rating in a source market (a hypothesized stronger push) can be utilized in an analysis of arrivals from that source market to a particular destination (e.g., from Canada to a Caribbean island). Such research would also be a valuable step towards furthering our understanding of the complex tourism—Climate relationship.
An assessment of the future climatic conditions in the Caribbean using the HCI:Beach is another productive research avenue moving forward, particularly given the high vulnerability of the Caribbean region to projected climate change. However, it is important to note that although econometric studies have generally concluded that arrivals to the Caribbean will decline as temperatures increase throughout the century [61,62,63], studies that have surveyed or observed tourists’ response to thermal conditions in the Caribbean have found tourists to be very resilient to high temperatures (e.g., thermally comfortable in temperatures up to 39 °C) [31], with a range of coastal microclimates to meet tourists’ different thermal preferences [4]. It is therefore likely that the changes in physical climatic resources (i.e., precipitation and wind speed) resulting from projected increases in higher intensity storms (i.e., category 4 and 5 storms) [64] will be particularly important to assess. The lower HCI:Beach scores during the summer months are partially influenced by the rain and wind associated with tropical storms during the hurricane season in the region (June–November). Hurricanes are known to adversely affect tourist arrivals in the region, such that the 2017 hurricane season (hurricanes Harvey, Irma, and Maria) resulted in an estimated loss of 2.5% of expected visitors, with a slow recovery in some destinations to result in depressed tourism arrivals for up to four years [65]. Neither Barbados or Saint Lucia were negatively impacted by the 2017 hurricane seasons (i.e., minimal to no damage), with marginal damage on Antigua as a result of Harvey (i.e., category 2 tropical storm winds and rain) and severe damage to both tourism and community infrastructure on Barbuda from Irma (category 5 storm). Regrettably, there is very limited research on tourists’ perceptions of hurricanes and the impact of hurricanes on destination choice (past, current, or future). One exception is a survey of tourists in Anguilla, which found that 40% of respondents considered the hurricane season when choosing a destination, and tourists were less likely to choose vacation destinations where hurricane risk is perceived to increase [47]. There is also insufficient research on how hurricane forecasts and landfalls in one part of the Caribbean influence visitation in other regions (i.e., is a forecast as disruptive to arrivals as an actual landfall and are arrivals diverted to unaffected destinations, reducing the overall impact on the regional economy). Additional research on how hurricane forecasts and landfalls impact the behavioral response of tourists is warranted.
7. Conclusion
Through an examination of the historical relationship between destination climate and tourist arrivals in the Caribbean, this is the first empirical study to validate a climate index that is informed by tourists’ stated climatic preferences for coastal-beach tourism. By applying the HCI:Beach index in a region that has been consistently under studied in both tourism and climate (change) research [7,8], the results from this study add to the limited body of research on index comparison and validation research [25]. The novel HCI:Beach performed comparatively better than both the HCI:Urban and TCI, with a greater percentage of days scoring between good to ideal for tourism and a stronger relationship (R2) between index scores and tourist arrivals. The HCI:Beach therefore more accurately reflects the tourism arrivals data for the Caribbean region and highlights the importance of climate as a primary tourism product for the region. Importantly, the identification of positive correlations between arrivals data and climate indices represents an initial step in continued development of a climate-driven tourism demand modeling framework for Caribbean tourism. Although currently limited, as the literature on tourists’ stated and revealed preferences continues to develop, it is imperative to integrate these findings into the HCI:Beach specification to further refine and validate the index. Relatedly, as climate data becomes increasingly available, the application of the HCI:Beach to other popular coastal-beach tourism markets at varying temporal and spatial scales, including an assessment of future climatic conditions, remains an important area for continued research.
Author Contributions
All authors have read and agreed to the published version of the manuscript. Index conceptualization, M.R. and D.S.; Methodology, M.R. and D.S.; Formal Analysis, L.M.; Data Curation, L.M., A.T., R.M., A.C.; Writing—Original Draft Preparation, M.R.; Writing—Review & Editing, M.R., D.S., L.M., R.B., A.T., R.M.; Project conceptualization, D.S., A.T., R.M., A.C.; Project Administration, D.S., R.B., A.C.; Funding Acquisition, R.B., A.C.
Funding
This study was commissioned by the Caribbean Tourism Organization (CTO) under the African Caribbean Pacific-European Union-Caribbean Development Bank-Natural Disaster Risk Management in CARIFORUM Countries programme (NDRM). Financial support through the MITACs Accelerate Program is also recognized. Tourism arrivals data for this research was provided by the Caribbean Tourism Organization (CTO). Climate data was provided by the Caribbean Institute for Meteorology and Hydrology (CIMH) as well as United States National Oceanic and Atmospheric Administration (NOAA).
Conflicts of Interest
The authors declare no conflict of interest.
References
- United Nations World Tourism Organization [UNWTO]. UNWTO Tourism Highlights: 2018 Edition. Available online: https://www.e-unwto.org/doi/pdf/10.18111/9789284419876 (accessed on 17 April 2020).
- World Travel & Tourism Council [WTTC]. Travel & Tourism Economic Impact 2018: Caribbean. Available online: https://www.wttc.org/-/media/files/reports/economic-impact-research/regions-2018/caribbean2018.pdf (accessed on 1 February 2020).
- Mendoza-Gonzalez, G.; Martinez, M.; Guevara, R.; Perez-Maqueo, O.; Garza-Lagler, M.; Howard, A. Towards a sustainable sun, sea, and sand tourism: The value of ocean view and proximity to the coast. Sustainability 2018, 10, 1012. [Google Scholar] [CrossRef]
- Rutty, M.; Scott, D. Thermal range of coastal tourism resort microclimates. Tour. Geogr. 2014, 16, 346–363. [Google Scholar] [CrossRef]
- Cameron, C.; Gatewood, J. Beyond sun, sand, and sea: The emergent tourism Programme in the Turks and Caicos Islands. J. Herit. Tour. 2008, 3, 55–73. [Google Scholar] [CrossRef]
- Taylor, M.A.; Clarke, L.A.; Centella, A.; Bezanilla, A.; Stephenson, T.S.; Jones, J.J.; Campbell, D.; Vichot, A.; Charlery, J. Future Caribbean climates in a world of rising temperatures: the 1.5 vs. 2.0 dilemma. J. Clim. 2018, 31, 2907–2926. [Google Scholar] [CrossRef]
- Betzold, C. Adapting to climate change in small island developing states. Clim. Chang. 2015, 133, 481–489. [Google Scholar] [CrossRef]
- Scott, D.; Gössling, S. Tourism and Climate Change Mitigation: Embracing the Paris Agreement–Pathways to Decarbonization; European Travel Commission: Brussels, Belgium, 2018. [Google Scholar]
- World Travel & Tourism Council [WTTC]. Travel & Tourism 2015: Connecting Global Climate Action. Available online: https://www.wttc.org/-/media/files/reports/policy%20research/tt%202015%20%20connecting%20global%20climate%20action%20executive%20summary%20a4%208pp%20web.pdf (accessed on 1 February 2020).
- Gössling, S.; Scott, D. The decarbonisation impasse: global tourism leaders’ views on climate change mitigation. J. Sustain. Tour. 2018, 26, 2071–2086. [Google Scholar] [CrossRef]
- Scott, D.; Hall, C.M.; Gössling, S. Global tourism vulnerability to climate change. Ann. Tour. Res. 2019, 77, 49–61. [Google Scholar] [CrossRef]
- Scott, D.; Hall, C.M.; Gössling, S. A review of the IPCC Fifth Assessment and implications for tourism sector climate resilience and decarbonization. J. Sustain. Tour. 2016, 24, 8–30. [Google Scholar] [CrossRef]
- Caribbean Tourism Organization. Caribbean Sustainable Tourism Policy Framework. Available online: https://caricom.org/documents/10910-cbbnsustainabletourismpolicyframework.pdf (accessed on 8 January 2020).
- Guido, Z.; Rountree, V.; Greene, C.; Gerlak, A.; Trotman, A. Connecting climate information producers and users: Boundary organization, knowledge networks, and information brokers at caribbean climate outlook forums. WeatherClim. Soc. 2016, 8, 285–298. [Google Scholar] [CrossRef]
- Mahon, R.; Farrell, D.; Cox, S.-A.; Trotman, A.; Van Meerbeeck, C.J.; Barnwell, G. Climate services and caribbean resilience: A historical perspective. Soc. Econ. Stud. 2018, 67, 239–260. [Google Scholar]
- WMO. Climate knowledge for action: A global framework for climate services—Empowering the most vulnerable. In The Report of the High Level Task Force for the Global Framework for Climate Services; WMO: Geneva, Switzerland, 2011; p. 240. [Google Scholar]
- Caribbean Institute for Meteorology and Hydrology. Development of Seasonal Forecasting Capabilities to apply to Climate Sensitive Sectors in the Caribbean: Conceptual Framework and Methodology. p. 45. Available online: https://rcc.cimh.edu.bb/files/2018/05/Development-of-Sectoral-EWISACTs-in-the-Caribbean-Conceptual-Framework-and-Methodology.pdf (accessed on 2 April 2020).
- Caribbean Regional Climate Center. Caribbean Tourism Climatic Bulletin. Available online: https://rcc.cimh.edu.bb/tourism-bulletin-archive/ (accessed on 2 April 2020).
- Damm, A.; Köberl, J.; Stegmaier, P.; Alonso, E.J.; Harjanne, A. The market for climate services in the tourism sector—An analysis of Austrian stakeholders’ perceptions. Clim. Serv. 2019, 17, 100094. [Google Scholar] [CrossRef]
- Martín, M.B.G. Weather, climate and tourism a geographical perspective. Ann. Tour. Res. 2005, 32, 571–591. [Google Scholar] [CrossRef]
- Scott, D.; Lemieux, C.; Malone, L. Climate services to support sustainable tourism development and adaptation to climate change. Clim. Res. 2011, 47, 111–122. [Google Scholar] [CrossRef]
- Goh, C. Exploring impact of climate on tourism demand. Ann. Tour. Res. 2012, 39, 1859–1883. [Google Scholar] [CrossRef]
- Li, H.; Song, H.; Li, L. A dynamic panel data analysis of climate and tourism demand: additional evidence. J. Travel Res. 2017, 56, 158–171. [Google Scholar] [CrossRef]
- Rutty, M.; Scott, D. Differential climate preferences of international beach tourists. Clim. Res. 2013, 57, 259–269. [Google Scholar] [CrossRef]
- Scott, D.; Rutty, M.; Amelung, B.; Tang, M. An inter-comparison of the holiday climate index (HCI) and the tourism climate index (TCI) in Europe. Atmosphere 2016, 7, 80. [Google Scholar] [CrossRef]
- De Freitas, C.R.; Scott, D. A second-generation climate index for tourism (CIT): Specification and verification. Int. J. Biometeorol. 2008, 53, 399–407. [Google Scholar] [CrossRef] [PubMed]
- Matthews, L.; Scott, D.; Andrey, J. Development of a data-driven weather index for beach parks tourism. Int. J. Biometeorol. 2019, 1–14. [Google Scholar] [CrossRef] [PubMed]
- Mieczkowski, Z. The Tourism Climate Index: a method for evaluating wold climate for tourism. Can. Geogr. 1985, 29, 220–233. [Google Scholar] [CrossRef]
- Scott, D.; Gössling, S.; de Freitas, C.R. for Preferred climates tourism: case studies from Canada, New Zealand and Sweden. Clim. Res. 2008, 38, 61–73. [Google Scholar] [CrossRef]
- Rutty, M.; Scott, D. Will the Mediterranean become “too hot” for tourism? A reassessment. Tour. Hosp. Plan. Dev. 2010, 7, 267–281. [Google Scholar]
- Rutty, M.; Scott, D. Bioclimatic comfort and the thermal perceptions and preferences of beach tourists. Int. J. Biometeorol. 2015, 59, 37–45. [Google Scholar] [CrossRef] [PubMed]
- Georgopoulou, E.; Mirasgedis, S.; Sarafidis, Y.; Hontou, V.; Gakis, N.; Lalas, D.P. Climatic preferences for beach tourism: an empirical study on Greek islands. Theor. Appl. Climatol. 2019, 137, 667–691. [Google Scholar] [CrossRef]
- Amiranashvili, A.; Chargazia, K.; Matzarakis, A.; Kartvelishvili, L. Tourism climate index in the coastal and mountain locality of Adjara, Georgia. In Proceedings of the International Scientific Conference Sustainable Mountain Regions: Make Them Work, Borovets, Bulgaria, 14–16 May 2015; Available online: http://geography.bg/MountainRegions_Sofia2015 (accessed on 17 April 2020).
- Chen, L.; Ng, E. Outdoor thermal comfort and outdoor activities: A review of research in the past decade. Cities 2012, 29, 118–125. [Google Scholar] [CrossRef]
- Rupp, R.F.; Vásquez, N.G.; Lamberts, R. A review of human thermal comfort in the built environment. Energy Build. 2015, 105, 178–205. [Google Scholar] [CrossRef]
- Coccolo, S.; Kämpf, J.; Scartezzini, J.L.; Pearlmutter, D. Outdoor human comfort and thermal stress: A comprehensive review on models and standards. Urban Clim. 2016, 18, 33–57. [Google Scholar] [CrossRef]
- Morgan, R.; Gatell, E.; Junyent, R.; Micallef, A.; Özhan, E.; Williams, A.T. An improved user-based beach climate index. J. Coast. Conserv. 2000, 6, 41–50. [Google Scholar] [CrossRef]
- Yu, G.; Schwartz, Z.; Walsh, J.E. A weather resolved index for assessing the impact of climate change on tourism related climate resources. Clim. Chang. 2009, 95, 551–573. [Google Scholar] [CrossRef]
- Méndez-Lázaro, P.A.; Terrasa-Soler, J.J.; Torres-Peña, C.; Guzmán-González, P.; Rodríguez, S.; Alemán, M.; Seguinot, T. Tourism and climate conditions in San Juan, Puerto Rico, 2000–2010. Ecol. Soc. 2014, 19, 11–18. [Google Scholar] [CrossRef]
- de Freitas, C.R. Tourism climatology: Evaluating environmental information for decision making and business planning in the recreation and tourism sector. Int. J. Biometeorol. 2003, 48, 45–54. [Google Scholar] [CrossRef] [PubMed]
- Moreno, A. Mediterranean tourism and climate (change): A survey-based study. Tour. Hosp. Plan. Dev. 2010, 7, 253–265. [Google Scholar] [CrossRef]
- Wirth, K. Auswirkungen des Klimawandels auf den Tourismus in Mittelmeerraum Prognosen Anhand Einer Umfrag in Munchen. Bachelor’s Thesis, Ludwig Maximilian Universitat, Munchen, Germany, 2014. [Google Scholar]
- Atzori, R.; Fyall, A.; Miller, G. Tourist responses to climate change: Potential impacts and adaptation in Florida’s coastal destinations. Tour. Manag. 2018, 69, 12–22. [Google Scholar] [CrossRef]
- Ibarra, E.M. The use of webcam images to determine tourist–climate aptitude: favourable weather types for sun and beach tourism on the Alicante coast (Spain). Int. J. Biometeorol. 2011, 55, 373–385. [Google Scholar] [CrossRef]
- R-Toubes, D.; Araújo-Vila, N.; Fraiz-Brea, J.A. Influence of Weather on the Behaviour of Tourists in a Beach Destination. Atmosphere 2020, 11, 121. [Google Scholar] [CrossRef]
- Moore, W.R. The impact of climate change on Caribbean tourism demand. Curr. Issues Tour. 2010, 13, 495–505. [Google Scholar] [CrossRef]
- Forster, J.; Schuhmann, P.W.; Lake, I.R.; Watkinson, A.R.; Gill, J.A. The influence of hurricane risk on tourist destination choice in the Caribbean. Clim. Chang. 2012, 114, 745–768. [Google Scholar] [CrossRef]
- Rutty, M.; Scott, D. Comparison of climate preferences for domestic and international beach holidays: A case study of Canadian travelers. Atmosphere 2016, 7, 30. [Google Scholar] [CrossRef]
- Caribbean Insitute for Meteorology and Hydrology (CIMH). Caribbean Climatology. Available online: https://rcc.cimh.edu.bb/caribbean-climatology/ (accessed on 30 December 2019).
- Caribbean Tourism Organization (CTO). CTO Caribbean Tourism Performance Report 2018 and Outlook for 2019. Available online: https://www.onecaribbean.org/wp-content/uploads/Ryan-Skeete-CTO-State-Industry-Report-2019.pdf (accessed on 30 December 2019).
- Anderson, G.B.; Bell, M.L.; Peng, R.D. Methods to calculate the heat index as an exposure metric in environmental health research. Environ. Health Perspect. 2013, 121, 1111–1119. [Google Scholar] [CrossRef]
- Environment and Climate Change Canada. (ECCC). Spring and Summer Weather Hazards. Available online: https://ec.gc.ca/meteo-weather/meteo-weather/default.asp?lang=En&n=6C5D4990-1#humidex (accessed on 12 February 2020).
- ESSA Technologies Ltd. Development of Climate Products and Services for the Caribbean Tourism Industry (Feasibility Study); Technical Report prepared The Caribbean Tourism Organization and the Caribbean Development Bank; ESSA Technologies Ltd.: Vancouver, BC, Canada, 2019. [Google Scholar]
- Kubokawa, H.; Inoue, T.; Satoh, M. Evaluation of the Tourism Climate Index over Japan in a future climate using a statistical downscaling method. J. Meteorol. Soc. Jpn. 2014, 92, 37–54. [Google Scholar] [CrossRef]
- Li, H.; Goh, C.; Hung, K.; Chen, J.L. Relative climate index and its effect on seasonal tourism demand. J. Travel Res. 2018, 57, 178–192. [Google Scholar] [CrossRef]
- Agnew, M.D.; Palutikof, J.P. Impacts of short-term climate variability in the UK on demand for domestic and international tourism. Clim. Res. 2006, 31, 109–120. [Google Scholar] [CrossRef]
- Alvarez-Diaz MGiraldez, S.O.; Gonzalez-Gomez, M. Statistical relationships between the North Atlantic Oscillation and international tourism demand in the Balearic Islands, Spain. Clim. Res. 2010, 43, 207–214. [Google Scholar] [CrossRef][Green Version]
- Kulendran, N.; Dwyer, L. Modeling seasonal variation in tourism flows with climate variables. Tour. Anal. 2012, 17, 121–137. [Google Scholar] [CrossRef]
- Ridderstaat, J.; Oduber, M.; Croes, R.; Nijkamp, P.; Martens, P. Impacts of seasonal patterns of climate on recurrent fluctuations in tourism demand: Evidence from Aruba. Tour. Manag. 2014, 41, 245–256. [Google Scholar] [CrossRef]
- Lorde, T.; Li, G.; Airey, D. Modeling Caribbean tourism demand: an augmented gravity approach. J. Travel Res. 2016, 55, 946–956. [Google Scholar] [CrossRef]
- Roson, R.; Sartori, M. Estimation of Climate Change Damage Functions for 140 Regions in the GTAP9 Database; The World Bank: Washington, DC, USA, 2016. [Google Scholar]
- Hamilton, J.M.; Maddison, D.J.; Tol, R.S. Effects of climate change on international tourism. Clim. Res. 2005, 29, 245–254. [Google Scholar] [CrossRef]
- Bigano, A.; Hamilton, J.M.; Tol, R.S. The impact of climate on holiday destination choice. Clim. Chang. 2006, 76, 389–406. [Google Scholar] [CrossRef]
- Knutson, T.R.; Sirutis, J.J.; Vecchi, G.A.; Garner, S.; Zhao, M.; Kim, H.S.; Villarini, G. Dynamical downscaling projections of twenty-first-century Atlantic hurricane activity: CMIP3 and CMIP5 model-based scenarios. J. Clim. 2013, 26, 6591–6617. [Google Scholar] [CrossRef]
- World Travel & Tourism Council [WTTC]. Caribbean Resilience and Recovery: Minimizing the Impact of the 2017 Hurricane Season on the Caribbean’s Tourism Sector. Available online: https://www.wttc.org/-/media/files/reports/2018/caribbean-recovery-report---full-report.pdf (accessed on 5 January 2020).


© 2020 by the authors. Licensee MDPI, Basel, Switzerland. This article is an open access article distributed under the terms and conditions of the Creative Commons Attribution (CC BY) license (http://creativecommons.org/licenses/by/4.0/).