Abstract
The Observatoire Pérenne de l’Environnement (OPE) station is a rural background site located in North-Eastern France. Besides emissions from agricultural activities, the site is located far from local emissions but at an even distance from the intense emission zones of Western Germany to the north-east and the Paris area to the south-west. In the paper, we report and analyze almost six years of measurements (1 May 2012 to 31 December 2018) of the optical and physical properties of aerosol particles. Based on aerosol optical and physical measurements combined with air mass back-trajectories, we investigate the dependence of these properties on air mass type. Two distinct equivalent black carbon (EBC) sources—origins-fossil fuel (FF) and biomass burning (BB)— were identified. FF was the dominant source of EBC (>70%) but showed a very marked seasonal variation. BB fraction is found higher during the cold seasons in the order of 35% (0.1 µg m−3) against 17% (0.05 µg m−3) during the warm seasons. The highest EBC and N0.54–1.15 (particles whose diameter ranged from 0.54 to 1.15 µm) median concentrations were observed during the night time and during the cold seasons compared to the warmer seasons, indicating primary sources trapped within a thin boundary layer (BL). A different behavior is found for N10–550 (particles whose diameter ranged from 10 to 550 nm) and coarse mode particles (N1.15–4.5, i.e., particles whose diameter ranged from 1.15 to 4.5 µm) median concentrations, which were observed during the warm seasons compared to the cold seasons, indicating rather biogenic secondary sources for the smaller particles, and potentially primary biogenic sources for the coarse mode particles. The scattering and absorption coefficients and single scattering albedo (SSA) show the same seasonal variations like the ones of N0.54–1.15 concentrations, indicating that particles larger than 500 nm seemed to contribute the most to the optical properties of the aerosol.
1. Introduction
Atmospheric aerosol particles have several effects on climate, air quality, and human health [1,2,3,4,5,6]. To understand the effects of aerosol particles on climate and health, measurements of their optical and physical properties, e.g., particle number size distributions, concentrations, aerosol light absorption and scattering in the atmosphere, are needed. Important information on atmospheric aerosol properties have been provided at the European scale, e.g., new particle formation (NPF) [7,8], aerosol-cloud interactions [9,10], and aerosol scattering and absorption [11,12]. These measurements were mostly being performed within the ACTRIS (Aerosols, Clouds, and Trace Gases Research Infrastructure Network) project [13] and all data used in this study are available via the ACTRIS-EBAS data portal (http://ebas.nilu.no/).
Several studies have investigated aerosol optical [12,14,15] and physical [16,17] properties almost all over the world. For the aerosol optical properties, Pandolfi et al., (2018) [12] reported on the variability in aerosol light scattering properties of atmospheric aerosols measured at 28 ACTRIS observatories, which are located mainly in Europe. They observed an increasing gradient of the aerosol scattering coefficient () when moving from Western Europe and from Nordic and Baltic countries to Central/Eastern Europe. They also showed higher () values during winter at all low-altitude sites in Central and Eastern Europe compared to summer. Collaud Coen et al., (2013) [14] presented long-term aerosol particle light-scattering and absorption measurements taken at 24 regional/remote observatories located mostly in the United States (although five are located in Europe). They found no significant trends for both scattering and absorption coefficients for the three continental European sites. Statistically significant trends were found for the two European marine sites, for most North American stations, and for a few desert and high-altitude sites. For the aerosol physical properties, Asmi et al., (2011) [16] and Beddows et al., (2014) [17] presented a detailed overview of the sites (24 European field monitoring sites) and seasonally disaggregated size distributions collected at ACTRIS and at the German Ultrafine Aerosol Network (GUAN) stations for the diameters between 30 and 500 nm. They showed that the low-land stations in Central Europe have low seasonal changes, high particle concentrations and relatively low variability. In their study, the northern European stations had clearly lower concentrations, with decreasing concentrations at higher latitudes. The mountain stations were characterized by episodes of extremely clean air, most probably from the free troposphere, mixed by episodes of relatively polluted air masses brought by up valley winds, especially during the daytime in summer.
In the present study, we document and analyze results from long-term (six years) measurements of optical and physical aerosol properties measured in situ at the Observatoire Pérenne de l’Environnement (OPE) station [18]. The aim of this study is (1) to characterize the optical and physical properties (daily and seasonal cycles) and (2) to investigate the dependence of these properties on air mass type and season, the contribution of different sources to the resulting observed concentrations for a typical western European rural background environment.
2. Site and Instrumentations
For this study, we used data collected at the OPE station (48°562 N; 5°5 E, 392 m a.s.l, Figure 1) operated by Andra (French National Radioactive Waste Management Agency). This station is located in an agricultural zone between the Parisian basin and the Vosges Mountains surrounded by large field crops and some forests and pastures. The local village and roads are one kilometer away. The closest large towns are between 30 km and 40 km away and a major road is located 15 km away. The stations main objective is to assess the initial atmospheric state, prior to repository construction, in order that it may be used as a background site. In addition to this aim, the OPE infrastructure and database are open to the scientific community to support research on the long term evolution of atmospheric conditions subjected to natural and anthropogenic stresses, and to contribute to a better understanding of the interaction between the various compartments of the environment. The station hosts a variety of instruments to characterize the aerosols and gas properties (description available from http://www.andra.fr) and in particular, measurements from an Integrated Carbon Observation System (ICOS) flux tower. The area may host the future underground nuclear waste repository and all environmental monitoring.
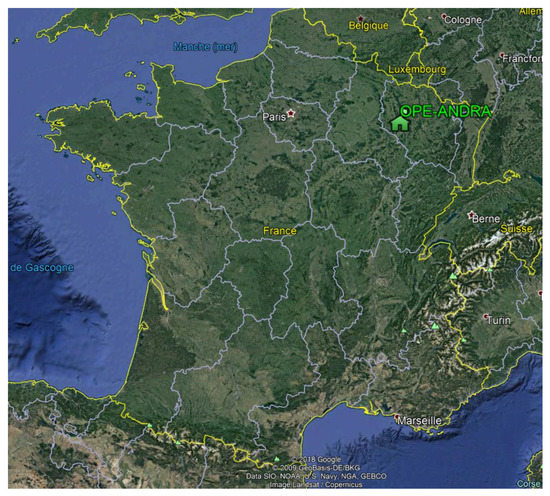
Figure 1.
Map of France: The green house represents the Observatoire Pérenne de l’Environnement (OPE) station. (Adapted from Google Earth).
In this study, we focus on the optical and physical characteristics of aerosol particles measured at the OPE station using an Aethalometer for absorption properties and aerosol equivalent black carbon (EBC) content, and a Nephelometer for the scattering properties. Additionally, a scanning mobility particle sizer (SMPS) and an optical particle counter (OPC) are used for particle size distribution measurements.
2.1. Aethalometer
In this study, the spectral dependence of aerosol absorption coefficients was characterized using a seven-wavelength (370, 470, 520, 590, 660, 880, and 950 nm) Aethalometer (AE31, Magee Scientific). The AE31 is a filter-based absorption photometer, which provides real-time and highly time-resolved data sets of the absorption coefficients of light-absorbing carbonaceous particles [19,20]. Ambient aerosol samples are continuously drawn through a spot on the filter tape in the AE31 system. The AE31 measures the optical attenuation (ATN) of a light beam that passes through a filter sample [19]. The attenuation is then converted into an aerosol absorption coefficient babs for each wavelength. The AE31 instrument uses a correction in order to obtain this coefficient, which is based on the Weingartner et al., (2003) [20] algorithm to account for multiple scattering by the filter by applying a factor C = 1.57 (multiple scattering parameter) specific to the filter of the instrument. The equivalent (EBC) concentrations are then calculated by applying a specific mass absorption efficiency (MAE) on the absorption coefficient at 880 nm as follow:
where is the absorption coefficient as follows:
where C is the multiple scattering parameter (C = 1.57) and is the attenuation coefficient.
The MAEs for each wavelength are respectively 18.47; 14.54; 13.14; 11.58; 10.35; 7.7, and 7.19 m2.g−1, from 370 to 940 nm.
Having multiple wavelengths allow for spectral analysis of the data, which can be of importance for understanding the direct effect of EBC. This can be done through the determination of the single scattering albedo dependence on the wavelength or source apportionment [21,22].
An analysis of the EBC sources apportionment was conducted using the method proposed by Sandradewi et al., (2008) [23]. Briefly, this method aims to apportion the wavelength-dependent absorption coefficients into two sources—fossil fuel (FF) combustion and biomass burning (BB—assuming that the total babs can be attributed to a combination of these two sources (Equation (3)). Using Equations (4) and (5), EBC sources can be determined from the absorption intensity at different wavelengths and source-specific Absorption Ångström Exponent (AAE or α) values:
where αff and αbb refer to the α values for both EBC aerosol sources, namely fossil fuel (FF) and biomass burning (BB). These values were chosen based on the distribution found by Zotter et al., (2017) [22], which corresponds to values of αff = 0.9 and αbb = 1.7, at paired-wavelengths of 470 and 950 nm.
2.2. Nephelometer
The light scattering coefficient of fine aerosols was measured at 3 wavelengths (450 nm, 525 nm, and 635 nm) by a nephelometer (Ecotech, Aurora 3000). This instrument measures the integrated light scattered by particles from 10 to 171. Nephelometer data are corrected for detection limits and truncation errors according to Müller et al., (2011) [24] adapted from Anderson and Ogren, (1998) [25]. The Ångström coefficient (å) is computed from multi-wavelength nephelometer measurements according to Equation (6). In this study, we combined the scattering coefficient at 525 nm with the absorption coefficient to get the in situ extinction coefficient (EXTIS) and aerosol single scattering albedo () between 520nm and 525 nm according to Equations (7) and (8).
where and refer to the aerosol light absorption and scattering coefficients, respectively.
2.3. SMPS
Particle number size distributions in the range from 10 nm to 556 nm were measured using a scanning mobility particle sizer (SMPS, model 3096, TSI inc., Shoreview, MN, USA) modified by TROPOS (Leibniz Institute for Tropospheric Research) to comply with the recommendations of the European ACTRIS infrastructure [26]. The SMPS data used for this study were inverted ‘off-line’ with an inversion software provided with the instrument by TROPOS.
2.4. Optical Particle Counter (OPC)
Particle number size distributions in the range from 0.5 µm to 32 µm were measured using an optical particle counter (EDM180, Grimm) over a total of 31 size channels. Whenever a particle passes the laser, the scattered signal is transmitted to a receiving diode. The received signal is associated with a size class according to its power. This size is computed using a Mie calculation assuming a particle shape and refractive index. OPC data were validated both visually and by comparison with the absorption data obtained by the AE-31. Combining OPC measurements with those obtained from the SMPS allowed us to cover diameters ranging from 10 nm up to 32 µm.
2.5. Tapered Element Oscillating Microbalance-Filter Dynamics Measurement System (TEOM-FDMS)
PM2.5 (particulate matter with aerodynamic diameter below 2.5 µm) mass concentration has been measured using TEOM-FDMS 1405-DF. The latter is designed to provide representative short and long term readings of the ambient PM concentration, even in the presence of volatile materials.
2.6. Availability of Instruments
Figure 2 presents the long-term dataset available for this work. The OPC, AE31, nephelometer, TEOM, and SMPS were installed in May 2012, September 2012 (for both the AE31 and nephelometer), and June 2013, respectively. For the AE31, TEOM, OPC, and SMPS, the majority of raw measurements were validated, and the data gaps are associated with instrument shutdowns due to hardware failure, troubles in the data acquisition system or maintenance and intercomparison periods, while for the nephelometer, the gaps in the data are due to the dysfunction of the instrument.
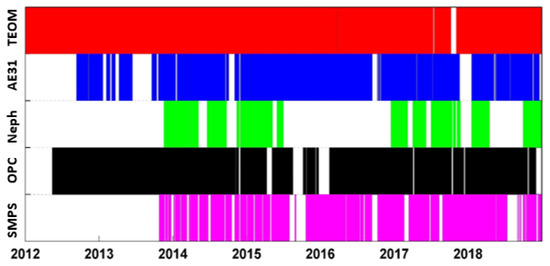
Figure 2.
Continuous measurement data availability between 2012 and 2018 (TEOM in red, Aethalometer in blue, nephelometer in green, Optical Particle Counter (OPC) in black and scanning mobility particle sizer (SMPS) in purple).
The set of results proposed in the rest of this work will be treated with a level of confidence that depends on the amount of data available for each of the instruments, especially for the nephelometer.
2.7. Air Mass Back-Trajectories
Back-trajectories were calculated over 72 hours with a resolution of 1 hour using the PC-based version of HYSPLIT v4.1 [27,28]. Weekly Global Data Assimilation System (GDAS) meteorological data files with a 2° × 2° resolution were used. The Potential Source Contribution Function (PSCF) approach [29] was used in this study to investigate the transport of particles to the OPE site. This approach couples atmospheric concentrations with back-trajectories and uses residence time information [30] to geographically identify regions that contributed to particle concentrations observed at the OPE. This analysis was performed using the ZeFir toolkit [31], an Igor-Pro user-friendly procedure, with a resolution of 0.2° × 0.2° for each grid cell.
3. Results and Discussions
3.1. EBC Concentrations
In order to assess whether the different parameters show a statistically significant seasonal trend, the Wilcoxon-Mann-Whitney test [32] was applied to the median values between cold/warm seasons (Figure S2a). This test showed that the cold/warm difference was significant for some parameters (for example, EBC, EBCbb), however, for EBCff no differences between cold and warm properties were detected.
Figure 3 shows the variations of EBC concentration and Table S1 reports the seasonal medians of this parameter. EBC median concentrations are significantly higher in autumn and winter (0.34 µg m−3 (25th percentile: 0.21 µg m−3; 75th percentile: 0.54 µg m−3) and 0.32 µg m−3 (0.18 µg m−3; 0.56 µg m−3)) compared to spring and summer (0.24 µg m−3 (0.16 µg m−3; 0.41 µg m−3) and 0.25 µg m−3 (0.17 µg m−3; 0.37 µgm−3)), respectively. This might be a result of higher contributions of sources from combustion linked to conventional heating devices often observed during this time of the year. This may also be related to different combustion sources emitted all year long (i.e., traffic) but influenced by the seasonal variation of the boundary layer dynamics (represented for each season in Figure S1) trapping surface-emission during the cold season in a thinner layer than during summer. This is in agreement with Cesari et al., (2018) [33] at the Environmental-Climate Observatory of Lecce in Italy, who reported the highest concentrations of EBC during winter due to a possible influence of combustion sources like biomass burning and boundary layer dynamics. The hypotheses in this study will be further investigated in Section 2.2. The atmospheric BL heights presented in this study were extracted from the reanalysis ERA-Interim of the European Center for Medium-Range Weather Forecasts (ECMWF) model with a resolution of 0.25°. During the day, the development of the BL is associated with enhanced vertical mixing, and therefore, a dilution of surface emitted pollutants. At night, on the contrary, the emitted particles accumulate in a thinner boundary layer with reduced vertical mixing leading to higher surface concentrations.
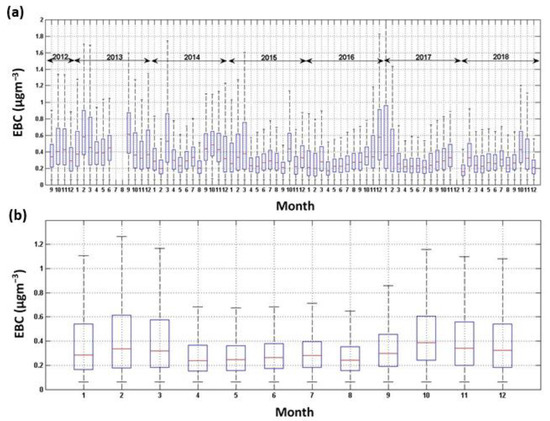
Figure 3.
(a) Evolution of the equivalent black carbon (EBC) concentrations over the entire measurement period and (b) seasonal. Red lines represent the median value, the bottom and top sides of the boxes symbolize the 25th and 75th percentile, respectively. The length of the whiskers represents 1.5× interquartile range which includes 99.3% of the data.
EBC concentrations measured at Hyytiälä (Finland, rural continental station, 182 m) between December 2004 and December 2008 are close to those observed at the OPE (yearly average 0.3 µgm−3) and showed similar seasonal variations [34]. Farah et al., (2018) [35] at the Puy de Dome (PUY) station, also showed higher concentrations of EBC in the atmospheric BL for winter and autumn, with average concentrations comparable to the ones obtained at the OPE (0.22 µg m−3). The OPE EBC concentrations are lower than the ones measured at three suburban sites near Paris (0.9 µg m−3, [36]). The OPE station can thus be classified as a rural background site, with a minor local anthropogenic influence.
An analysis of the relationship between EBC concentration and air mass history was also performed (Figure 4). It is clear that northeasterly air masses, most commonly observed in winter, spring and autumn, are associated with the highest EBC concentrations for these seasons (1 µg m−3, 0.71 µg m−3 and 0.63 µg m−3, respectively for winter, spring, and autumn). This last observation thus provides a further explanation for the seasonal variations in the absorption coefficient and EBC concentrations previously observed. In summer, there was a less pronounced geographical contrast, but north-eastern air masses were also associated with some of the highest EBC concentrations (0.41 µg m−3).
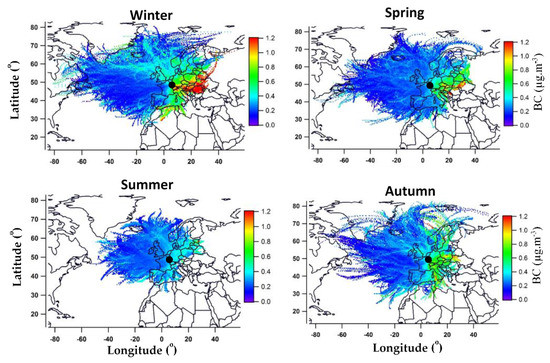
Figure 4.
Potential Source Contribution Function (PSCF) results for EBC concentrations for the four seasons over the 2012–2018 period measured at the OPE station (black dot).
The Wilcoxon-Mann-Whitney test was also applied to the median values between day/night (Figure S2b) for each season, in order to assess whether the different parameters show a statistically significant diurnal trend. This test showed that the day/night difference was significant for some parameters (for example, EBCbb), however, for certain parameters during certain seasons (for example, EBCff in winter, spring and autumn), no differences between day and night properties were detected.
For EBC diurnal variations, there are significant diurnal trends in spring and summer with a minimum mass concentration around 1 P.M. UTC (Figures S2b and S3). These diurnal variations may be explained by the diurnal cycle of the traffic. In winter and autumn, the diurnal variations of EBC mass were not significant. This could be explained by weaker boundary layer height variations and by weaker anthropogenic sources variations (heating).
3.2. EBC Source Apportionment
We determined the contribution of FF and BB to EBC (EBCff and EBCbb) at the OPE. As mentioned previously, we used αff = 0.9 and αbb = 1.7 to determine babs,ff and babs,bb. EBCff and EBCbb are directly determined from babs,ff (950 nm) and babs,bb (470 nm) using the site-specific values for babs(λ).
Figure 5 shows the relative (absolute) EBCff and EBCbb contributions (concentrations) at the OPE. Table S1 provides additional numerical values of the medians calculated over different periods. FF is the dominant source of EBC (>70%) but shows a very marked seasonal variation, with a fraction of EBC resulting from higher BB during the cold seasons, in the order of 35% (0.1 µg m−3) against 17% (0.05 µg m−3) during the warm seasons (Figure 5b). This finding is consistent with more intensive domestic wood-burning type heating during winter and autumn. These observations are in agreement with the seasonal variations of the contribution of BB reported in the literature. Herich et al., (2011) [37] showed at three urban and rural sites in Switzerland, higher BB contributions during winter (33 ± 12%) against (6 ± 10%) in summer. Helin et al., (2018) [38] showed at three locations in Helsinki (1 urban street canyon and 2 suburban sites), higher contribution of BB (44 ± 15% for the 2 suburban sites) during the cold seasons due to residential wood combustion.
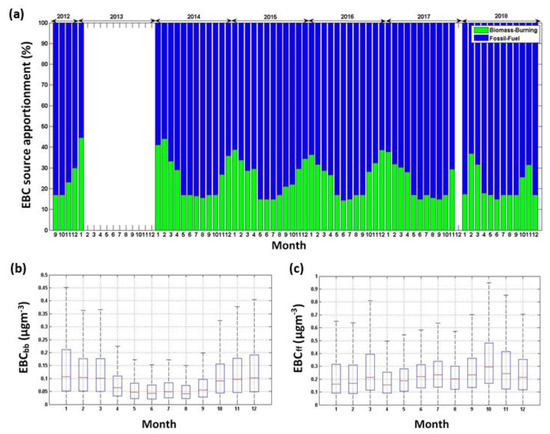
Figure 5.
(a) Average relative contribution (%) of the two EBC sources over the entire measurement period. (b,c): Seasonal variations of the two EBC sources in µg m−3, Biomass Burning (lower left panel) and Fossil Fuel (lower right panel). Red lines represent the median value, bottom and top sides of the boxes symbolize the 25th and 75th percentile, respectively. The length of the whiskers represents 1.5× interquartile range which includes 99.3% of the data.
Concerning the diurnal cycle, significant variations are observed, with a lower contribution of BB and FF (traffic) in the middle of the day for all seasons (for summer for FF) (Figures S2b and S4).
The study of EBC sources can also be conducted from the evolution of the absorption Ångström coefficient (α), presented in Figure 6. As a reminder, an Ångström coefficient close to 2 indicates a predominant contribution of BB, whereas a coefficient close to 1 is indicative of a major contribution of FF [21,23,39].
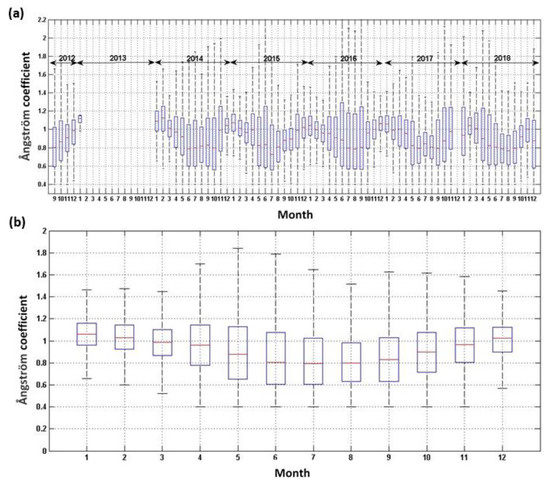
Figure 6.
(a) Evolution of the absorption Ångström coefficient over the entire measurement period; (b) seasonal variations of this same parameter. Red lines represent the median value, bottom and top sides of the boxes symbolize the 25th and 75th percentile, respectively. The length of the whiskers represents 1.5× interquartile range which includes 99.3% of the data.
The variations of α are in perfect agreement with the observations from the model of Zotter et al., (2017) [22]. In particular, the highest values of α were observed during the cold seasons (Figure 6b), in agreement with the higher contribution of BB from the model. Helin et al., (2018) [38] showed that the monthly variation patterns of α at three locations in Helsinki were similar. The highest α values were observed during the cold season and the lowest during the summer; a pattern which was noticed in previous studies as well [40,41,42,43].
3.3. Particle Number Concentrations
Particle number concentrations were measured between 10 nm to 4.5 µm combining SMPS and OPC measurements. Figure 7, Figure 8 and Figure 9 show the variations of the concentrations over three distinct size ranges, 10–550 nm (SMPS coverage), 0.54–1.15 μm (OPC submicron size), and 1.15–4.5 μm (OPC supermicron size). In addition, Table S1 presents the seasonal medians of these concentrations.
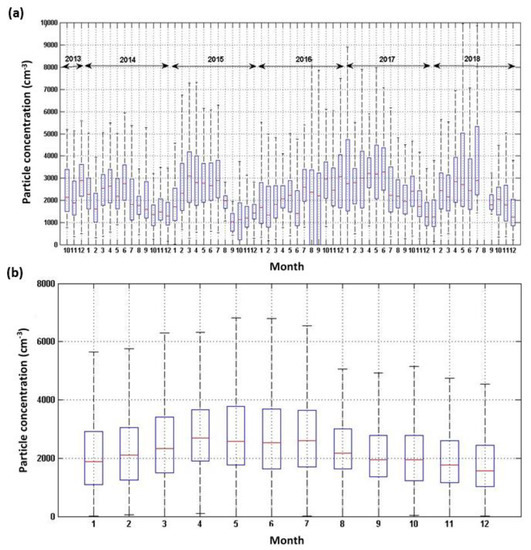
Figure 7.
(a) Evolution of the total particle concentration (cm−3) of diameter between 10 and 550 nm measured by the SMPS over the entire period; (b) seasonal median of this same parameter (cm−3). Red lines represent the median value, bottom and top sides of the boxes symbolize the 25th and 75th percentile respectively. The length of the whiskers represents 1.5× interquartile range which includes 99.3% of the data.
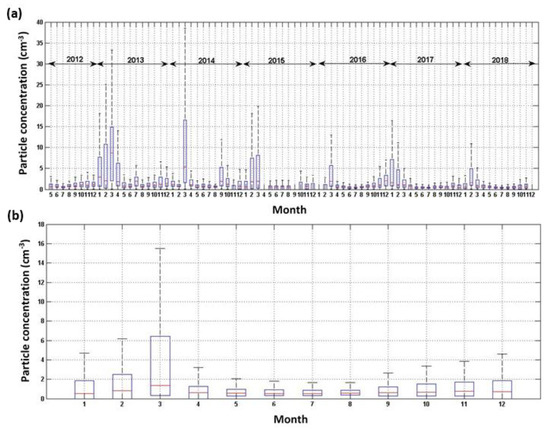
Figure 8.
(a) Evolution of the total particle concentration (cm−3) of diameter between 540 and 1150 nm measured by the OPC over the entire period; (b) seasonal median of this parameter. Red lines represent the median value, bottom and top sides of the boxes symbolize the 25th and 75th percentile, respectively. The length of the whiskers represents 1.5× interquartile range which includes 99.3% of the data.
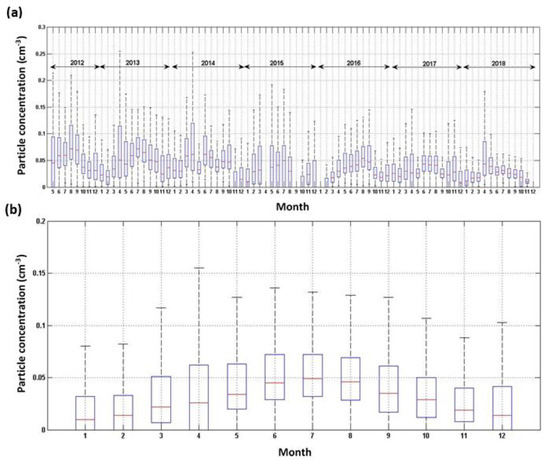
Figure 9.
(a) Evolution of the total particle concentration (cm−3) of diameters between 1.150 and 4.5 μm measured by the OPC over the entire period; (b) seasonal median variations of this parameter. Red lines represent the median value, bottom and top sides of the boxes symbolize the 25th and 75th percentile, respectively. The length of the whiskers represents 1.5× interquartile range which includes 99.3% of the data.
3.3.1. Particle Number Concentration (10–550 nm)
Particle number concentrations in the size range 10–550 nm (N10–550) measured by the SMPS had a seasonal variation, with significantly higher median concentrations during the warm seasons (2550 cm−3 [1700 cm−3; 3600 cm−3]) compared to the cold seasons (1850 cm−3 [1250 cm−3; 2800 cm−3]) (Figure 7a,b, Table S1, and Figure S2a). This N10–550 seasonal variation is opposite to the EBC concentration seasonal variations. While the BL dynamics would have the tendency of concentrating aerosols emitted at the surface in a thinner BL during winter compared to summer, the opposite tendency is seen here. This involves an additional source of 10–550 nm particles during summer, which likely includes secondary aerosol formation processes, among which are new particle formation. This would be consistent with earlier studies, which have highlighted the connection of such processes to strengthened solar radiation and enhanced biogenic activity during warmer months [7].
The diurnal variations of N10–550 showed a significant diurnal trend with lower concentrations around noon for winter and autumn (Figure S5). These diurnal variations may be partly explained by the diurnal cycle of the BL, with a dilution effect around mid-day with the increasing mixing layer height. In spring and summer, there is no significant diurnal trends for this parameter.
The concentrations measured by the SMPS at OPE were compared with those reported by Asmi et al., (2011) [16] for the Melpitz (Germany, 87 m a.s.l), Vavihill (Sweden, 172 m a.s.l), Hyytiälä (Finland, 182 m a.s.l), Cabauw (Netherlands, 0 m a.s.l), and K-Puszta (Hungary, 125 m a.s.l) sites. Asmi et al., (2011) [16] classified these stations into two categories based on their geographic location. Hyytiälä and Vavihill were classified as Nordic stations while the other three were classified as Central European stations. The study of the concentration of particles with a diameter of between 50 and 500 nm revealed for the years 2008 and 2009, overall lower concentrations for the Nordic stations (878 and 1368 cm−3 on average for Hyytiälä and Vavihill, respectively) than for Central European stations (average between 2327 and 3387 cm−3). Sites in Northern Europe were also characterized by a marked seasonal variation in total particle concentration, with higher values in summer. On the contrary, Central European stations do not show significant variations from one season to another. Concentrations observed at the OPE would suggest that the level of concentrations and seasonal variations are in agreement with what is reported for the Nordic stations, in terms of seasonal variation, and for Central Europe stations, in terms of number concentrations.
3.3.2. Particle Number Concentration (0.54–1.15 µm)
Particle number concentrations in the size range 0.54–1.15 µm (N0.54–1.15) had a seasonal variation, with significantly higher median concentrations in winter (0.7 cm−3 [0.1 cm−3; 2 cm−3]) and autumn (0.73 cm−3 [0.23 cm−3; 1.41 cm−3]), compared to 0.56 [0.21 cm−3; 1.15 cm−3]) and 0.54 cm−3 ([0.33 cm−3; 0.88 cm−3]) in spring and summer, respectively (Figure 8a,b, Table S1, and Figure S2a). This result is in agreement with the seasonal variation observed for EBC. The variations in the N0.54-1.15 were also similar to those of the EBC concentration on a shorter time scale (Figure S6, representing time series of and EBC during the pollution episode detected during the first half of March 2014). This is indicative of a dominant combustion source of the 0.54–1.15 µm particles.
For the diurnal cycle, there was no marked variation in the median concentration in winter and autumn (Figure S2b). This feature was also seen for the diurnal cycle of EBC discussed in Section 2.1, confirming the large contribution of combustion sources to this size class. In spring and summer, N0.54-1.15 showed a significant diurnal trend with minimum values around 13 h (Figure S7). The lower concentrations observed during the daytime can be explained by the diurnal cycle of the BL, and also by the diurnal variation of the emission of primary particles. Indeed, in the morning, it is the start of human activities that is likely to contribute to the increase of particulate matter.
The findings are consistent with the findings of the MEGAPOLI 2010 winter campaign when single-particle analysis demonstrated the internal mixing of aged BC with secondary nitrate and sulfate in particles in the size range of around 400–1050 nm [44]. These particles were very distinct chemically from smaller (<400 nm) local Paris BC particles and were found to be associated with episodic contributions from Eastern Europe. The absence of a potassium signature in the measured mass spectra also identified their fossil fuel origin. These findings provide support for the conclusions made here on the likely source of wintertime BC containing particles in Northeastern France in the 540–1150 nm range. Some follow-up measurement and modeling studies also quantified the relevant importance of these local and regional contributions in terms of mass [45,46].
3.3.3. Particle Number Concentration (1.15 and 4.5 µm)
Particle number concentrations in the size range 1.15–4.5 µm (N1.15–4.5) measured by the OPC had a seasonal variation, with significantly higher median concentrations in spring and summer (0.03 cm−3 [0.01 cm−3; 0.06 cm−3] and 0.05 cm−3 [0.03 cm−3; 0.07 cm−3]) compared to winter and autumn (0.01 cm−3 [0.001 cm−3; 0.35 cm−3] and 0.02 cm−3 [0.01 cm−3; 0.05 cm−3]), respectively (Figure 9a,b, Table S1, and Figure S2a). This result is in contrast with the seasonal variation observed for EBC. The contrast between seasonal variation in particle number concentrations and that of EBC would suggest, as for the N10–550 concentrations, that there are additional particle sources in the warm seasons originated from other processes than combustion. Samaké et al., (2019) [47], at 28 French sites (including the OPE site), showed higher concentrations of primary biogenic organic aerosols: polyols (sum of arabitol and mannitol) and glucose, which are mainly associated with the coarse mode, during the warmer seasons compared to colder seasons. Another source of these high concentrations in warm seasons could also be related to the abrasion of leaves and the subsequent release of microbial organisms and plant debris [48,49] and long-range transport of large particles from distant sources. Last, as shown by Contini et al., 2010 [50] at an urban background site in Italy, the increment in large particles could be due to an increase of crustal matter contribution, due to the intrusion of African dust, during the warmer seasons compared to colder seasons.
For this size range, the diurnal cycle was statistically significant in spring (Figure S2b) even though it was less marked than for the lower diameters, with slightly lower concentrations between 12 h and 14 h compared to the rest of the day (Figure S8). The higher concentrations observed at the beginning and end of the day can be explained by the diurnal cycle of the BL. Similar differences in the trends of ultrafine and coarse particles due to the different influence of primary sources and BL dynamics was observed also in the central Mediterranean area [51].
3.3.4. Influence of the Air Mass History
Figure 10 illustrates the influence of the origin and path of the air masses on the particle concentrations at the OPE in the different size ranges studied previously. For particles below 550 nm, there is a significant contribution of particles from the Eastern sector, particularly visible in winter and spring. The significant contribution of particles from the Eastern sector is also present and dominant whatever the season, for particles in the size range 0.54–1.15 μm. This is in agreement with these particles being associated with EBC that is mainly originating from the Eastern sector. The study of the origin of EBC (FF or BB), discussed before, also suggests a dominant contribution from anthropogenic activities, represented here by the FF combustion related to traffic. For particles in the size range 1.15–4.5 μm, there is a visible contribution of local sources of primary emissions due to local agricultural practices [47] and of marine aerosol. Samaké et al., (2019) [47] showed higher concentrations of primary biogenic organic aerosols, which are mainly associated with the coarse mode. On the other hand, Farah et al., (2018) [35] at the PUY station, showed that particles with diameters above 1 μm are higher in Mediterranean and Atlantic air masses, likely a result of long-range transported dust and marine aerosols.
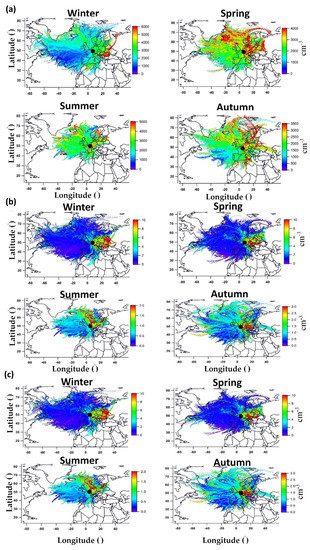
Figure 10.
PSCF results for: (a) N10–550, (b) N0.54–1.15, and (c) N1.15–4.5, for the four seasons over the 2012–2018 period measured at the OPE station (black dot).
This analysis, based on the relationship between the measured particle concentrations and air mass history, is a first approach to roughly identify the locations of the main aerosol sources and with regard to the particle sizes at the OPE. The analysis of size distributions, which is the subject of the following section, will allow a more detailed analysis of the contributions of the different particle modes to the sub-550 nm particle concentration as well as an identification of the sources associated with these modes.
3.4. Link with Air Quality Parameters and to Pollution Events Detected in Paris
Temporal variability of the PM2.5, N10–550, N0.55–2.5, and EBC hourly concentrations at the OPE station is presented in Figure 11. Additionally, the annual limit value of PM2.5 (25 µg.m−3, according to the World Health Organization) is illustrated in green in the background. Regardless of the year, the OPE station exhibits the highest PM2.5 concentrations between January and March, when the annual limit value is exceeded (Figure 11a). High N0.55–2.5 and EBC concentrations are observed concomitantly to peaks in PM2.5 (Figure 11b–d). Petit et al., (2017) [52], at four different urban background sites (three are located near Paris (SIRTA, CREIL and METZ)), also showed high PM2.5 concentrations during March 2015, that were related to low volatile compounds. A strong dominance of secondary pollution, and more particularly of ammonium nitrate, is also observed at all sites during this period (Petit et al 2017). Local sources, especially wood-burning, are, however, found to contribute to local/regional sub-episodes, notably in Metz and SIRTA. Bressi et al., (2013) [53], at urban, suburban and rural background sites in the region of Paris, showed the highest PM2.5 concentrations (wood-burning, organic, and secondary inorganic species) between December and April, suggesting the importance of mid- or long-range transport, and regional instead of local-scale phenomena especially from countries located northeast and east of France. Nevertheless, emissions of local anthropogenic sources lead to higher levels at the urban and suburban sites compared to the northwest site for PM2.5 during the whole campaign, which can even be emphasized by the low boundary layer heights. We confirm the large regional contribution to PM2.5 during the winter/spring season to the Paris peaks by observing the same seasonality at the OPE, with concentrations representing 83% of the average Paris seasonal/monthly concentrations.
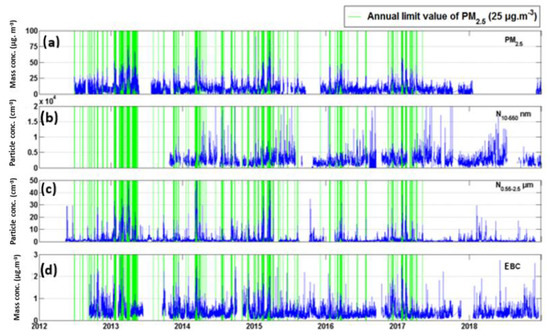
Figure 11.
Time series of: (a) PM2.5; (b) N10–550; (c) N0.55–2.5; (d) EBC, concentrations (Blue). Green bars indicate when mass concentrations exceed their annual limit value (25 µg.m−3).
We also observe that PM2.5 peaks observed at the OPE station are not followed by peaks in the N10-550 number concentrations. Reversely, peaks in N10-550 are not observed in the PM2.5 concentrations. This indicates that potentially harmful pollution episodes occurring in the fine particle mode are not properly monitored by air quality networks, using PM2.5 as a tracer.
3.5. Optical Properties
3.5.1. Particle Absorption
Aerosol absorption coefficients measured at 520 nm had generally higher median values in autumn and winter of 3.5 Mm−1, compared with 2.6 Mm−1 for warmer seasons (Figure S9). This seasonal cycle is similar to that of EBC, the sources of which have been previously discussed.
This seasonal variation is also found for the absorption coefficient measured at Melpitz (at 637 nm), where the median value over the 2007–2010 period is 3.52 Mm−1 [11]. The aerosol absorption coefficient measured in the OPE is about 2.5 times that measured at Lamont in the middle of America (1997–2000) [54] and is about 40% of that measured in Shangdianzi in North China (2003–2004) [55].
3.5.2. Particle Scattering
The aerosol scattering coefficient () measured at 525 nm showed very similar variations to the absorption coefficient (Figure S10). During the cold seasons, () is characterized by higher median values than during the warmer seasons, in the order of 25 Mm−1 against 15 Mm−1 (Figure S10b). This seasonal cycle is similar to that of the absorption coefficient, which might be explained by source variability and intensity. This could also be explained by the BL dynamics.
At Melpitz, the aerosol scattering coefficient measured at 550 nm was higher than at the OPE (53.61 Mm−1) but showed similar seasonal variation [11]. Pandolfi et al., (2018) [12] showed at regional/rural stations (e.g., Kosetice (Czech Republic, 534 m a.s.l), Ispra (Italy, 209 m a.s.l)), higher () in winter compared to summer. The authors related these high winter () values with the higher frequency of stagnant conditions and temperature inversions in winter. They also showed at urban/suburban observatories (e.g., Sirta (France, 162 m a.s.l), Madrid (Spain, 669 m a.s.l), Granada (Spain, 680 m a.s.l)), higher () during the winter compared to the summer season as already observed by Lyamani et al., (2012) [56] and Titos et al., (2012) [43]. This is likely due to the accumulation of fine particles, mainly from traffic, domestic heating, and biomass burning favored by meteorological conditions.
3.5.3. Single Scattering Albedo
The single scattering albedo or SSA () corresponds to the ratio of the scattering coefficient and the extinction coefficient (sum of the absorption and scattering coefficients). It is a widely used parameter for radiative impact studies. The has low values for mainly absorbing particles, and values close to 1 for mainly diffusing particles.
Figure S11 shows the variations of and Table S1 reports the seasonal medians of this parameter. It is observed that, unlike the absorption and diffusion coefficients, there is no pronounced seasonal variation for SSA, with similar medians for all seasons (between 0.86 and 0.89). This observation suggests that the variations observed for the absorption and diffusion coefficients would, therefore, be explained by seasonal variations of the quantity of material rather than by variations of the intrinsic particle properties. The values obtained at the OPE site are close to those obtained at Melpitz (0.894 at 525 nm) and K-Puszta (0.92 at 530 nm) ([11] and references therein). These three stations, mainly influenced by anthropogenic activities or by biomass combustion, have a on average lower than on marine sites, like Mace Head (0.941–0.997 at 550 nm, [11] and references therein), for which aerosol properties are dominated by those of marine sea salts.
The medians and inter-quartiles obtained over the October–February period are close for all years at the OPE site (Figure S11a). This suggests that the ratio of particles having a predominant absorbing or scattering character remains unchanged despite possible variations in the intrinsic properties of the sampled particles or in their quantity.
The showed slightly lower diurnal values in the second half of the day (after 14 h) indicating a greater relative EBC contribution to the total amount of particulate matter at that time of the day.
4. Conclusions
A six-year dataset of multiple continuous measurements at the OPE has been used to determine the specific optical and physical characteristics of aerosols and their sources and transport pathways.
Higher EBC and N0.54–1.15 median concentrations were observed during nighttime and during the cold seasons. These variations can be explained by increased emissions, in particular, combustion, and by lower BL heights. Higher N10–550 and N1.15–4.5 median concentrations were observed during the warmer seasons compared to the colder seasons. This might be due to local sources other than combustion. Secondary aerosol formation processes (e.g., new particle formation) are identified as the dominant source of N10–550. Primary biogenic aerosols and long-range transport of marine aerosols are identified as the main source of N1.15–4.5, both sources being modulated by the BL dynamics.
FF was the dominant source of EBC and showed a very marked seasonal variation. The contribution of the BB fraction was found higher during the cold seasons compared to the warmer seasons, probably because of the increase in domestic biomass burning heating.
Aerosol absorption and scattering coefficient median values followed the ones of the EBC and N0.54-1.15, which seemed to contribute the most to the optical properties of the aerosol.
We presented a statistical analysis using the PSCF method/tool to identify the geographical potential contributions to the OPE aerosol optical and physical properties. This analysis will serve as a basis for evaluating a possible change in the site characteristics in the future. It can also be used for comparison with different aerosol transport models outputs.
Supplementary Materials
The following are available online at https://www.mdpi.com/2073-4433/11/2/172/s1, Table S1; Figures S1–Figure S11.
Author Contributions
Conceptualization, A.F.; Data curation, A.F., P.V., C.R., S.C., L.L. and P.L.; Formal analysis, A.F. and C.R.; Funding acquisition, S.C.; Investigation, A.F.; Methodology, A.F.; Project administration, S.C.; Software, A.F.; Supervision, P.V. and K.S.; Validation, K.S.; Visualization, A.F.; Writing–original draft, A.F.; Writing–review & editing, A.F., P.V., C.R., S.C., P.L. and K.S. All authors have read and agreed to the published version of the manuscript.
Funding
This research was funded by the European Union’s Horizon 2020 research and innovation program, grant number 654109.
Acknowledgments
This work was supported by the Agence nationale pour la gestion des déchets radioactifs (Andra), from the European Union’s Horizon 2020 research and innovation program under grant agreement No 654109 (ACTRIS-2), and from the French program SNO-CLAP. Authors acknowledge additional financial support from the Observatoire de Physique du globe de Clermont-Ferrand (OPGC).
Conflicts of Interest
The authors declare no conflict of interest.
References
- Stocker, T.F.; Qin, D.; Plattner, G.-K.; Tignor, M.; Allen, S.K.; Boschung, J.; Nauels, A.; Xia, Y.; Bex, V.; Midgley, P.M. IPCC, 2013: Climate Change 2013: The Physical Science Basis; Contribution of Working Group I to the Fifth Assessment Report of the Intergovernmental Panel on Climate Change; Cambridge University Press: Cambridge, UK; New York, NY, USA, 2013; p. 1535. [Google Scholar]
- Lohmann, U.; Feichter, J. Global indirect aerosol effects: A review. Atmos. Chem. Phys. 2005, 5, 715–737. [Google Scholar] [CrossRef]
- Stevens, B.; Feingold, G. Untangling aerosol effects on clouds and precipitation in a buffered system. Nature 2009, 461, 607–613. [Google Scholar] [CrossRef] [PubMed]
- Charlson, R.J.; Schwartz, S.E.; Hales, J.M.; Cess, R.D.; Coakley, J.A.; Hansen, J.E.; Hofmann, D.J. Climate Forcing by Anthropogenic Aerosols. Science 1992, 255, 423–430. [Google Scholar] [CrossRef]
- Laden, F.; Schwartz, J.; Speizer, F.E.; Dockery, D.W. Reduction in Fine Particulate Air Pollution and Mortality. Am. J. Respir. Crit. Care Med. 2006, 173, 667–672. [Google Scholar] [CrossRef]
- Boucher, O.; Anderson, T.L. General circulation model assessment of the sensitivity of direct climate forcing by anthropogenic sulfate aerosols to aerosol size and chemistry. J. Geophys. Res. 1995, 100, 26117. [Google Scholar] [CrossRef]
- Nieminen, T.; Kerminen, V.-M.; Petäjä, T.; Aalto, P.P.; Arshinov, M.; Asmi, E.; Baltensperger, U.; Beddows, D.C.S.; Beukes, J.P.; Collins, D.; et al. Global analysis of continental boundary layer new particle formation based on long-term measurements. Atmos. Chem. Phys. 2018, 18, 14737–14756. [Google Scholar] [CrossRef]
- Dall’Osto, M.; Beddows, D.C.S.; Asmi, A.; Poulain, L.; Hao, L.; Freney, E.; Allan, J.D.; Canagaratna, M.; Crippa, M.; Bianchi, F.; et al. Novel insights on new particle formation derived from a pan-european observing system. Sci. Rep. 2018, 8, 1482. [Google Scholar] [CrossRef] [PubMed]
- Raes, F.; Bates, T.; McGovern, F.; Van Liedekerke, M. The 2nd Aerosol Characterization Experiment (ACE-2): General overview and main results. Tellus B Chem. Phys. Meteorol. 2000, 52, 111–125. [Google Scholar] [CrossRef]
- Schmale, J.; Henning, S.; Decesari, S.; Henzing, B.; Keskinen, H.; Sellegri, K.; Ovadnevaite, J.; Pöhlker, M.L.; Brito, J.; Bougiatioti, A.; et al. Long-term cloud condensation nuclei number concentration, particle number size distribution and chemical composition measurements at regionally representative observatories. Nikolaos Mihalopoulos 2018, 18, 22. [Google Scholar] [CrossRef]
- Ma, N.; Birmili, W.; Müller, T.; Tuch, T.; Cheng, Y.F.; Xu, W.Y.; Zhao, C.S.; Wiedensohler, A. Tropospheric aerosol scattering and absorption over central Europe: A closure study for the dry particle state. Atmos. Chem. Phys. 2014, 14, 6241–6259. [Google Scholar] [CrossRef]
- Pandolfi, M.; Alados-Arboledas, L.; Alastuey, A.; Andrade, M.; Angelov, C.; Artiñano, B.; Backman, J.; Baltensperger, U.; Bonasoni, P.; Bukowiecki, N.; et al. A European aerosol phenomenology-6: Scattering properties of atmospheric aerosol particles from 28 ACTRIS sites. Atmos. Chem. Phys. 2018, 18, 7877–7911. [Google Scholar] [CrossRef]
- Philippin, S.; Laj, P.; Putaud, J.-P.; Wiedensohler, A.; de Leeuw, G.; Fjaeraa, A.; Platt, U.; Baltensperger, U.; Fiebig, M. EUSAAR An Unprecedented Network of Aerosol Observation in Europe. Earozoru Kenkyu 2009, 24, 78–83. [Google Scholar]
- Collaud Coen, M.; Andrews, E.; Asmi, A.; Baltensperger, U.; Bukowiecki, N.; Day, D.; Fiebig, M.; Fjaeraa, A.M.; Flentje, H.; Hyvärinen, A.; et al. Aerosol decadal trends—Part 1: In-situ optical measurements at GAW and IMPROVE stations. Atmos. Chem. Phys. 2013, 13, 869–894. [Google Scholar] [CrossRef]
- Sherman, J.P.; Sheridan, P.J.; Ogren, J.A.; Andrews, E.; Hageman, D.; Schmeisser, L.; Jefferson, A.; Sharma, S. A multi-year study of lower tropospheric aerosol variability and systematic relationships from four North American regions. Atmos. Chem. Phys. 2015, 15, 12487–12517. [Google Scholar] [CrossRef]
- Asmi, A.; Wiedensohler, A.; Laj, P.; Fjaeraa, A.-M.; Sellegri, K.; Birmili, W.; Weingartner, E.; Baltensperger, U.; Zdimal, V.; Zikova, N. Number size distributions and seasonality of submicron particles in Europe 2008–2009. Atmos. Chem. Phys. 2011, 11, 5505–5538. [Google Scholar] [CrossRef]
- Beddows, D.C.S.; Dall’Osto, M.; Harrison, R.M.; Kulmala, M.; Asmi, A.; Wiedensohler, A.; Laj, P.; Fjaeraa, A.M.; Sellegri, K.; Birmili, W.; et al. Variations in tropospheric submicron particle size distributions across the European continent 2008–2009. Atmos. Chem. Phys. 2014, 14, 4327–4348. [Google Scholar] [CrossRef]
- Conil, S.; Helle, J.; Langrene, L.; Laurent, O.; Ramonet, M. Continuous atmospheric CO2, CH4 and CO measurements at the OPE station in France from 2011 to 2018. Atmos. Meas. Tech. 2019, 12, 6361–6383. [Google Scholar] [CrossRef]
- Hansen, A.D.A.; Rosen, H.; Novakov, T. The aethalometer—An instrument for the real-time measurement of optical absorption by aerosol particles. Sci. Total Environ. 1984, 36, 191–196. [Google Scholar] [CrossRef]
- Weingartner, E.; Saathoo, H.; Schnaiter, M.; Streit, N.; Bitnar, B.; Baltensperger, U. Absorption of light by soot particles: Determination of the absorption coeecient by means of aethalometers. Aerosol Sci. 2003, 34, 1445–1463. [Google Scholar] [CrossRef]
- Sandradewi, J.; Prévôt, A.S.H.; Szidat, S.; Perron, N.; Alfarra, M.R.; Lanz, V.A.; Weingartner, E.; Baltensperger, U. Using Aerosol Light Absorption Measurements for the Quantitative Determination of Wood Burning and Traffic Emission Contributions to Particulate Matter. Environ. Sci. Technol. 2008, 42, 3316–3323. [Google Scholar] [CrossRef]
- Zotter, P.; Herich, H.; Gysel, M.; El-Haddad, I.; Zhang, Y.; Močnik, G.; Hüglin, C.; Baltensperger, U.; Szidat, S.; Prévôt, A.S.H. Evaluation of the absorption Ångström exponents for traffic and wood burning in the Aethalometer-based source apportionment using radiocarbon measurements of ambient aerosol. Atmos. Chem. Phys. 2017, 17, 4229–4249. [Google Scholar] [CrossRef]
- Sandradewi, J.; Prévôt, A.S.H.; Weingartner, E.; Schmidhauser, R.; Gysel, M.; Baltensperger, U. A study of wood burning and traffic aerosols in an Alpine valley using a multi-wavelength Aethalometer. Atmos. Environ. 2008, 42, 101–112. [Google Scholar] [CrossRef]
- Müller, T.; Laborde, M.; Kassell, G.; Wiedensohler, A. Design and performance of a three-wavelength LED-based total scatter and backscatter integrating nephelometer. Atmos. Meas. Tech. 2011, 4, 1291–1303. [Google Scholar] [CrossRef]
- Anderson, T.L.; Ogren, J.A. Determining Aerosol Radiative Properties Using the TSI 3563 Integrating Nephelometer. Aerosol Sci. Technol. 1998, 29, 57–69. [Google Scholar] [CrossRef]
- Wiedensohler, A.; Birmili, W.; Nowak, A.; Sonntag, A.; Weinhold, K.; Merkel, M.; Wehner, B.; Tuch, T.; Pfeifer, S.; Fiebig, M.; et al. Mobility particle size spectrometers: Harmonization of technical standards and data structure to facilitate high quality long-term observations of atmospheric particle number size distributions. Atmos. Meas. Tech. 2012, 5, 657–685. [Google Scholar] [CrossRef]
- Draxler, R.R.; Rolph, G.D. HYSPLIT (HYbrid Single-Particle Lagrangian Integrated Trajectory) Model; NOAA Air Resources Laboratory: Silver Spring, MD, USA, 2003. Available online: http://www.arl.noaa.gov/ready/hysplit4.html (accessed on 20 March 2017).
- Stein, A.F.; Draxler, R.R.; Rolph, G.D.; Stunder, B.J.B.; Cohen, M.D.; Ngan, F.; Stein, A.F.; Draxler, R.R.; Rolph, G.D.; Stunder, B.J.B.; et al. NOAA’s HYSPLIT Atmospheric Transport and Dispersion Modeling System. Bull. Am. Meteorol. Soc. 2015, 96, 2059–2077. [Google Scholar] [CrossRef]
- Polissar, A.V.; Hopke, P.K.; Paatero, P.; Kaufmann, Y.J.; Hall, D.K.; Bodhaine, B.A.; Dutton, E.G.; Harris, J.M. The aerosol at Barrow, Alaska: Long-term trends and source locations. Atmos. Environ. 1999, 33, 2441–2458. [Google Scholar] [CrossRef]
- Fleming, Z.L.; Monks, P.S.; Manning, A.J. Review: Untangling the influence of air-mass history in interpreting observed atmospheric composition. Atmos. Res. 2012, 104, 1–39. [Google Scholar] [CrossRef]
- Petit, J.-E.; Favez, O.; Albinet, A.; Canonaco, F. A user-friendly tool for comprehensive evaluation of the geographical origins of atmospheric pollution: Wind and trajectory analyses. Environ. Model. Softw. 2017, 88, 183–187. [Google Scholar] [CrossRef]
- DePuy, V.; Berger, V.W.; Zhou, Y. Wilcoxon-Mann-Whitney test. In Encyclopedia of Statistics in Behavioral Science; Wiley: New York, NY, USA, 2005. [Google Scholar]
- Cesari, D.; Merico, E.; Dinoi, A.; Marinoni, A.; Bonasoni, P.; Contini, D. Seasonal variability of carbonaceous aerosols in an urban background area in Southern Italy. Atmos. Res. 2018, 200, 97–108. [Google Scholar] [CrossRef]
- Hyvärinen, A.-P.; Kolmonen, P.; Kerminen, V.-M.; Virkkula, A.; Leskinen, A.; Komppula, M.; Hatakka, J.; Burkhart, J.; Stohl, A.; Aalto, P.; et al. Aerosol black carbon at five background measurement sites over Finland, a gateway to the Arctic. Atmos. Environ. 2011, 45, 4042–4050. [Google Scholar] [CrossRef]
- Farah, A.; Freney, E.; Chauvigné, A.; Baray, J.-L.; Rose, C.; Picard, D.; Colomb, A.; Hadad, D.; Abboud, M.; Farah, W.; et al. Seasonal Variation of Aerosol Size Distribution Data at the Puy de Dôme Station with Emphasis on the Boundary Layer/Free Troposphere Segregation. Atmosphere 2018, 9, 244. [Google Scholar] [CrossRef]
- Laborde, M.; Crippa, M.; Tritscher, T.; Jurányi, Z.; Decarlo, P.F.; Temime-Roussel, B.; Marchand, N.; Eckhardt, S.; Stohl, A.; Baltensperger, U.; et al. Sciences ess Atmospheric Chemistry and Physics Climate of the Past Geoscientific Instrumentation Methods and Data Systems Black carbon physical properties and mixing state in the European megacity Paris. Atmos. Chem. Phys 2013, 13, 5831–5856. [Google Scholar] [CrossRef]
- Herich, H.; Hueglin, C.; Buchmann Empa, B. Atmospheric Measurement Techniques A 2.5 year’s source apportionment study of black carbon from wood burning and fossil fuel combustion at urban and rural sites in Switzerland. Atmos. Meas. Tech. 2011, 4, 1409. [Google Scholar] [CrossRef]
- Helin, A.; Niemi, J.V.; Virkkula, A.; Pirjola, L.; Teinilä, K.; Backman, J.; Aurela, M.; Saarikoski, S.; Rönkkö, T.; Asmi, E.; et al. Characteristics and source apportionment of black carbon in the Helsinki metropolitan area, Finland. Atmos. Environ. 2018, 190, 87–98. [Google Scholar] [CrossRef]
- Kirchstetter, T.W.; Novakov, T.; Hobbs, P.V. Evidence that the spectral dependence of light absorption by aerosols is affected by organic carbon. J. Geophys. Res. Atmos. 2004, 109. [Google Scholar] [CrossRef]
- Crilley, L.R.; Bloss, W.J.; Yin, J.; Beddows, D.C.S.; Harrison, R.M.; Allan, J.D.; Young, D.E.; Flynn, M.; Williams, P.; Zotter, P.; et al. Sources and contributions of wood smoke during winter in London: Assessing local and regional influences. Atmos. Chem. Phys. 2015, 15, 3149–3171. [Google Scholar] [CrossRef]
- Ran, L.; Deng, Z.Z.; Wang, P.C.; Xia, X.A. Black carbon and wavelength-dependent aerosol absorption in the North China Plain based on two-year aethalometer measurements. Atmos. Environ. 2016, 142, 132–144. [Google Scholar] [CrossRef]
- Martinsson, J.; Abdul Azeem, H.; Sporre, M.K.; Bergström, R.; Ahlberg, E.; Öström, E.; Kristensson, A.; Swietlicki, E.; Eriksson Stenström, K. Carbonaceous aerosol source apportionment using the Aethalometer model—Evaluation by radiocarbon and levoglucosan analysis at a rural background site in southern Sweden. Atmos. Chem. Phys. 2017, 17, 4265–4281. [Google Scholar] [CrossRef]
- Titos, G.; Foyo-Moreno, I.; Lyamani, H.; Querol, X.; Alastuey, A.; Alados-Arboledas, L. Optical properties and chemical composition of aerosol particles at an urban location: An estimation of the aerosol mass scattering and absorption efficiencies. J. Geophys. Res. 2012, 117, 4206. [Google Scholar] [CrossRef]
- Healy, R.M.; Sciare, J.; Poulain, L.; Kamili, K.; Merkel, M.; Müller, T.; Wiedensohler, A.; Eckhardt, S.; Stohl, A.; Sarda-Estève, R.; et al. Sources and mixing state of size-resolved elemental carbon particles in a European megacity: Paris. Atmos. Chem. Phys. 2012, 12, 1681–1700. [Google Scholar] [CrossRef]
- Healy, R.M.; Sciare, J.; Poulain, L.; Crippa, M.; Wiedensohler, A.; Prévôt, A.S.H.; Baltensperger, U.; Sarda-Estève, R.; McGuire, M.L.; Jeong, C.-H.; et al. Quantitative determination of carbonaceous particle mixing state in Paris using single-particle mass spectrometer and aerosol mass spectrometer measurements. Atmos. Chem. Phys. 2013, 13, 9479–9496. [Google Scholar] [CrossRef]
- Skyllakou, K.; Murphy, B.N.; Megaritis, A.G.; Fountoukis, C.; Pandis, S.N. Contributions of local and regional sources to fine PM in the megacity of Paris. Atmos. Chem. Phys. 2014, 14, 2343–2352. [Google Scholar] [CrossRef]
- Samaké, A.; Jaffrezo, J.L.; Favez, O.; Weber, S.; Jacob, V.; Albinet, A.; Riffault, V.; Perdrix, E.; Waked, A.; Golly, B.; et al. Polyols and glucose particulate species as tracers of primary biogenic organic aerosols at 28 French sites. Atmos. Chem. Phys. 2019, 19, 3357–3374. [Google Scholar] [CrossRef]
- Fu, P.; Kawamura, K.; Kobayashi, M.; Simoneit, B.R.T. Seasonal variations of sugars in atmospheric particulate matter from Gosan, Jeju Island: Significant contributions of airborne pollen and Asian dust in spring. Atmos. Environ. 2012, 55, 234–239. [Google Scholar] [CrossRef]
- Medeiros, P.M.; Conte, M.H.; Weber, J.C.; Simoneit, B.R.T. Sugars as source indicators of biogenic organic carbon in aerosols collected above the Howland Experimental Forest, Maine. Atmos. Environ. 2006, 40, 1694–1705. [Google Scholar] [CrossRef]
- Contini, D.; Genga, A.; Cesari, D.; Contini, D.; Genga, A.; Cesari, D.; Siciliano, M.; Donateo, A.; Bove, M.C.; Guascito, M.R. Characterisation and source apportionment of PM10 in an urban background site in Lecce Development of new devices for atmospheric pollutants monitoring View project Poseidon: Pollution Monitoring of ship emissions: An Integrated approach for harbours in the Adriatic basin View project Characterisation and source apportionment of PM10 in an urban background site in Lecce. Atmos. Res. 2016, 95, 40–54. [Google Scholar]
- Donateo, A.; Conte, M.; Grasso, F.M.; Contini, D. Seasonal and diurnal behaviour of size segregated particles fluxes in a suburban area. Atmos. Environ. 2019, 219, 117052. [Google Scholar] [CrossRef]
- Petit, J.-E.; Amodeo, T.; Meleux, F.; Bessagnet, B.; Menut, L.; Grenier, D.; Pellan, Y.; Ockler, A.; Rocq, B.; Gros, V. Characterising an intense PM pollution episode in March 2015 in France from multi-site approach and near real time data: Climatology, variabilities, geographical origins and model evaluation. Atmos. Environ. 2017, 155, 68–84. [Google Scholar] [CrossRef]
- Bressi, M.; Sciare, J.; Ghersi, V.; Bonnaire, N.; Nicolas, J.B.; Petit, J.-E.; Moukhtar, S.; Rosso, A.; Mihalopoulos, N.; Féron, A. A one-year comprehensive chemical characterisation of fine aerosol (PM2.5) at urban, suburban and rural background sites in the region of Paris (France). Atmos. Chem. Phys. 2013, 13, 7825–7844. [Google Scholar] [CrossRef]
- Delene, D.J.; Ogren, J.A.; Delene, D.J.; Ogren, J.A. Variability of Aerosol Optical Properties at Four North American Surface Monitoring Sites. J. Atmos. Sci. 2002, 59, 1135–1150. [Google Scholar] [CrossRef]
- Yan, P.; Tang, J.; Huang, J.; Mao, J.T.; Zhou, X.J.; Liu, Q.; Wang, Z.F.; Zhou, H.G. The measurement of aerosol optical properties at a rural site in Northern China. Atmos. Chem. Phys. 2008, 8, 2229–2242. [Google Scholar] [CrossRef]
- Lyamani, H.; Fernández-Gálvez, J.; Pérez-Ramírez, D.; Valenzuela, A.; Antón, M.; Alados, I.; Titos, G.; Olmo, F.J.; Alados-Arboledas, L. Aerosol properties over two urban sites in South Spain during an extended stagnation episode in winter season. Atmos. Environ. 2012, 62, 424–432. [Google Scholar] [CrossRef]


© 2020 by the authors. Licensee MDPI, Basel, Switzerland. This article is an open access article distributed under the terms and conditions of the Creative Commons Attribution (CC BY) license (http://creativecommons.org/licenses/by/4.0/).