1. Introduction
The Mediterranean area shows a complex hydro-meteorological cycle [
1] with important socio-economic implications for a wide region, encompassing southern Europe, northern Africa and the Middle East [
2,
3,
4,
5]. It provides a unique atmospheric, oceanic and hydrological coupled system, due to its geomorphological setting: a nearly closed sea surrounded by urbanized coasts and mountains from which numerous rivers originate.
The Mediterranean hydro-meteorological cycle is significantly influenced by both mid-latitude and sub-tropical climate dynamics. Severe weather events, including heavy precipitation leading to flash-flooding episodes, occur during the fall season; conversely severe cyclogenesis associated with strong winds and large sea waves occur during winter. Besides, summer heat waves and droughts accompanied by forest fires, regularly affect the Mediterranean region causing heavy damage and loss of human life.
The Mediterranean region has been identified as one of the two main climate change hot spots at a global scale, together with north eastern European regions, suggesting that climate is especially responsive to global climate change in this area [
6]. Large decreases in mean precipitation and increases in precipitation variability during the dry (warm) season are expected, as well as large increases in temperature (from +1.4 to +5.8 °C in 2100).
Llasat et al., (2010) [
7] constructed a database of high-impact floods and flash floods in Mediterranean countries and their results suggested that the spatial distribution of the different kinds of floods is neither homogeneous in the region, nor stationary over time; instead, it shows a clear distinction between the western and the eastern Mediterranean, with a major concentration of events in the former region. In the western Mediterranean, Spain and Italy suffer for the highest flood frequency, but the material and economic damages are particularly high in Italy. Floods are less frequent in southern Mediterranean countries (northern Africa) but are usually catastrophic with a very high number of casualties.
Events in Liguria (13 deaths in October 2011 and 6 deaths in November 2011), in western Attica in Greece (24 deaths in November 2017), in the Balearic Islands (13 deaths in October 2018), in southern France (15 deaths in October 2018), in Italy (36 deaths in October–November 2018), in Greece (4 deaths in September 2020 for Medicane Ianos) and in central-southern Mediterranean (Tunisia, Algeria, Malta, and Italy, 7 deaths in October 2021 for Medicane Apollo) show that flood-related mortality remains a major concern in Mediterranean countries prone to flash floods. Along these lines, Petrucci et al. [
5] and Vinet et al. [
8] created the Mediterranean Flood Fatality Database (MEFF DB) for six Mediterranean regions/countries: Catalonia (Spain), Balearic Islands (Spain), southern France, Calabria (Italy), Greece, and Turkey, and covering the period 1980–2018. Petrucci et al. [
5] focused on the profile of victims and the circumstances of the accidents and showed that in most cases they were killed while travelling by car. Vinet et al. [
8] addressed the spatial distribution of flood mortality through a geographical information system (GIS) at different spatial scales and identified a negative mortality gradient between the western and the eastern parts of the Mediterranean Sea and identified the south of France as the most affected region.
The capability to predict such high-impact hydro-meteorological events, despite the significant progress of the last decade, remains weak because of the contribution of very fine-scale processes as well as their non-linear interactions with the larger scale ones. Advances in the identification of the predominant processes and particularly of their interactions at different scales are needed to better forecast these events and reduce uncertainties on the prediction of their evolution (e.g., frequency, intensity) and socio-economic impacts under the future climate.
In this framework, several studies have been devoted to gaining a deeper understanding of the relationships between high-impact hydro-meteorological events and key controlling phenomena at synoptic and mesoscales. Reale et al. [
9] investigated, with the aid of a water vapour back-trajectory technique, the large-scale source of moisture for a series of floods in the Mediterranean area and they found that the additional contribution of Atlantic hurricanes, in terms of moisture advection, can be important for these severe hydro-meteorological phenomena. Molini et al. [
10] classified severe rainfall events over the Mediterranean area as, either long-lived and spatially distributed (Type I) if lasting more than 12 h and larger than 50 × 50 km
2, or brief and localized (Type II), if having a shorter duration or a smaller spatial extent. Their work examined the hypothesis that the two types of events were associated with different dynamical regimes distinguished by different degrees of control of convective precipitation by the synoptic-scale flow. Values of the convective adjustment timescale,
τc, shorter than 6 h indicate convection that is responding rapidly to the synoptic environment (equilibrium, Type I events), while slower timescales indicate that other, presumably local, factors dominate, thus resulting in highly localized and unpredictable convection phenomena (non-equilibrium, Type II events).
Pinto et al. [
11] focused on rainfall annual maxima for five reference durations (1, 3, 6, 12, and 24 h) over 200 stations in the north-western Italy area. They initially classified a day as an extraordinary rainfall day when a regional threshold, calculated on the basis of a two-components with extreme values, is exceeded for at least one of the stations. Subsequently, a clustering procedure that took into account the different rainfall durations was applied to identify about 160 events. It was found that clusters including the most intense events were characterized by strong and persistent upper air troughs inducing, not only moisture advection from the North Atlantic into the Western Mediterranean, but also strong northward flow towards the southern Alpine ranges.
Grazzini et al. [
12] investigated a wide number of extreme precipitation events (EPEs) occurring between 1979 and 2015 in northern-central Italy. The EPEs were subdivided into three categories (Cat1, Cat2, Cat3) according to thermodynamic conditions over the affected region. It was found that the three categories differed not only in terms of the local meteorological conditions, but also in terms of the evolution and properties of precursor Rossby wave packets (RWP).
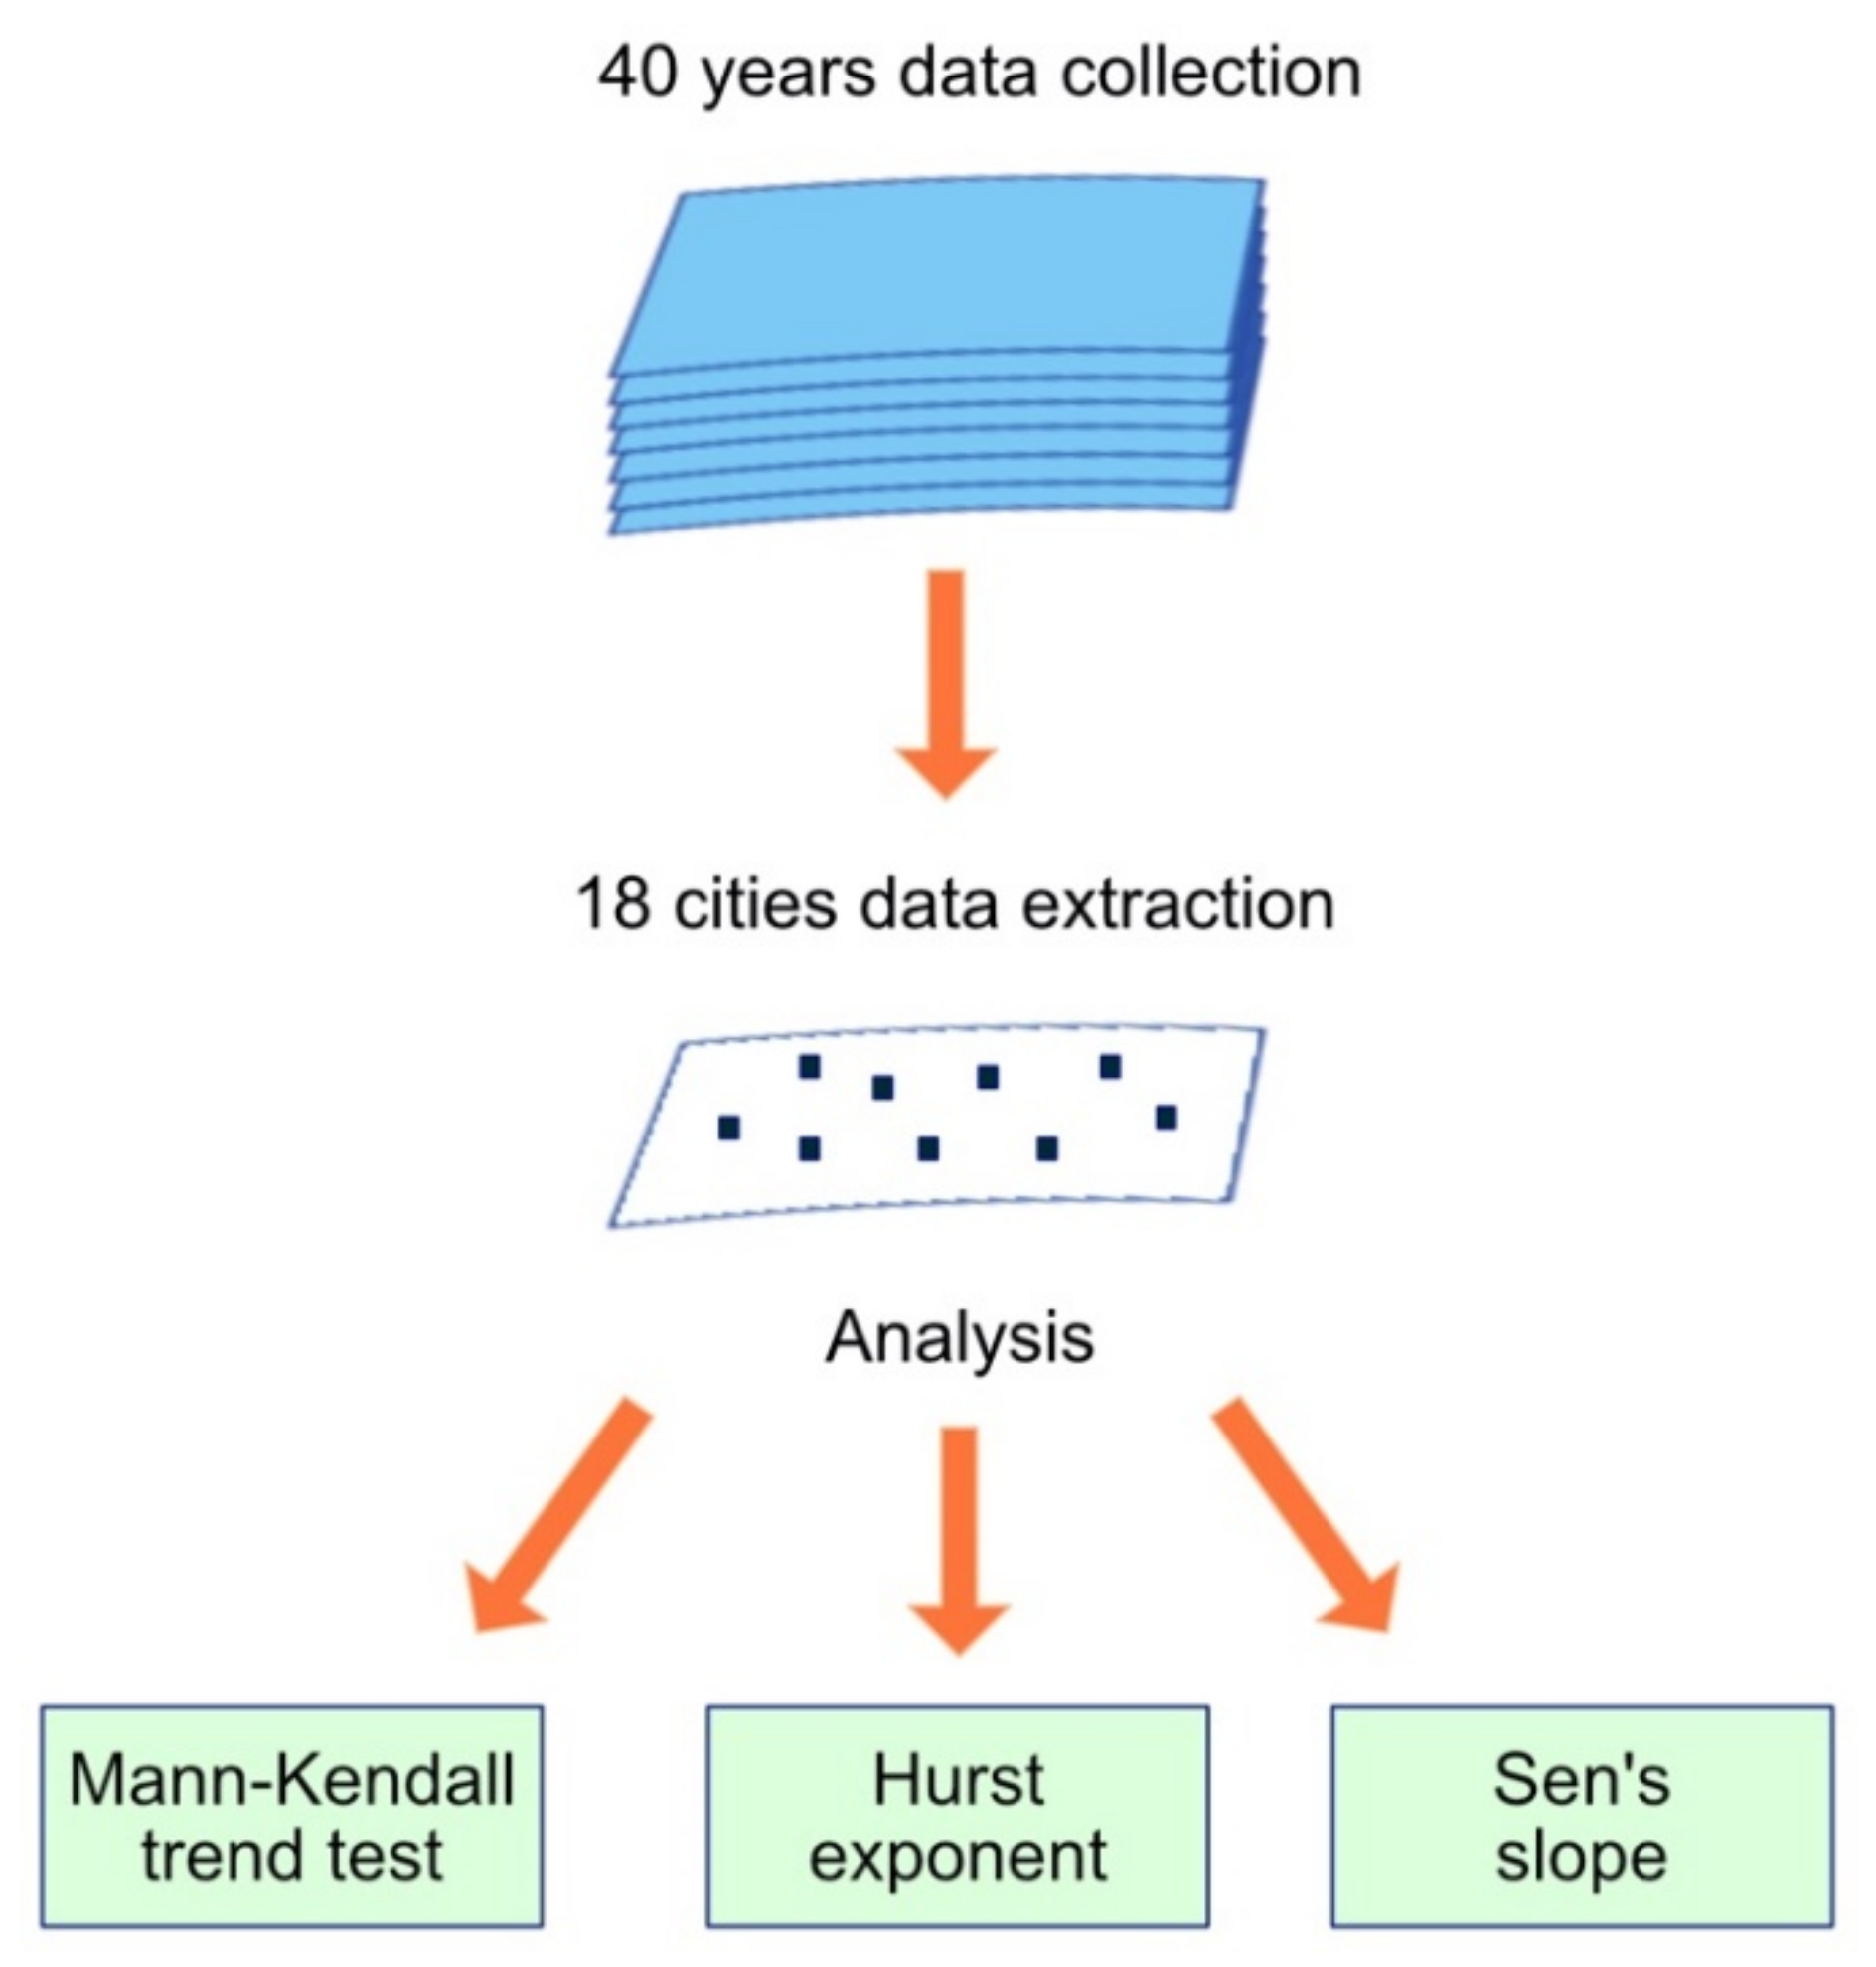
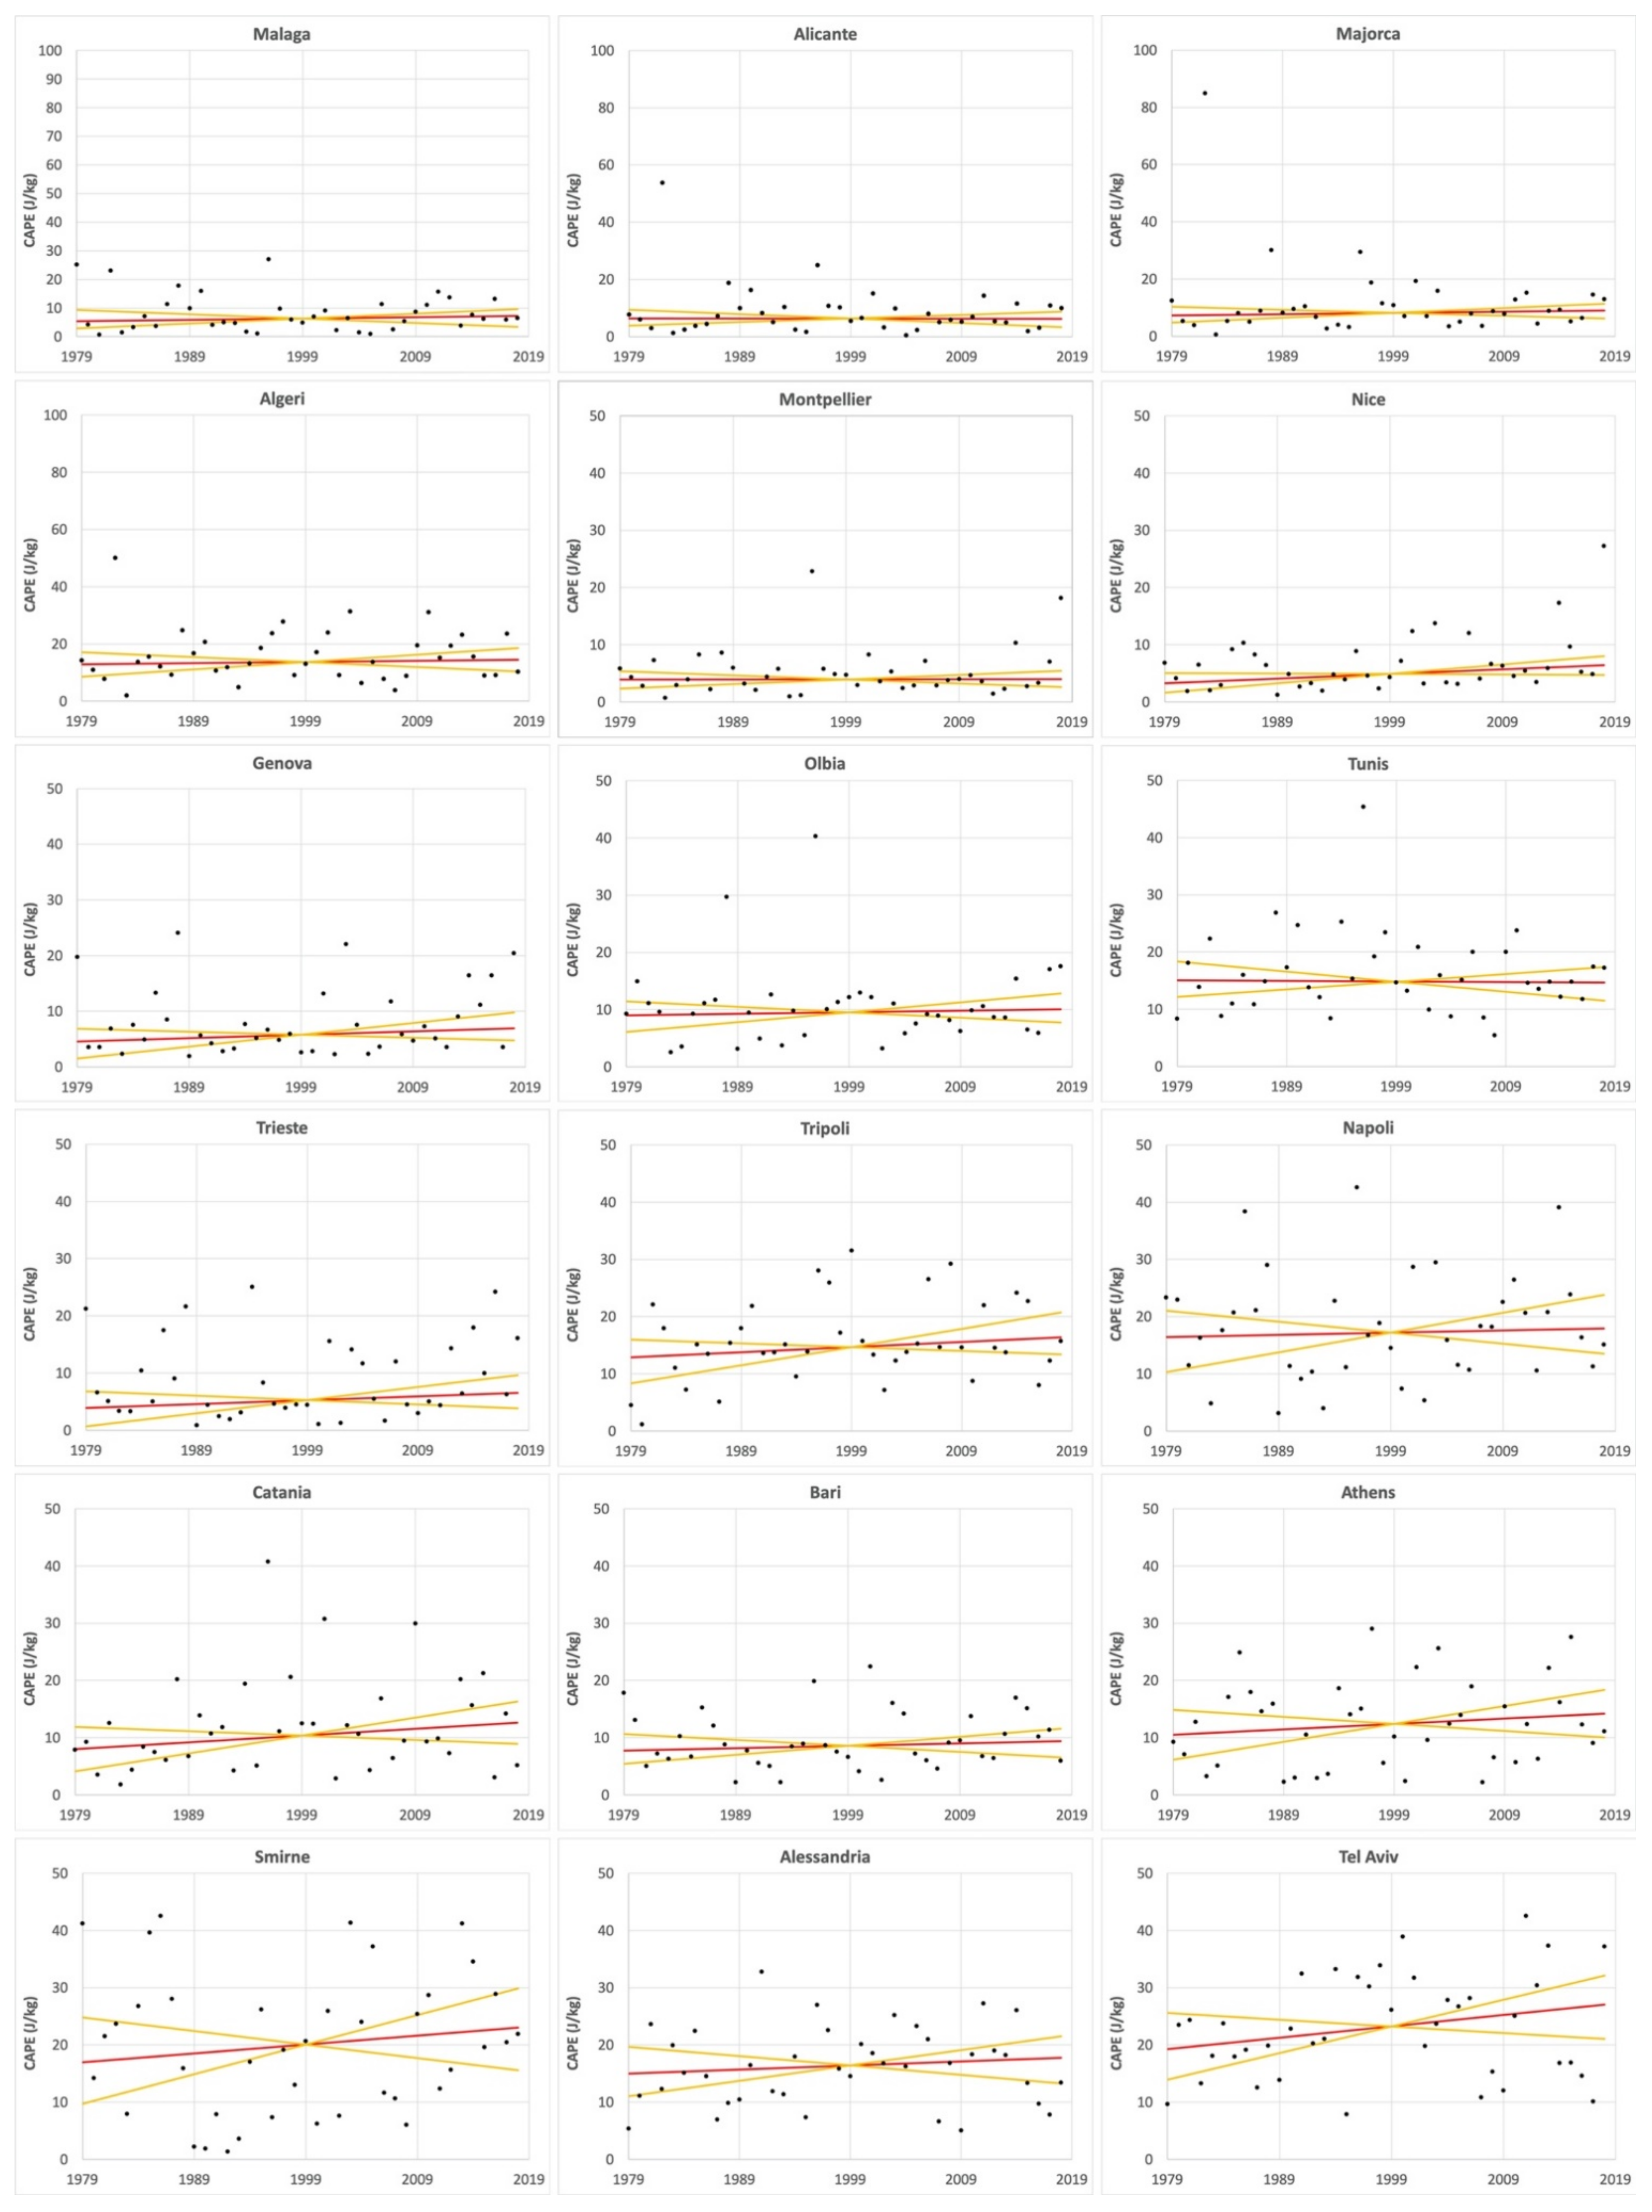
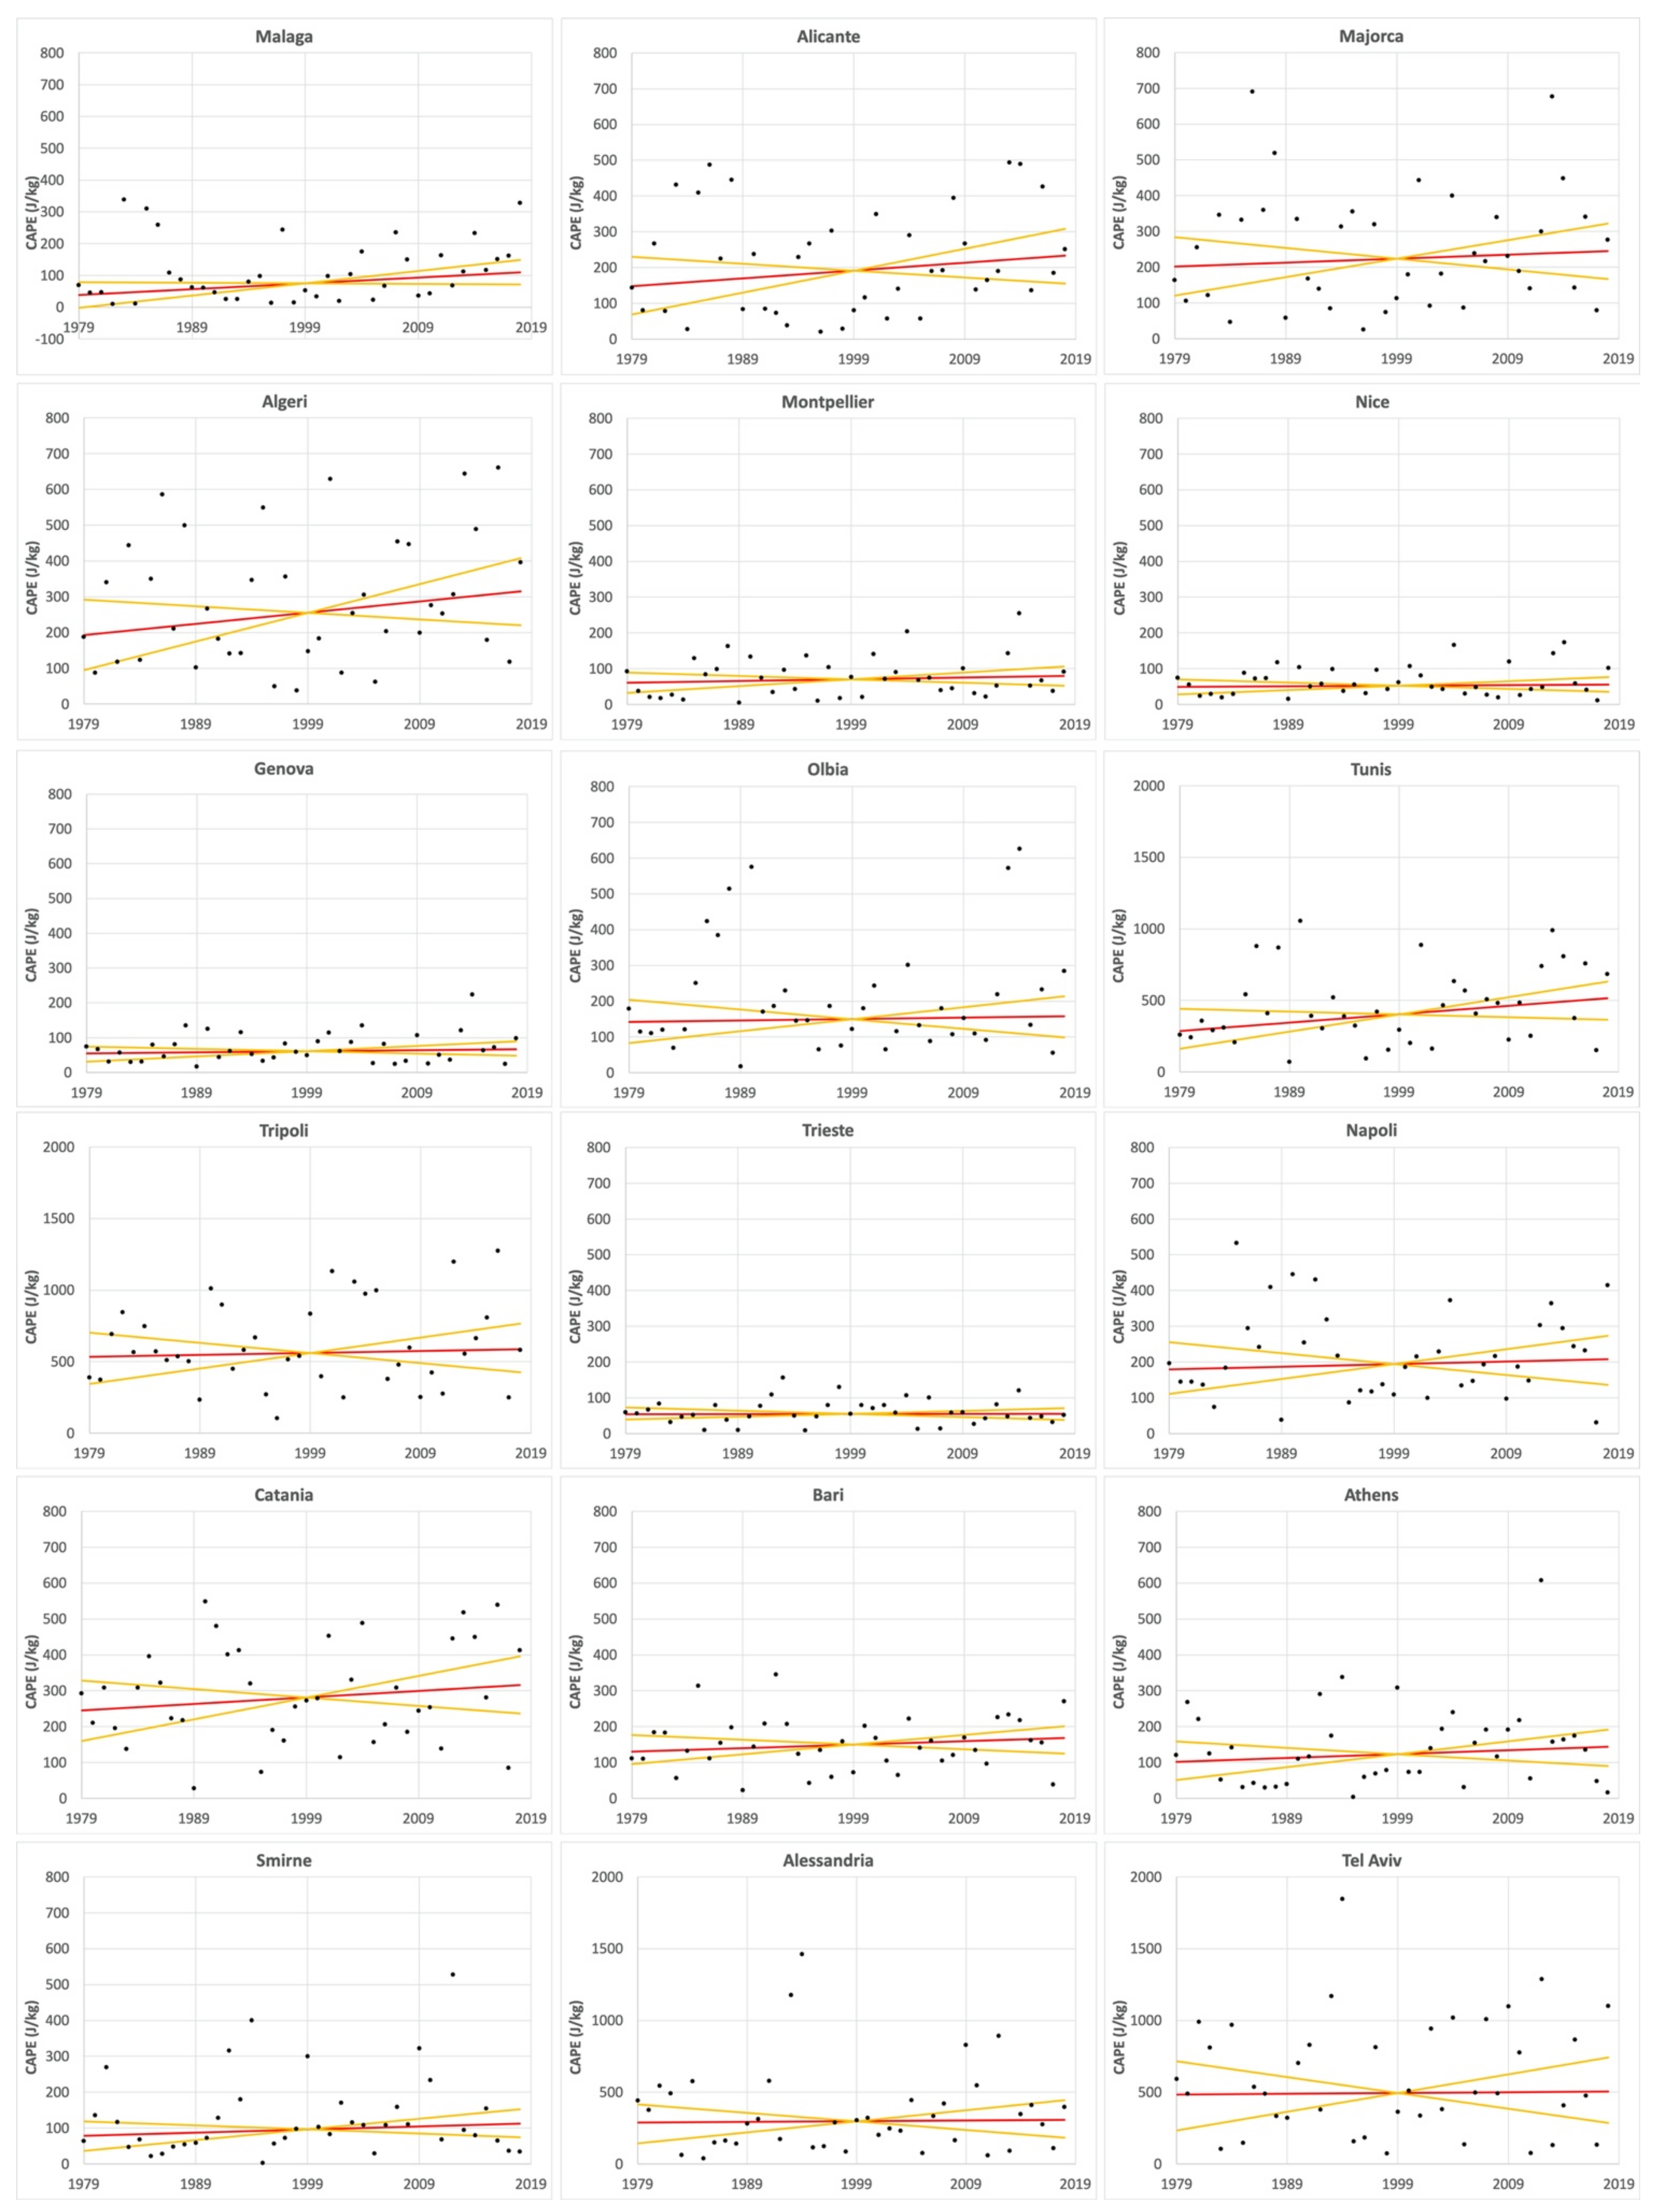
In this research, the 40-year period between 1979 and 2018 was investigated. Both on the ground geo-hydrological events and CAPE (Convective Available Potential Energy) and TCWV (Total Content in Water Vapor) climatological variables were analysed, with the aim of probing possible trends, supporting further climate studies and providing adaptation policies. CAPE and TCWV variables are two important severe weather indicators as they capture two important ingredients for severe weather occurrence, namely instability and moisture availability. CAPE is directly related to the atmospheric instability and thus to the maximum potential vertical speed within an updraft; thus, higher values indicate greater potential for severe weather, and observed values in thunderstorm environments may often exceed 1000 joules per kilogram (J/kg), and in extreme cases may exceed 5000 J/kg. The availability of significant TCWV amounts, together with atmospheric stability indices such as CAPE, provides a good indicator for severe weather phenomena [
13]. Although the TCWV does not represent the vertical structure of moisture, it describes horizontal gradients of integrated water vapour content. Therefore, the TCWV is one of the critical variables used by forecasters when severe weather conditions are expected [
14]. Statistical techniques have been used to spatially analyse the satellite-collected monthly time series of CAPE and TCWV values, which are correlated with extreme rain events.
4. Discussion
The results from the analysis of geo-hydrological events and CAPE and TCWV data trends looks consistent with analyses of precipitation conducted by other authors: the events being the ground effect or consequence of the CAPE and TCWV meteorological instability indicators. Caloiero et al. [
46] studied globally gridded precipitation data sets of monthly observations with spatial resolutions of 0.5° longitude/latitude and they found interesting results for the Mediterranean area: yearly results revealed a marked negative rainfall trend in the eastern Mediterranean (more than −20 mm/10 years) and in North Africa (up to −16 mm/10 years), while a relatively large positive trend (more than 20 mm/10 years) occurred in central and northern Europe.
Along similar lines, Hatzianastassiou et al. [
47] investigated the precipitation regimes and patterns over the Mediterranean area for the period 1979–2010 using monthly mean satellite data from the Global Precipitation Climatology Project (GPCPv2). They found that while the mean annual precipitation averaged over the study area was 593 ± 203 mm year
−1, it exhibited a strong spatial variability ranging from 20 mm year
−1 (North Africa) to 1500 mm year
−1 (Alps). Furthermore, the early winter and late autumn months (November and December) were the wettest months, with precipitation amounts larger than 60 mm month
−1.
Moreover, regarding extreme rainfall events, Benabdelouahab et al. [
48] characterized daily rainfall amounts greater than the 95 and 99 quantiles, using the African Rainfall Climatology Version 2 (ARC2, 0.1° × 0.1°, 1983–2020) over north-western Africa and southern Spain, and revealed an annual increase of indicator values of rainfall extreme events, that were still spatial-temporally concentrated. For the other side (eastern Mediterranean) Kostopolou and Jones [
49] computed several seasonal and annual climate extreme indices to identify possible changes in temperature- and precipitation-related climate extremes for the period 1958–2000. The western part of the study region, which comprises the central Mediterranean and is represented by Italian stations, showed significant positive trends towards intense rainfall events and greater amounts of precipitation. In contrast, the eastern half showed negative trends in all precipitation indices indicating drier conditions until 2000.
Philandras et al. [
50] studied the trends and the variability of annual precipitation totals and annual rain days over land within the Mediterranean region from 40 meteorological stations in the Mediterranean region. They found statistically significant (95% confidence level) negative trends of the annual precipitation totals existed in most Mediterranean regions during the period 1901–2009, with the exception of northern Africa, southern Italy and the western Iberian Peninsula. Interestingly, the annual number of rain days showed a pronounced decrease of 20%, statistically significant (95% confidence level) in representative meteorological stations of the east Mediterranean, while the trends are insignificant for the west and central Mediterranean.
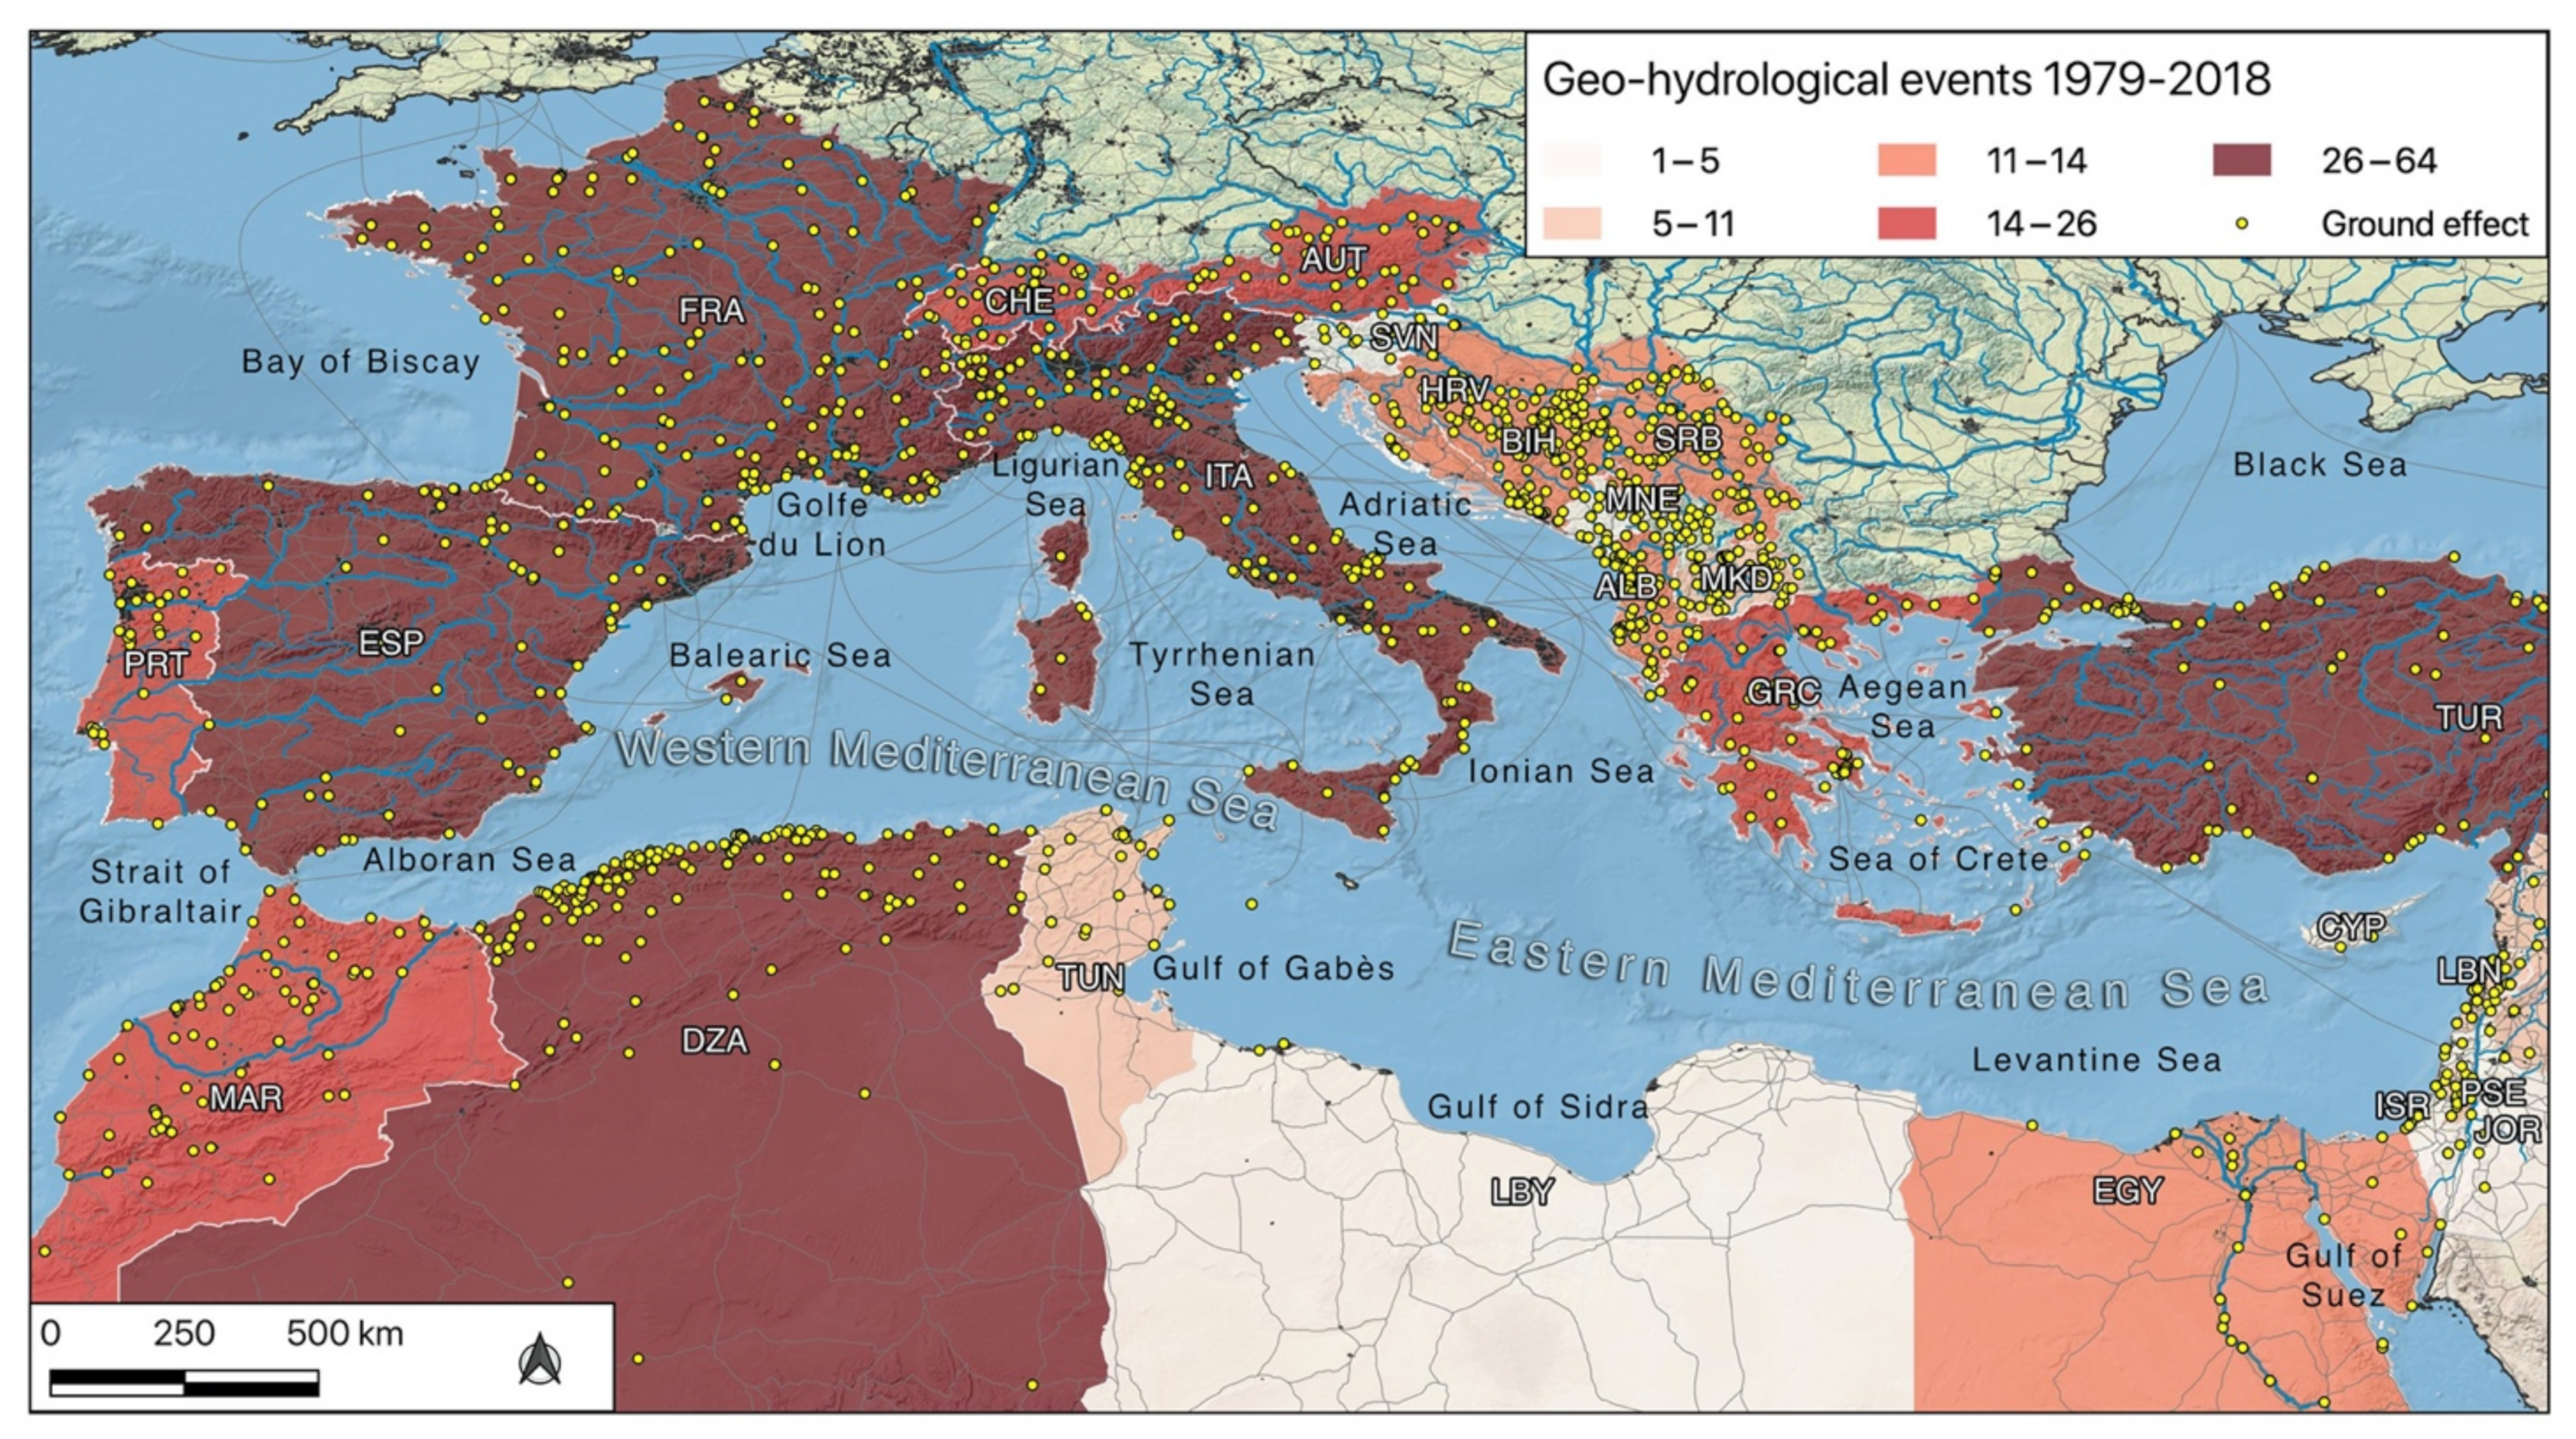
The geo-hydrological events that affected the Mediterranean area between 1979 and 2018, and the trends in CAPE and TCWV mean values for 100 km2 areas, appear coherent: both have been increasing through the entire period over large areas. The statistically significative increases in CAPE and TCWV values show some minor feature differences: spatially and marginally so, even seasonally.
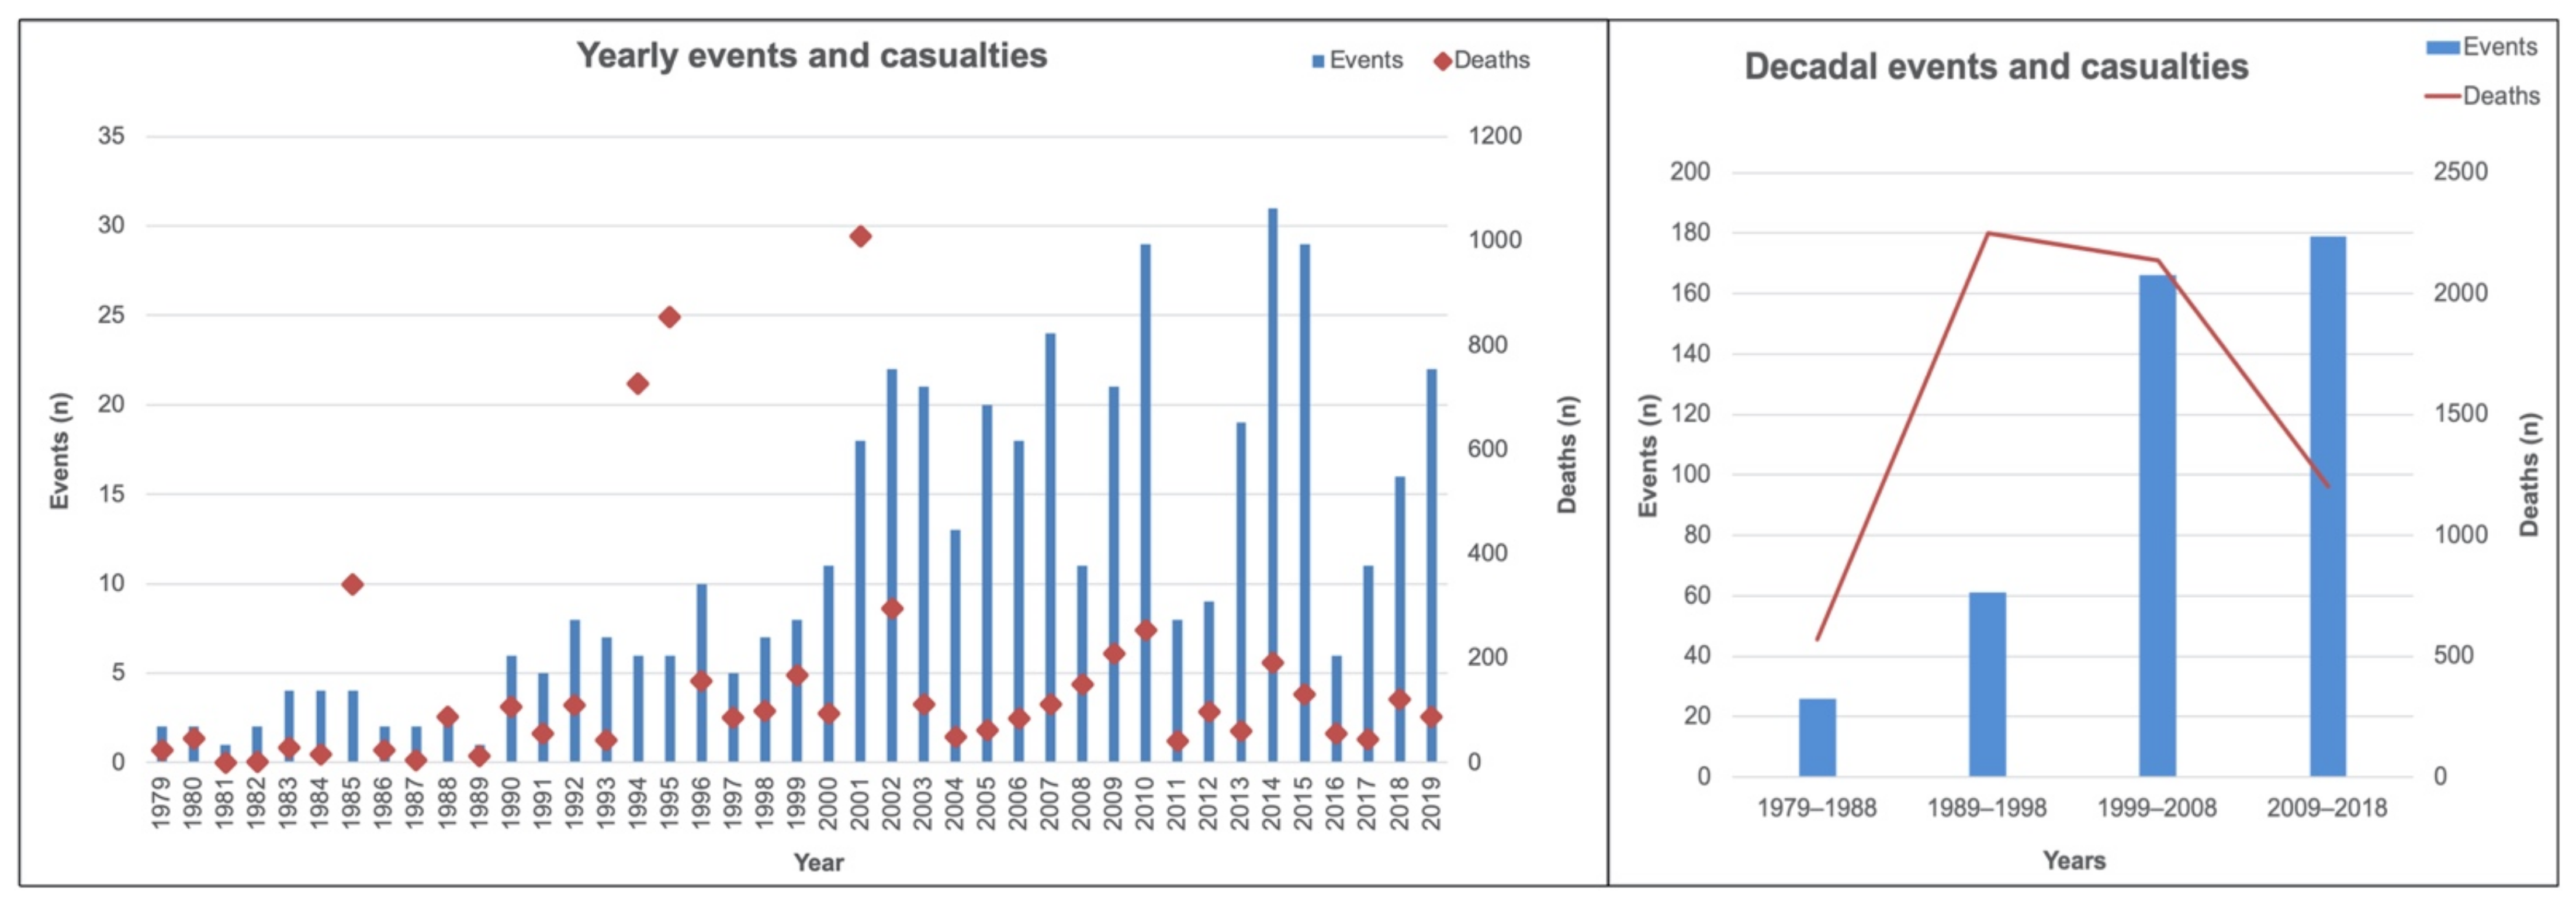
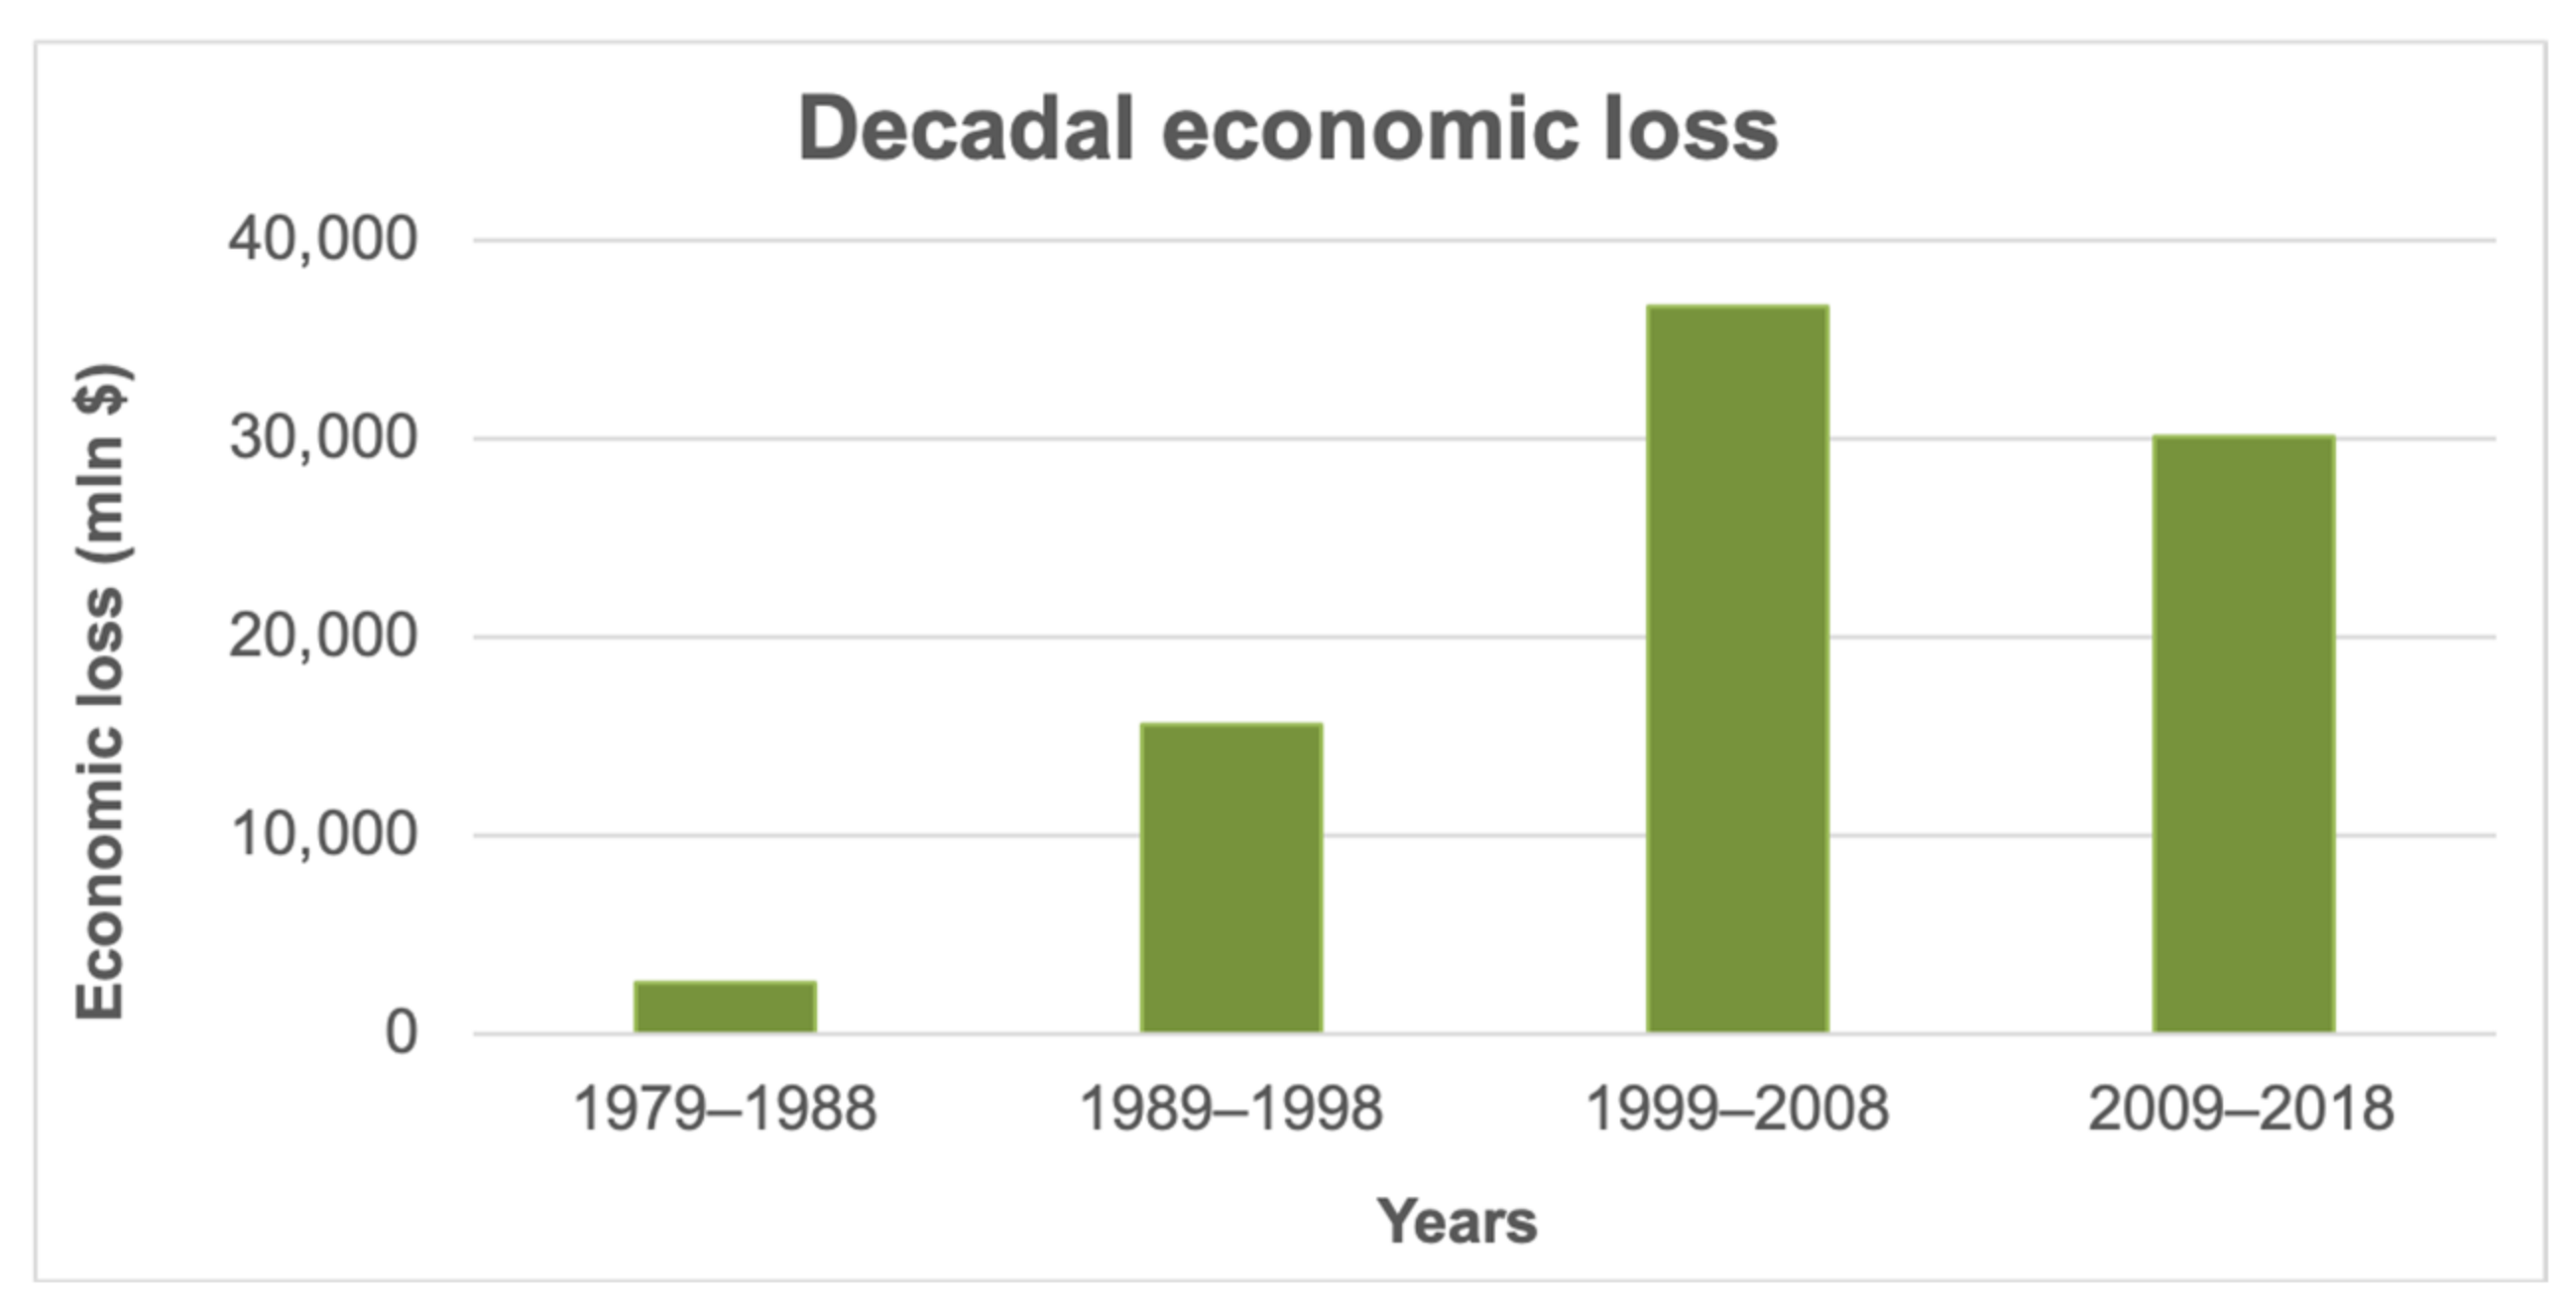
Despite a possibly not perfectly homogeneous and incomplete recording of past geo-hydrological events in the EM-DAT database [
51], the differences between the first 20 years and the next 20 is strong and is about four times greater (
Figure 4). Besides, the monthly data (
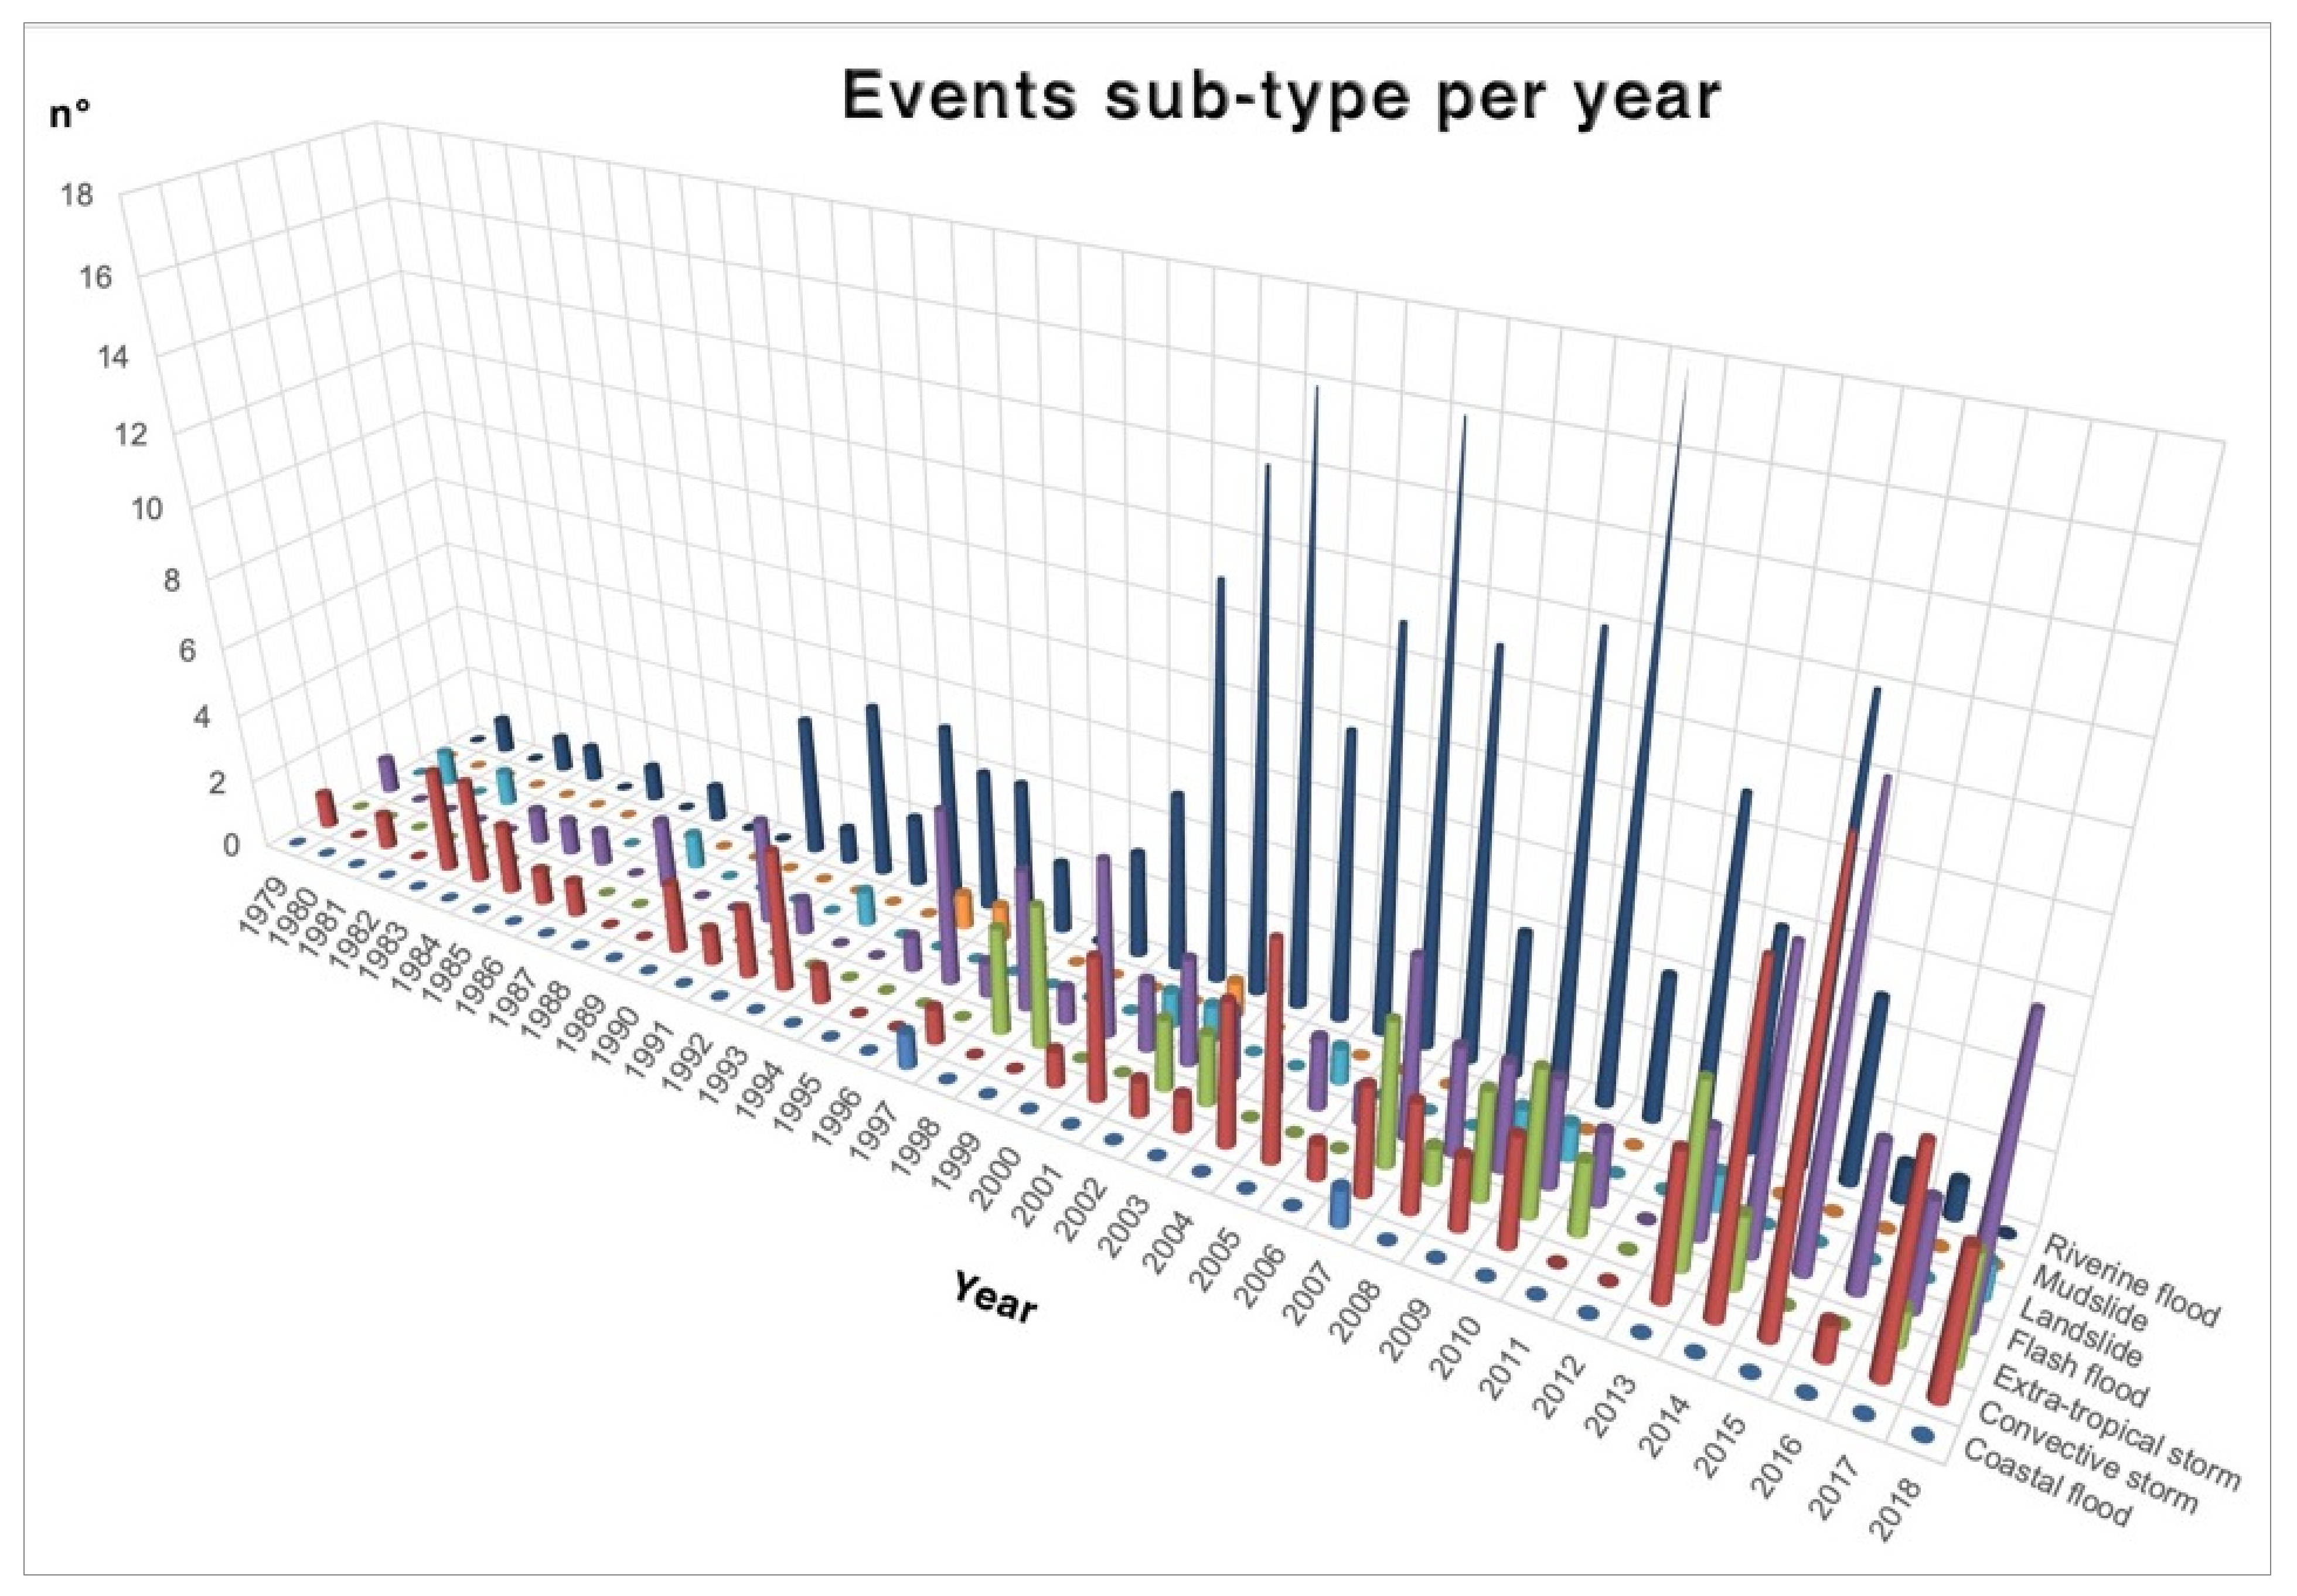
Table 1) show how, starting from around the year 2000, events occurred in every season and even more than once per month. Further, the increase in numbers of events, which appears to have progressively accelerated in the early three decades, is shared by the majority of sub-types events (
Figure 3). The lack of increase in landslides count may be explained by the event type: diffuse small shallow landslides were not included in the database. In fact, it contains only large events that caused extensive damage and even casualties. Including rain-triggered shallow landslides could change this result, as their incidence has been frequent in some areas as testified by many authors [
52,
53,
54,
55,
56,
57,
58,
59,
60,
61] but obtaining homogeneous and precise data for the whole Mediterranean area for the whole period is quite difficult.
Southern Mediterranean Sea countries have been subjected to some large scale and high impact events, while the northern Mediterranean countries have been subjected to a higher number of events, each causing fewer casualties. This disparity could be partially due to some event differences: on one hand, the large floods of the River Nile in November 1994, the large storm that hit the Moroccan Atlas Mountains in August 1995 [
62] coupled to geomorphic predisposing conditions, the cyclonic storm in November 2001 that hit Algeria and, on the other, several more localized events hitting the European countries [
63,
64,
65,
66]. Notwithstanding this, land use and vulnerability conditions have probably played an important role in this differentiation between the North African countries and the European ones. Large European territories suffer for a high percentage of soil sealing and for the lack of proper risk mitigation measures [
67,
68,
69,
70,
71], which influence the impact of severe events. Nevertheless, the different economic conditions of north African territories cause a further planning inadequacy [
72,
73] for land usage, exposing them to a high geo-hydrologic risk.
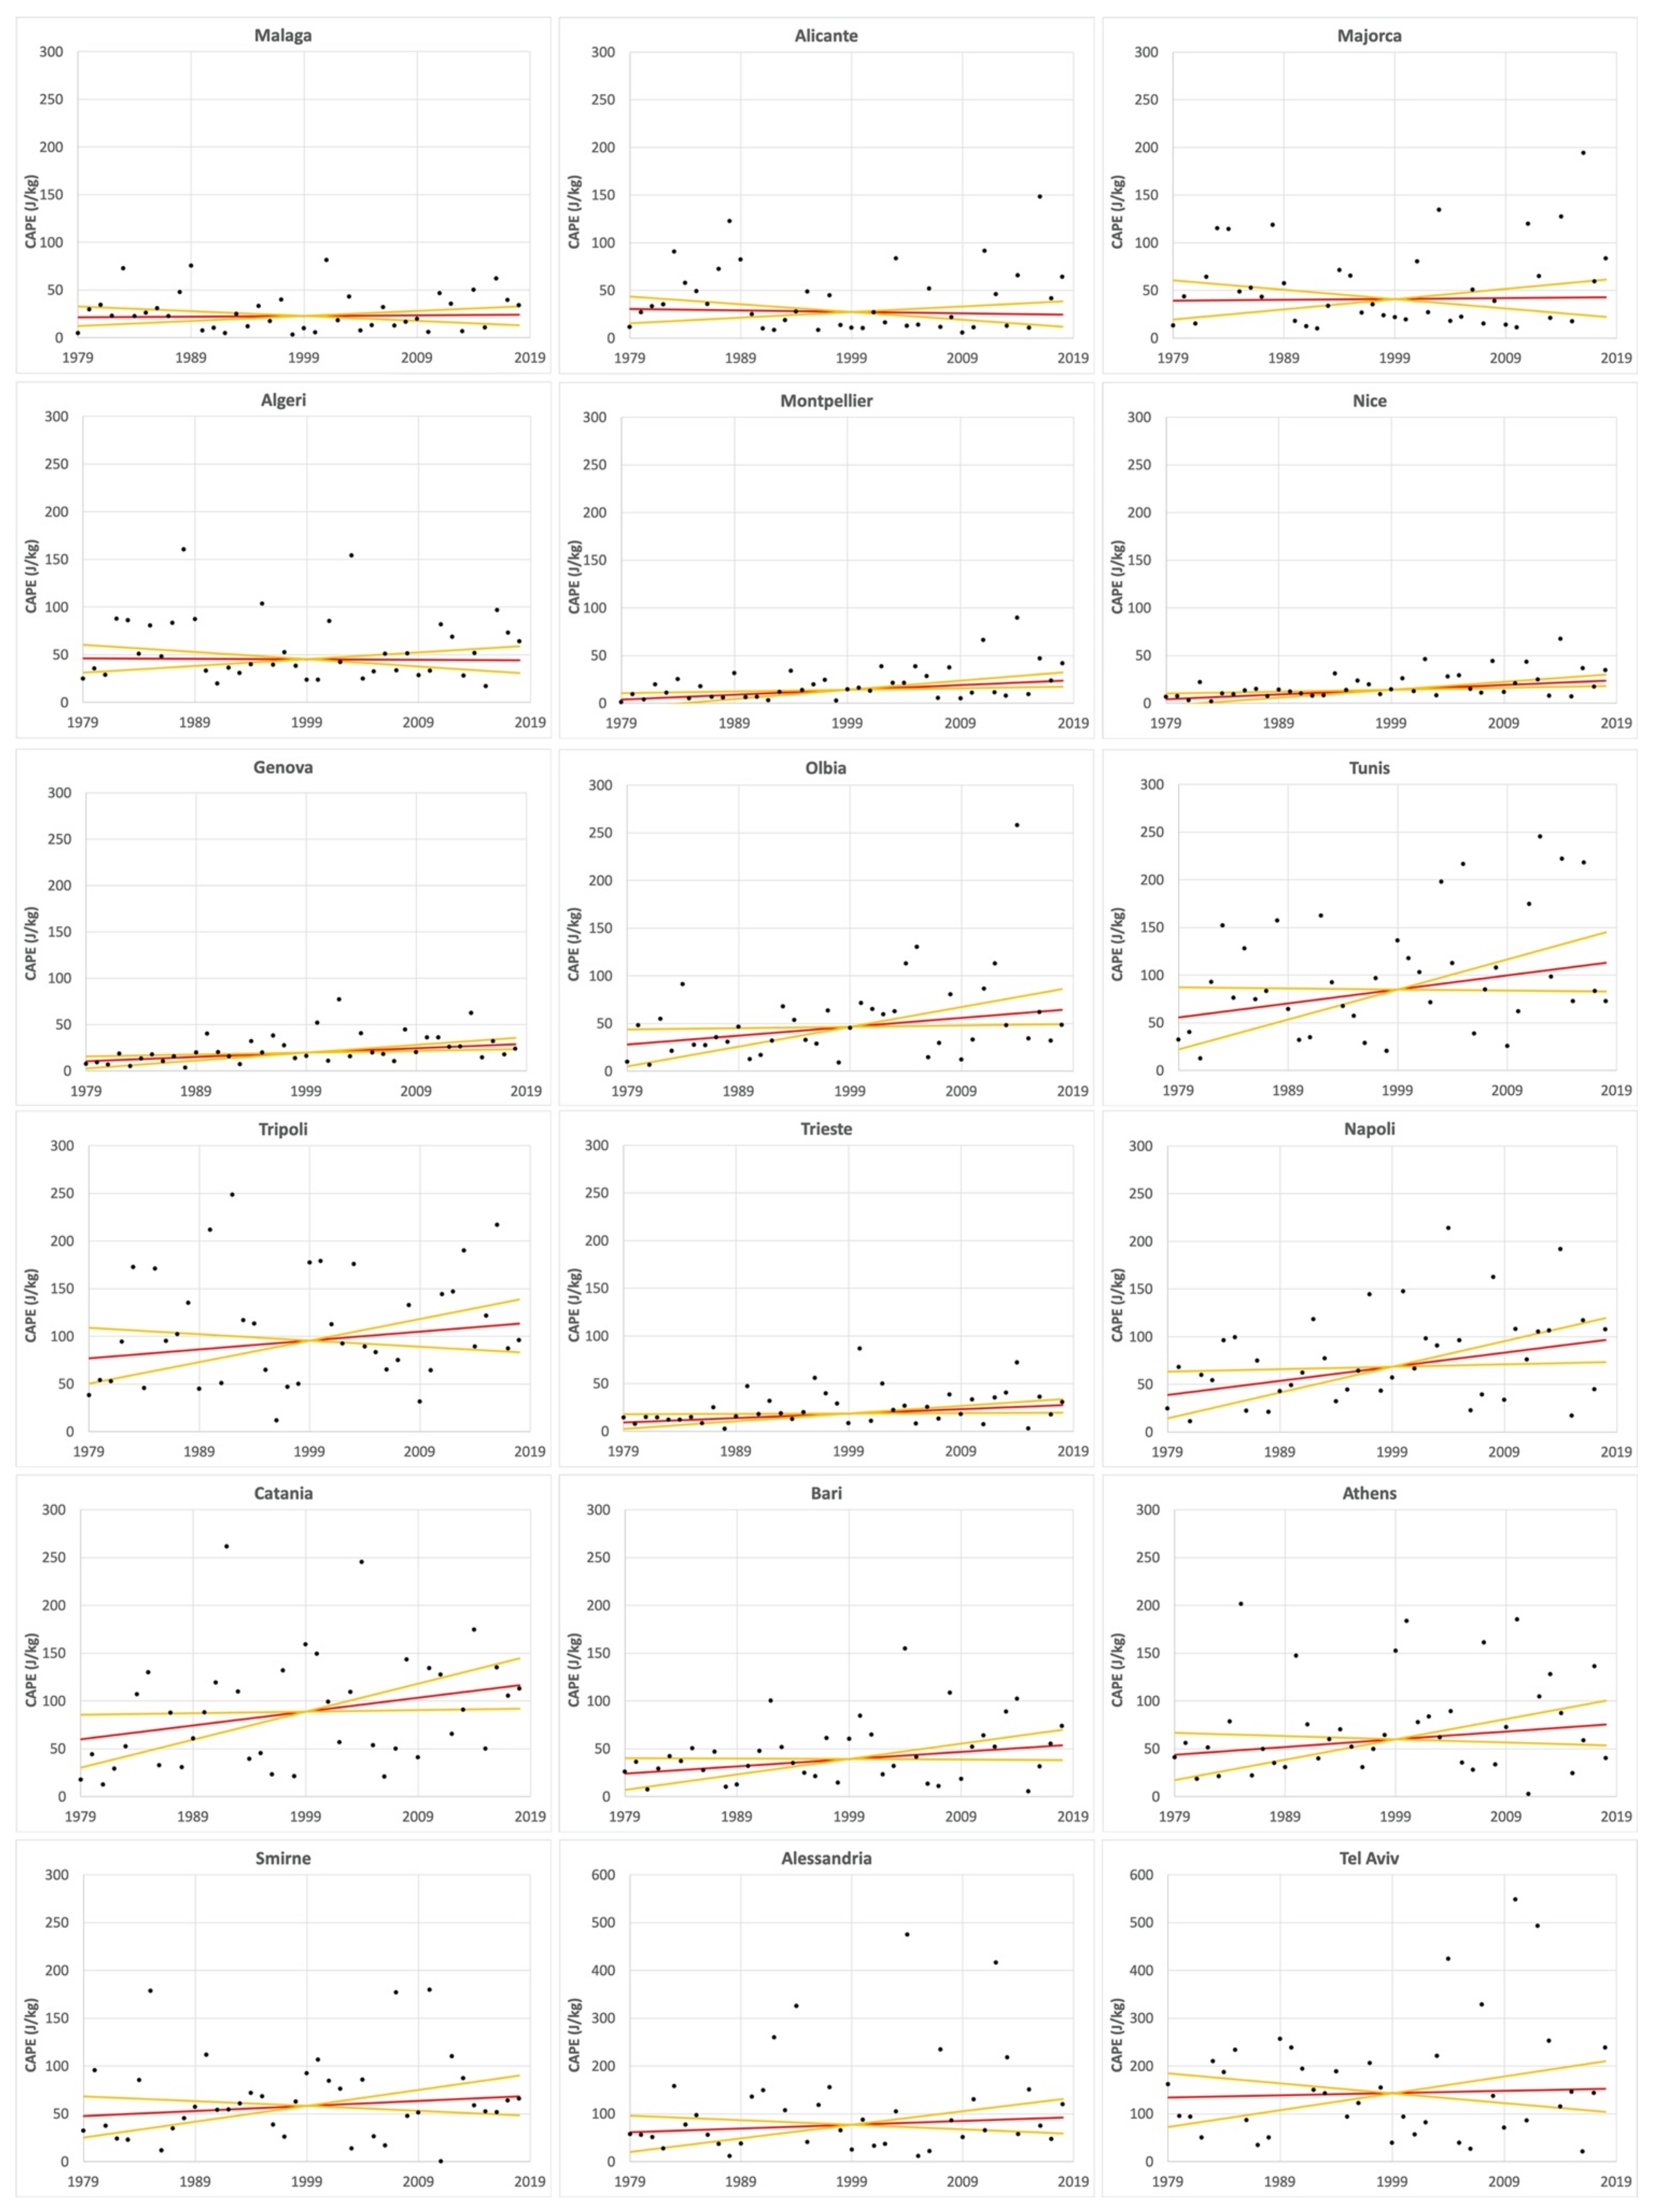
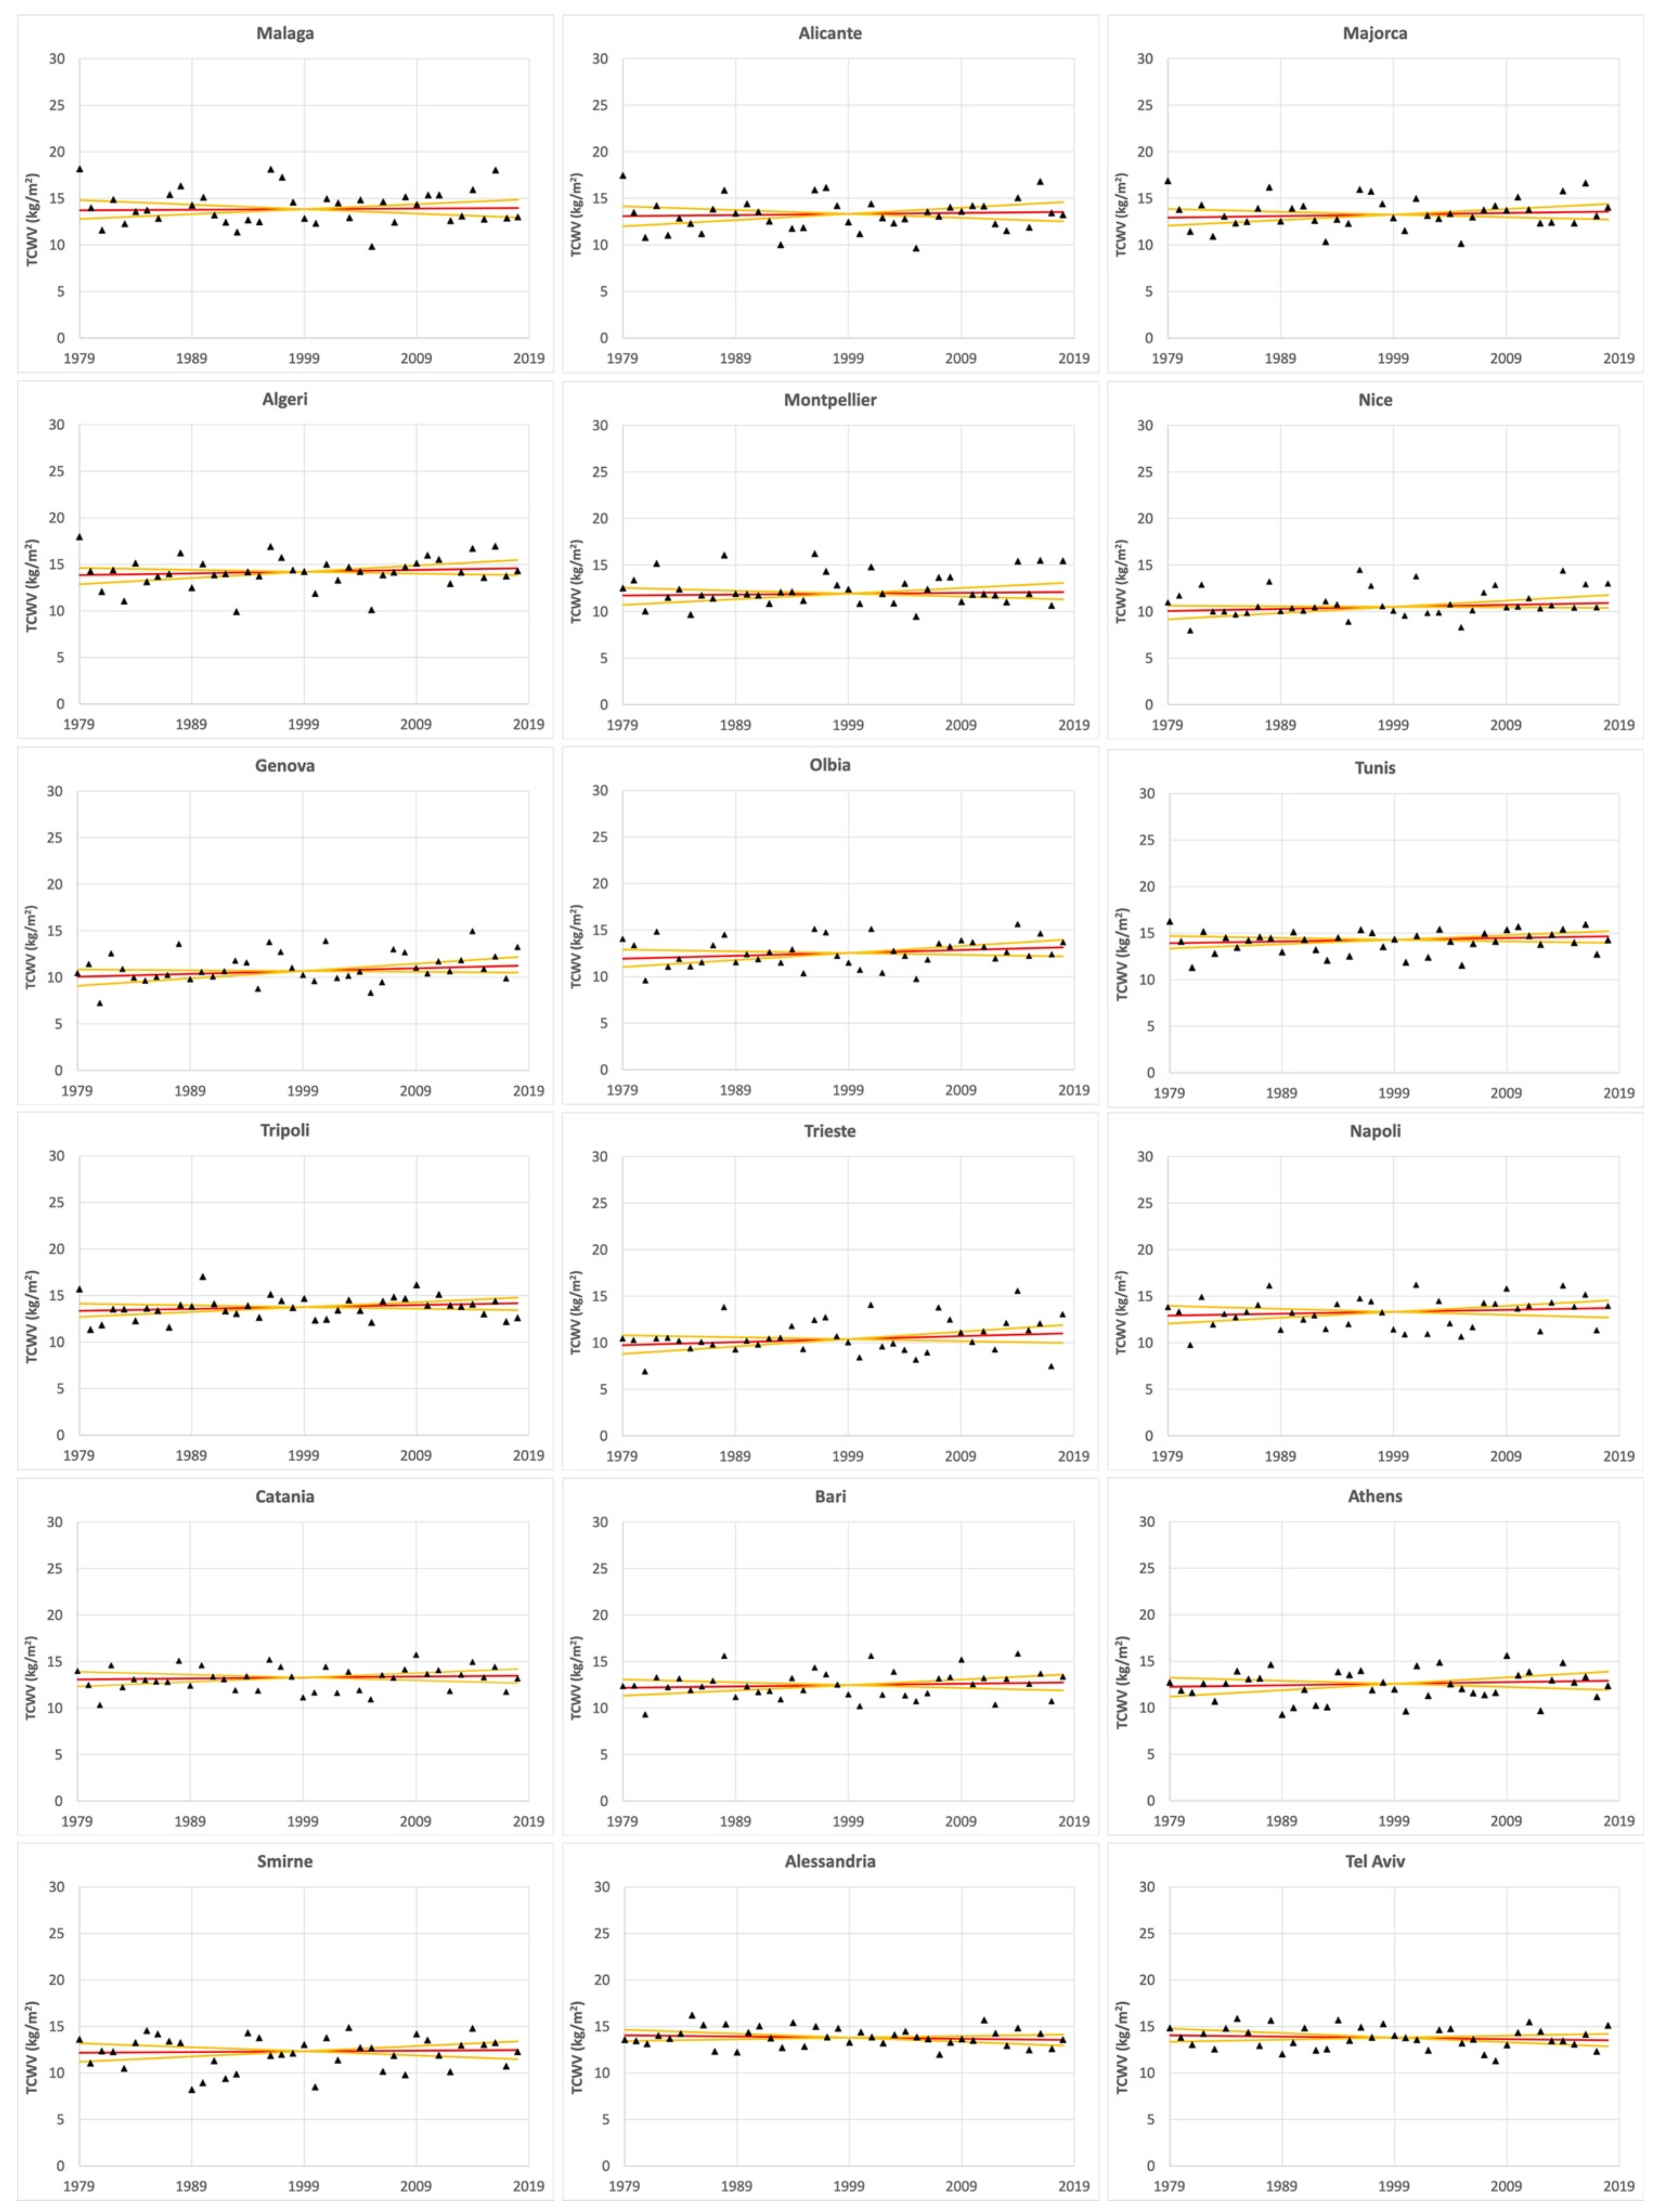
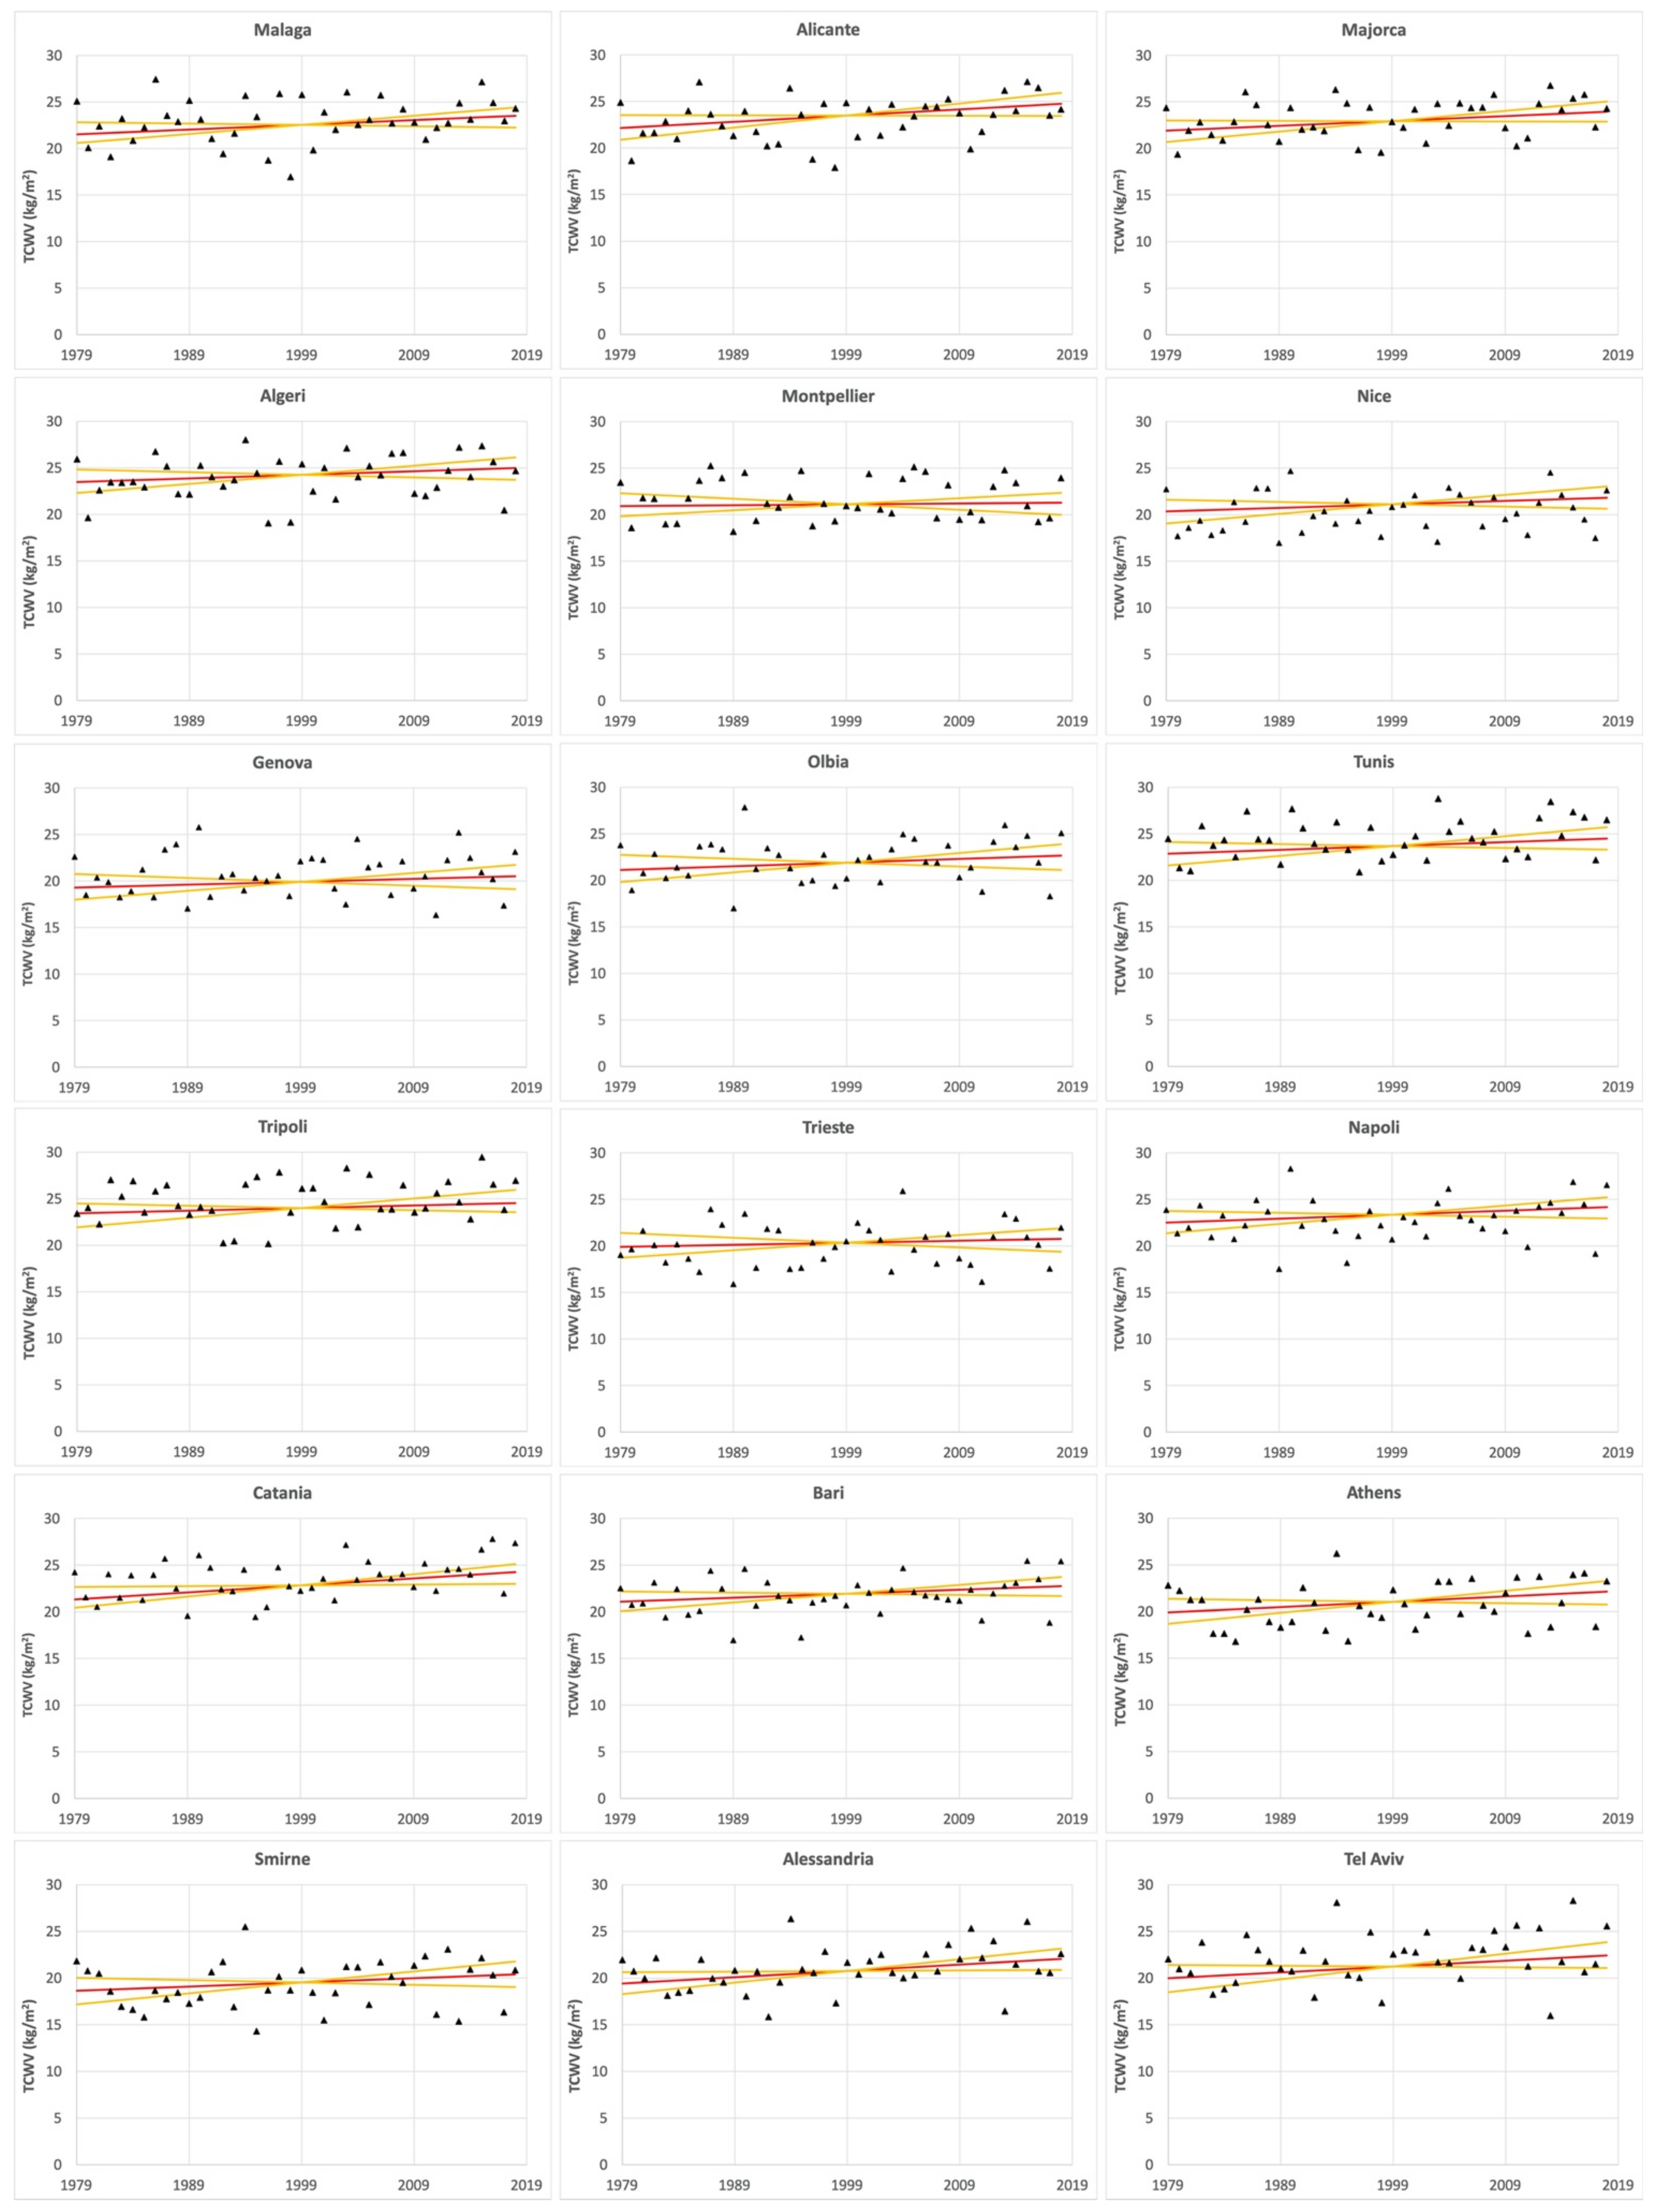
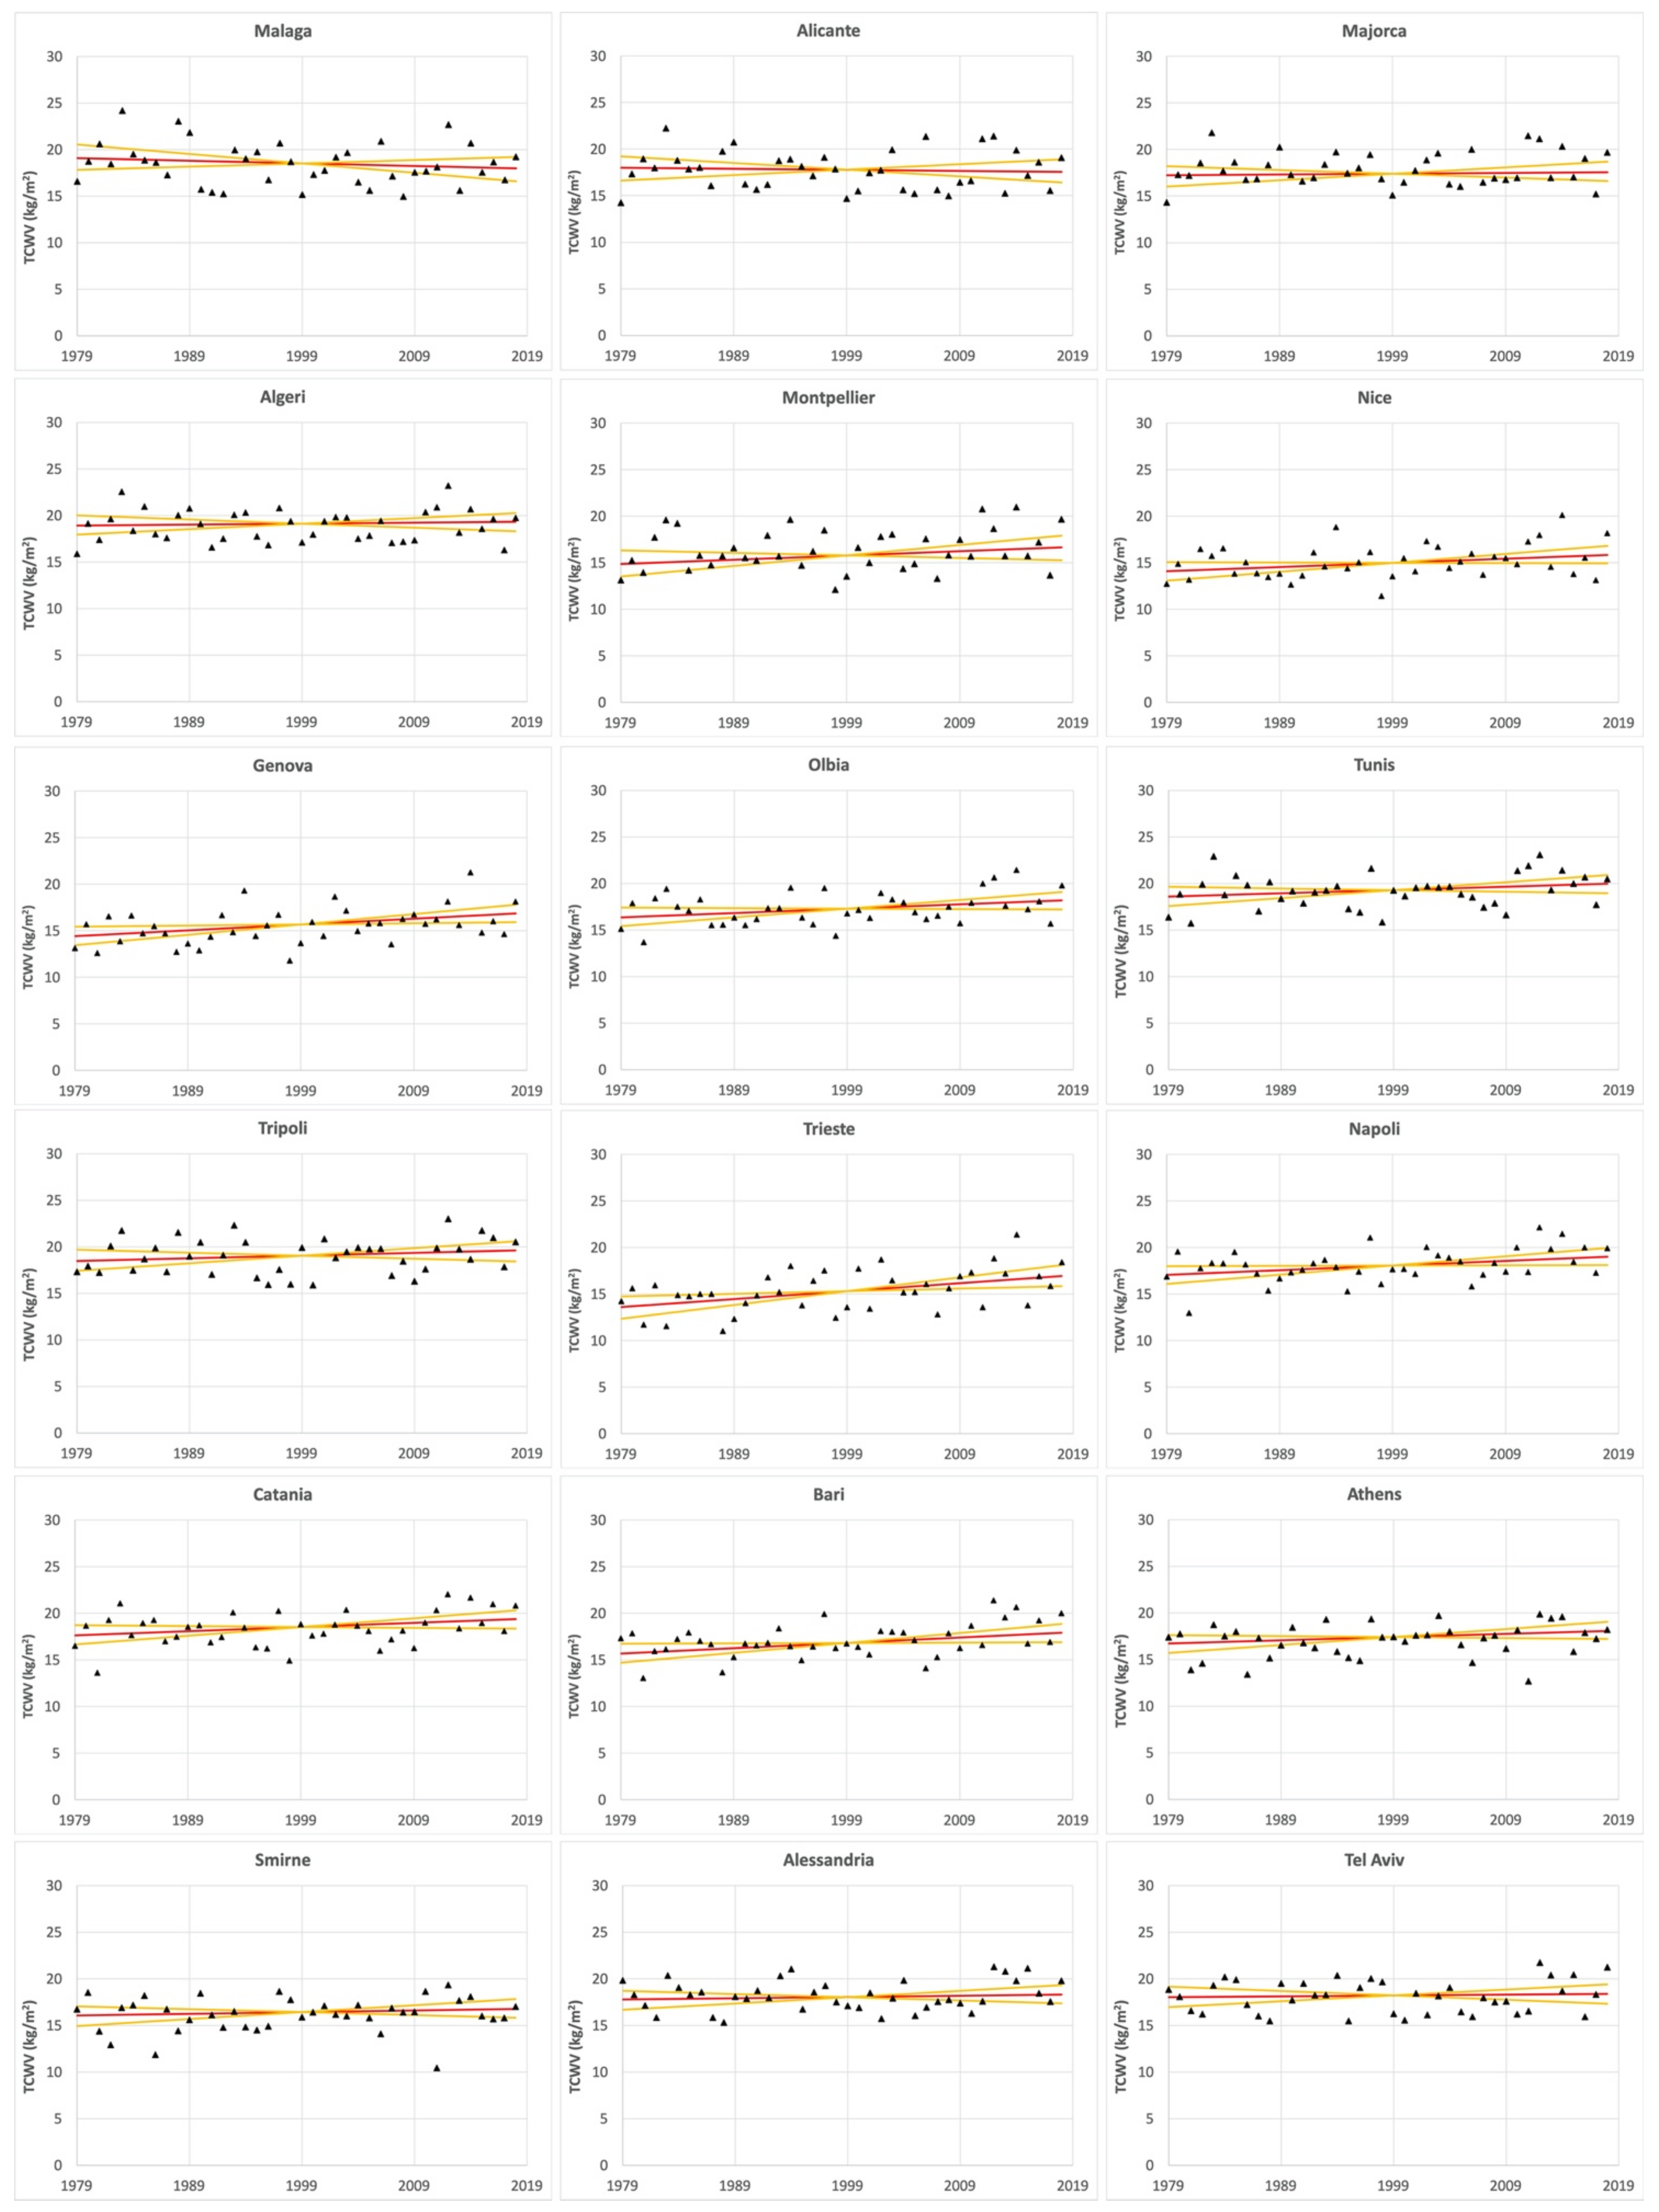
Most of the recorded events happened in January, November, October, and December. Throughout these months, the CAPE and TCWV time data series showed increasing trends (
Table 7,
Table 8 and
Table 9), although only in some cases with statistical significance. In January and December, the lack of a Mann–Kendall statistically significant trend for CAPE and TCWV values is accompanied by quite widespread persistence marks, as evidenced by the high values for the Hurst exponent in areas often hit by geo-hydrological events: Genova, Nice and Catania for CAPE values both in January and December. Besides, persistence characterizes most of the CAPE series in December. Further, in November, when many highly damaging events happened diffusively along the western and southern Italian coastlines and the French Riviera, the CAPE series showed statically significant positive trends in Montpellier, Nice, Genova, Olbia, Trieste, Napoli, and Catania. Strong persistence is present in the same series and more diffusively in others in the Western Mediterranean area. Similar features are recorded by the TCWV series, but for a more limited series: Genova, Trieste, Napoli, and Bari. In October, persistence was recorded in only some series. In summary, in January (
Table 7) statistically insignificant trends in the CAPE values are present for the central and eastern Mediterranean, with many series being quite dispersed and, in some cases, accompanied by persistency. The same behaviour appears for the TCWV values but limited to the central Mediterranean. In October (
Table 8), the increasing trend in the CAPE values is limited to the western Mediterranean and is still not statistically significant, while the TCWV data looks to be increasing all over the studied cities with some significant and persistence features. November (
Table 9) shows the highest degree of concordance between the trend in CAPE and TCWV values: the central Mediterranean cities appear to be affected by increasing significant trends and persistence features.
This behaviour may be interpreted as a tendency for geo-hydrological intense events predisposing factors, as suggested by other researchers [
74]. In fact, the high intensity precipitative phenomena are mostly linked to the contrast between the warm sea surface and cold air masses coming from outside the Mediterranean, which usually happens in October and November. The detected trends could suggest the extension of these conditions to December and January, as a possible consequence of increasing sea surface temperatures, whose trend has been documented by many researchers [
75,
76,
77,
78,
79]. Besides, these features are consistent with the increasing extreme precipitations evidenced by other authors [
49,
50].
Considering the geo-hydrological events grouped by decade (
Table 10), increasing numbers of events occurred in the French Mediterranean area from September through December after the year 2000 (
Table 10), as recorded in the EM–DAT database: the increasing numbers of events are coherent with the trend in CAPE values in November (
Table 9), and the associated persistency that extends to the Ligurian Sea coastline. Again, in November, the increasing trends in CAPE values for cities belonging to the southern Tyrrhenian Sea and to the Ionian Sea are consistent with the high numbers of events (11) registered for south Italy (
Table 10), with an increasing frequency starting from the year 2000.
In the Balkan area, event occurrence is quite evenly distributed over the year, but it is higher between November and February, and the increase has been substantial since the year 2000 (
Table 10). Besides, it must be noted that no event is present in the database before the year 1999 for that area, suggesting a possible lack in the database.
Considering the Eastern Mediterranean area, the highest incidence in Greece is between October and November, in Turkey between May and August, and in the coastal Middle East countries, between December and February (
Table 10). The event increase in all these areas, during the study period, is quite evident. Regarding the far eastern area, the trends in TCWV values, the series persistence and the CAPE series persistence are consistent with the increase in numbers of geo-hydrological events for Smirne in summer; for the rest of studied Middle East cities, the increasing numbers of events occurring in January and February seems not related to CAPE nor to TCWV trends or persistence.
The Western area, including Spain, Portugal, Morocco, Algeria and Tunisia is characterized by a substantial increase in number of events, between the first two decades and the second two (
Table 10); the maximum number is in fall and early winter. This trend is consistent with the CAPE series persistence from September through December.
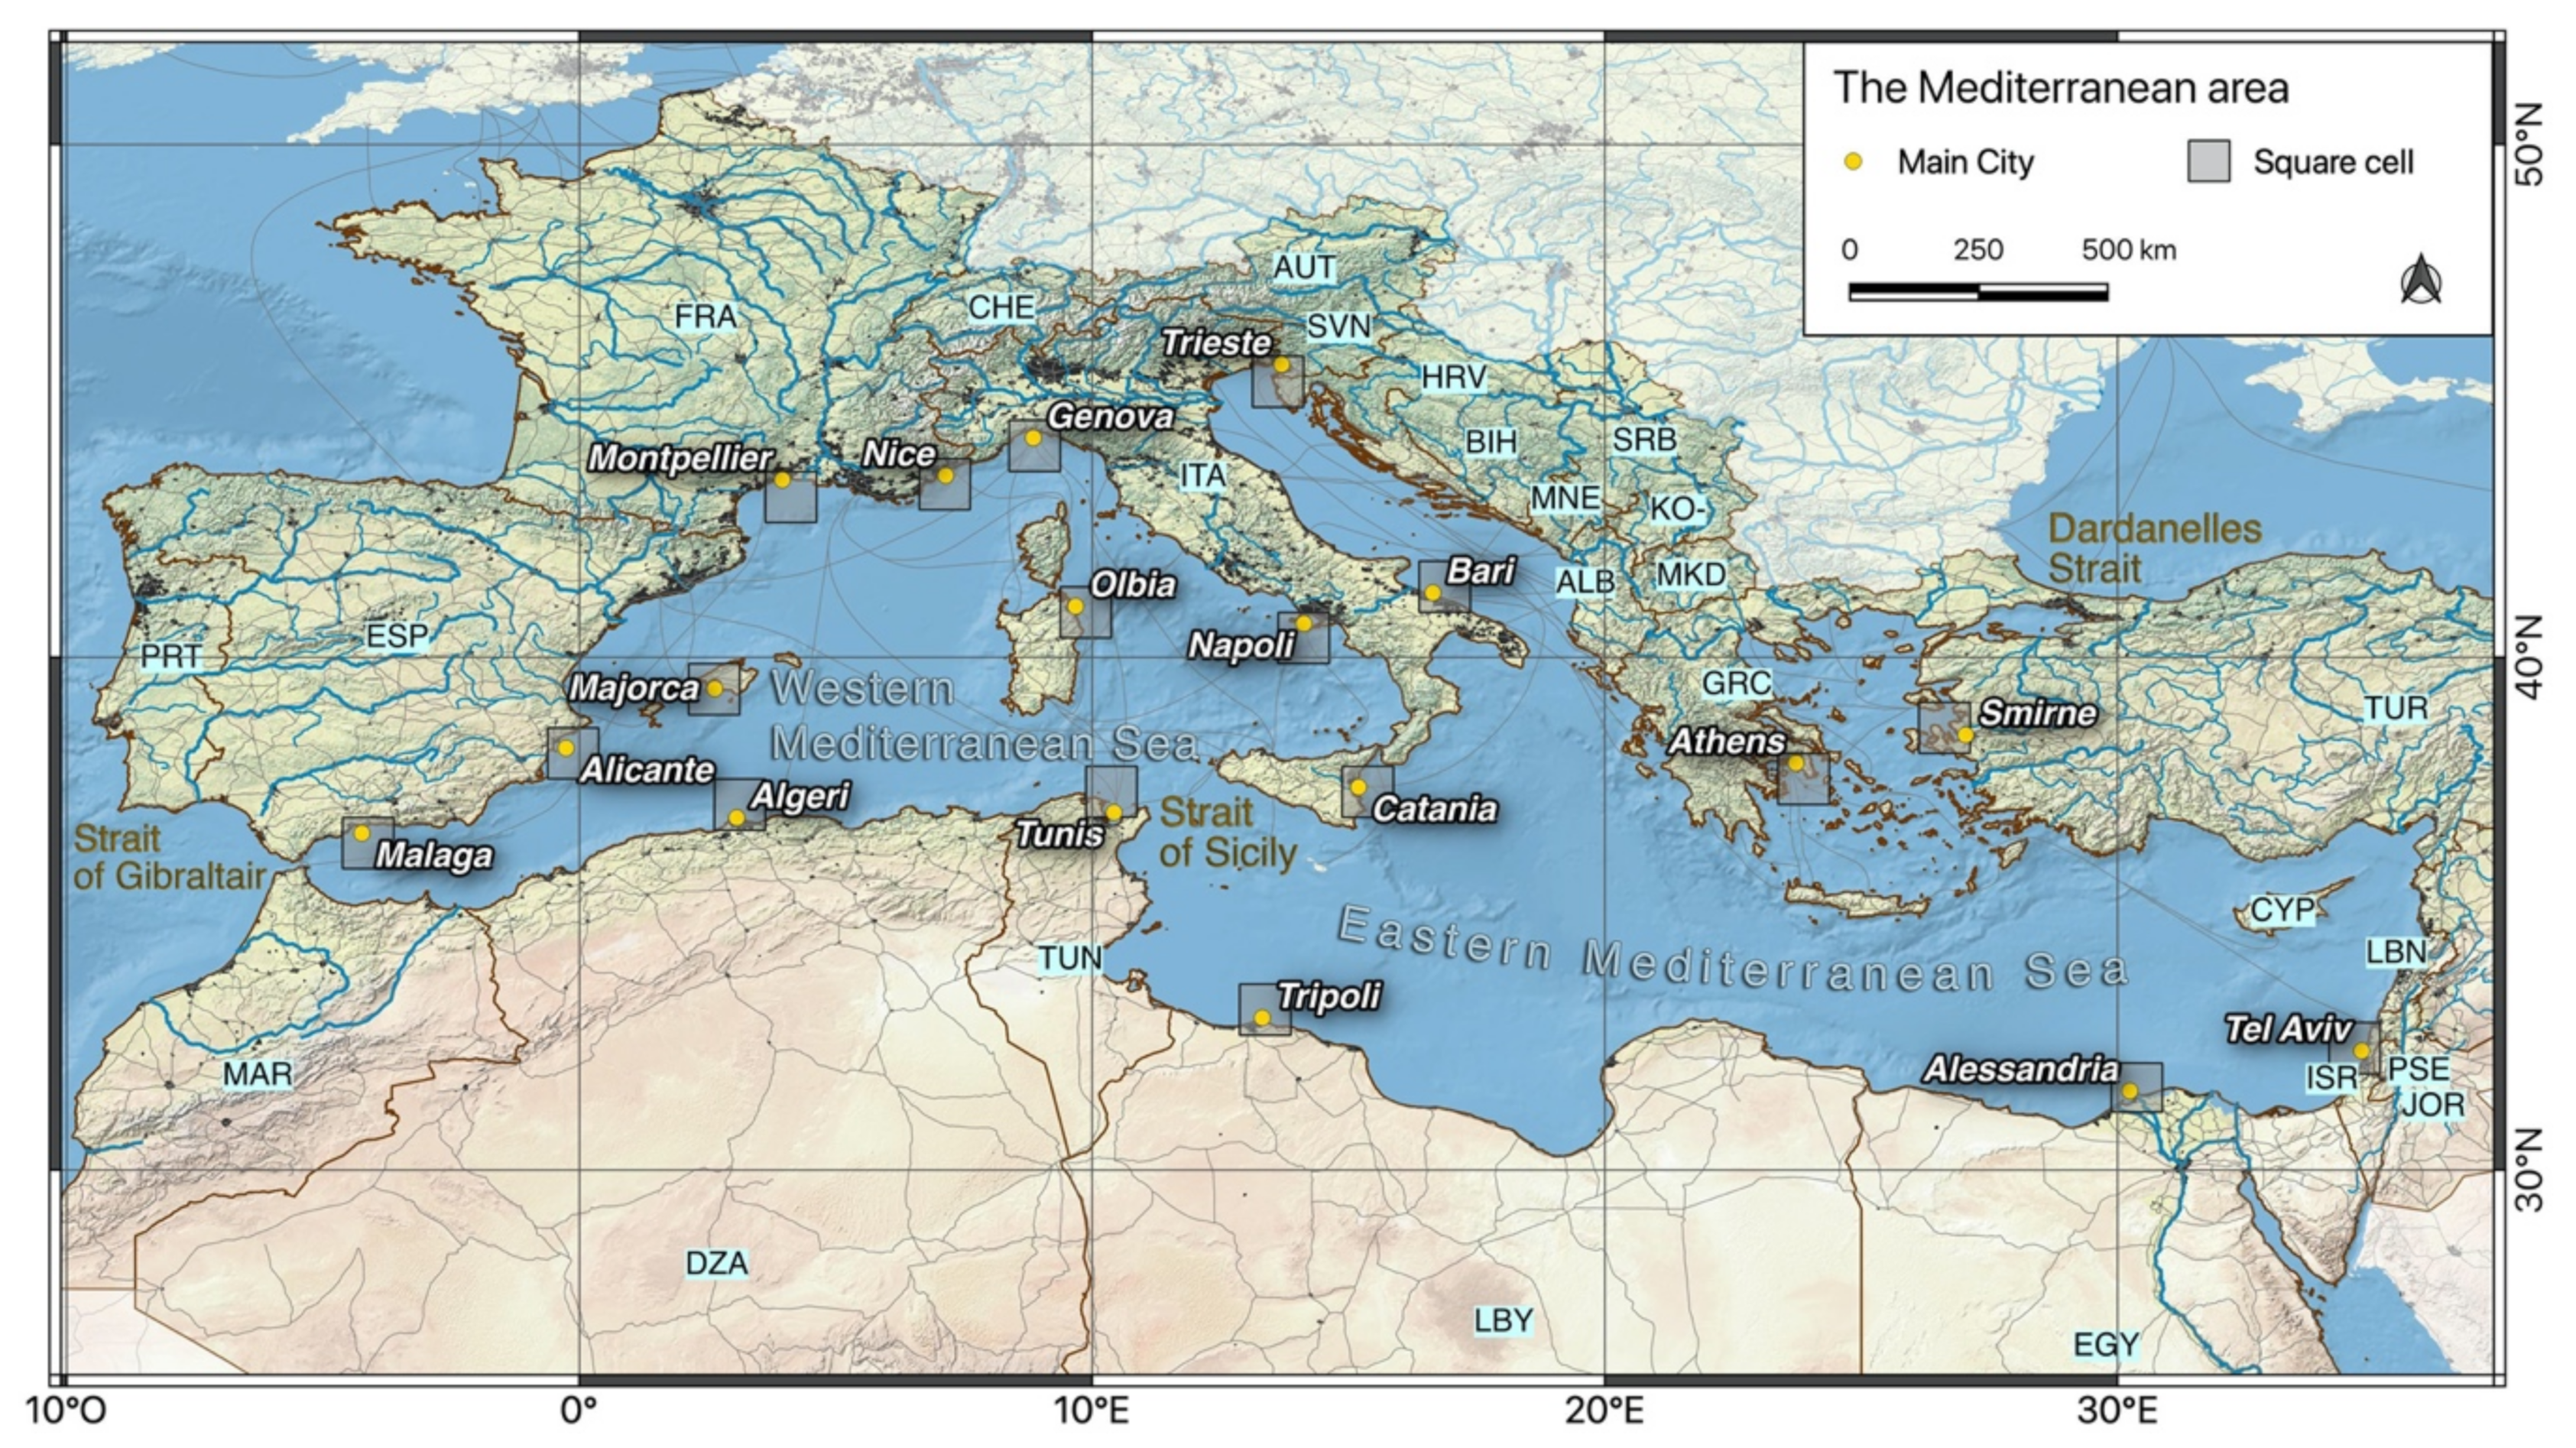
Finally, the CAPE and TCWV data analyses were limited to the monthly mean values for the 100 km2 surrounding 18 major cities facing the Mediterranean. Despite this limitation, in both cases trends were detected and are consistent with the increase in the number of the geo-hydrologic events. Moreover, the CAPE data is an indicator of atmospheric instability and then linked to extreme events, while the TCWV data is related to the availability of precipitable water. A further step of the research will focus on other spatialized variables, allowing a more in-depth search for the correlation with the geo-hydrologic events.
