Article

Future Changes of Agro-Climate and Heat Extremes over S. Korea at 2 and 3 °C Global Warming Levels with CORDEX-EA Phase 2 Projection

1
Climate Change Assessment Division, National Institute of Agricultural Sciences, Wanju 55365, Korea
2
Department of Atmospheric Sciences, Pusan National University, Busan 46241, Korea
*
Author to whom correspondence should be addressed.
Atmosphere 2020, 11(12), 1336; https://doi.org/10.3390/atmos11121336
Submission received: 31 October 2020 / Revised: 2 December 2020 / Accepted: 7 December 2020 / Published: 9 December 2020
(This article belongs to the Special Issue Meteorological Extremes in Korea: Prediction, Assessment, and Impact)

Abstract

:
The changes of agro-climate and heat extremes, and their impact on rice cultivation are assessed over South Korea in context of 2 and 3 °C global warming levels (GWL) compared to pre-industrial levels, with ensemble regional climate model projection produced under the Coordinated Regional Climate Downscaling Experiment–East Asia (CORDEX-EA) phase 2 protocols. It is found that the mean temperature increase under global warming has not only positive effects such as the extension of vegetable and crop periods and the widening of the cultivatable regions but also negative effects due to the shortening of the reproductive growth period. On the other hand, extreme heat changes in the future clearly show a negative effect on rice cultivation via the increase of hot days during heat-sensitive stages (27.16% under 2 °C GWL, 54.59% under 3 °C GWL) among rice phenology which determines the rice yield in tandem with rice flowering, ripening, and sterility problems. The major type of heat extreme is dominated by nationwide warm anomalies covering entire S. Korea, and the proportion of this type is projected to increase from 35.8% to 49.5% (57.4%) under 2 °C (3 °C) GWL in association with the thermal expansion of atmosphere which links to the favorable environment for occurring barotropic anti-cyclonic system.

1. Introduction

The United Nations Framework Convention on Climate Changes (UNFCCC) announced the greenhouse-gas mitigation goal by limiting the global warming level (GWL) to less than 2.0 °C compared to the pre-industrial (PI) level, but pursuing more efforts to limit the warming under 1.5 °C GWL [1]. However, under global warming with a rapid increase of greenhouse-gas and passive climate actions, there are skeptical views on achieving the promoted goals [2,3,4]. Moreover, regional climate changes, particularly extreme events, are projected to increase faster than the global average temperature does [5,6,7]. For example, in 2018, South Korea (hereafter, S. Korea) underwent a record-breaking heat event, not only for an instant daily maximum, for instance, Seoul (39.6 °C), Hongcheon (41.0 °C), Uiseong (40.4 °C), but also the duration of heatwaves (31.4 days) [8]. Im et al. [9] suggested that heat extremes as severe as the 2018 summer will be normal under a 3.0 °C global warming climate. In addition, the World Meteorological Organization (WMO) confirmed 2019 as “second hottest year on record”, which reached 1.1 °C warmer than the PI-level [10]. This indicated that a higher level of a global warming threshold should be considered for assessing and preparing the impact of feasible future climate changes.
Climate conditions, such as temperature, solar radiation, etc., are fundamental and crucial factors for successful crop yield [11,12]. Thus, current farming systems are adjusted to the present climate by choosing appropriate crop species or breeding new varieties, or changing the planting system. Under the rapidly changing global climate, climate change impact assessment on agricultural field is actively working due to the importance of predicting crop yield which is closely associated with the food security problem.
For China, one of the largest staple crop-cultivating regions in the world, the impacts of 1.5 and 2 °C GWL above PI-level are assessed in previous studies. Guo et al. [13] projected the changes of rice yield with the Half a Degree Additional Warming Projections, Prognosis, and Impact (HAPPI) experiment, which simulate the climatic conditions at 1.5 and 2 °C GWL above PI-level with Atmospheric General Circulation Models (AGCM). The result showed the decreased rice yield over Pearl River Delta, China, with the shortening of maturity date and flowering durations due to the warming. On the other hand, Chen et al. [14] also used the HAPPI experiment as a climate condition, suggesting conflicting results with those of Guo et al. [13] that global warming will bring another opportunity for the agricultural field with more abundant climatic resources such as light and heat to create a more suitable environment for crop production. Compared to China, S. Korea has more complicated topography, with narrow territory and complex coast lines. Therefore, regional climate model projection-based researches are necessary to estimate the future change of rice yield under climate change [15,16,17]. The rice yield change is estimated by the ORYZA2000 crop model forced with climate change data projected by the Hadley Centre Global Environment Model version 2—Atmosphere–Ocean (HadGEM2-AO) and Hadley Centre Global Environmental Model version—Regional Atmosphere (HadGEM3-RA) model chains with 12.5 km horizontal resolution over S. Korea under the Representative Concentration Pathway (RCP) 8.5 scenario [15]. They insisted that rice yield will slightly increase until the 2020s and then convert into a decreasing phase and finally decrease to less than 80% of the current condition by the end of the 21st century. This result lends support by other experiments with different combinations of the Global Climate Model (GCM)–Regional Climate Model (RCM) chain and crop yield potential index [16,17]. Over the Far East Asia region including the Korean peninsula and some parts of Japan and China, Ahn et al. [16] showed the changes of the agro-climatic environment with various indices (frost days, crop period, vegetable period) and Climate Yield Potential (CYP) which is the statistical method to estimate crop yield with the assumption that no agro-climatic extreme events occur during crop growth by utilizing mean temperature and sunshine duration. The results are derived with a single ensemble member, HadGEM2-AO, downscaled by the Weather Research and Forecasting (WRF) Model, under RCP4.5 and RCP8.5 scenarios. Under global warming, most of the regions are projected to experience a decrease of CYP, except for the northeastern part of the Korean peninsula and some high-altitude regions which are becoming favorable for gain-filling. These results are supported by Ahn et al. [17], who analyzed the similar agro-climatic indices with expanded ensemble members.
However, those studies are based on mean climate changes with a statistical index (CYP) that excluded the effect of extreme events [16,17] and focused on the consequence (changes in rice yield), itself derived from the changes in predictors (temperature and solar radiation) without understanding systematic changes in atmospheric circulation. Further, previous studies have evaluated the agro-climate changes over S. Korea at a certain target period (for example, late 21st century). Due to the different sensitivity to green-house-gas forcing from model to model [18,19], this kind of analysis could be another source of uncertainty when comparing results with other studies produced via different GCMs. Therefore, it is necessary to assess the agro-climate change over S. Korea in line with target GWL departed from a standardized base line (e.g., PI-level) with fine-resolution ensemble regional climate change projection. In this regard, the heat extreme risk in rice yield and related atmospheric circulation changes are assessed over S. Korea at 2 and 3 °C GWL under the RCP8.5 scenario with ensemble regional climate model projection produced under the Coordinated Regional Climate Downscaling Experiment–East Asia Phase 2 (CORDEX-EA2) protocol. The explanation of the target global warming level, regional climate projection data, and bias correction method are introduced in Section 2. Section 3 presents the agro-climate changes in terms of mean and extreme and related atmospheric circulations at target warming levels. Summary and discussion are detailed in Section 4.

2. Data and Method

2.1. Climate Data

This study utilized the dynamically downscaled high-resolution ensemble future climate change projection produced under the protocols of CORDEX-EA phase 2 experiments. Under the project of the National Institute of Meteorological Science/Korean Meteorological Administration (NIMS/KMA), 5 different ensemble members were produced over the CORDEX-EA2 domain, HadGEM2-AO, dynamically downscaled by the Regional Climate Model (RegCM), Mesoscale Meteorological Model 5 (MM5), and HadGEM3-RA, and the Max Planck Institute Earth System Model Low Resolution (MPI-ESM-LR) was chained with WRF and Cosmo-Climate Limited Area Modeling (CCLM) (http://cordex-ea.climate.go.kr/cordex/models.do). HadGEM2-AO and MPI-ESM-LR was the Coupled Model Inter-Comparison Project Phase 5 (CMIP5) participating model, known to have relatively good performance over the East Asian region compared to other CMIP5 GCMs [20]. Among those simulations, the models using a “standard calendar with leap-year” system which does not need to apply time interpolation were chosen for this study: MPI-ESM-LR&WRF and MPI-ESM-LR&CCLM model chains. These data have 25 × 25 km horizontal resolution covering the CORDEX-EA2 domain which includes not only East Asia but also India and some parts of Southeast Asia. To compare the future projections produced with different climate models at the same baseline, the target global warming level compared to the PI-level is broadly used in global warming impact assessment [21,22,23]. In this study, we set the target GWL at 2 and 3 °C warmer than PI-level. The target warming period was defined following Jo et al. [24], when the central year of a 25-year moving averaged Global Mean Surface Temperature (GMST) reached the target warming level, and the PI-level was defined as the GMST average during 1861–1900 of the historical experiment. The MPI-ESM-LR model reached 3 °C GWL under only the RCP8.5 scenario; therefore, the historical experiment and RCP8.5 scenarios were chosen for this study (Figure S1). The 2 and 3 °C GWL periods were defined as 2024~2048 and 2049~2073 under the RCP8.5 scenario (Table 1). The ensemble averaged results were used for mean climate change analysis, except for the extreme climate change part, to maintain the variability of every extreme event simulated in each ensemble member. Therefore, the extreme event analysis was applied by gathering extreme events selected from each regional climate model, not from the ensemble averaged values. The model descriptions are presented in Table 1 and data access and more detailed information are available on the official CORDEX-EA2 webpage (http://cordex-ea.climate.go.kr/cordex/models.do). As reference data, the Asian Precipitation Highly Resolved Observational Data Integration Toward Evaluation of Water Resources (APHRODITE) was used for temperature with 0.25 × 0.25 horizontal resolution [25]. For atmospheric circulations (500 hPa geopotential height and 850 hPa wind), the European Centre for Medium-Range Weather Forecast’s reanalysis data interim version (ERA-interim) was used as reference data [26,27] with 0.75 × 0.75 horizontal resolution. To compare the model data and reference data, the climate model data were interpolated into reference data’s grid system.

2.2. Bias Correction

The climate models, even the state-of-the-art models, have bias caused by model discrepancy with the real earth system which describes the earth system with the set of differential equations and physical schemes with many assumptions [28,29,30,31]. Therefore, applying the climate model raw data directly to impact assessing models, which are optimized by empirical relationships based on observation, can lead to inappropriate results. To reduce the climate model bias, many bias correction methods have been developed by utilizing the relationships between climate modeling results and observation [28,30,31,32,33]. However, applying the bias correction method on future projection can be another source of uncertainty because most of the bias correction methods have problems in “stationary assumption”, which assume that the relationship established between the model result and observation keep validating in the future climate [34,35]. To overcome this weak point, this study adopted the Quantile-Delta-Mapping (QDM) bias correction method. The QDM method is a variation of the quantile mapping method which could be a powerful tool for adjusting model biases in terms of both mean and extremes [36,37]. Moreover, QDM has advantages in taking account of the delta (changes) of the cumulative probability distribution forced by climate change, which is relatively free from the “stationary assumption” problem [38,39,40]. The details of the QDM method are explained in Appendix A of Cannon et al. [38].

2.3. Rice Phenology Model

To investigate the climate change impact on each rice growth stages, Growing Degree Days (GDD) was selected as phenology model. The GDD is a simple but efficient tool to identify rice phenology, which discriminates the stage of rice growing with accumulated heat amount [41,42,43]. The equation of GDD used in this study is as follows:
G D D =   i = 1 n T d i f f T d i f f   =   T i     T b a s e   for   T i     T b a s e else ,   T d i f f   =   0
where i = Julian Day, n = total number of days (1 January–31 October), T i = mean daily temperature, and T b a s e = basement temperature (10 °C).
The basement temperature was set to 10 °C [44,45,46]. The heat requirements to achieve each stage were differing from rice species. Here, we set the thresholds with regard to mid-late maturing rice which is a major kind of rice cultivating over S. Korea, accounting for more than 84% of total rice yield [47]. The mid-late maturing rice cultivars have high climate productivity under current environmental conditions of S. Korea, and show excellence in terms of quality and quantity. Table 2 shows the threshold of each stage which refers to the values used in the Early Warming Service for Weather Risk Management in Climate-Smart Agriculture Systems of the Rural Development Administration, S. Korea [48]. This study divided rice phenology into 6 stages: Seeding, transplanting, tillering, elongation, heading, and harvest, following Park et al. [49]. The threshold of GDD for each stage adopted the values estimated by the regression equation based on observed rice phenology and field experiments [50].

3. Results

3.1. The Impact of Mean Temperature Changes

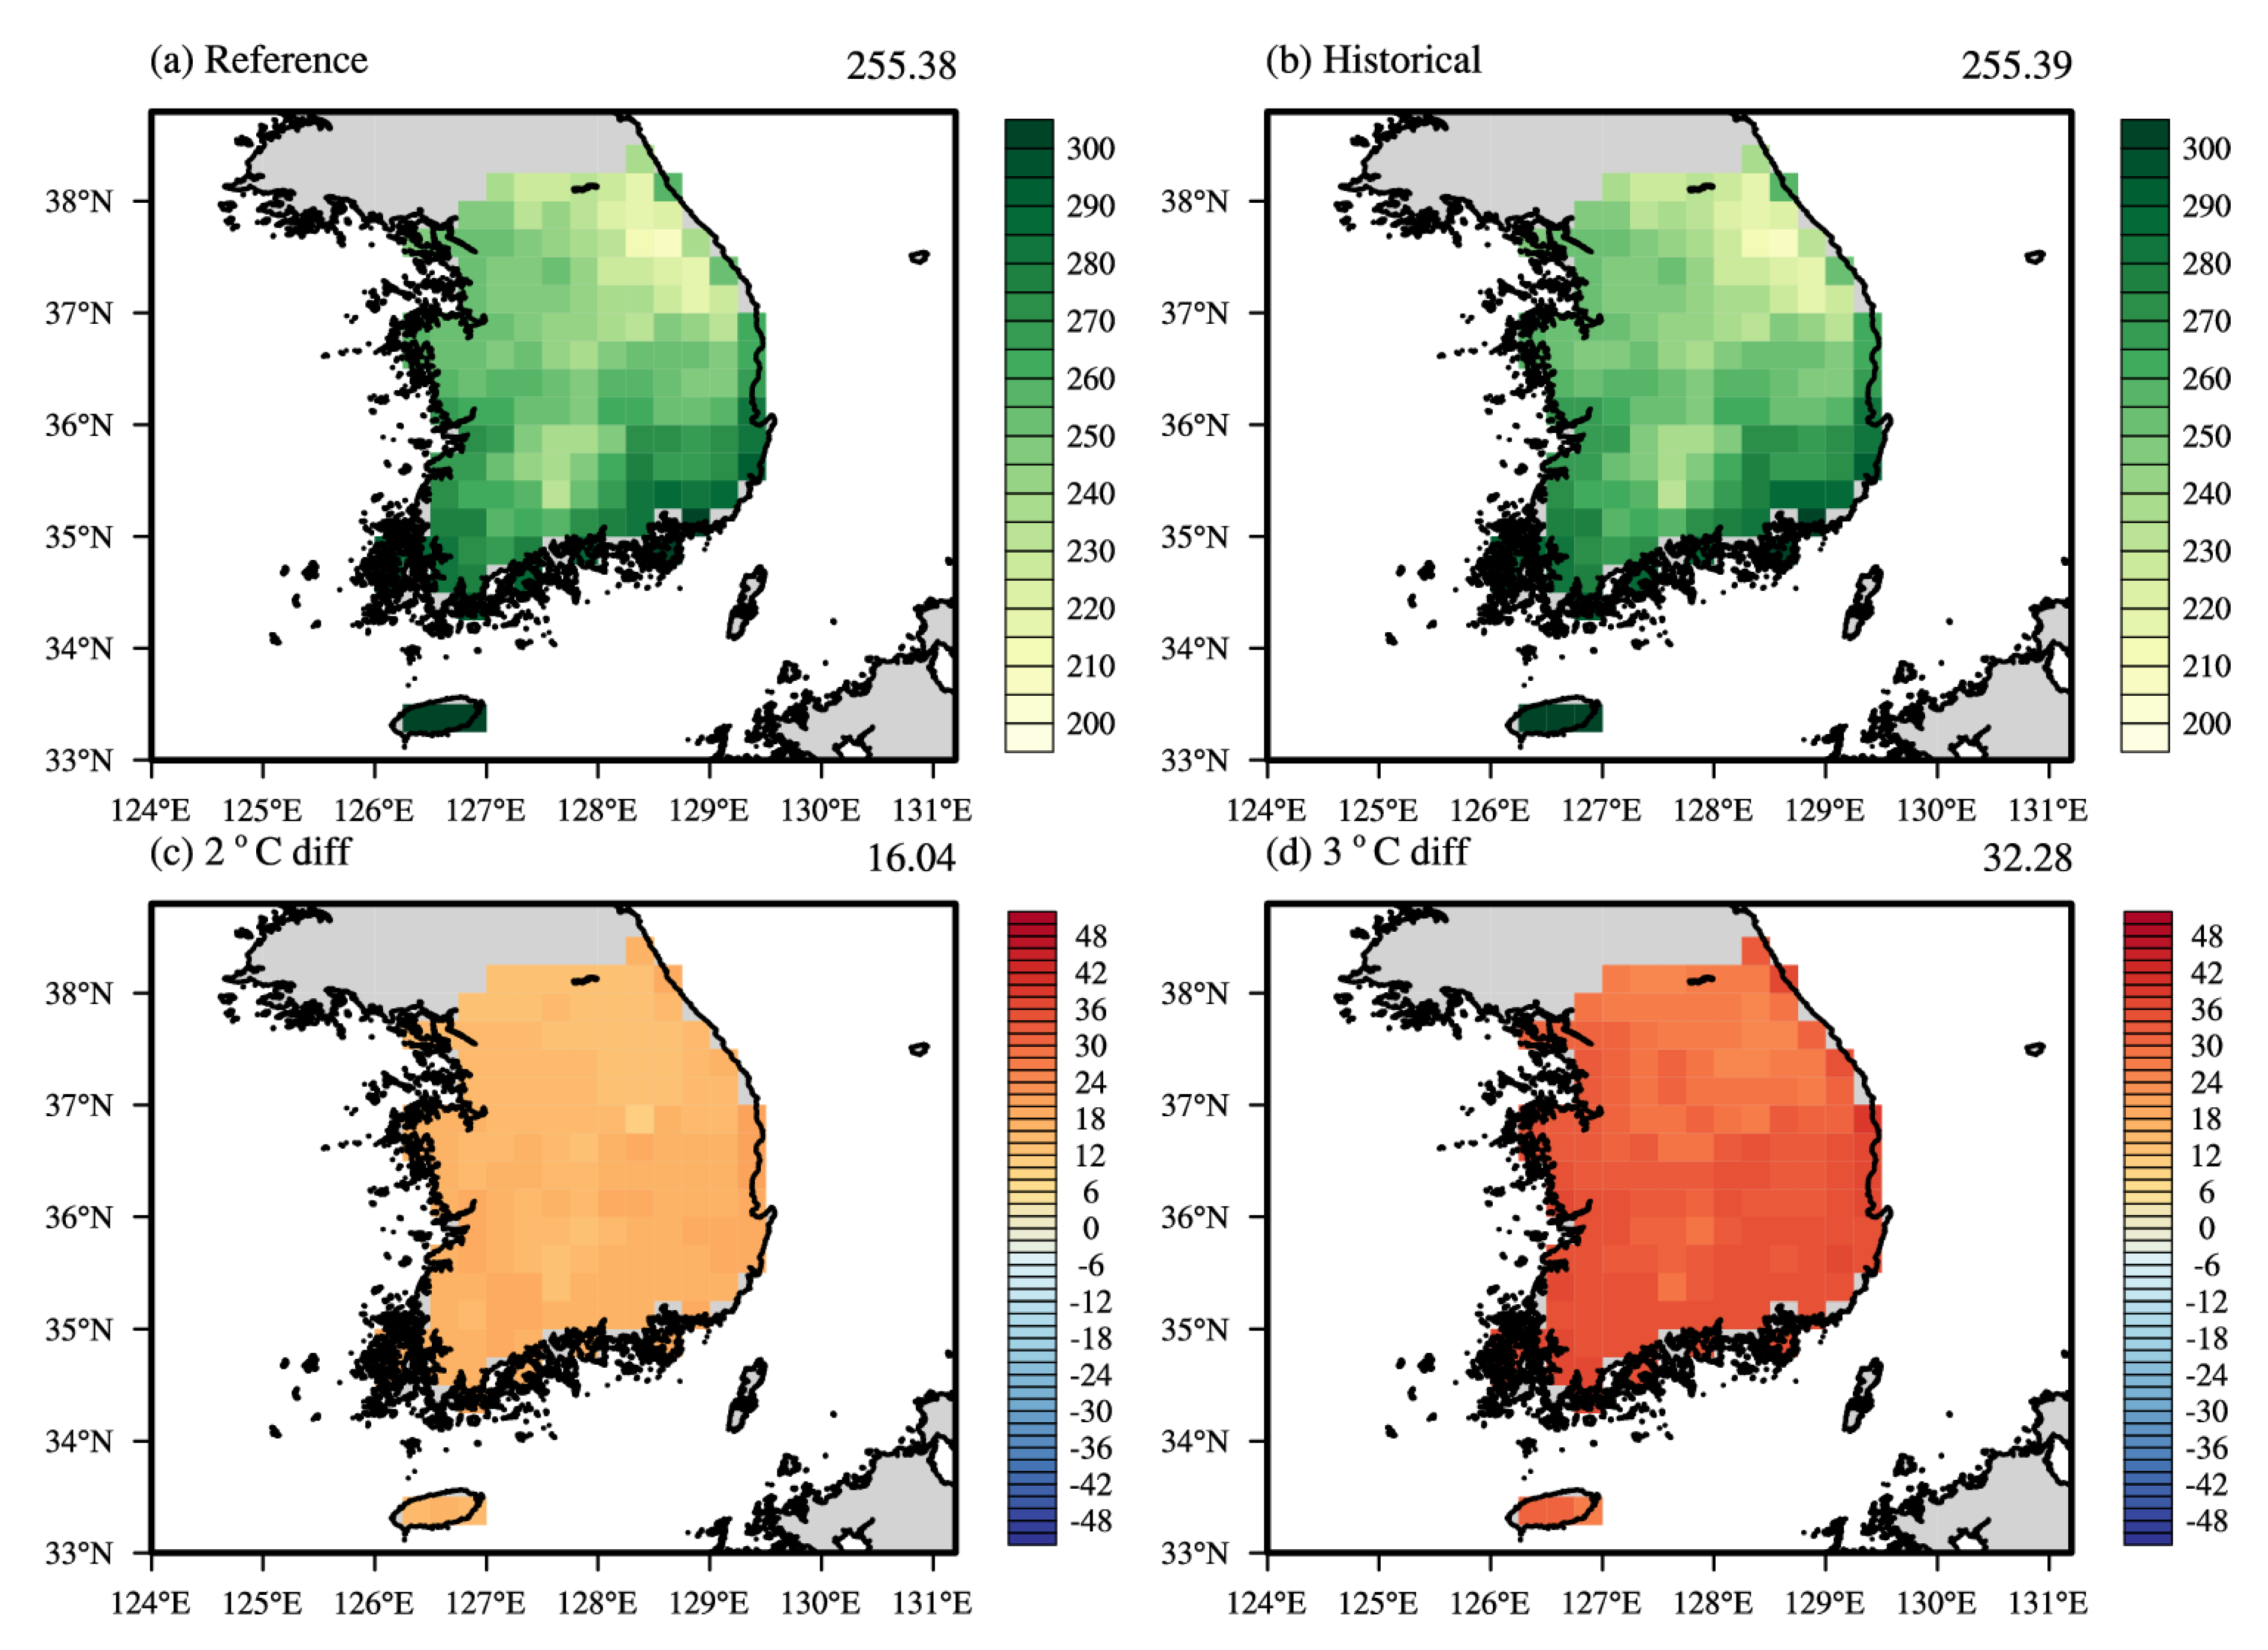
The climatological change of mean surface temperature over S. Korea ( T k o r ) due to global warming was investigated with regional climate change projections. To understand how the climate will be shifted under global warming, the probability distribution function (PDF) of T k o r is shown in Figure 1a. The shaded area of Figure 1a is T k o r PDF of reference data and the black line indicates that of the historical experiment (HIS). It is shown that the model followed the characteristics of reference data reasonably. It is because that the bias-correction method used in this study was based on the quantile-mapping method which had advantages in making good agreement between reference data (REF) and model output by matching cumulative distribution function (CDF) distribution [36,37,38,39]. The blue and red lines denote the PDF of 2 and 3 °C GWL period. They show a shift toward a warmer climate but maintain the saddle-like shape. In addition, the right tail of PDF associated with extreme temperature events is elongated for 2 and 3 °C GWL periods compared to the historical period, which is interpreted as causing more frequent extreme heat events. As for temperature spatial distribution which is affected by geological features, it had characteristics that high altitude regions such as the Tae-Baek mountain region in the northeastern part and So-Baek mountain regions in south-middle part of S. Korea had low annual mean temperature colder than 10 °C (Figure S2a), whereas the southern part of S. Korea including Jeju island and coastal regions showed relatively warm annual mean temperature around 12~15 °C. These spatial characteristics of T k o r were also reasonably described by RCMs (Figure S2b). Under the 2 °C (3 °C) global warming, T k o r was projected to increase 1.4 °C (2.65 °C) higher than the present climate (Figure 1b,c) and exhibited the positive gradient in the latitudinal direction. As T k o r had a positive temperature gradient from north to south (Figure S2), it was expected to decrease the north–south temperature gradient over S. Korea compared to the present climate. The warmer climate in the northern part of S. Korea could lead to favorable conditions for growing vegetation. Here, the vegetable period (VP, number of days warmer than 5 °C [51]) was investigated during the present and 2 and 3 °C GWL periods (Figure 2). The spatial distribution of VP in the present climate closely resembled the annual mean T k o r (Figure S2), including topographical characteristics, and results of the models were also comparable to that of the REF. The area averaged VP over S. Korea was 255.38 days in the present climate; however, regional deviation was noticeable and coastal regions and Jeju island reached VP more than 300 days, but only about 200 days around mountainous regions. In the future, VP is projected to increase about 2 weeks (16.04 days) for 2 °C GWL and it would be doubled in 3 °C GWL (32.28 days). In this regard, global warming is expected to bring a positive impact on agriculture by expanding the area and period available for growing vegetables.
For the growth of crops, warmer conditions are required than those of the threshold of VP. In the case of the rice, 15 °C is considered as an important threshold for stable growth and ripening [51]. Figure 3 shows the crop period (CP, number of days warmer than 15 °C [51]) in the present climate (Figure 3a,b) and their changes in 2 (Figure 3c) and 3 °C (Figure 3d) GWL. The mean CP in the present climate was about 157 days per year, depending on the region. In the 2 and 3 °C GWL, CP increased by approximately 13 and 26 days for each GWL. In particular, the northeastern mountainous region revealed a relatively distinctive increment compared to other regions, which led to a similar level of CP in major rice production regions in the present climate. This is linked to the widening of rice cultivatable areas, and is therefore interpreted as a positive effect of global warming on rice yield.
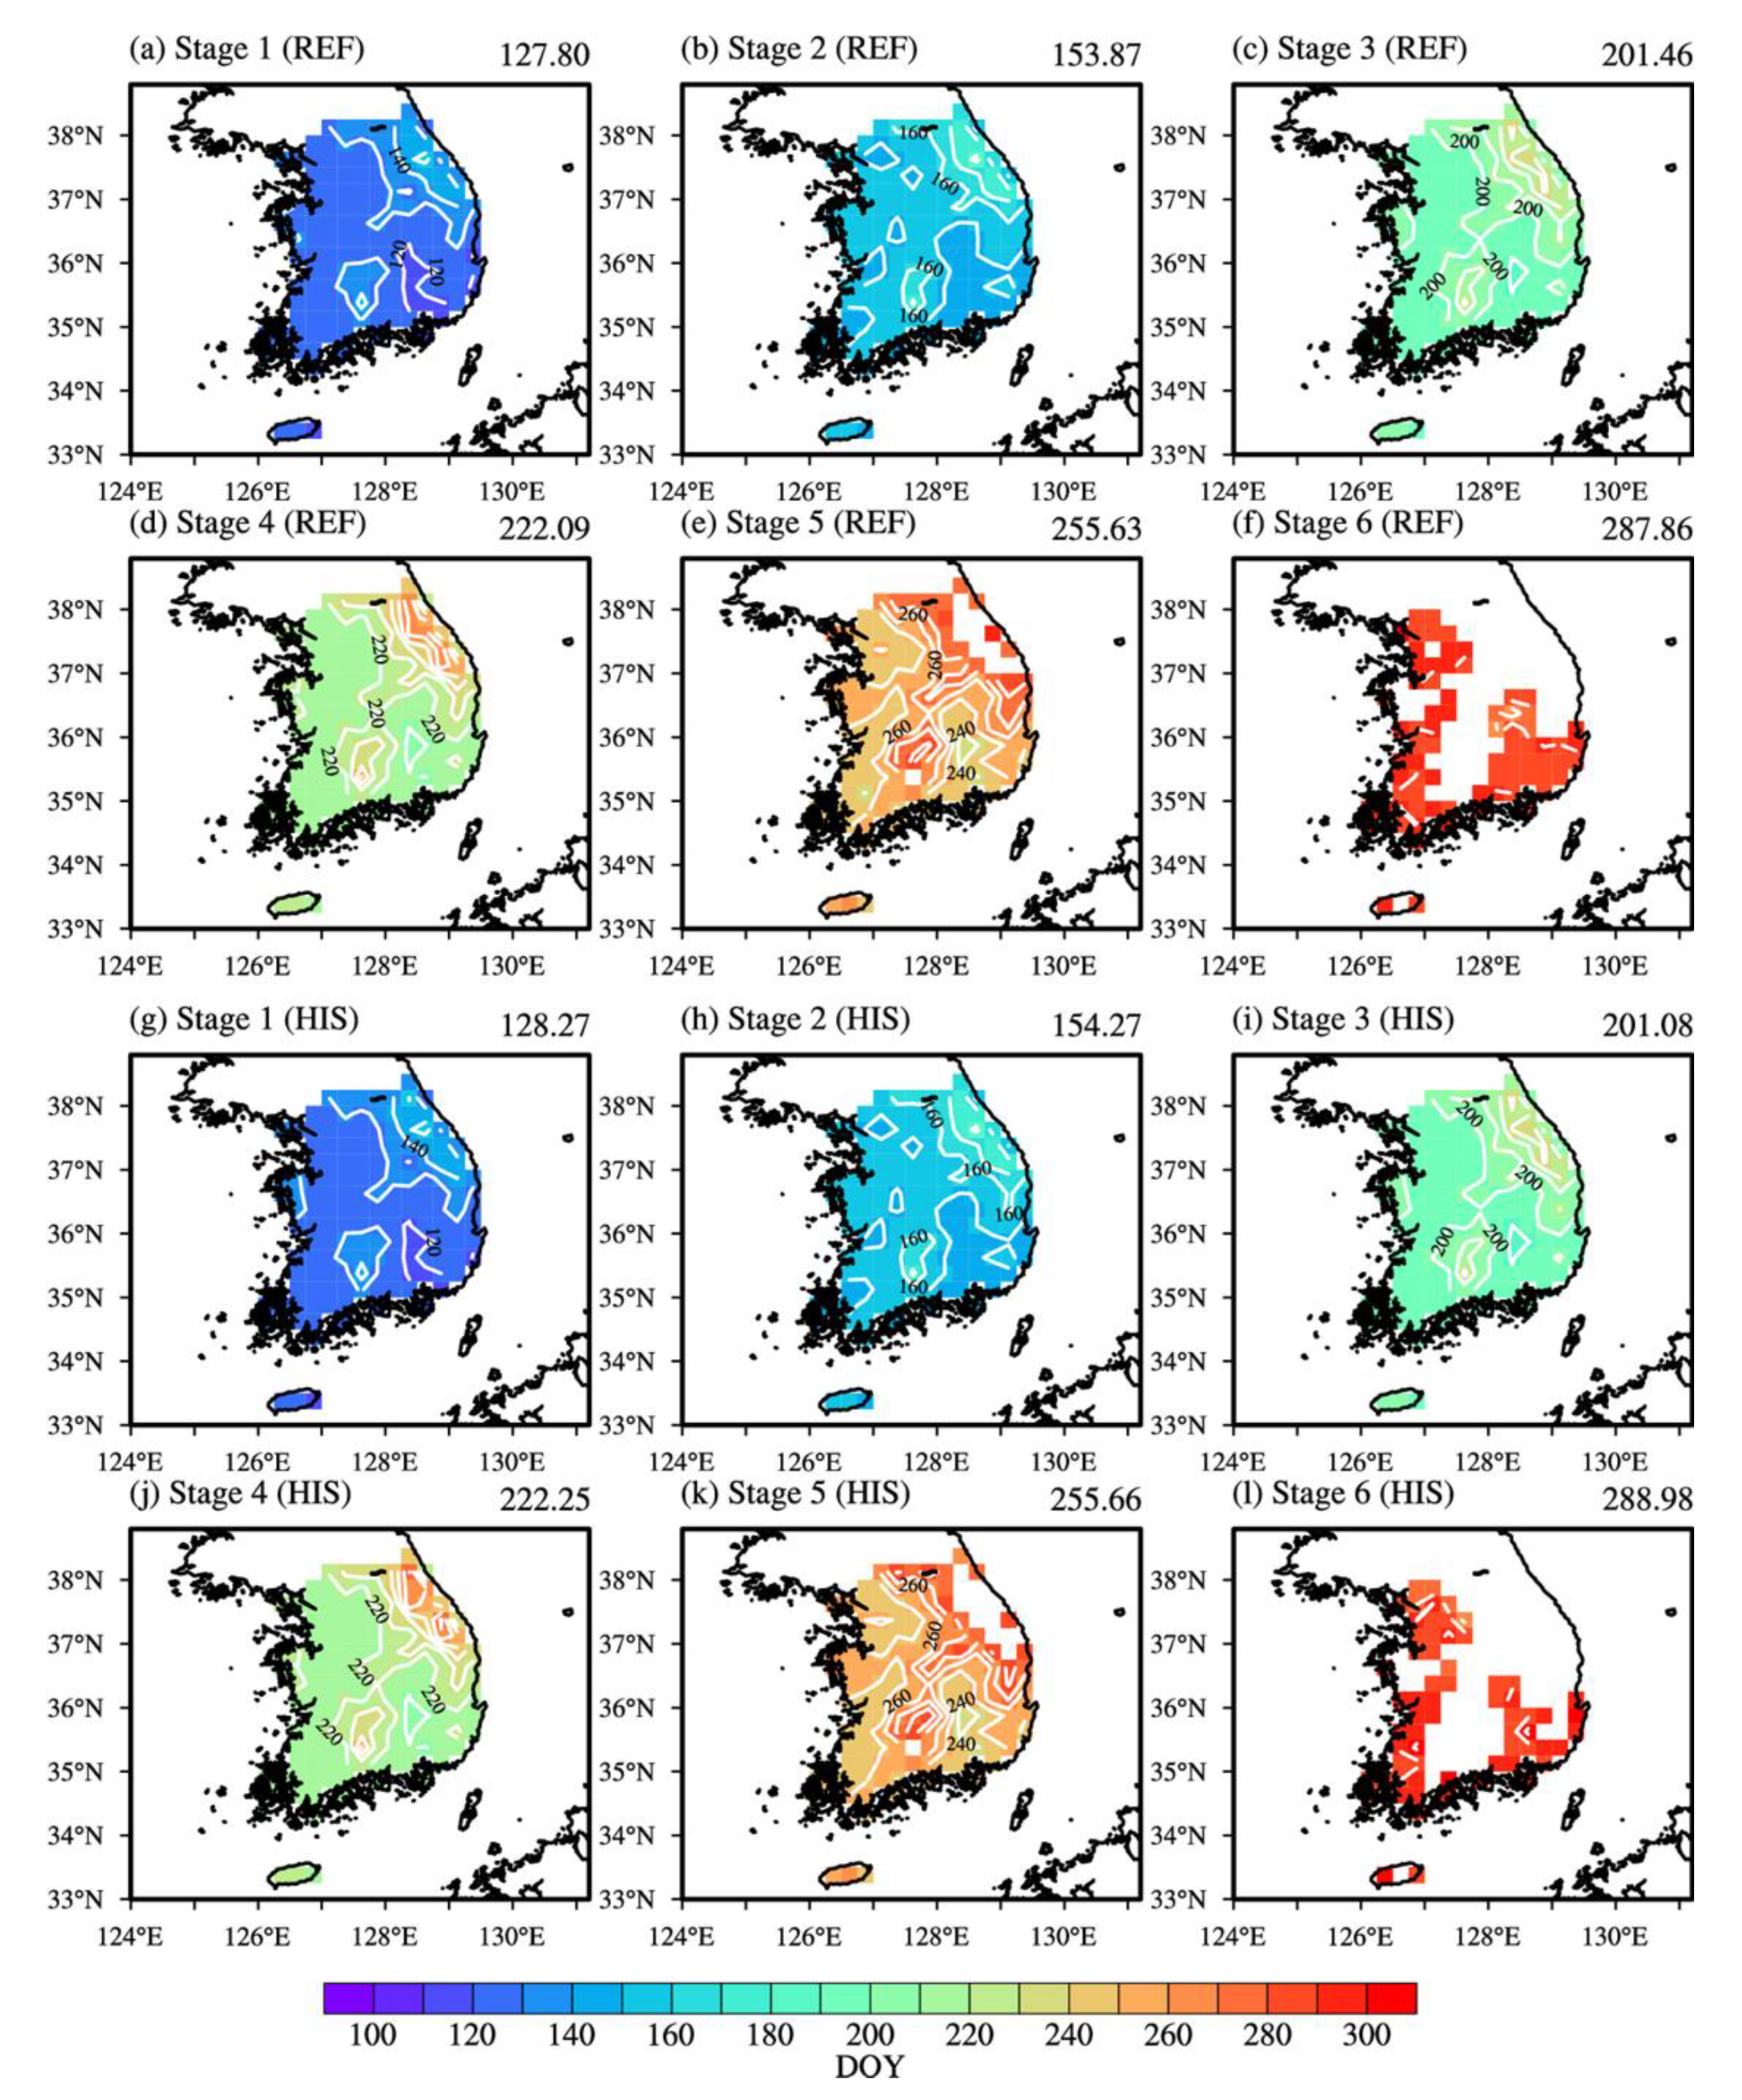
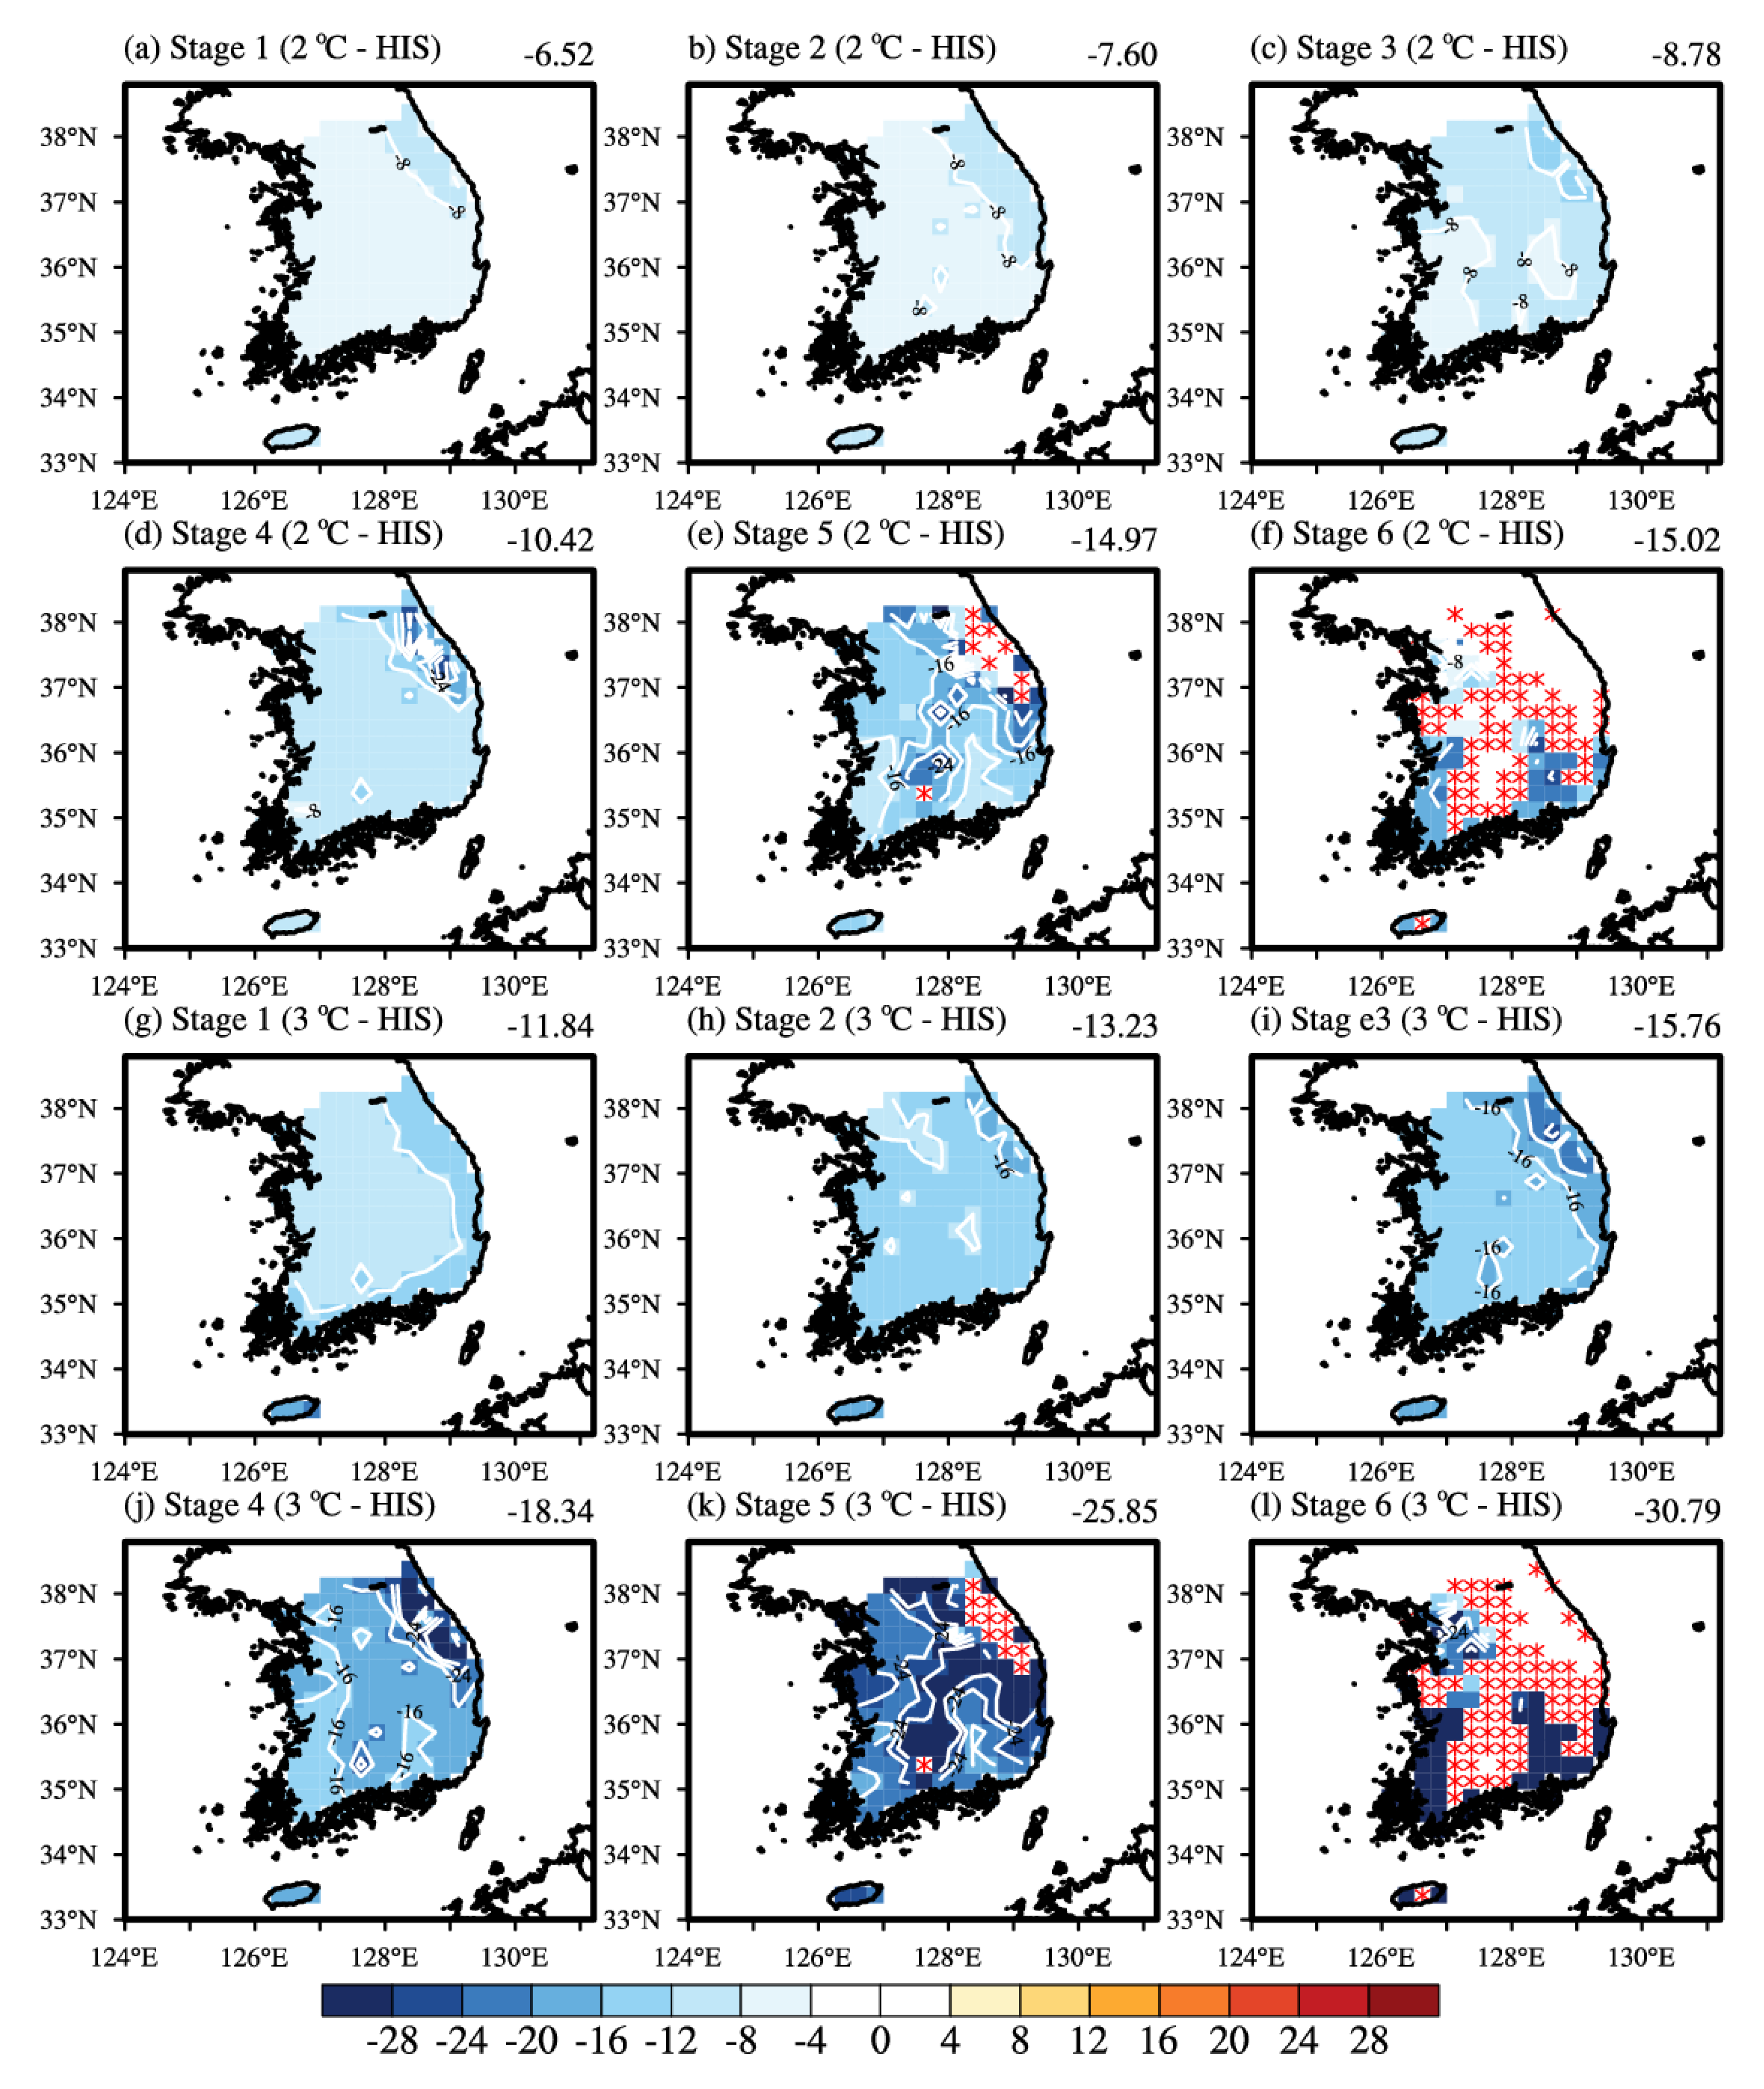
In order to examine the impact of climate change on rice phenology in more detail, the starting date of each rice phenology stage was analyzed based on the Growing Degree Days (GDD). Before estimating the changes of phenology stages in the future, the characteristics of rice phenology in the present climate are shown in Figure 4. For the first stage (Stage 1, seeding), the mean starting date was estimated as 127.8 (early May) but varied from region to region (Figure 4a). The plain region which was the major rice production area in the western part of S. Korea exhibited a relatively earlier start of Stage 1 from late April to early May. The basin region located between two major mountainous regions in the southeastern part of the S. Korea showed the earliest starting date, around late April. For Stage 2, the transplanting stage, the southeastern basin region and some parts of the western plain region started Stage 2 in middle of the May, and other regions mostly started at the end of May to early June (Figure 4b). At Stage 3, the tillering stage, major rice production regions started the phenology stage around late June to early July (Figure 4c). Note that the period from Stages 1 to 3 is called the vegetative growth period of the rice. Stage 4 (elongation stage) started around the end of July and the difference between mountainous regions and plain regions was getting larger (Figure 4d). At the end of August, the heading stage (Stage 5, Figure 4e) started around major rice crop regions and at the final stage (Stage 6, harvest stage, Figure 4f), only major rice cultivating regions reached enough GDD level for harvesting around the end of September to early October. These last three stages were the period for reproductive growth and ripening of rice. These phenology stages were reasonably well matched up with the crop calendar of S. Korea reported by the Food and Agriculture Organization of the United Nations/Global Information and Early Warning System (FAO/GIEWS; http://www.fao.org/giews/countrybrief/country.jsp?code=KOR). The RCM manifests good skills in simulating the stages of rice phenology as much as REF (Figure 4g–l). Figure 5 shows the changes of the starting date of each stage under 2 (Figure 5a–f) and 3 °C (Figure 5g–l) GWL. Under 2 °C GWL, the vegetative growth period (Stages 1–3) was projected to start about 1 week (−6.52~−8.78 days) earlier than the present climate, and during the reproductive growth period (Stages 4–6), the starting dates occurred earlier, by about 2 weeks (−10.42~−15.02 days, Figure 5e,f). The 3 °C GWL accelerated the crop calendar more than 2 °C GWL. The vegetative growth period and the reproductive growth period were projected to start faster by about 2 weeks (−15.76~−11.84 days) and 2~4 weeks (19.34~30.79 days), respectively, compared to the present climate. Moreover, due to the temperature increase, many regions which could not reach the GDD requirement for Stages 5 and 6 are changed to regions with enough GDD to achieve the harvest (Stage 6), particularly over high-altitude regions. In this context, the expansion of the rice cultivable area due to the global warming effect could have a positive linkage with the rice yield. On the contrary, the shortening of the reproductive growth period could lead to a short ripening period for rice which would have a negative impact on rice yield and quality. In addition, to adapt to the changes of starting date and duration, optimization of rice species and crop calendars was unavoidable, such as adopting late maturing rice cultivars or double cropping with early maturing cultivars by an considering economic effect. In addition, the development of a new species which has high endurance for heat stress and a high CO2 concentration environment will be required in the long-term perspective. Hence, it can be seen that the impact of the mean temperature changes in the future under global warming on rice production is conditionally positive due to the conflicting factors.

3.2. The Impact of Extreme Temperature Change

Extreme climate events, such as heat waves and heavy rain, have a short lifetime but evoke high-impact damage. For agriculture, the crop exposure to heat stress could impact ripening and sterility problems. The hot day ratio (%) per each phenology stage in the present climate derived from the reference data and historical experiment are summarized in Table 3. Here, the threshold for defining a hot day was the 95th percentile value (T95) among the 25-year daily temperature, derived grid by grid (Figure S3). The highest hot day ratio was recorded during Stages 3 (37.75%) and 4 (19.09%), and Stage 2 (7.43%) followed in order. These hot day ratio distributions in REF were also robustly found in the RCM, though a little overestimated in Stage 2 (1.66%) and underestimated in Stage 3 (−5.18%). The detailed spatial distribution is presented in Figure S4. The changes of the hot day ratio during 2 and 3 °C GWL periods are shown in Figure 6. The threshold for defining a hot day was the same as HIS. In both 2 and 3 °C GWL periods, Stages 3–5 revealed a clear increase of the hot day ratio (Figure 6c–e,i–k). Under the 2 °C GWL, an additional 14.53% of Stage 3 was projected to exceed the hot day threshold, especially over the northeastern mountainous region. The most prominent warming period, Stage 4, exhibited a 27.16% increase of the hot day. At Stage 5, around the end of August, the hot day ratio increased by 8.93%, particularly over major rice cultivation regions. Under the 3 °C GWL, the increment of hot days became almost doubled compared to 2 °C GWL, with 25.68%, 54.59%, and 31.67% increases of hot days evoked during Stages 3, 4, and 5. For Stage 4, it was expected that more than 75% of days during the stage would be exposed to the hot extremes, taking into account that 54.59% of days during this stage would be warmer than T95 in addition to that of HIS (19.41%). In Stage 5, the major rice cultivation regions were projected to experience extreme temperature more frequently (+31.67%) than the present climate and this was about three times higher compared to 2 °C GWL. This implied that the extreme events did not monotonically react to the GHG forcing, and one-degree increase in GMST could lead to unprecedented regional climate changes. In previous studies, it has been reported that exposure to the climatic condition above the optimum temperature range, 20–22 °C [52] or greater than 27 °C [53], during the grain-filling period would reduce the grain weight and grain filling rate. Therefore, the increase of hot days ratio during Stages 4 and 5 could deteriorate the rice cultivation, because those stages are the key phenology stages that determine the rice yields by controlling factors such as rice flowering, ripening, or sterility problems. For instance, in 2018, with a record-breaking hot summer, rice production in S. Korea recorded the least amount among the recent 10 years [54] According to FAO [55,56,57], crop productivity declines are closely linked with crop price inflation, which affects the food trade market, leading to food security problems. Note that it is essential to assess the feasible changes in the agricultural climate and their impact on yields in order to adapt to upcoming climate change in terms of the economic aspect.
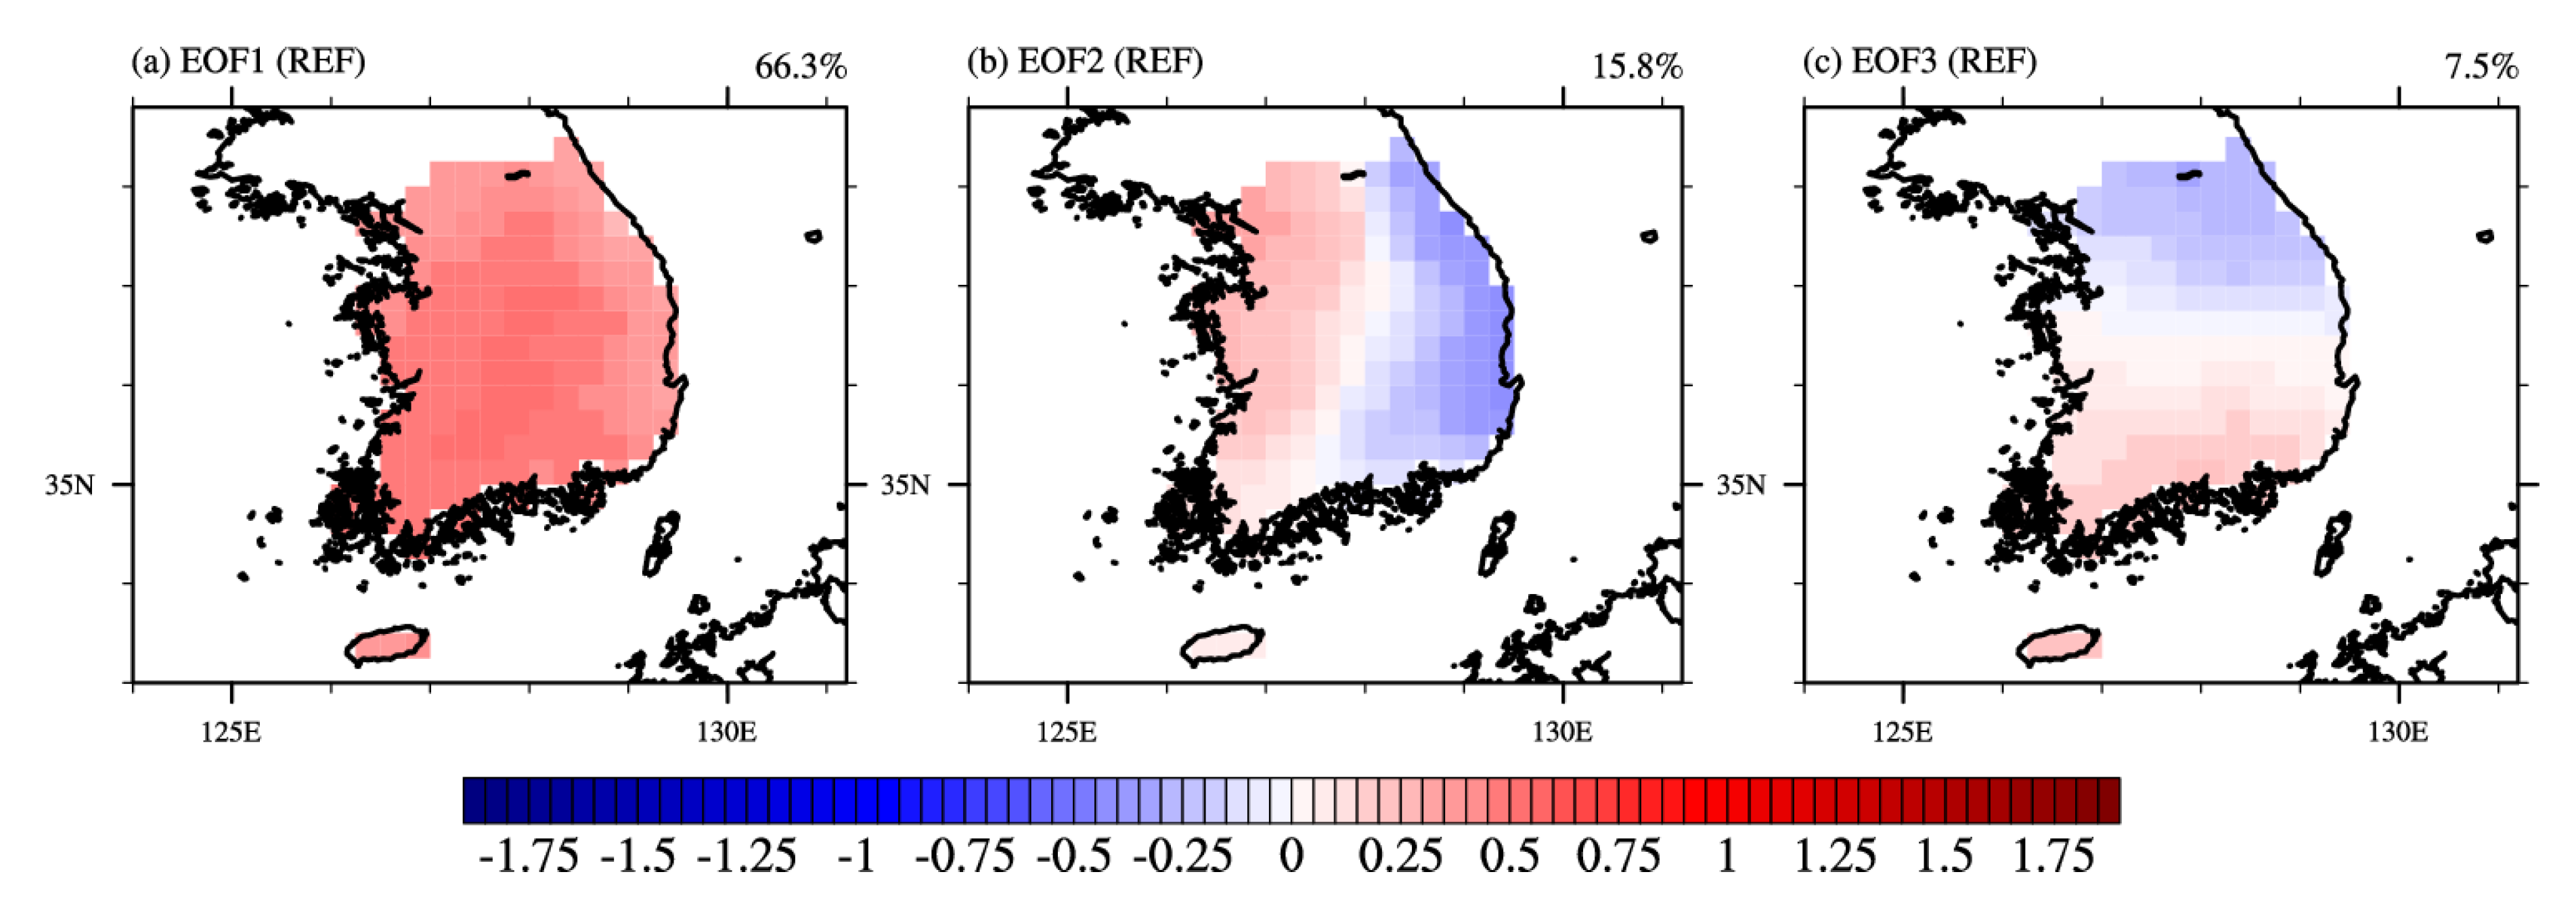
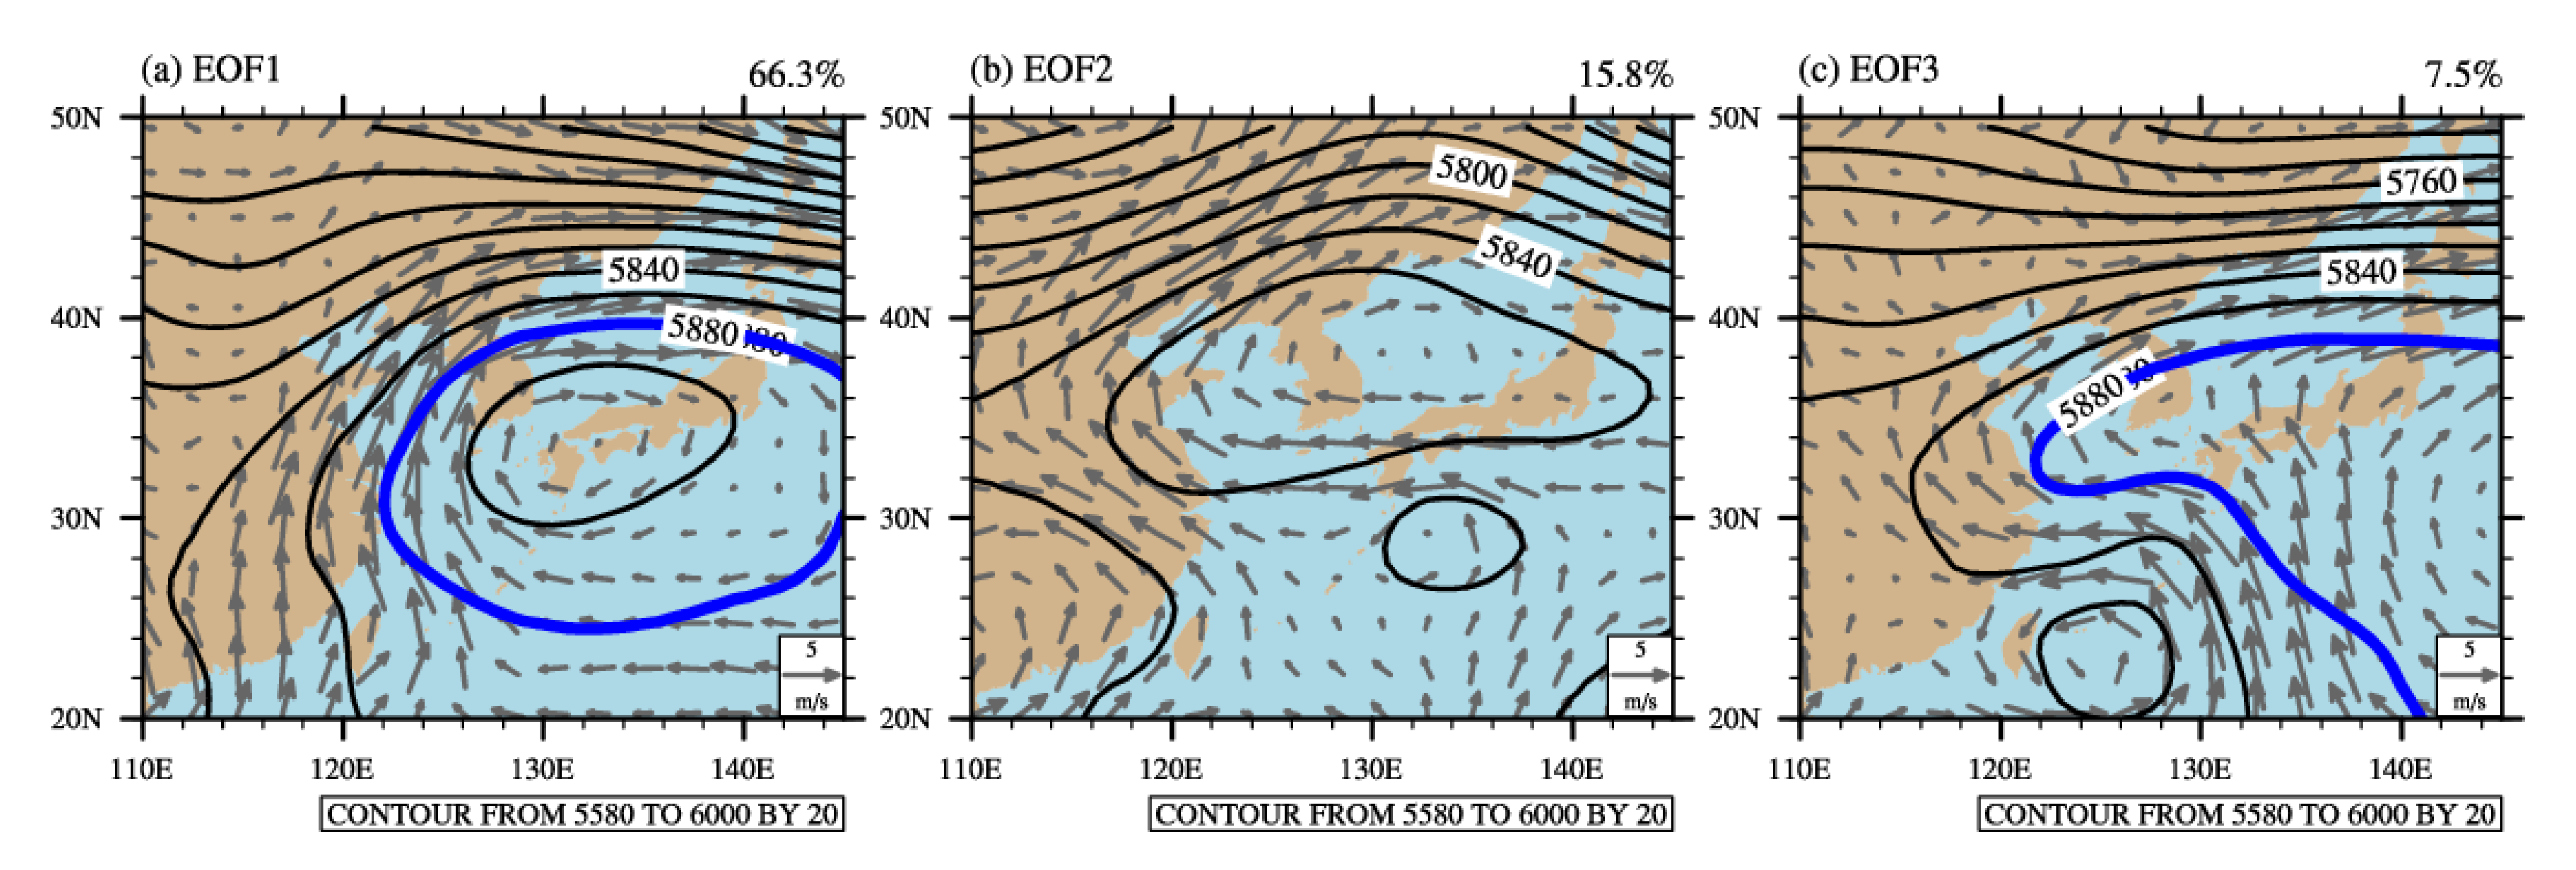
To understand the synoptic-scale atmospheric circulation related to the increase of heat extremes, here, we conducted Empirical Orthogonal Function (EOF) analysis using hot day temperatures. For simplicity, the target period for EOF analysis was set to the boreal summer (June–July–August, JJA) season which almost covered Stages 3 to 5, which presents a large portion of hot days among rice phenology stages (Table 3, Figure 6). In addition, the temperature anomaly of the days with T k o r warmer than the 95th percentile of T k o r were selected as input vectors of EOF analysis. Figure 7 examines the eigen vector of the first three EOF modes from REF. The first mode of EOF was characterized as a dominant positive temperature anomaly in the whole of S. Korea and accounted for 66.3% of hot days (Figure 7a). The second mode, which explains 15.8% of hot days, showed the dipole shape of temperature anomaly with a warm core at the western part of S. Korea (Figure 7b). The last mode had a temperature gradient southward and covered 7.5% of hot day temperature variability (Figure 7c).
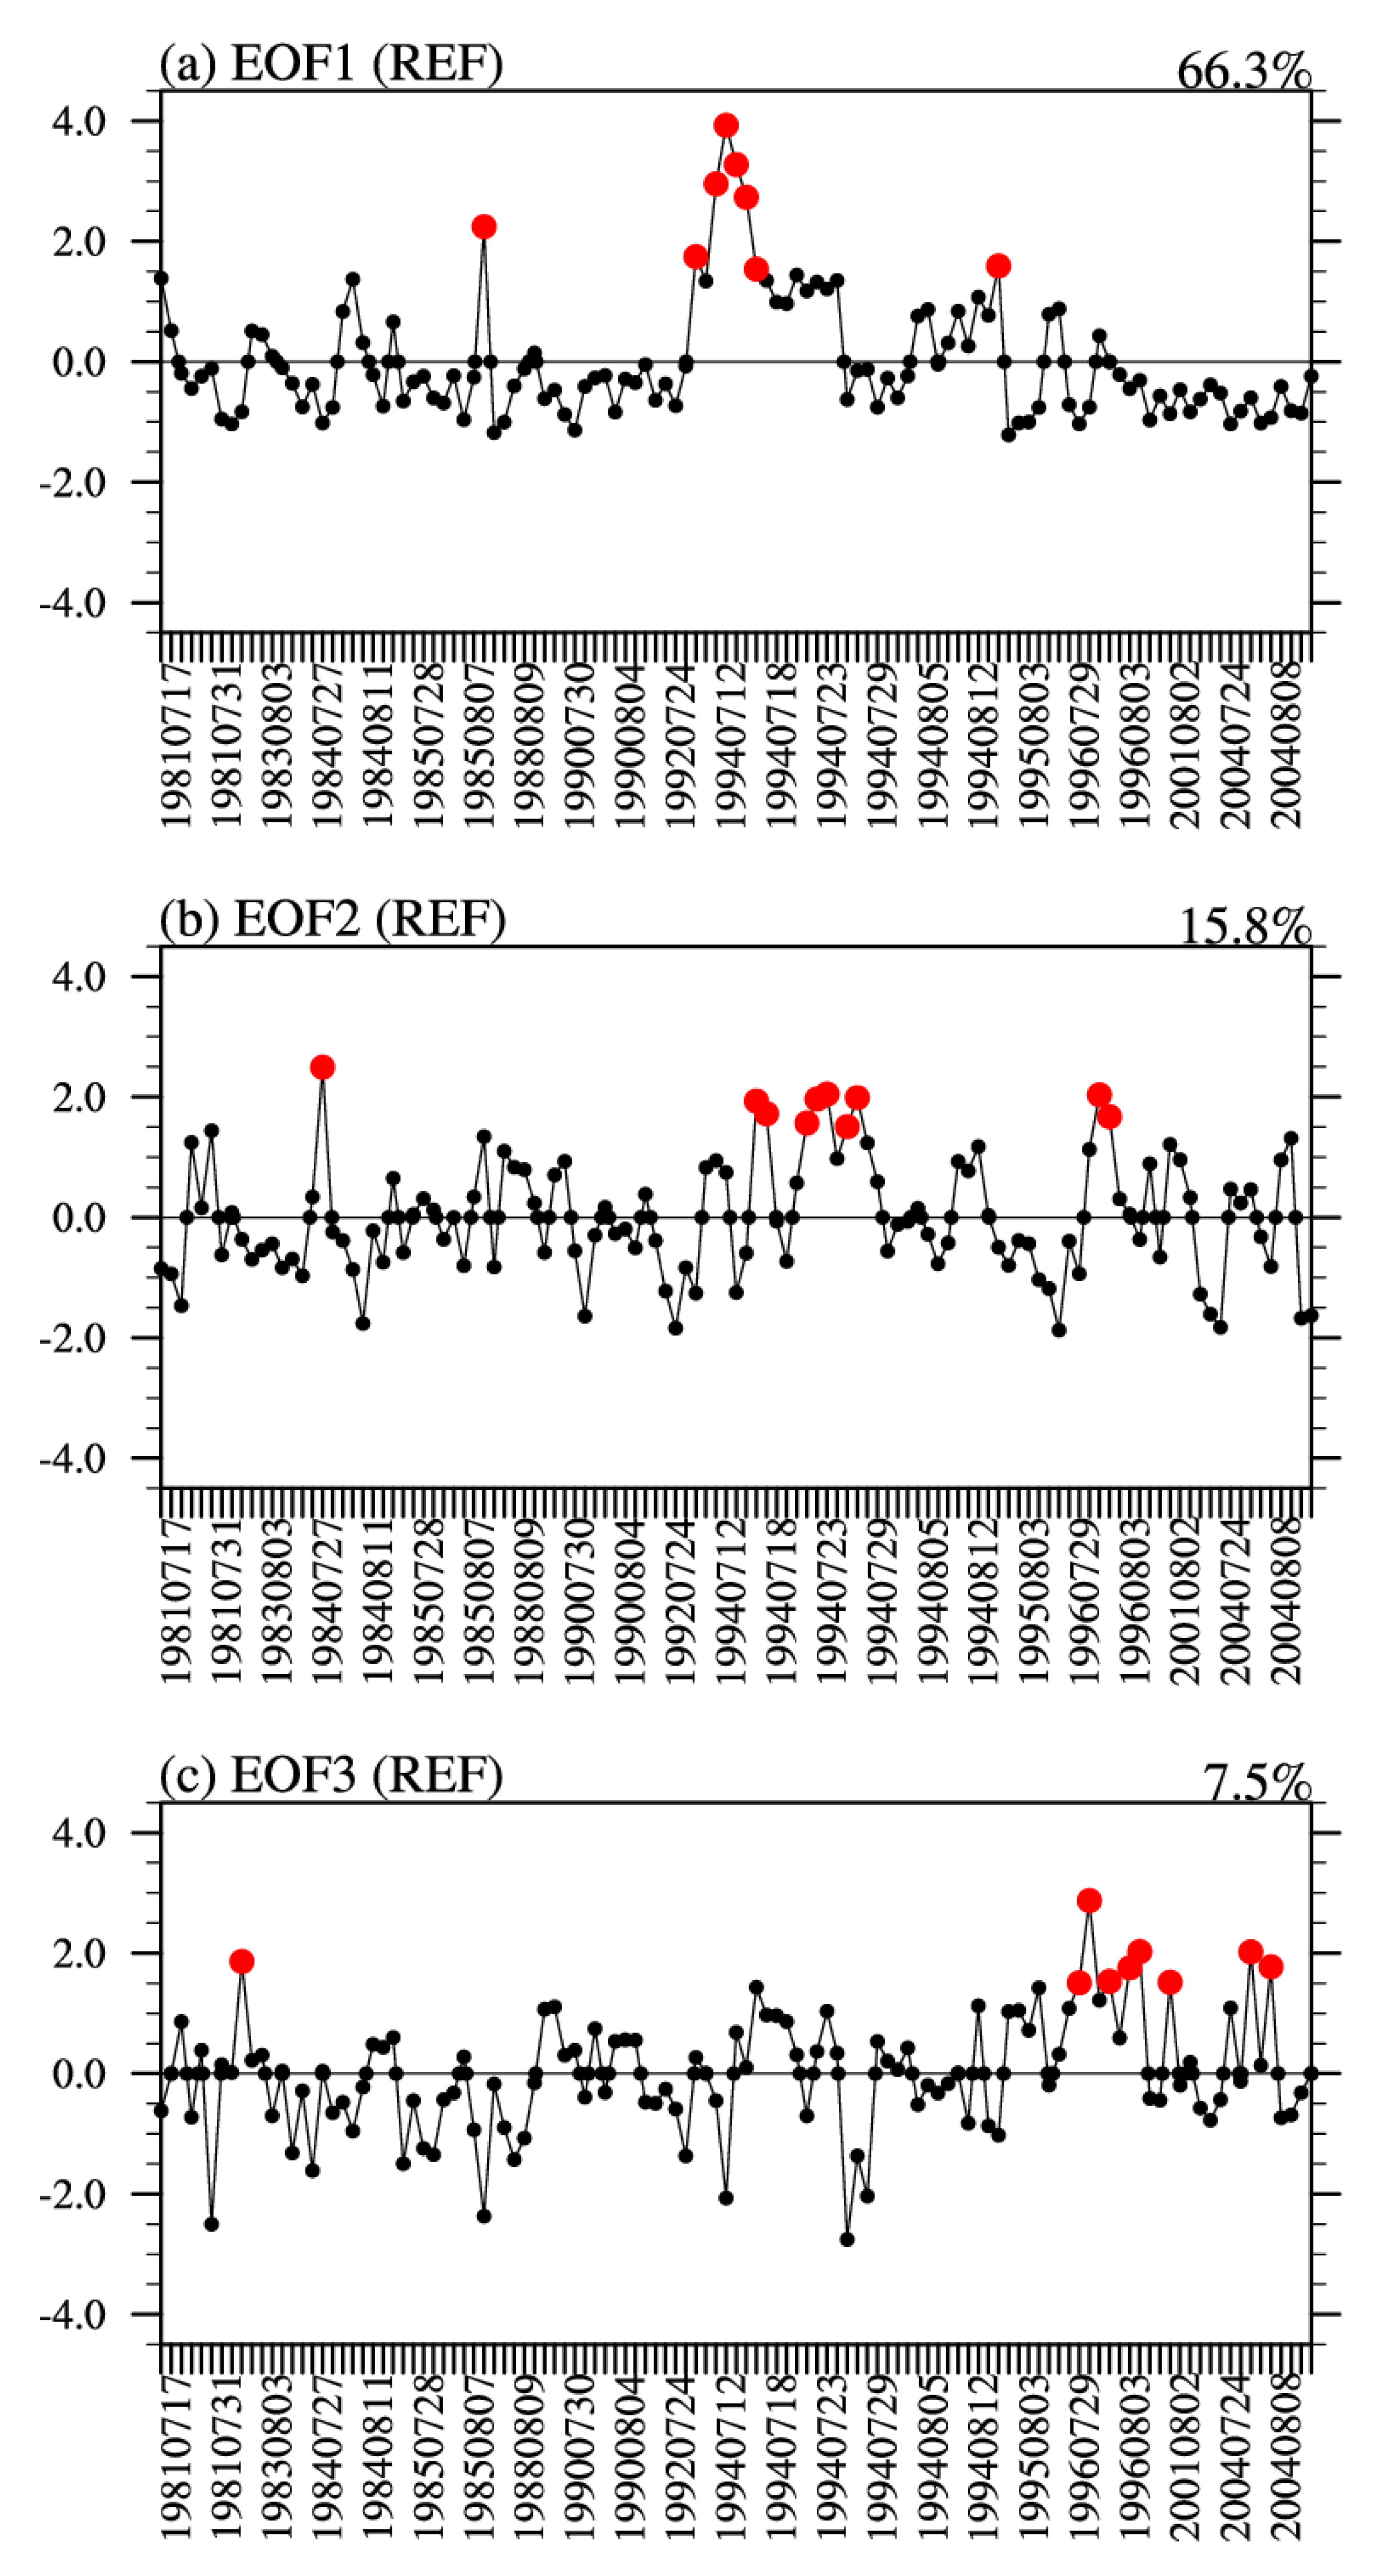
The principal component (PC) time series of each corresponding EOF modes are described in Figure 8. Since the temperature anomalies were used as input vectors of EOF analysis discontinuously related to hot days, only the strong events with PC values more than 1.5 were utilized for composite analysis to explore synoptic-scale atmospheric circulations corresponding to each mode.
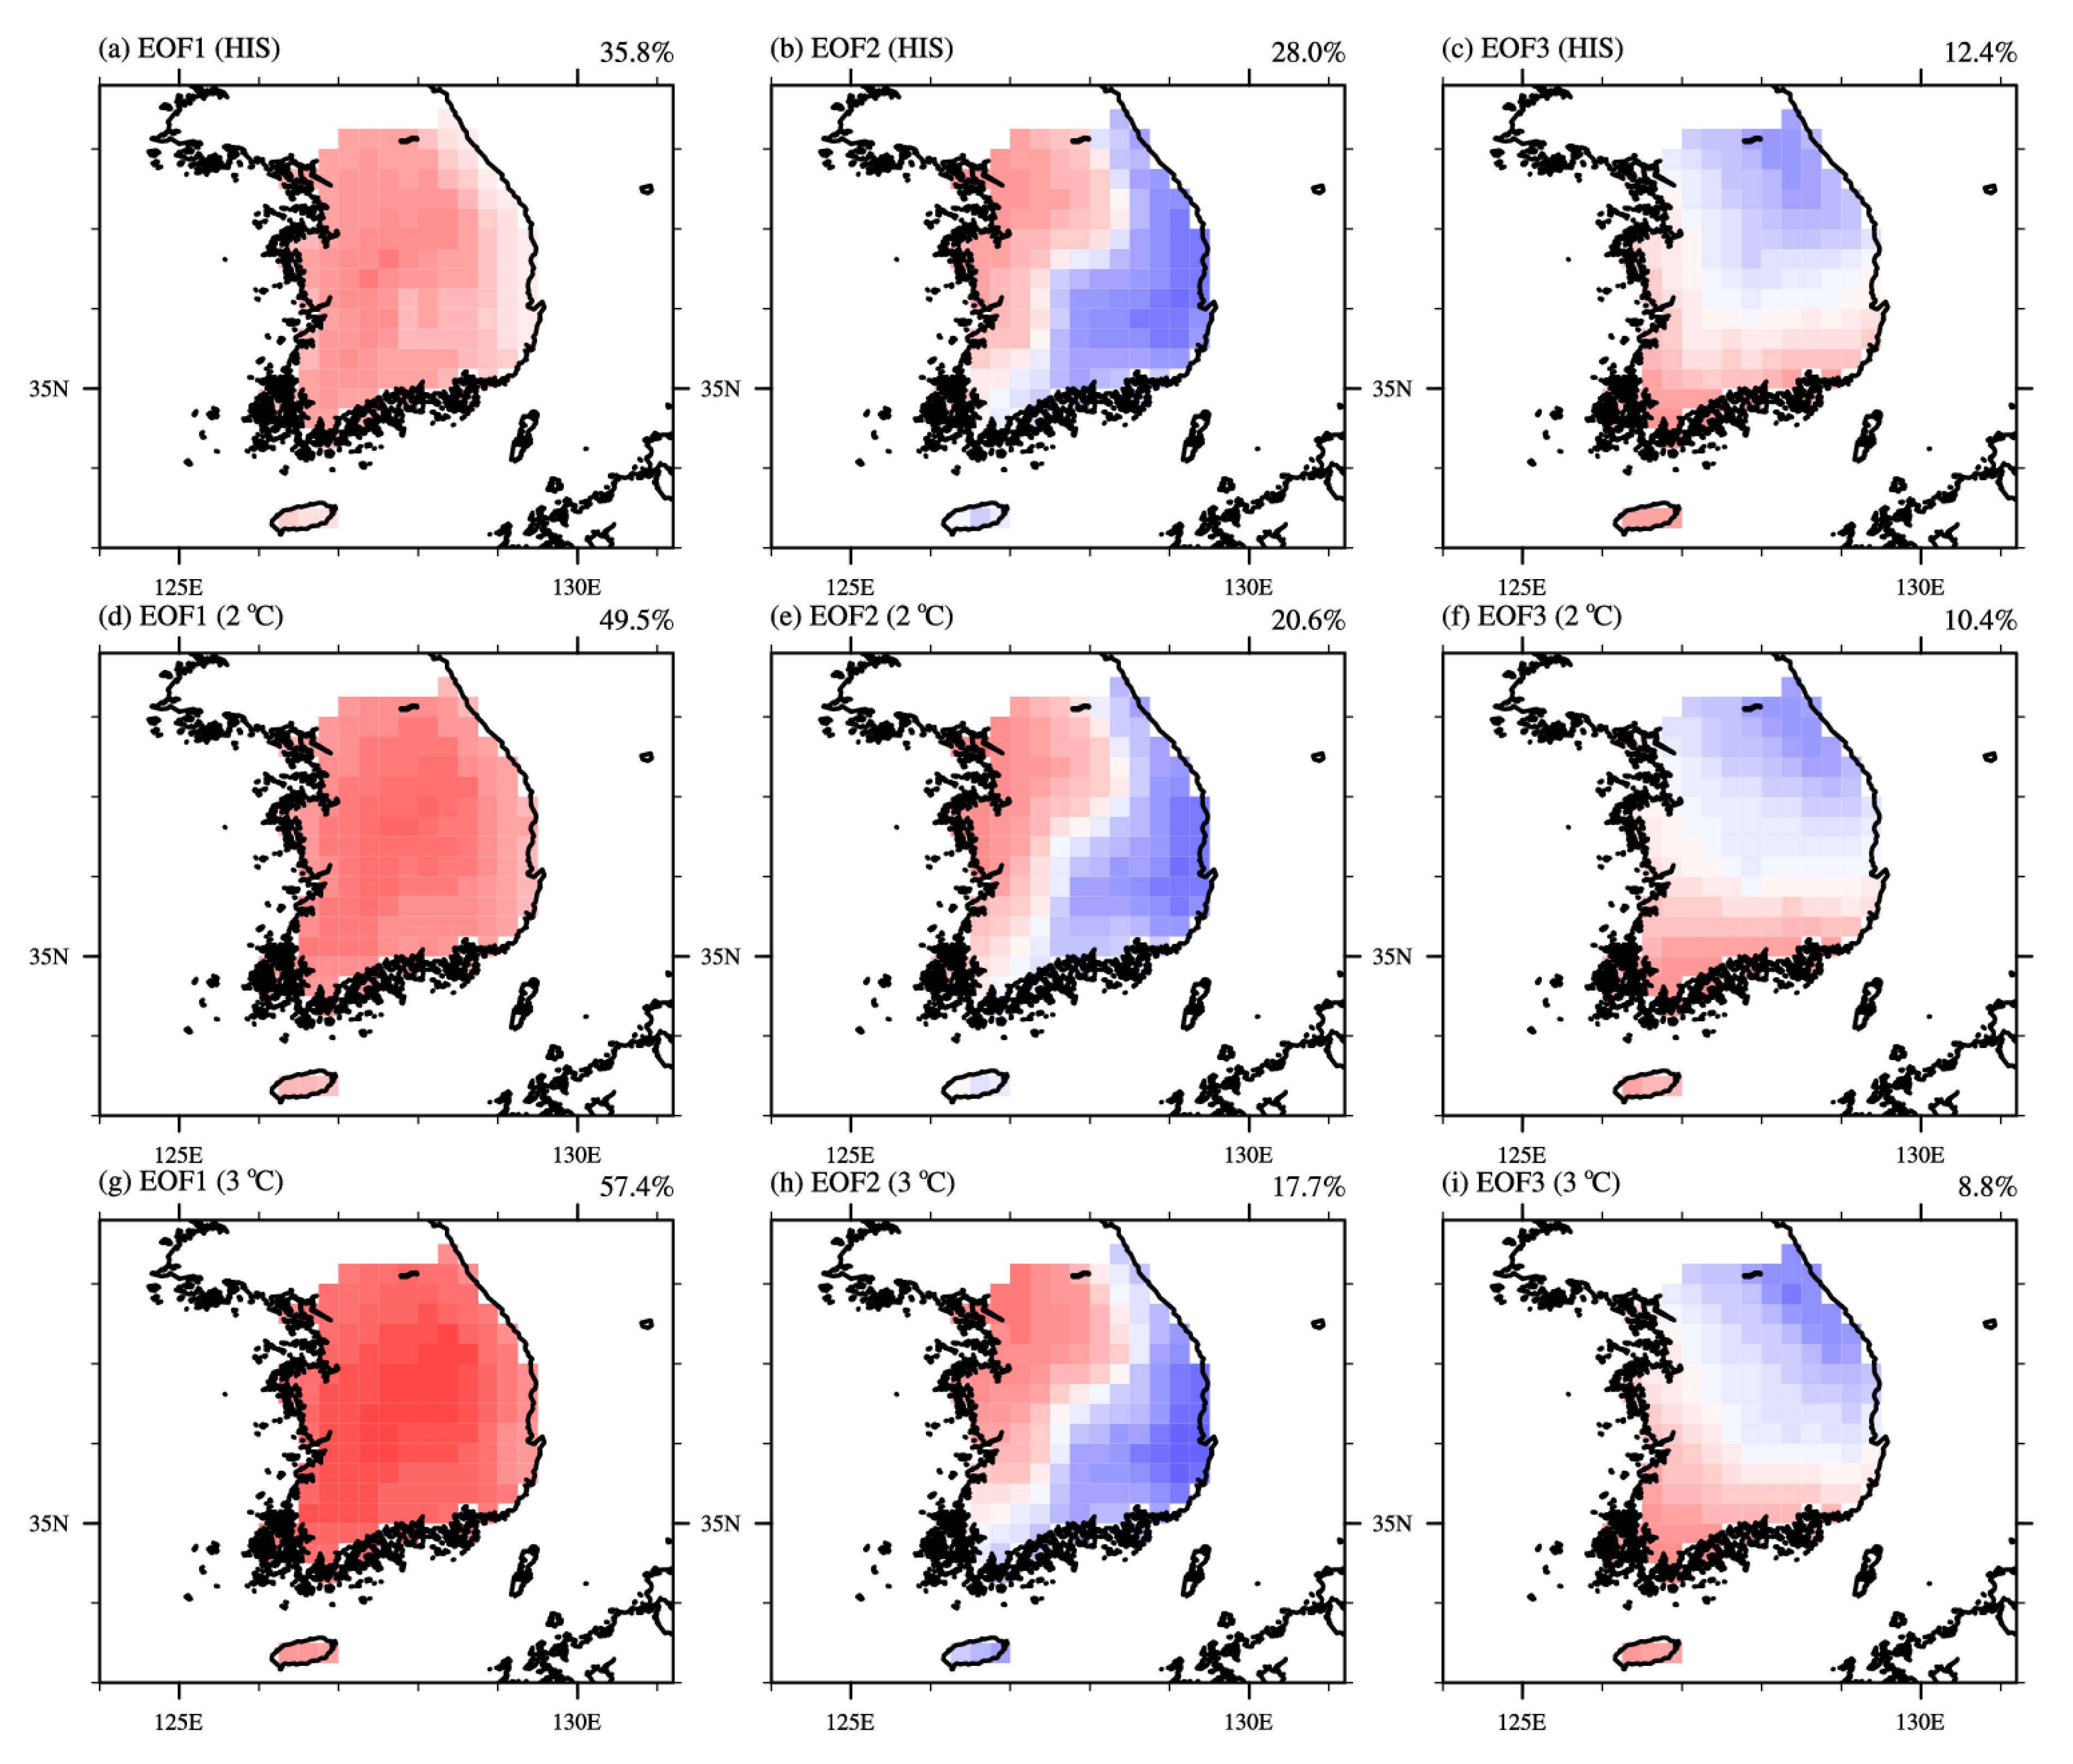
Figure 9 exhibits the hot day composite of 500 hPa geopotential height (contour), and 850 hPa wind (vector) around Korean peninsula. The thick blue contour, 5880 gpm, indicates the edge of Western Northern Pacific Subtropical High (WNPSH). Firstly, the composite map corresponding to the first EOF mode denoted the barotropic anti-cyclonic system covering S. Korea with the expansion of WNPSH near the Korea–Japan region (Figure 9a). This high-pressure system led to intense incoming solar radiation with fair weather as well as the warm air advection from tropics along the WNPSH [58,59,60]. The second mode was relevant for the “Foehn” wind occurring when the wind passed over mountain. According to the geographic features of S. Korea, when the easterly wind blows to the high-altitude topography, the lee side of a mountain range becomes dry and warm due to the adiabatic warming of the subsequent air which has dropped most of its moisture from windward slopes [61,62]. This easterly wind around S. Korea could be derived by two synoptic circulations: One is a high-pressure system around the East Sea and the other is the cyclonic system located in Southern Japan. Under this synoptic condition, it can exhibit huge westward temperature gradients with extreme heat events, as shown in Figure 7b. The final mode was linked to the northwest expansion of WNPSH, the core of which lies in the Western Pacific near 150° E. It has been shown that the mid- to the northern part of S. Korea lying under the edge of WNPSH with low-level wind convergence could be interpreted as being affected by the Chang-ma front, which is a stationary rain band as a part of the East Asian summer monsoon with a cooling effect with intense and steady precipitation and a thick cloud layer, resulting in a decrease in temperature compared to the surrounding regions. On the other hand, as shown in Figure 7c, the southern part of S. Korea is supplied with hot and humid air from the tropics, resulting in an increase of hot day events. These three major hot day patterns are almost consistent with those of Yoon et al. [63] which classified heat wave events over S. Korea into three temperature patterns with the K-means clustering method. Therefore, despite the limitation of EOF analysis which mathematically decomposed the eigenvectors on the orthogonal axis, this simple classification could lead to a reasonable explanation about hot events over S. Korea. As for regional climate models, HIS (Figure 10a–c) showed a similar pattern of the major three eigenvectors compared to REF (Figure 7) with reasonable synoptic circulations, but with some biases (Figure S5). In addition, the order of EOF modes was the same as REF, but the percentages of each mode involved some biases (Figure 10a–c). The models tended to underestimate the frequency of the first EOF mode (35.8%) than REF. The second and third modes accounted for total variations of 28.0% and 12.4% each, which were larger than REF. This could be caused by model bias in simulating atmospheric circulation around the Korean peninsula. Figure S6 examines the climatology and the bias of RCMs for 500 hPa geopotential height and 850 hPa wind during JJA. The climatological position of WNPSH during JJA is Northwestern Pacific Ocean, and the southwesterly wind prevails over the S. Korea region (Figure S6). However, the model had a negative bias in 500 hpa geopotential height, except for East Sea and the eastern part of Japan. Due to these biases, the position of the 5880 gpm line in model climatology was difficult to be identical to that of REF, which induced southerly wind at the southern part of S. Korea and Japan, leading to underestimating the frequency of the first EOF mode compared to REF.
Under the 2 and 3 °C GWL, the first EOF mode-like heat events were projected to be more dominant from 35.8% (Figure 10a) to 49.5% (Figure 10d) and 57.4% (Figure 10g), with a stronger positive anomaly at the center of S. Korea. The portion of the second EOF mode was projected to decrease from 28.0% to 20.6% (2 °C GWL) and 17.7% (3 °C GWL) (Figure 10b,e,h). The hot day type shift to the first EOF mode was linked to the climatological change of atmospheric circulation. Under global warming, thermal expansion of the atmosphere led to increased geopotential height [64], which was a favorable condition for the frequent occurrence of barotropic anti-cyclonic systems around the Korean peninsula. Under 3 °C GWL, especially, the anomalous build-up of high-pressure over both land (Southern China) and ocean (Western North Pacific) decreased the pressure gradient, and the low-level wind difference (northwesterly wind, Figure S7d) had direction in decelerating the background wind (southerly wind, Figure S6b) over the Korean peninsula, resulting in slowing down the moving of synoptic systems, leading to an increased duration of heat extremes as well as the frequency in the future.
To examine the changes of the heat extreme’s intensity, Figure 11 represents the PDF and box plot of temperature during hot day events. The temperature at whole grids pointed over S. Korea on hot days were used to express the statistical characteristics of hot day temperature. The PDF of REF showed relatively higher kurtosis and mean (REF: 27.66/HIS: 27.18) than HIS. Those differences could be explained by the portion of the first EOF mode. For REF, the first EOF mode (anomalous warm temperature covering the whole of S. Korea) accounted for 66.3% of total hot day variance, whereas HIS had more portions with regional variation types (second (28.0%) and third (12.4%) EOF modes; Figure 10b,c) compared to REF (second (15.8.0%) and third (7.5%) EOF modes; Figure 7b,c). Therefore, REF showed more sharply concentrated shapes with a thick upper tail (Figure 11a) and shorter lower whisker (Figure 11b) compared to HIS. Comparing the 2 and 3 °C GWL with HIS, the PDF spread to hotter temperature ranges (Figure 11a). The mean increases from 27.18 to 27.89 (2 °C GWL) and 28.41 °C (3 °C GWL), and the range of the box shifted to warmer regimes in proportion to global warming levels. The upper limit of the box during HIS was located inside of the box ranges under 2 and 3 °C GWL, which demonstrated that the extreme heat events in level of the present climate would be common in the future and more severe heat extremes are expected with higher probability in the future.
Consequently, the extreme temperature changes over S. Korea, due to the increased probability to expose extreme heat events during sensitive phenology stages to heat stress, will result in the negative influence on cultivation of rice under 2 and 3 °C GWL. These changes are derived by synoptic atmospheric environment changes to the favorable condition for the build-up of the high-pressure system around S. Korea, resulting in the frequent occurrence of a nationwide heat extreme mode with increased intensity. Further, the result that the increase in hot day ratio does not follow the linear progression of global warming levels implies that globally accepted warming limitations can be not enough for regional climate and agricultural aspects.

4. Discussion and Conclusions

In this study, climate change over S. Korea under 2 and 3 °C GWL and its impacts on rice cultivation was analyzed and subdivided into mean and extreme changes of temperature, with the ensemble regional climate change scenario conducted in the context of CORDEX-EA2. Our results showed that the mean temperature increase under global warming had positive effects such as the extension of vegetable and crop periods and the widening of the cultivatable regions, as well as, simultaneously, negative effects due to the shortening of the reproductive growth period. These support the other previous studies that reported earlier onset of developmental and reproductive phenological stages of crops all over the world [65,66,67,68]. On the other hand, extreme heat changes in the future clearly showed a negative effect on rice cultivation via the increase of hot days during heat-sensitive stages, determining the rice yield in tandem with rice flowering, ripening, and sterility problems. This alerted the issues that crop management should be modified in the future by considering the development of a cropping system optimized to regional characteristics, cropping practices including crop calendar, and heat-tolerant varieties that are suitable under increased heat stress conditions. Moreover, site-specific measures should be undertaken to assess the regional vulnerability for extreme hot events and set practical crop management plans. Furthermore, the changing of the hot day ratio tended to respond to the increase of GWL nonlinearly (Figure 6), alerting that mitigation goals based on GMST warming do not guarantee the affordable changes in regional climates [5].
Meanwhile, these changes were linked with the shift of the temperature PDF toward warmer temperature, resulting in an increased probability and intensity of hot events, owing to the increase of nationwide-type heat events (first EOF mode) associated with the barotropic anti-cyclonic system covering the whole of S. Korea. The increase of this type was due to the expansion of atmosphere thickness under global warming, leading to favorable conditions for the first EOF mode related to synoptic circulation. Previous studies concerning the extreme heat events such as heatwave could lend support to the results of this study [60,69]. Zhang et al. [69] reported that shrinking Arctic sea ice and Eurasian snow cover can increase the probability of more persistent blocking events favoring frequent and enhanced heatwaves. A rise in the air temperature under global warming tends to decrease Arctic sea ice and Eurasian snow, leading to weakening the poleward temperature gradient at mid-high latitudes, thereby impacting on the mid-latitude jet stream and transient eddy activities. It is closely related to slow-moving Rossby waves in mid-latitude systems, as a result of which extreme heat events covering the whole of S. Korea would occur actively in the future due to the persistent barotropic anti-cyclonic condition such as blocking events. Therefore, despite the benefits of mean temperature increase on longer vegetation and crop growth period and broader cultivatable region, the exposure to more frequent and intense heat extremes during heat-sensitive phenology stages and shortening of each phenology stage will end up in decreased rice yield in the future.
On one hand, for interpreting model-based future projection, the uncertainties from a small number of ensemble members and model biases should be considered. In particular, the model bias can increase the uncertainty in climate change impact assessment in the agricultural field utilizing the thresholds obtained from empirical values under the present climate condition. Although this study chose LBC with consideration about GCM performance on the EA region and employed bias-correction-applied temperature, the result should be interpreted with the understanding that this is one of the feasible future changes with uncertainties as other future projection studies do.
Furthermore, there is a discrepancy between heat extremes in grid-scale climate model resolution and actual farm-scale with canopy. In general, the values at model grids represent the status within the grid area. Therefore, climate models tend to underestimate the intensity of extreme events compared to in situ observation [70,71]. This study set the extreme hot day threshold as the ninety-fifth percentile value (25.59 °C when averaged over S. Korea, Figure S3a). When it was estimated with the Automated Surface Observing System (ASOS), the threshold averaged over S. Korea was 26.24 °C (Figure S8). Considering that the day with a high daily mean temperature indicated a high daily maximum temperature based on the statistically significant temporal correlation coefficient (0.97), the days with a temperature hotter than the ninety-fifth percentile (Tmean95) were corresponded to the days with a daily maximum temperature hotter than the ninety-fifth percentile (Tmax95). The Tmax95 of ASOS was around 31~33 °C except for some high-altitude and coastal regions. It would be not hot enough to use as hot extreme events damaging rice (35 °C for Satake and Yoshida [72]; 33 °C for Jagadish et al. [73]; 35 °C for Prasad et al. [74]; 32~36 °C for Weerakoon et al. [75]). However, by considering the mandatory for ASOS stations that should be installed on an ideal place without any interruption of canopy or other obstructions to represent the climate in the synoptic scale, it is possible that the rice would be potentially exposed to high-temperatures enough to damage with additional effects an in situ environment such as geology, canopy, and other artificial obstructions. Hence, this climatic extreme temperature index is still worthy of representing extreme heat events in the rice growth aspect.
Furthermore, it is noteworthy that the change of heat extremes and their impact on rice yield have been assessed accompanied by the analysis of synoptic atmospheric circulation changes under target GWL. These results are also in line with previous studies which estimate the rice yield directly with the DSSAT model [76], CERES [13], or statistically estimated with the Climatic Yield Potential (CYP) index [16,17]. These results are expected to provide useful insights for assessing the impact of heat extreme change on agriculture fields in line with other target GWL impact studies and optimization of rice variety and crop calendars for upcoming climate changes in the future.

Supplementary Materials

The following are available online at https://www.mdpi.com/2073-4433/11/12/1336/s1, Figure S1: The time series of Global Mean Surface Temperature with historical, RCP4.5 and RCP8.5 scenarios of MPI-ESM-LR model, Figure S2: Spatial distribution of annual mean temperature over S. Korea during 1981–2005, Figure S3: The spatial distribution of T95 over S. Korea, Figure S4: The days ratio (%) higher than 95percentile temperature, Figure S5: The strong event composites of synoptic atmospheric circulations of historical experiment, Figure S6: The climatology of synoptic circulations and model biases, Figure S7: The climatology of synoptic circulation in the future (2 and 3 °C GWL), Figure S8:The relationships between 95percentile values of Tmean and Tmax over S. Korea.

Author Contributions

Conceptualization, S.J. and K.-M.S.; data curation, S.J. and Y.-S.K.; formal analysis, S.J. and J.H.; investigation, S.J. and J.H.; methodology, S.J., K.-M.S., and Y.-S.K.; resources, J.-B.A.; software, S.J. and J.H.; supervision, K.-M.S. and J.-B.A.; writing—original draft, S.J.; writing—review and editing, K.-M.S. and J.H. All authors have read and agreed to the published version of the manuscript.

Funding

This study was carried out with the support of the Research Program for Agricultural Science and Technology Development (Project No. PJ01493701), the National Institute of Agricultural Sciences, Rural Development Administration, Republic of Korea.

Acknowledgments

We thank the Korean Meteorological Administration’s supercomputer management division for providing us with the supercomputer resource and for consultation with technical support. The CORDEX-EA phase 2 database can be downloaded from the ESGF node (https://esg-dn1.nsc.liu.se/search/cordex/).

Conflicts of Interest

The authors declare no conflict of interest. The funders had no role in the design of the study; in the collection, analyses, or interpretation of data; in the writing of the manuscript; or in the decision to publish the results.

References

  1. United Nations. Paris Agreement. 2015. Available online: https://unfccc.int/sites/default/files/english_paris_agreement.pdf (accessed on 20 December 2015).
  2. Knutti, R.; Rogelj, J. The Legacy of Our CO2 Emissions: A Clash of Scientific Facts, Politics and Ethics. Clim. Chang. 2015, 133, 361–373. [Google Scholar] [CrossRef]
  3. Raftery, A.E.; Zimmer, A.; Frierson, D.M.W.; Startz, R.; Liu, P. Less than 2 °C Warming by 2100 Unlikely. Nat. Clim. Chang. 2017, 7, 637–641. [Google Scholar] [CrossRef]
  4. Mauritsen, T.; Pincus, R. Committed Warming Inferred from Observations. Nat. Clim. Chang. 2017, 7, 652–655. [Google Scholar] [CrossRef]
  5. Ruff, T.W.; Neelin, J.D. Long Tails in Regional Surface Temperature Probability Distributions with Implications for Extremes under Global Warming. Geophys. Res. Lett. 2012, 39, 1–6. [Google Scholar] [CrossRef] [Green Version]
  6. Kirtman, B.; Power, S.B.; Adedoyin, A.J.; Boer, G.J.; Bojariu, R.; Camilloni, I.; Doblas-Reyes, F.; Fiore, A.M.; Kimoto, M.; Meehl, G.; et al. Near-term climate change: Projections and predictability. In Climate Change 2013 the Physical Science Basis: Working Group I Contribution to the Fifth Assessment Report of the Intergovernmental Panel on Climate Change; Intergovernmental Panel on Climate Change, Ed.; Cambridge University Press: Cambridge, UK, 2013; Volume 9781107057, pp. 953–1028. [Google Scholar] [CrossRef]
  7. James, R.; Washington, R.; Schleussner, C.F.; Rogelj, J.; Conway, D. Characterizing Half-a-Degree Difference: A Review of Methods for Identifying Regional Climate Responses to Global Warming Targets. Wiley Interdiscip. Rev. Clim. Chang. 2017, 8, e457. [Google Scholar] [CrossRef] [Green Version]
  8. KMA. Annual Report for 2018 Extreme Climate; Korean Meteorological Administration: Seoul, Korea, 2019; pp. 1–198. Available online: https://climate.go.kr/home/bbs/view.php?bname=abnormal&vcode=6232 (accessed on 31 January 2019).
  9. Im, E.S.; Thanh, N.X.; Kim, Y.H.; Ahn, J.B. 2018 Summer Extreme Temperatures in South Korea and Their Intensification under 3 °C Global Warming. Environ. Res. Lett. 2019, 14, 094020. [Google Scholar] [CrossRef]
  10. WMO. WMO Statement on the State of the Global Climate in 2019; WMO-No. 1248; WMO: Geneva, Switzerland, 2020. [Google Scholar]
  11. Iizumi, T.; Ramankutty, N. How Do Weather and Climate Influence Cropping Area and Intensity? Glob. Food Sec. 2015, 4, 46–50. [Google Scholar] [CrossRef] [Green Version]
  12. Wang, X.; Zhao, C.; Müller, C.; Wang, C.; Ciais, P.; Janssens, I.; Peñuelas, J.; Asseng, S.; Li, T.; Elliott, J.; et al. Emergent Constraint on Crop Yield Response to Warmer Temperature from Field Experiments. Nat. Sustain. 2020, 3, 908–916. [Google Scholar] [CrossRef]
  13. Guo, Y.; Wu, W.; Du, M.; Liu, X.; Wang, J.; Bryant, C.R. Modeling Climate Change Impacts on Rice Growth and Yield under Global Warming of 1.5 and 2.0 °C in the Pearl River Delta, China. Atmosphere 2019, 10, 567. [Google Scholar] [CrossRef] [Green Version]
  14. Chen, Y.; Zhang, Z.; Tao, F. Impacts of Climate Change and Climate Extremes on Major Crops Productivity in China at a Global Warming of 1.5 °C & 2.0 °C. Earth Syst. Dyn. Discuss. 2018, 9, 1–27. [Google Scholar] [CrossRef]
  15. Kim, J.; Sang, W.; Shin, P.; Cho, H.; Seo, M.; Yoo, B.; Kim, K.S. Evaluation of Regional Climate Scenario Data for Impact Assessment of Climate Change on Rice Productivity in Korea. J. Crop Sci. Biotechnol. 2015, 18, 257–264. [Google Scholar] [CrossRef]
  16. Ahn, J.B.; Hong, J.Y.; Shim, K.M. Agro-Climate Changes over Northeast Asia in RCP Scenarios Simulated by WRF. Int. J. Climatol. 2016, 36, 1278–1290. [Google Scholar] [CrossRef]
  17. Ahn, J.B.; Kim, Y.H.; Shim, K.M.; Suh, M.S.; Cha, D.H.; Lee, D.K.; Hong, S.Y.; Min, S.K.; Park, S.C.; Kang, H.S. Climatic Yield Potential of Japonica-Type Rice in the Korean Peninsula under RCP Scenarios Using the Ensemble of Multi-GCM and Multi-RCM Chains. Int. J. Climatol. 2020, 1–16. [Google Scholar] [CrossRef]
  18. Sylla, M.B.; Pal, J.S.; Faye, A.; Dimobe, K.; Kunstmann, H. Climate Change to Severely Impact West African Basin Scale Irrigation in 2 °C and 1.5 °C Global Warming Scenarios. Sci. Rep. 2018, 8, 1–9. [Google Scholar] [CrossRef] [PubMed] [Green Version]
  19. Nikulin, G.; Lennard, C.; Dosio, A.; Kjellström, E.; Chen, Y.; Hansler, A.; Kupiainen, M.; Laprise, R.; Mariotti, L.; Maule, C.F.; et al. The Effects of 1.5 and 2 Degrees of Global Warming on Africa in the CORDEX Ensemble. Environ. Res. Lett. 2018, 13, 065003. [Google Scholar] [CrossRef]
  20. McSweeney, C.F.; Jones, R.G.; Lee, R.W.; Rowell, D.P. Selecting CMIP5 GCMs for Downscaling over Multiple Regions. Clim. Dyn. 2015, 44, 3237–3260. [Google Scholar] [CrossRef] [Green Version]
  21. Collins, M.R.; Knutti, J.; Arblaster, J.-L.; Dufresne, T.; Fichefet, P.; Friedlingstein, X.; Gao, W.J.; Gutowski, T.; Johns, G.; Krinner, M.; et al. Long-term Climate Change: Projections, Commitments and Irreversibility Pages 1029 to 1076. In Climate Change 2013—The Physical Science Basis; Intergovernmental Panel on Climate Change, Ed.; Cambridge University Press: Cambridge, UK, 2013; Volume 9781107057, pp. 1029–1136. [Google Scholar] [CrossRef]
  22. Hawkins, E.; Ortega, P.; Suckling, E.; Schurer, A.; Hegerl, G.; Jones, P.; Joshi, M.; Osborn, T.J.; Masson-Delmotte, V.; Mignot, J.; et al. Estimating Changes in Global Temperature since the Preindustrial Period. Bull. Am. Meteorol. Soc. 2017, 98, 1841–1856. [Google Scholar] [CrossRef]
  23. IPCC. Global Warming of 1.5 °C: An IPCC Special Report on the Impacts of Global Warming of 1.5 °C above Pre-Industrial Levels and Related Global Greenhouse Gas Emission Pathways, in the Context of Strengthening the Global Response to the Threat of Climate Change, Sustainable Development, and Efforts to Eradicate Poverty; Intergovernmental Panel on Climate Change: Geneva, Switzerland, 2018. [Google Scholar]
  24. Jo, S.; Ahn, J.B.; Cha, D.; Min, S.K.; Suh, M.S.; Byun, Y.H.; Kim, J.U. The Köppen-Trewartha Climate-Type Changes Over the CORDEX-East Asia Phase 2 Domain Under 2 and 3 °C Global Warming. Geophys. Res. Lett. 2019, 46, 14030–14041. [Google Scholar] [CrossRef] [Green Version]
  25. Yatagai, A.; Kamiguchi, K.; Arakawa, O.; Hamada, A.; Yasutomi, N.; Kitoh, A. Aphrodite Constructing a Long-Term Daily Gridded Precipitation Dataset for Asia Based on a Dense Network of Rain Gauges. Bull. Am. Meteorol. Soc. 2012, 93, 1401–1415. [Google Scholar] [CrossRef]
  26. Berrisford, P.; Dee, D.; Fielding, K.; Fuentes, M.; Kallberg, P.; Kobayashi, S.; Uppala, S. The ERA-Interim Archive. ERA Rep. Ser. 2009, 1, 1–16. [Google Scholar]
  27. Dee, D.P.; Uppala, S.M.; Simmons, A.J.; Berrisford, P.; Poli, P.; Kobayashi, S.; Andrae, U.; Balmaseda, M.A.; Balsamo, G.; Bauer, P.; et al. The ERA-Interim Reanalysis: Configuration and Performance of the Data Assimilation System. Q. J. R. Meteorol. Soc. 2011, 137, 553–597. [Google Scholar] [CrossRef]
  28. Kug, J.S.; Lee, J.Y.; Kang, I.S. Systematic Error Correction of Dynamical Seasonal Prediction of Sea Surface Temperature Using a Stepwise Pattern Project Method. Mon. Weather Rev. 2008, 136, 3501–3512. [Google Scholar] [CrossRef]
  29. Ahn, J.B.; Lee, J.L.; Im, E.S. The reproducibility of surface air temperature over South Korea using dynamical downscaling and statistical correction. J. Meteorol. Soc. Jpn. 2012, 90, 493–507. [Google Scholar] [CrossRef] [Green Version]
  30. Jo, S.; Ahn, J.B. Improvement of CGCM Prediction for Wet Season Precipitation over Maritime Continent Using a Bias Correction Method. Int. J. Climatol. 2015, 35, 3721–3732. [Google Scholar] [CrossRef]
  31. Lee, J.; Ahn, J.B. A New Statistical Correction Strategy to Improve Long-Term Dynamical Prediction. Int. J. Climatol. 2019, 39, 2173–2185. [Google Scholar] [CrossRef] [Green Version]
  32. Lee, J.; Ahn, J.; Jeong, H. A Study on the Method for Estimating the 30 m-Resolution Daily Temperature Extreme Value Using PRISM and GEV Method. Atmosphere 2016, 26, 697–709, (In Korean with English Abstract). [Google Scholar] [CrossRef] [Green Version]
  33. Cho, D.; Yoo, C.; Im, J.; Cha, D.H. Comparative Assessment of Various Machine Learning-Based Bias Correction Methods for Numerical Weather Prediction Model Forecasts of Extreme Air Temperatures in Urban Areas. Earth Sp. Sci. 2020, 7, 1–18. [Google Scholar] [CrossRef] [Green Version]
  34. Maurer, E.P.; Pierce, D.W. Bias Correction Can Modify Climate Model Simulated Precipitation Changes without Adverse Effect on the Ensemble Mean. Hydrol. Earth Syst. Sci. 2014, 18, 915–925. [Google Scholar] [CrossRef] [Green Version]
  35. Maraun, D.; Shepherd, T.G.; Widmann, M.; Zappa, G.; Walton, D.; Gutiérrez, J.M.; Hagemann, S.; Richter, I.; Soares, P.M.M.; Hall, A.; et al. Towards Process-Informed Bias Correction of Climate Change Simulations. Nat. Clim. Chang. 2017, 7, 764–773. [Google Scholar] [CrossRef] [Green Version]
  36. Chen, J.; Brissette, F.P.; Chaumont, D.; Braun, M. Finding Appropriate Bias Correction Methods in Downscaling Precipitation for Hydrologic Impact Studies over North America. Water Resour. Res. 2013, 49, 4187–4205. [Google Scholar] [CrossRef]
  37. Teutschbein, C.; Seibert, J. Bias Correction of Regional Climate Model Simulations for Hydrological Climate-Change Impact Studies: Review and Evaluation of Different Methods. J. Hydrol. 2012, 456–457, 12–29. [Google Scholar] [CrossRef]
  38. Cannon, A.J.; Sobie, S.R.; Murdock, T.Q. Bias Correction of GCM Precipitation by Quantile Mapping: How Well Do Methods Preserve Changes in Quantiles and Extremes? J. Clim. 2015, 28, 6938–6959. [Google Scholar] [CrossRef]
  39. Eum, H.I.; Cannon, A.J. Intercomparison of Projected Changes in Climate Extremes for South Korea: Application of Trend Preserving Statistical Downscaling Methods to the CMIP5 Ensemble. Int. J. Climatol. 2017, 37, 3381–3397. [Google Scholar] [CrossRef]
  40. Bhatia, K.T.; Vecchi, G.A.; Knutson, T.R.; Murakami, H.; Kossin, J.; Dixon, K.W.; Whitlock, C.E. Recent Increases in Tropical Cyclone Intensification Rates. Nat. Commun. 2019, 10, 1–9. [Google Scholar] [CrossRef] [PubMed]
  41. Ketring, D.L.; Wheless, T.G. Thermal Time Requirements for Phenological Development of Peanut. Agron. J. 1989, 81, 910–917. [Google Scholar] [CrossRef]
  42. Gouri, V.; Reddy, D.R.; Rao, S.B.S.N.; Rao, A.Y. Thermal requirement of Rabi groundnut in southern Telangana zone of Andhra Pradesh. J. Agrometeorol. 2005, 7, 90–94. [Google Scholar]
  43. Dar, E.A.; Brar, A.S.; Yousuf, A. Growing Degree Days and Heat Use Efficiency of Wheat as Influenced by Thermal and Moisture Regimes. J. Agrometeorol. 2018, 20, 168–170. [Google Scholar]
  44. Islam, M.R.; Sikder, S. Phenology and Degree Days of Rice Cultivars under organic culture. Bangladesh J. Bot. 2011, 40, 149–153. [Google Scholar] [CrossRef] [Green Version]
  45. Jayapriya, S.; Ravichandran, V.; Boominathan, P.; Guru, G. Study of weather based agro indices on grain yield of rice genotypes. J. Agrometeorol. 2017, 19, 80–85. [Google Scholar]
  46. Lee, S.S. Utilization of Growing Degree Days as an Index of Growth Duration of Rice Varieties. Korean J. Crop Sci. 1983, 28, 173–183. [Google Scholar]
  47. Nam, J.-K.; Park, H.-S.; Baek, M.-K.; Cho, Y.-C.; Kim, W.-J.; Kim, J.-J.; Kim, B.-K.; Kim, K.-Y.; Shin, W.-C.; Ko, J.-C.; et al. Bacterial Blight-Resistant Medium Maturing Rice Cultivar ‘Haepum’ with High Grain Quality. Korean J. Breed. Sci. 2019, 51, 222–233. [Google Scholar] [CrossRef]
  48. RDA. Implementation of an Early Warning Service for Weather Risk Management in Climate-Smart Agriculture; Rural Development Administration: Wanju-si, Korea, 2018.
  49. Park, K.H.; Lee, B.-W.; Hong, B.-H.; Kim, S.-C. Introduction of Rice Cultivation Technology; Hyangmoon Press: Seoul, Korea, 2004; 21p. (In Korean) [Google Scholar]
  50. Cho, D.S.; Jong, S.K.; Heo, H.; Yuk, C.S. Quantitative analysis of dry matter production and its partition in rice. I. Leaf development as affected by transplanting date. Korean J. Crop Sci. 1990, 35, 265–272. [Google Scholar]
  51. Shim, K.; Kim, G.; Roh, K.; Jeong, H.; Lee, D. Evaluation of Agro-Climatic Indices under Climate Chang. Korean J. Agric. For. Meteorol. 2008, 10, 113–120. [Google Scholar] [CrossRef]
  52. Yoshida, S. Fundamentals of Rice Crop Science; International Rice Research Institute: Los Baños, Philippines, 1981; pp. 65–109. [Google Scholar]
  53. Kim, J.; Shon, J.; Choi, K.; Yang, W.; Lee, C.K. Study on improving high-temperature tolerance for grain filling through adjusting sink size. Korean J. Crop Sci. 2013, 58, 107–112, (In Korean with English Abstract). [Google Scholar] [CrossRef]
  54. KOSTAT. Rice Production in 2018; Korean National Statistical Office: Seoul, Korea, 2018.
  55. FAO (Food and Agriculture Organization of the United Nations). Crop Prospects and Food Situation; FAO: Rome, Italy, 2007; No. 3. [Google Scholar]
  56. FAO. Crop Prospects and Food Situation; FAO: Rome, Italy, 2010; No. 4. [Google Scholar]
  57. FAO. Crop Prospects and Food Situation; FAO: Rome, Italy, 2012; No. 5. [Google Scholar]
  58. Wang, W.; Zhou, W.; Li, X.; Wang, X.; Wang, D. Synoptic-Scale Characteristics and Atmospheric Controls of Summer Heat Waves in China. Clim. Dyn. 2016, 46, 2923–2941. [Google Scholar] [CrossRef]
  59. Yeh, S.W.; Won, Y.J.; Hong, J.S.; Lee, K.J.; Kwon, M.; Seo, K.H.; Ham, Y.G. The Record-Breaking Heat Wave in 2016 over South Korea and Its Physical Mechanism. Mon. Weather Rev. 2018, 146, 1463–1474. [Google Scholar] [CrossRef]
  60. Min, K.H.; Chung, C.H.; Bae, J.H.; Cha, D.H. Synoptic Characteristics of Extreme Heatwaves over the Korean Peninsula Based on ERA Interim Reanalysis Data. Int. J. Climatol. 2020, 40, 3179–3195. [Google Scholar] [CrossRef]
  61. Lee, H.-Y. The Nopsae, A Foehn type wind over the Young Suh region of Central Korea. J. Korea Geogr. Soc. 1994, 29, 266–280. [Google Scholar]
  62. Nishi, A.; Kusaka, H. Effect of Foehn Wind on Record-Breaking High Temperature Event (41.1 °C) at Kumagaya on 23 July 2018. Sola 2019, 15, 17–21. [Google Scholar] [CrossRef] [Green Version]
  63. Yoon, D.; Cha, D.H.; Lee, G.; Park, C.; Lee, M.I.; Min, K.H. Impacts of Synoptic and Local Factors on Heat Wave Events Over Southeastern Region of Korea in 2015. J. Geophys. Res. Atmos. 2018, 123, 12081–12096. [Google Scholar] [CrossRef]
  64. Christidis, N.; Jones, G.S.; Stott, P.A. Dramatically Increasing Chance of Extremely Hot Summers since the 2003 European Heatwave. Nat. Clim. Chang. 2015, 5, 46–50. [Google Scholar] [CrossRef]
  65. Hu, Q.; Weiss, A.; Feng, S.; Baenzinger, P.S. Earlier winter wheat heading dates and warmer spring in the U.S. Great Plains. Agric. For. Meteor. 2005, 135, 284–290. [Google Scholar]
  66. Tao, F.; Yokozawa, M.; Xu, Y.; Hayashi, Y.; Zhang, Z. Climate changes and trends in phenology and yields of field crops in China, 1981–2000. Agric. For. Meteor. 2006, 138, 82–92. [Google Scholar] [CrossRef]
  67. Estrella, N.; Sparks, T.H.; Menzel, A. Trends and temperature response in the phenology of crops in Germany. Glob. Chang. Biol. 2007, 13, 1737–1747. [Google Scholar] [CrossRef]
  68. Kamoutsis, A.; Matsoukis, A.; Chronopoulou-Sereli, A. Triticum aestivum L. Phenological response to air temperature in Greece. Ital. J. Agrometeorol. 2010, 2, 51–55. [Google Scholar]
  69. Zhang, R.; Sun, C.; Zhu, J.; Zhang, R.; Li, W. Increased European Heat Waves in Recent Decades in Response to Shrinking Arctic Sea Ice and Eurasian Snow Cover. NPJ Clim. Atmos. Sci. 2020, 3, 1–9. [Google Scholar] [CrossRef] [Green Version]
  70. Alexander, L.V.; Arblaster, J.M. Historical and Projected Trends in Temperature and Precipitation Extremes in Australia in Observations and CMIP5. Weather Clim. Extrem. 2017, 15, 34–56. [Google Scholar] [CrossRef]
  71. Ortiz, L.E.; González, J.E.; Horton, R.; Lin, W.; Wu, W.; Ramamurthy, P.; Arend, M.; Bornstein, R.D. High-Resolution Projections of Extreme Heat in New York City. Int. J. Climatol. 2019, 39, 4721–4735. [Google Scholar] [CrossRef]
  72. Satake, T.; Yoshida, S. High temperature induced sterility in indica rice at flowering. JPN J. Crop Sci. 1978, 47, 6–17. [Google Scholar] [CrossRef] [Green Version]
  73. Jagadish, S.V.K.; Craufurd, P.Q.; Wheeler, T.R. High Temperature Stress and Spikelet Fertility in Rice (Oryza Sativa L.). J. Exp. Bot. 2007, 58, 1627–1635. [Google Scholar] [CrossRef] [Green Version]
  74. Prasad, P.V.V.; Boote, K.J.; Allen, L.H.; Sheehy, J.E.; Thomas, J.M.G. Species, Ecotype and Cultivar Differences in Spikelet Fertility and Harvest Index of Rice in Response to High Temperature Stress. Field Crop. Res. 2006, 95, 398–411. [Google Scholar] [CrossRef]
  75. Weerakoon, W.M.W.; Maruyama, A.; Ohba, K. Impact of Humidity on Temperature-Induced Grain Sterility in Rice (Oryza Sativa L.). J. Agron. Crop Sci. 2008, 194, 135–140. [Google Scholar] [CrossRef]
  76. Shim, K.M.; Roh, K.A.; So, K.H.; Kim, G.Y.; Jeong, H.C.; Lee, D.B. Assessing Impacts of Global Warming on Rice Growth and Production in Korea. J. Clim. Chang. Res. 2010, 1, 1–11. [Google Scholar]
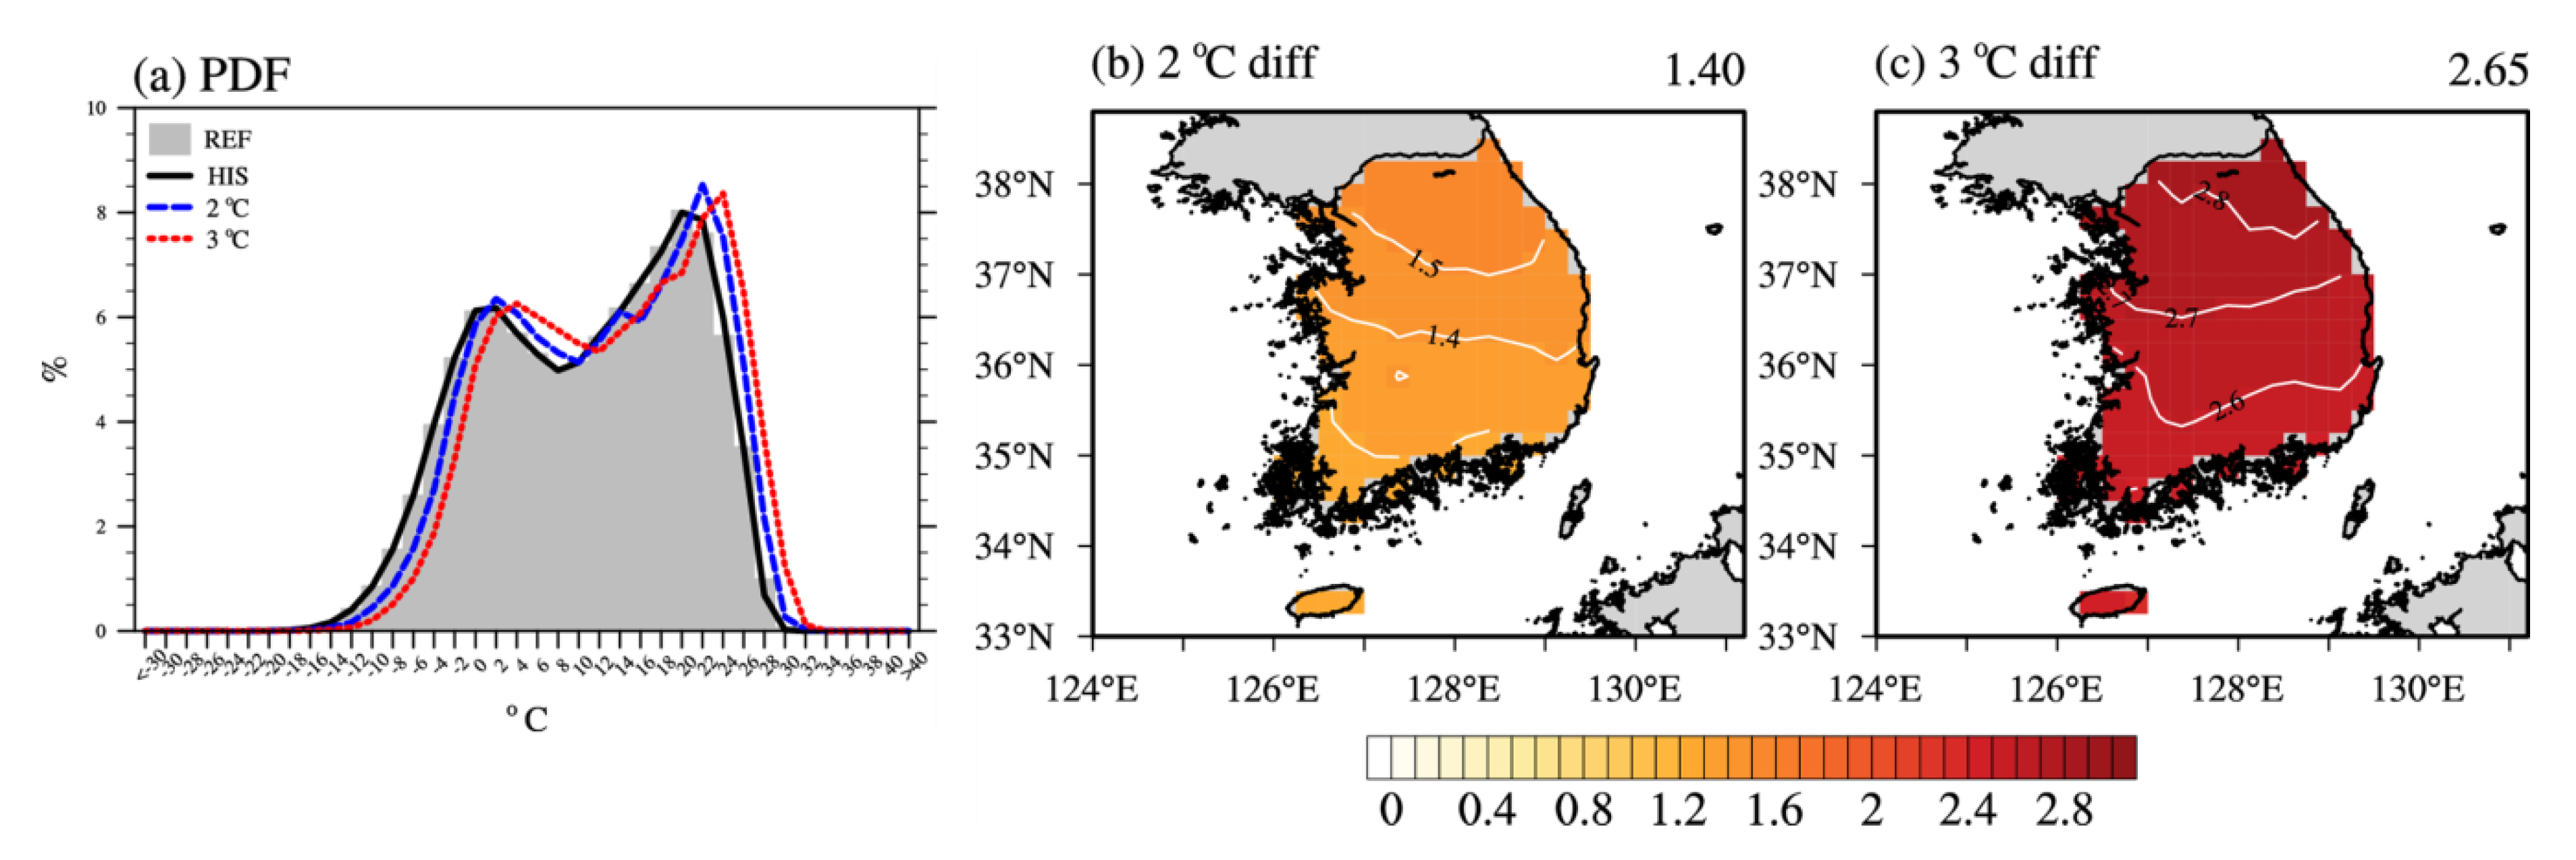
Figure 1. The (a) probability distribution function (PDF) of annual mean temperature over South Korea and their changes in (b) 2 and (c) 3 °C warming climates compared to historical period over S. Korea.
Atmosphere 11 01336 g001
Figure 2. The climatological vegetable period (days/year) distribution calculated from (a) reference data (Asian Precipitation Highly Resolved Observational Data Integration Toward Evaluation of Water Resources (APHRODITE)), (b) historical experiment, and their changes from historical experiment during (c) 2, (d) 3 °C warming periods.
Atmosphere 11 01336 g002
Figure 3. The climatological crop period (days/year) distribution calculated from (a) reference data (APHRODITE), (b) historical experiment, and their changes from historical experiment during (c) 2, (d) 3 °C warming periods.
Atmosphere 11 01336 g003
Figure 4. The climatology of starting day (unit: Day of Year) for each phenology stage from reference data (af) and historical experiment (gl) during 1981–2005.
Atmosphere 11 01336 g004
Figure 5. Starting day changes for each phenology stage during 2 (af) and 3 °C (gl) warming periods from historical experiment. The grid does not reach enough Growing Degree Day (GDD) levels in the historical period but newly included GDD levels in the phenology stage under global warming are marked with red asterisks.
Atmosphere 11 01336 g005
Figure 6. Changes of the day ratios (%) higher than 95 percentile temperature with respect to each grid during each phenology stage in 2 (af) and 3 °C (gl) warming climate from historical experiment.
Atmosphere 11 01336 g006
Figure 7. The (Empirical Orthogonal Function) EOF eigenvectors of 1~3 modes (ac) of hot day temperatures over S. Korea during 1981–2005 with reference data.
Atmosphere 11 01336 g007
Figure 8. The principal component (PC) of EOF 1~3 modes (ac) time series of hot day temperatures over S. Korea during 1981–2005 with reference data. The values higher than 1.5 are marked with red dots.
Atmosphere 11 01336 g008
Figure 9. The strong event composites of synoptic atmospheric circulations (vector: 850 hPa u,v wind/contour: 500 hpa geopotential height/blue contour: 5880 gpm) of EOF 1~3 modes (ac).
Atmosphere 11 01336 g009
Figure 10. Same as Figure 7 but for historical experiment (ac), 2 °C warming period (df), and 3 °C warming period (gi).
Atmosphere 11 01336 g010
Figure 11. The (a) PDF and (b) box plot of hot day temperature of every grid points over S. Korea during June–July–August (JJA). The upper and lower whisker indicates the maximum and minimum values. The range of each box denotes the range from tenth percentile to ninetieth percentile value. The line in the middle of the box shows the location of median. The dot indicates the mean value.
Atmosphere 11 01336 g011
Table 1. The model configuration and analysis period.
WRF (v3.7)Cosmo-CLM (v5.0)
Resolution Horizontal/Vertical395 × 250 (25 km)/30-level eta (50 hPa)396 × 251 (25 km)/40-level hybrid vertical grid (10 hPa)
Cumulus SchemeBetts–Miller–JanjicTiedtke
Microphysics SchemeWSM3Extended DM (cloud ice include)
RadiationCAMRitter and Geleyn
Planetary Boundary Layer (PBL)YSUDavies and Tumer
Land Surface Model (LSM)NOAH LSMTERRAL ML
Spectral NudgingAppliedApplied
Lateral Boundary ConditionMPI-ESM-LR
Analysis PeriodHistorical experiment (1981~2005)
2 °C warming (2024~2048)
3 °C warming (2049~2073)
Table 2. Rice phenology stages and heat requirement.
GDDStage 1
(Seeding)
Stage 2
(Transplanting)
Stage 3
(Tillering)
≥110 °C≥300 °C≥860 °C
Stage 4
(Elongation)
Stage 5
(Heading)
Stage 6
(Harvest)
≥1160 °C≥1640 °C≥2180 °C
Table 3. The days ratio (%) higher than 95 percentile temperature averaged over S. Korea during each phenology stage derived from reference data (REF) and historical experiment (HIS).
REFStage 1Stage 2Stage 3
0.13%7.43%37.75%
Stage 4Stage5Stage 6
19.09%0.6%0.00%
HISStage 1Stage 2Stage 3
0.04%9.09%32.57%
Stage 4Stage 5Stage 6
19.41%0.67%0.00%
Publisher’s Note: MDPI stays neutral with regard to jurisdictional claims in published maps and institutional affiliations.