Article

Aerosol Indirect Effects on the Predicted Precipitation in a Global Weather Forecasting Model

Korea Institute of Atmospheric Prediction Systems, Seoul 07071, Korea
*
Author to whom correspondence should be addressed.
Atmosphere 2019, 10(7), 392; https://doi.org/10.3390/atmos10070392
Submission received: 23 May 2019 / Revised: 2 July 2019 / Accepted: 9 July 2019 / Published: 12 July 2019

Abstract

:
Aerosol indirect effects on precipitation were investigated in this study using a Global/Regional Integrated Model system (GRIMs) linked with a chemistry package devised for reducing the heavy computational burden occurring in common atmosphere–chemistry coupling models. The chemistry package was based on the Goddard Chemistry Aerosol Radiation and Transport scheme of Weather Research and Forecasting with Chemistry (WRF-Chem), and five tracers that are relatively important for cloud condensation nuclei (CCN) formation were treated as prognostic variables. For coupling with the cloud physics processes in the GRIMs, the CCN number concentrations derived from the simplified chemistry package were utilized in the cumulus parameterization scheme (CPS) and the microphysics scheme (MPS). The simulated CCN number concentrations were higher than those used in original cloud physics schemes and, overall, the amount of incoming shortwave radiation reaching the ground was indirectly reduced by an increase in clouds owing to a high CCN. The amount of heavier precipitation increased over the tropics owing to the inclusion of enhanced riming effects under deep precipitating convection. The trend regarding the changes in non-convective precipitation was mixed depending on the atmospheric conditions. The increase in small-size cloud water owing to a suppressed autoconversion led to a reduction in precipitation. More precipitation can occur when ice particles fall under high CCN conditions owing to the accretion of cloud water by snow and graupel, along with their melting.

1. Introduction

Atmospheric aerosols indirectly affect the earth’s energy budget by modifying the microphysical structure, lifetime, and coverage of clouds by serving as cloud condensation nuclei (CCN). The importance of aerosol indirect effects has been emphasized more as an aspect of the earth’s radiation budget with a high impact and high uncertainty compared to a direct effect [1]. The aerosol CCN effect has been incorporated into weather and climate models with or without chemistry processes. Historically, air quality and weather prediction models have been developed separately owing to a lack of computing resources, although this situation has recently changed through advances in computational performance and coupling systems [2].
Many researchers have investigated aerosol indirect effects through a meteorological model coupled with a chemistry module from a climate perspective [3,4,5]. For weather forecasting models on a regional scale, aerosols effects have been coupled with precipitation algorithms [6,7]. In such studies, the incorporation of aerosol CCN effects into weather or climate models has been accomplished by focusing on the microphysics. Grell and Freitas [8] added aerosol feedbacks in a convective parameterization scheme through the CCN-dependent autoconversion of cloud water into rain and evaporation of cloud droplets into water vapor. In their study, the authors showed a change in precipitation from the aerosol indirect effects although fixed CCN concentrations were assumed. Berg et al. [9] also implemented a new treatment of cloud effects on aerosol and trace gases with parameterized convections in both the Weather Research and Forecasting with Chemistry (WRF-Chem) chemistry packages as well as the Kain–Fritsch (KF) cumulus parameterization. In the study, better number concentration and residuals of cloud droplets are estimated. However, the authors [8,9] did not consider the interaction of aerosols and precipitation in terms of microphysics. Furthermore, owing to a lack of computational power, there has not yet been an evaluation of the aerosol indirect effects using chemistry-coupled weather modeling on a global scale. Few studies have been carried out on trying to couple the aerosols with precipitation algorithms for both cumulus parameterization and microphysics schemes applied to global weather forecasting models.
We intended to consider aerosol indirect effects in a global weather forecasting model via linking with a chemistry process. For this purpose, a simplified chemistry package is first proposed to reduce the computational burden, which was implemented in the Global/Regional Integrated Model system (GRIMs) [10] along with derived CCN effects in precipitation algorithms for both cumulus parameterization and microphysics schemes. Second, the aerosols simulated from the simplified chemistry package are evaluated. Finally, the indirect aerosol effects in this framework are discussed, focusing on precipitation.

2. The Simplified Chemistry Package

According to a study by Baklanov et al. [11], coupled models for short-term applications such as numerical weather prediction (NWP) do not require the full comprehensive chemistry, which increases the CPU utilization tremendously. An NWP should benefit from such feedback as aerosol–cloud–radiation interactions along with a simplified chemistry (e.g., sulfur chemistry). Therefore, in this study, a simplified chemistry package was developed based on the Goddard Chemistry Aerosol Radiation and Transport (GOCART) scheme [12] of Weather Research and Forecasting with Chemistry (WRF-Chem) [13], which has a simple chemistry and is open to the public with easy accessibility.
In the simplified chemistry package, only five tracers, namely, SO2, SO4, hydrophobic organic carbon (OC), hydrophilic OC, and sea salt, that are relatively important for CCN formation were considered because an increased number of tracers requires an exponentially higher computational cost. Hydrophobic and hydrophilic black carbons (BCs) are also predicted in the GOCART scheme but were not considered in this study, because they are not used for the calculation of CCN number concentration (see Section 3.1). The sea salt is also treated as one size bin with an effective radius of 2 μm based on the study of Fan and Toon [14] for the computational considerations.
The tracers can undergo emission, transport, deposition, and chemical reactions (Table 1). The detailed processes used in the package are described in [12,13], as well as the other references cited below, and we give a brief summary herein.

2.1. Emission

Emissions of sea salt from the ocean, along with SO2 and hydrophobic OC from anthropogenic activities and biomass burning, are necessary for the prediction of the selected tracers.
The emission of sea salt from the ocean is calculated as a function of the 10 m wind speed ( u 10 ) and the sea salt radius (r; µm). The emission number flux Fn (particles m−2 s−1) for a sea salt particle radius can be expressed using the empirical relationships derived from Gong et al. [15] and Monahan et al. [16] as follows:
d F n / d r = 1.373 u 10 3.2 r 3 ( 1 + 0.057 r 1.05 ) 10 1.19 exp ( B 2 ) ,
where B = ( 0.38 log 10 r ) / 0.65 . We consider sea salt with a radius ranging between 0.5 and 5.0 µm with a 0.05 µm interval. This emission number flux is converted into the mass flux under the assumption that the sea salt density in sea water is 2200 kg m−3.
In addition, SO2 is emitted predominantly from fuel combustion and industrial processes and partly from biomass burning. The main source of hydrophobic OC is biomass burning. For anthropogenic activity and biomass burning emissions of SO2 and OC, we used the monthly data with a spatial resolution of 0.5° × 0.5° produced as a part of the MACC/CityZEN EU (MACCity) project, which are available from the Ether/Emissions of atmospheric Compounds and Compilation of Ancillary Data (ECCAD) database (a more detailed description of the MACCity emission dataset is provided by Granier et al. [17] and Diehl et al. [18]). In this study, July emission inventories for anthropogenic activity and biomass burning were used. The available emission data for anthropogenic activity and biomass burning are for 2016 and 2008, respectively.

2.2. Transport

The chemical species used in this study are treated as prognostic variables and, thus, their transport is simulated in the dynamic core of the GRIMs using a semi-Lagrangian scheme. Their vertical mixing is also considered through a dynamic process. The turbulent exchange coefficients, which are computed in the planetary boundary layer (PBL) scheme [19], are passed on to the chemistry package.

2.3. Dry/Wet Deposition

Gases and particles in the atmosphere are removed through dry and wet deposition. The dry deposition is an uptake at the earth surface, and its flux of species from the atmosphere to the surface is calculated by multiplying the concentration of the deposited species and the deposition velocity. The dry deposition velocity v d is governed by the aerodynamic resistance r a , the quasi-laminar layer resistance r b , and the surface resistance r c [20] as follows:
v d = 1 r a + r b + r c .
The resistances are defined as a function of the surface type and meteorological conditions [20,21], and for sea salt, the gravitational settling as a function of the particle size [22] is also included.
Wet deposition is an absorption into rain or cloud droplets and accounts for in-cloud and below-cloud scavenging of soluble species in convective cloud updraft and large-scale precipitation [12]. The scavenging ratios of species partitioned into their liquid phases are 1, 0, 0.8, and 1 for SO4, hydrophobic OC, hydrophilic OC, and sea salt, respectively. The scavenging ratio for SO2 into the liquid phase is calculated using Henry’s law. The amount of dissolved gas in a liquid is proportional to Henry’s law constant ( H ). The Henry’s law constant of SO2 is expressed as a function of temperature ( H o e x p [ d H R ( 1 T 1 T o ) ] ). T o and H o are a reference temperature of 298 K and Henry’s law constant at this reference temperature (1.2 M atm−1), respectively. In addition, d H R is the enthalpy of a solution and has a value of 310 K. In-cloud scavenging of a convective cloud in the original WRF-Chem code is based on the Grell cumulus parameterization scheme (CPS). Because the CPS in the GRIMs is a simplified Arakawa–Schubert (SAS) scheme, the in-cloud scavenging scheme is modified by adding variables in CPS, passing them to the chemistry module, and revising the transport equation and conditions according to the SAS scheme. Wet deposition through large-scale scavenging is calculated as a function of the precipitation rate and vertical velocity. For below-cloud scavenging, the scavenging coefficient is an important factor. The scavenging coefficient for aerosol is simply expressed as a function of the washout time. Here, the washout time represents the amount of time required to remove all water from the cloud volume at the specified precipitation [23].

2.4. Chemistry

The chemical reaction of SO2 and the aging process of OC are included in the simplified chemistry package.
Sulfur dioxide is produced from emission sources and removed through SO2 oxidation and aqueous chemistry, whereas SO4 is formed from SO2 oxidation through OH in the air and by H2O2 in the clouds (see Table 1). The concentrations of OH and H2O2 are prescribed from the monthly data of the Intermediate Model of Global Evolution of Species (IMAGES) [24], and the diurnal variation of OH is considered using the cosine of the solar zenith angle. The amount of SO2 oxidized by H2O2 in the clouds is limited by the amount of H2O2 available. In addition, SO4 is also produced through a chemistry reaction of dimethyl sulfate (DMS) emitted from the sea, although the reactions associated with DMS are omitted herein to simplify the chemistry package because of the high cost of including the DMS chemistry. The DMS contains seven additional reactions which are two reactions with the hydroxyl radical and five reactions with the nitrate chlorine radical, chlorine monoxide, iodine monoxide, and bromine monoxide for the oxidation of DMS to SO2. The SO4 formation could be slightly underestimated for this treatment.
The production and loss of OC through a chemistry reaction is not considered in the simplified chemistry package. The emitted OC is hydrophobic [25,26,27]. The OC becomes hydrophilic through an aging process [28,29], which is assumed to be an exponential decay lifetime of 1.15 days.

3. Linkage between Chemistry and Meteorology

The simulated concentrations of chemical species through an online coupling chemistry package are used for calculating the cloud condensation nuclei (CCN) for non-convective and convective clouds.

3.1. Linkage to Non-Convective Clouds

The WRF double-moment 6-class (WDM6) microphysics scheme (MPS) [30], which deals with six water species, namely, water vapor, cloud water, rain, cloud ice, snow, and graupel, as well as the number concentrations of the CCN, cloud droplets, and rainwater, was implemented in the present study to consider the aerosol indirect effect by CCN, because a single-moment microphysics scheme does not consider the number concentration of the hydrometeor, which requires the CCN effect in microphysics. In the original WDM6 code, the number concentration of CCN (NCCN) is a constant value (100 cm−3) and is not replenished. Instead of the initial NCCN of 100 cm−3, as employed in [30], a prognostic NCCN is applied. Commonly, NCCN applied to microphysics is calculated based on Kohler theory which accounts for aerosol size, but the GOCART scheme prognosticates only mass concentration of aerosol, not aerosol size. Therefore, the mass concentrations of the chemical species from the simplified chemistry package are converted into the number concentrations of the CCN using the following empirical relationships [31]:
N CCN _ Land = 10 2.41 + 0.5 log 10 ( SO 4 ) + 0.13 log 10 ( 1.3 OC hydrophilic ) ,
N CCN _ Ocean = 10 2.41 + 0.5 log 10 ( SO 4 ) + 0.13 log 10 ( 1.3 OC hydrophilic ) + 0.05 log 10 ( Seasalt ) .
In the above relations, the soluble species, namely, SO4, hydrophilic OC, and sea salt, are assumed to serve as CCN. The activated CCN number concentration is predicted based on the relationship between the number of activated CCN and the supersaturation [32,33] when the relative humidity is greater than 100%. The detailed microphysics procedures are referred from [30] and [34].

3.2. Linkage to Convective Clouds

An updated version of the SAS CPS [35,36] was used in this study, and the CCN treatment was also added to consider the dependence of autoconversion rate and the precipitation efficiency on the CCN number concentration. Many studies have suggested that the precipitation of large-scale stratiform clouds is suppressed with an increase in the amount of aerosols [31,37,38], whereas the aerosol effects on deep convective precipitation still remain a controversial problem [39,40,41]. Lerach et al. [42] showed that a decrease in the precipitation of supercell storms produces an increase in the amount of aerosols, whereas Wang [43] found that convective precipitation increases owing to a stronger convection caused by increasing the CCN up to a certain level. The complex precipitation response to increasing aerosols is due to the different atmospheric conditions and complicated coupling between the cloud microphysics and storm dynamics (e.g., [44,45,46,47]). However, there is general agreement that, under high humidity conditions typical of tropical convection, aerosols tend to invigorate deep convective clouds, while suppressing the precipitation from small clouds (e.g., [39,40,41]).
The conversion rates of cloud condensate into convective precipitation and the evaporation efficiency in SAS are calculated using CCN factors. The SAS does not simulate the microphysical processes of the hydrometeors unlike MPS, and the CCN factors are roughly expressed. In this study, the CCN factors act by suppressing the convective precipitation under high CCN conditions for small warm-rain cumulus clouds. For deep convective clouds, the CCN factors work in the opposite way to consider the occurrence of more precipitation because there are high opportunities of accretion and a collision of ice particles when falling under high CCN conditions.
The conversion rate of cloud condensate into precipitation C 0 at level k is calculated according to [35] as follows:
C 0 ( k ) = α exp { 0.07 [ T ( k ) T 0 ] } ,   for   T ( k ) T 0 ,
C 0 ( k ) = α ,     for   T ( k ) > T 0 ,
where, T 0 = 0   and α = ( 0.7 ln [ CCN ( k bcon ) ] + 24 ) 0.0001 based on Lim [48]. Here, CCN ( k bcon ) indicates the number concentration of the CCN at the level of the cloud bottom (kbcon). To consider more precipitation for deep convective clouds, the CCN factors are simply reversed when the cloud top temperature ( T top ) is below the freezing level:
α = ( 0.002 ) 2 ( 0.7 ln [ CCN ( k bcon ) ] + 24 ) 0.0001 ,   for   T top < T 0 .  
The number concentration of the CCN at the level of the convective cloud bottom ( CCN ( k bcon ) ) is used to maximize the effect of aerosols on the precipitation.
The CCN factor ( C C N f ) for the evaporation efficiency is expressed as follows:
C C N f = 0.08 ln [ CCN ( k bcon ) ] + 0.63 ,
and increases with the CCN concentration [45]. The evaporation efficiency (1-precipitation efficiency) is multiplied by C C N f when T top T 0 and is divided by C C N f when T top < T 0 , and thus more precipitation can occur for deep convective clouds.
The linkage among the simplified chemistry package and MPS and CPS is shown in Figure 1.

4. Simulation Results

4.1. Experimental Setup

The model simulations were conducted in a grid spacing of T254L91, which is horizontal at a resolution pf approximately 50 km with 91 vertical layers from the surface to 1 Pa. The physics parameterization schemes employed in this study include the unified RRTMG [49], WDM6 microphysics scheme [30], SAS deep convective scheme [35,36], prognostic cloudiness scheme [50], the Han and Pan [51] shallow convection scheme, the PBL scheme developed by Shin and Hong [19], the Noah land surface model [52], and the orographic and convective gravity wave drag parameterization schemes proposed by Kim and Arakawa [53] and Chun and Baik [54], respectively.
Two experiments were carried out to investigate the aerosol indirect effects. One was a control simulation without the chemistry package in which the CCN number concentration for the MPS was initially fixed at 100 cm−3 (referred to as CTL; control). The other was a simulation using the prognostic CCN concentrations from the simplified chemistry package (EXP; experiment). Fifteen simulations were conducted over a 72 h forecasting period under the 15 initial conditions from July 1, 2017 to July 15, 2017. Analyses generated from the Korea Meteorological Administration’s United Model forecasting system were used for the initial atmospheric conditions. All figures were drawn using 15 forecast averages of the daily mean of three-day (48–72 h) forecasts, which is frequently used for calculating the forecast skill in an NWP. The initial fields for the chemical species were obtained from the global atmospheric chemical transport Model for Ozone and Related chemical Tracers/Geostationary Operational Environmental Satellites (MOZART-4/GOES-5 [55], the output of which is available at [56]).

4.2. Spatial Distributions of the Simulated Chemical Species

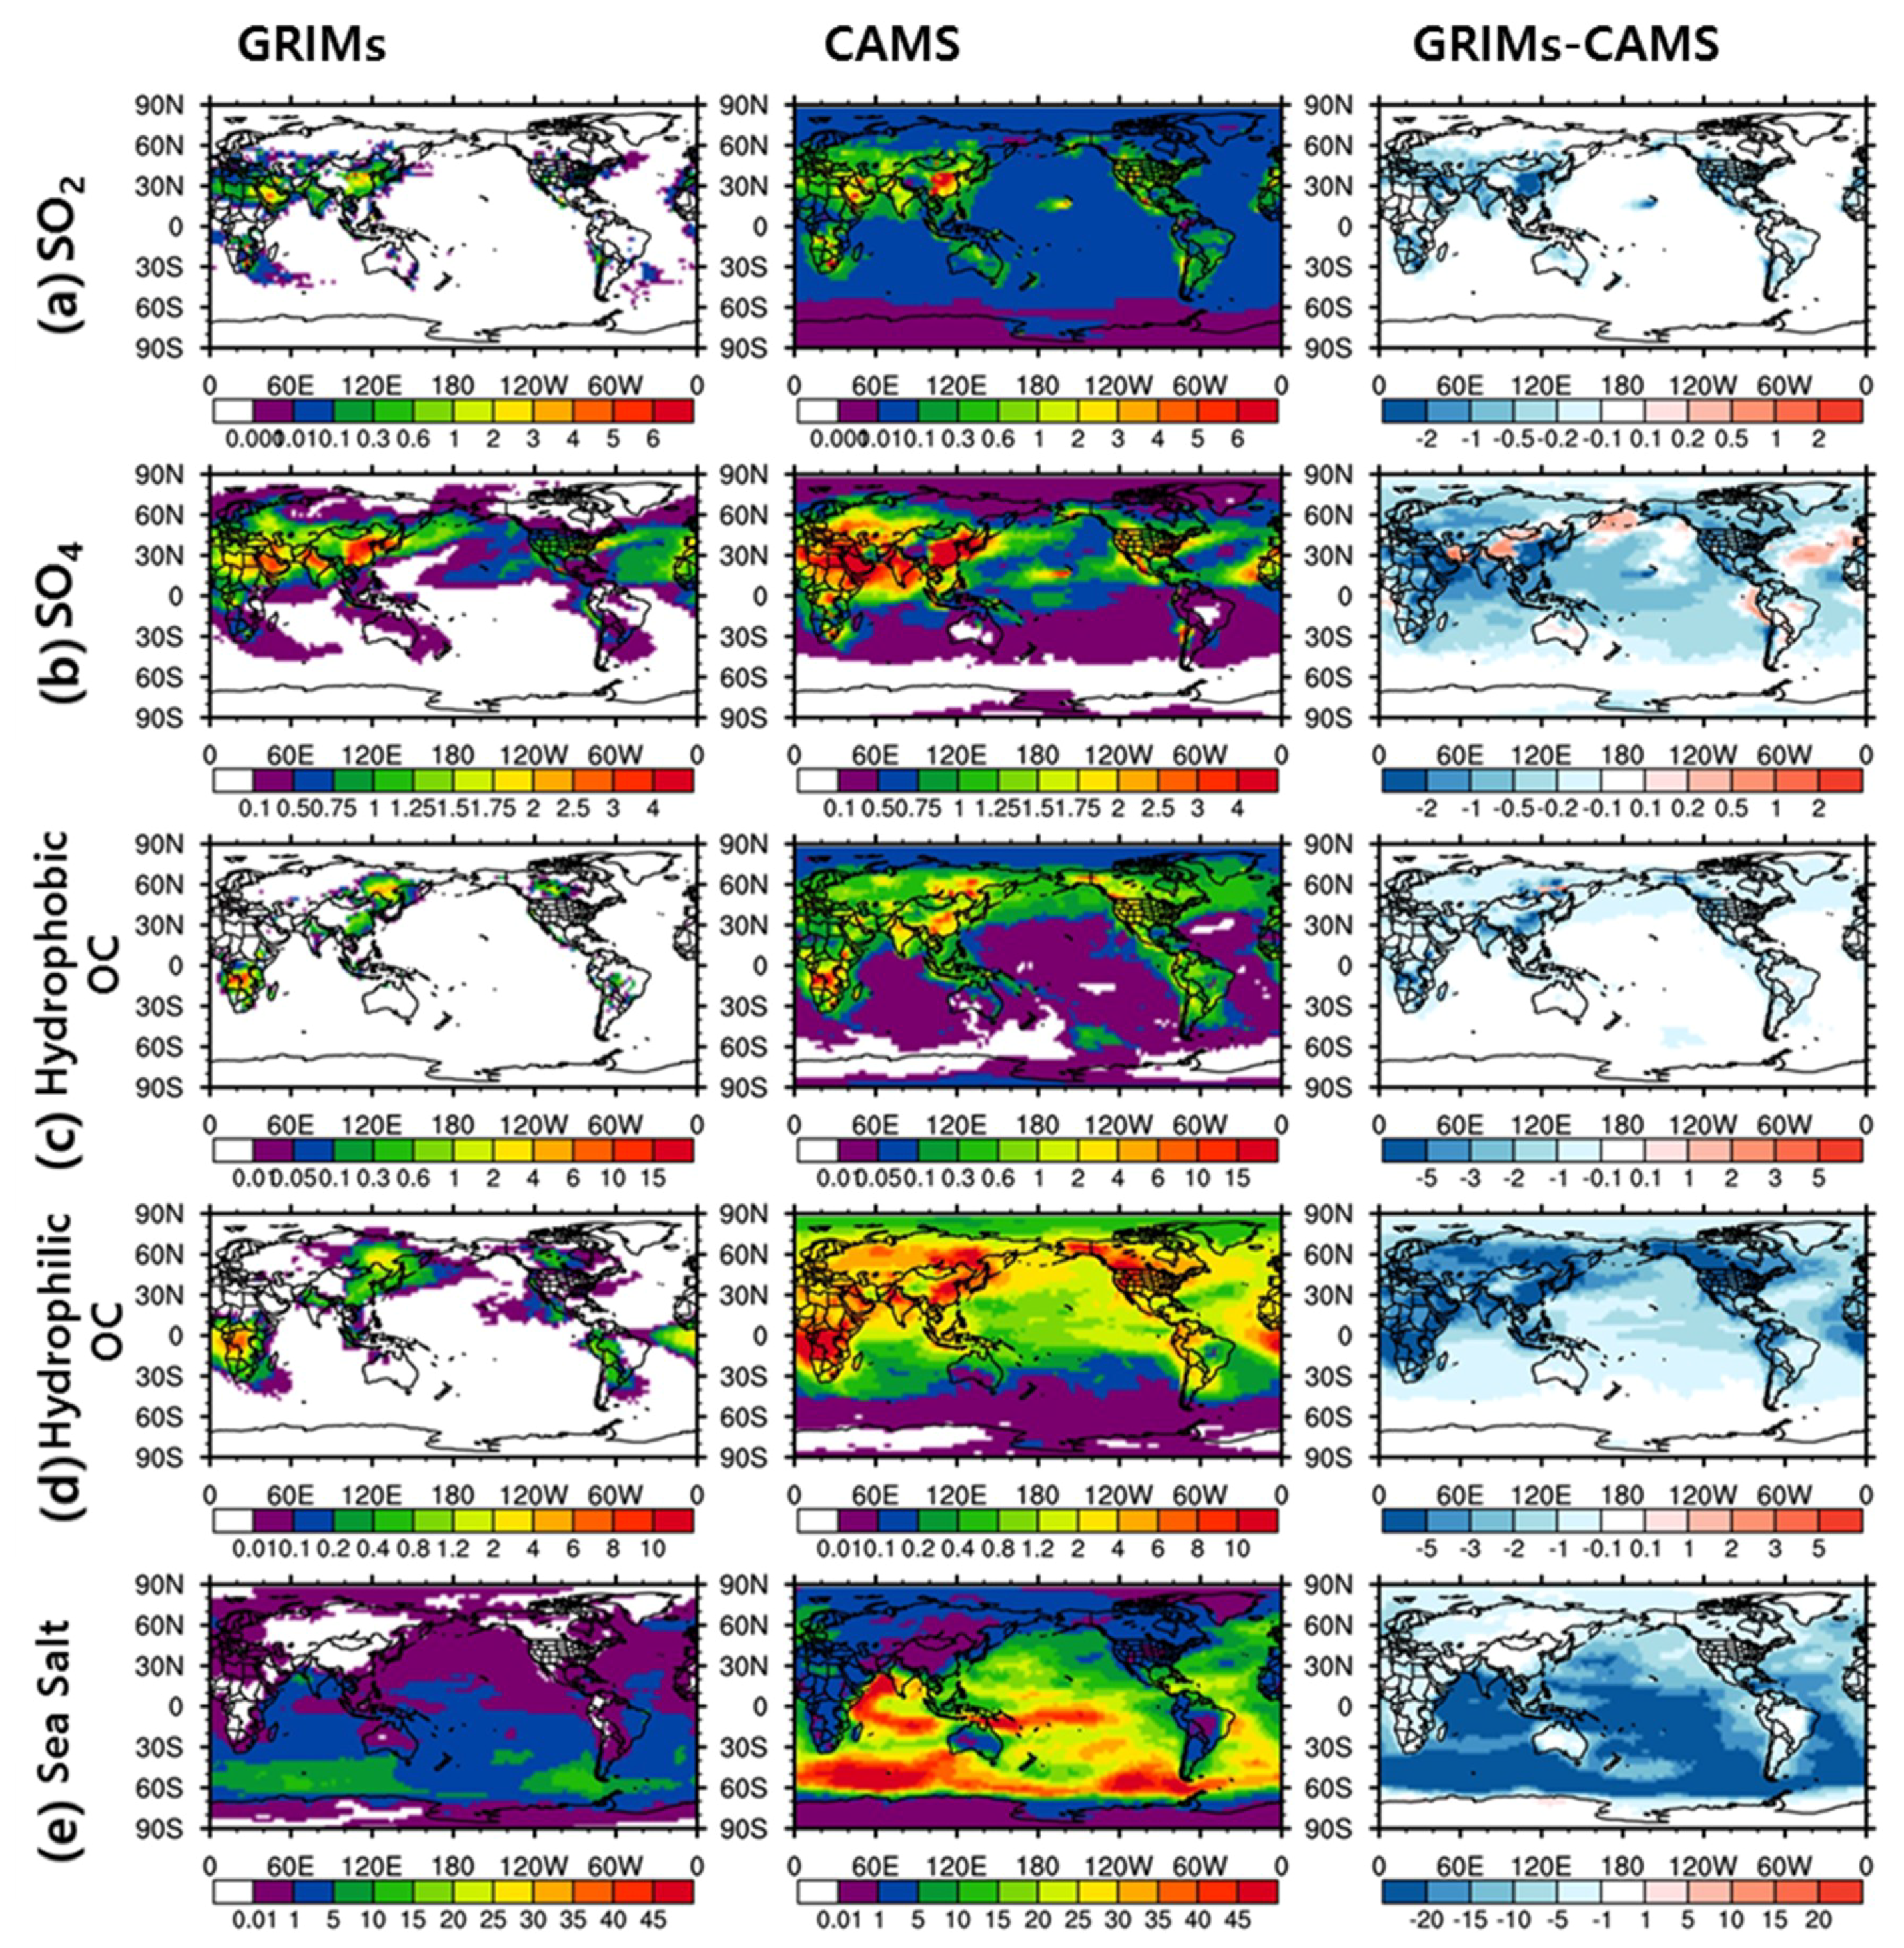
The averaged concentrations from 700 to 950 hPa of the chemical species calculated in the simplified chemistry package are plotted in Figure 2 (see the first panel). In order to evaluate the accuracy of the simulated chemical species, observational data of aerosol species are more proper, but they are also limited in spatial or temporal coverage. Therefore, the species-wise aerosol reanalysis data, Copernicus Atmosphere Monitoring Service (CAMS) reanalysis, are alternatively used for an evaluation of the simulated chemical species. The CAMS reanalysis builds on the experience gained during the production of the earlier MACC reanalysis and CAMS interim reanalysis and has been released for the period of 2003–2017. The CAMS reanalysis covers to 0.1 hPa with 60 hybrid sigma/pressure (model) levels in the vertical. The data can be archived from [57] and more details will be found at [58]. The spatial distributions of species-wise aerosols from CMAS reanalysis are also shown in Figure 2 (see the second panel). For the quantitative comparison, differences between the GRIMs-simulated results and CMAS reanalysis are added to Figure 2 (see the third panel).
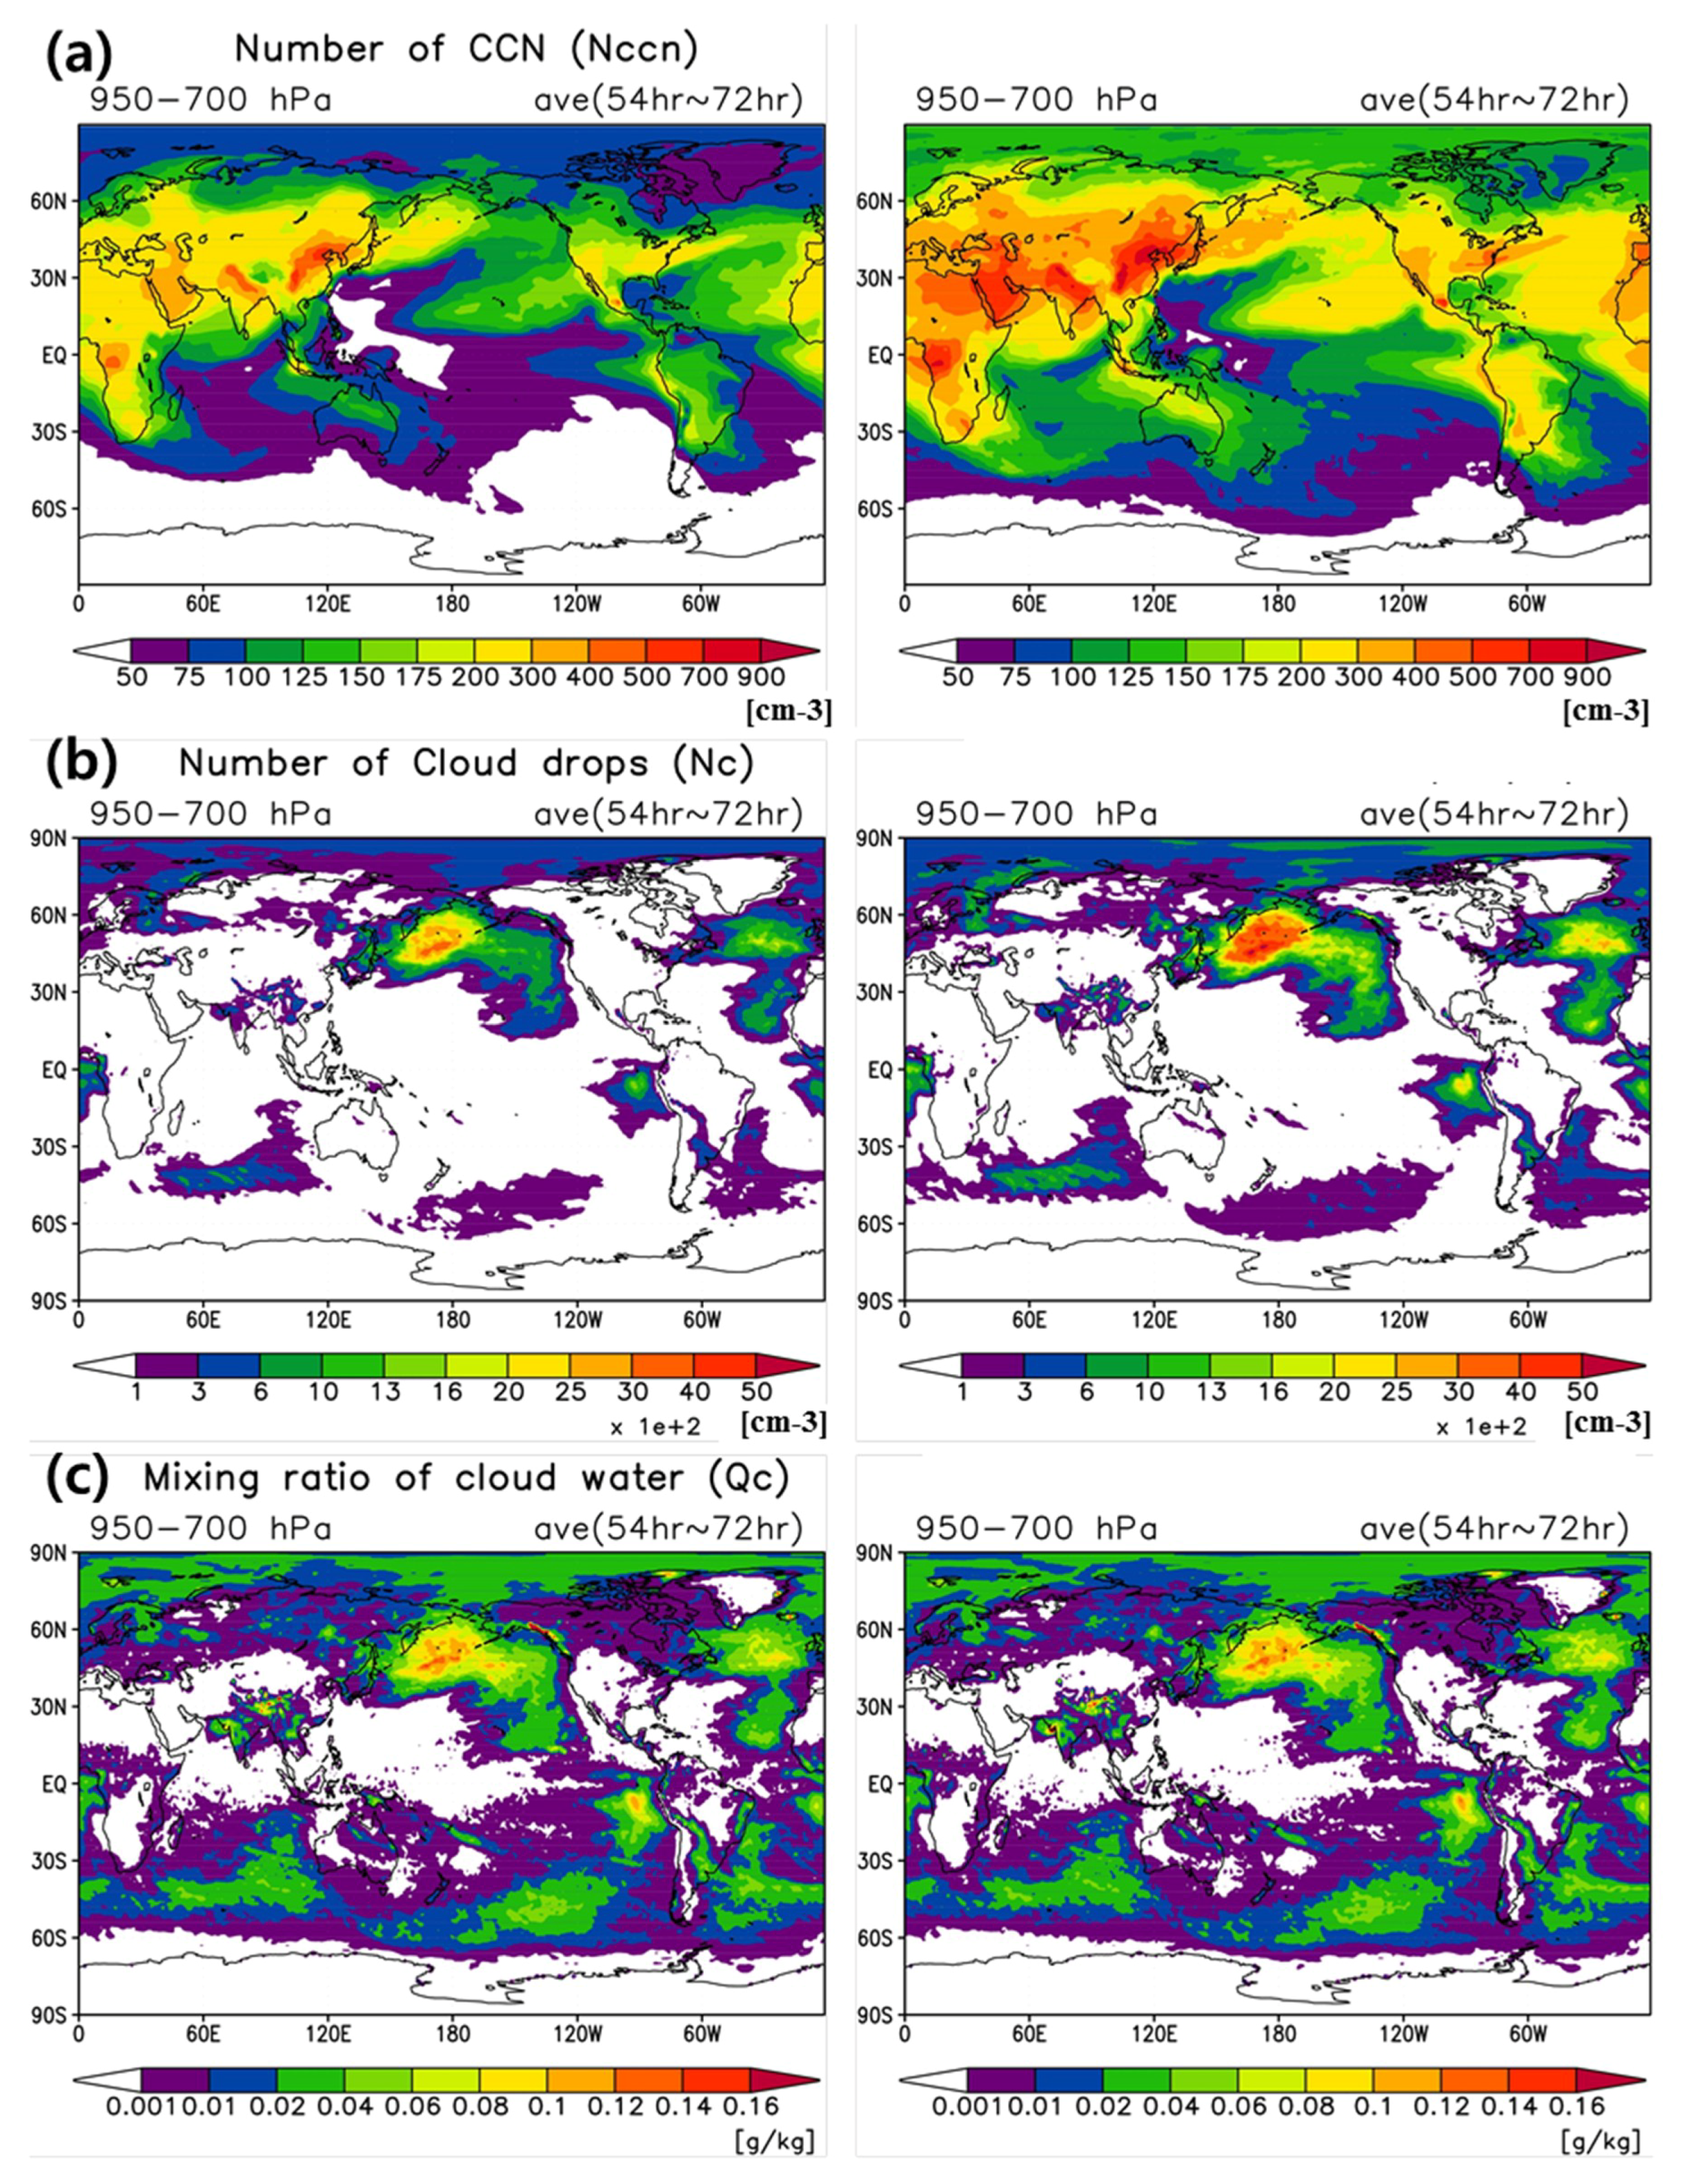
From the GRIMs simulation, sulfur dioxide appears at high concentrations over Europe and East Asia where the industrial activities are vigorous, and over southern Africa where emissions from biomass burning frequently occur. In addition, SO4 has a similar spatial distribution as SO2 because SO4 is generated from the oxidation of SO2. A large amount of SO4 is also found in cloudy regions over the northern Pacific Ocean, eastern Atlantic Ocean, and coastal ocean off Peru because most of the transported SO2 is converted into SO4 by H2O2 in the clouds. Levels, where hydrophobic and hydrophilic OC exist, include high over South Africa and China owing to emissions from biomass burning, which is consistent with Jeong and Wang [59] and Choi et al. [60]. Most sea salt is emitted at high latitudes in the southern hemisphere owing to strong winds, which agrees with the results of Chin et al. [12]. The spatial distributions of the GRIMs-simulated aerosols seem to be similar to those of species-wise aerosols from CAMS reanalysis except for the magnitude. The underestimation of the GRIMs-simulated aerosols could be induced by the several assumptions which are mentioned in Section 2. For an example, neglecting DMS chemistry in the simplified chemistry package of the GRIMs could induce the underestimation of SO2 and SO4. The underestimation of the GRIMs-simulated aerosols could affect numbers of CCN, numbers of cloud droplets, and mixing ratios of clouds. As a sensitivity test, we ran the model with doubled aerosol concentrations and the results from the sensitivity were compared to those from the control experiment (with original aerosols) (see Figure A1). The number concentration of CCN increased and, as an expected result, the number of cloud droplets also increased over the ocean. However, over the land, the change in CCN number concentration did not strongly affect the number of cloud droplets. The contrasting feedback to the ocean and land is due to the contrasting pattern of RH (relative humidity) over the ocean and land because CCN is activated when RH is higher than 100. Therefore, the increased CCN does not dramatically affect the simulation results (see the Figure A1). Moreover, when it was compared to other studies, the amount of the GRIMs-simulated aerosols seems to be reasonable. For an example, the global budget of three-day averaged SO4 for 15 simulations in this study was 0.88 TgS, and this value is in the range (0.6–1.1 TgS) of other modeling studies reported by Rasch et al. [61].

4.3. Comparison of NC and Radiation Flux

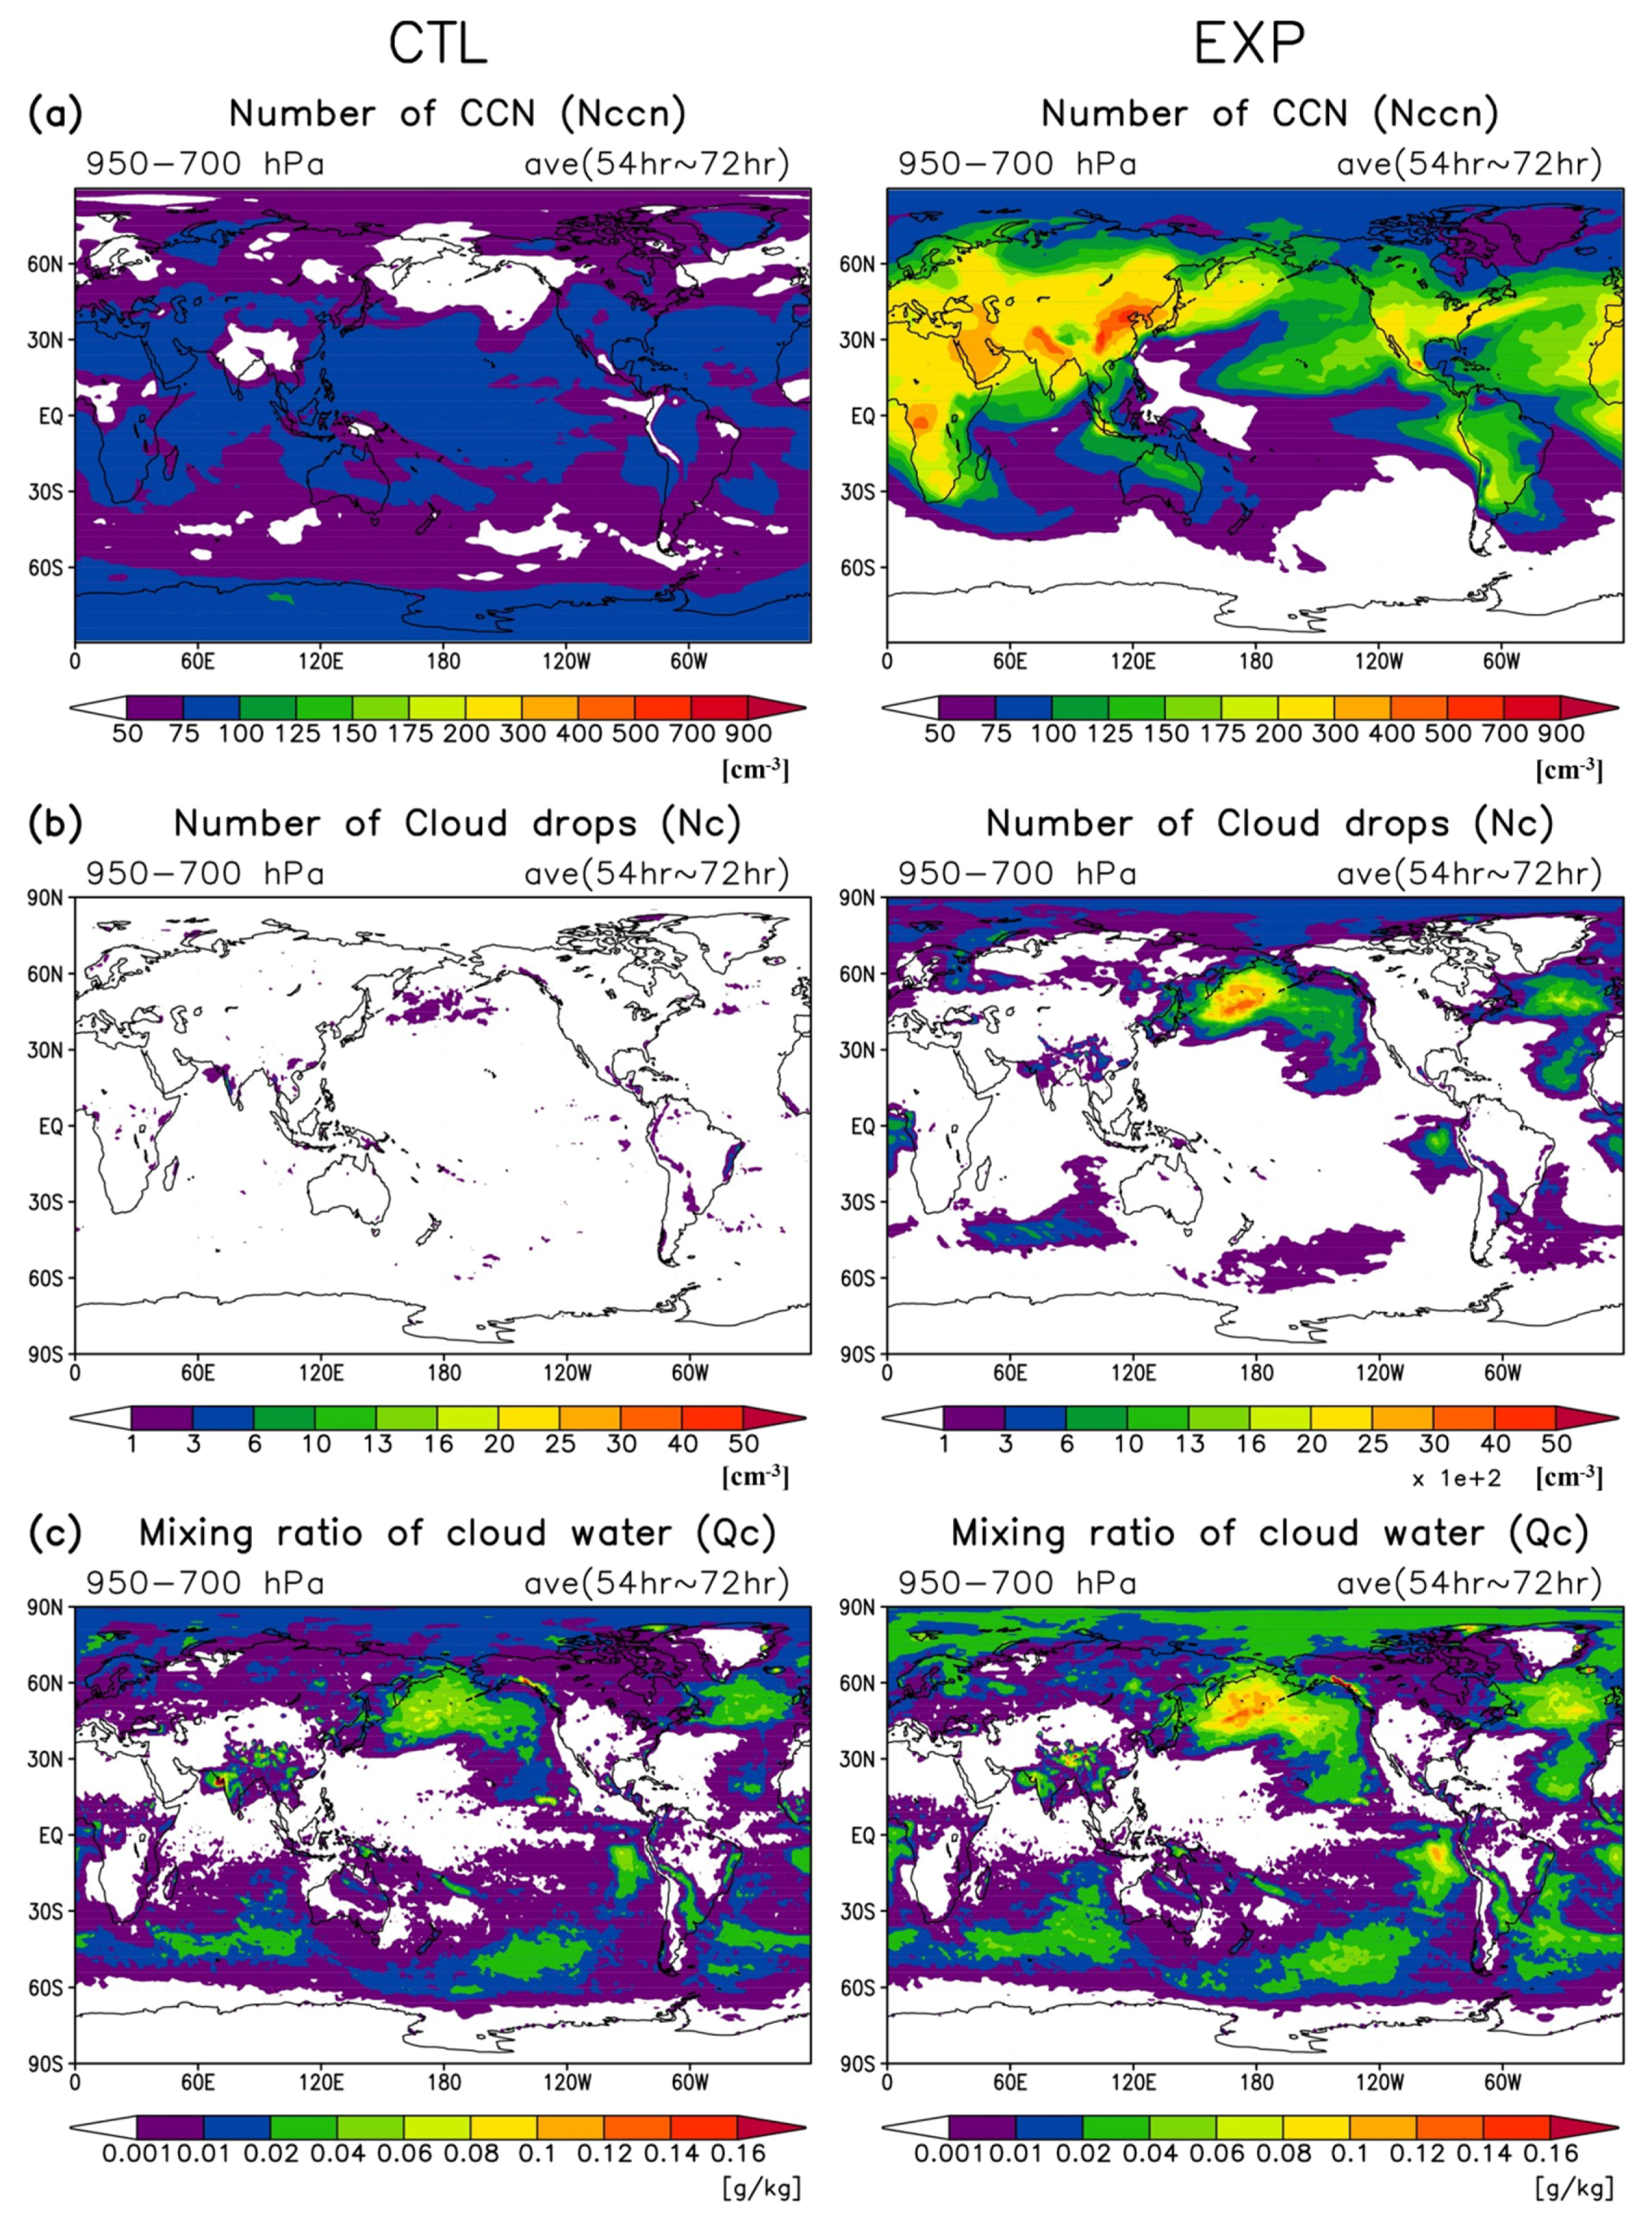
As shown in Figure 3, the concentrations of simulated CCN and hydrometeors in EXP are compared with those in CTL. The number concentrations of the CCN (NCCN) obtained from the simplified chemistry package are generally much larger than those in CTL (Figure 3a). For the CTL simulation, the initial CCN number concentration is fixed at 100 cm−3 without any spatial variation and there is no additional CCN source; thus, the number concentrations of CCN become less than 100 cm−3 with the forecasting time, and are consumed through microphysical processes and disappear in the atmosphere as a form of rain. The areas of low NCCN generally match the region where a high concentration of cloud water appears (Figure 3c).
The CCN concentrations over land in EXP are generally greater than 100 cm−3, which agrees with the observational studies (e.g., [62,63,64]). The high number concentrations of CCN in EXP, particularly over America, India, and China are comparable to those attained in previous studies (e.g., [65,66]). The global averaged CCN concentration from 700 to 950 hPa in EXP is 108.31 cm−3, which is comparable to the annual averaged surface CCN concentration of 79.84 cm−3 determined by Adams and Seinfeld [67].
The number concentration of cloud droplets (NC) and the mixing ratio of cloud water (QC) for EXP are also much larger than those for CTL owing to the high CCN concentration estimated from the simplified chemistry package (Figure 3b,c). For the EXP simulation, the spatial distributions of NCCN, NC, and QC are consistent over the ocean, where the increase in NCCN induces enhanced cloud condensation. However, the inconsistency between NCCN and NC over land indicates that the cloud condensation is still not activated despite the increase in the CCN concentration. This implies that cloud condensation is extremely sensitive to relative humidity.
The domain-averaged downward shortwave and longwave radiation fluxes at the surface were calculated, as summarized in Table 2. In this study, the aerosol concentrations from the simplified chemistry package do not affect radiation directly because of the aerosol direct feedback; therefore, the aerosol climatology was used in order to reduce the computing burden [60]. For this study, we focused only on the aerosol indirect effect. Overall, the amount of incoming shortwave radiation reaching the surface is reduced for the EXP run based on the increase in QC under high aerosol conditions (Figure 3c). The longwave radiation flux increases in the EXP because of the enhanced warm clouds.

4.4. Precipitation Change

As mentioned in Section 4.3, the cloud condensation in the low-level atmosphere is changed owing to an increase in the CCN number concentration for the EXP simulation, and the change in the clouds can affect the precipitation.
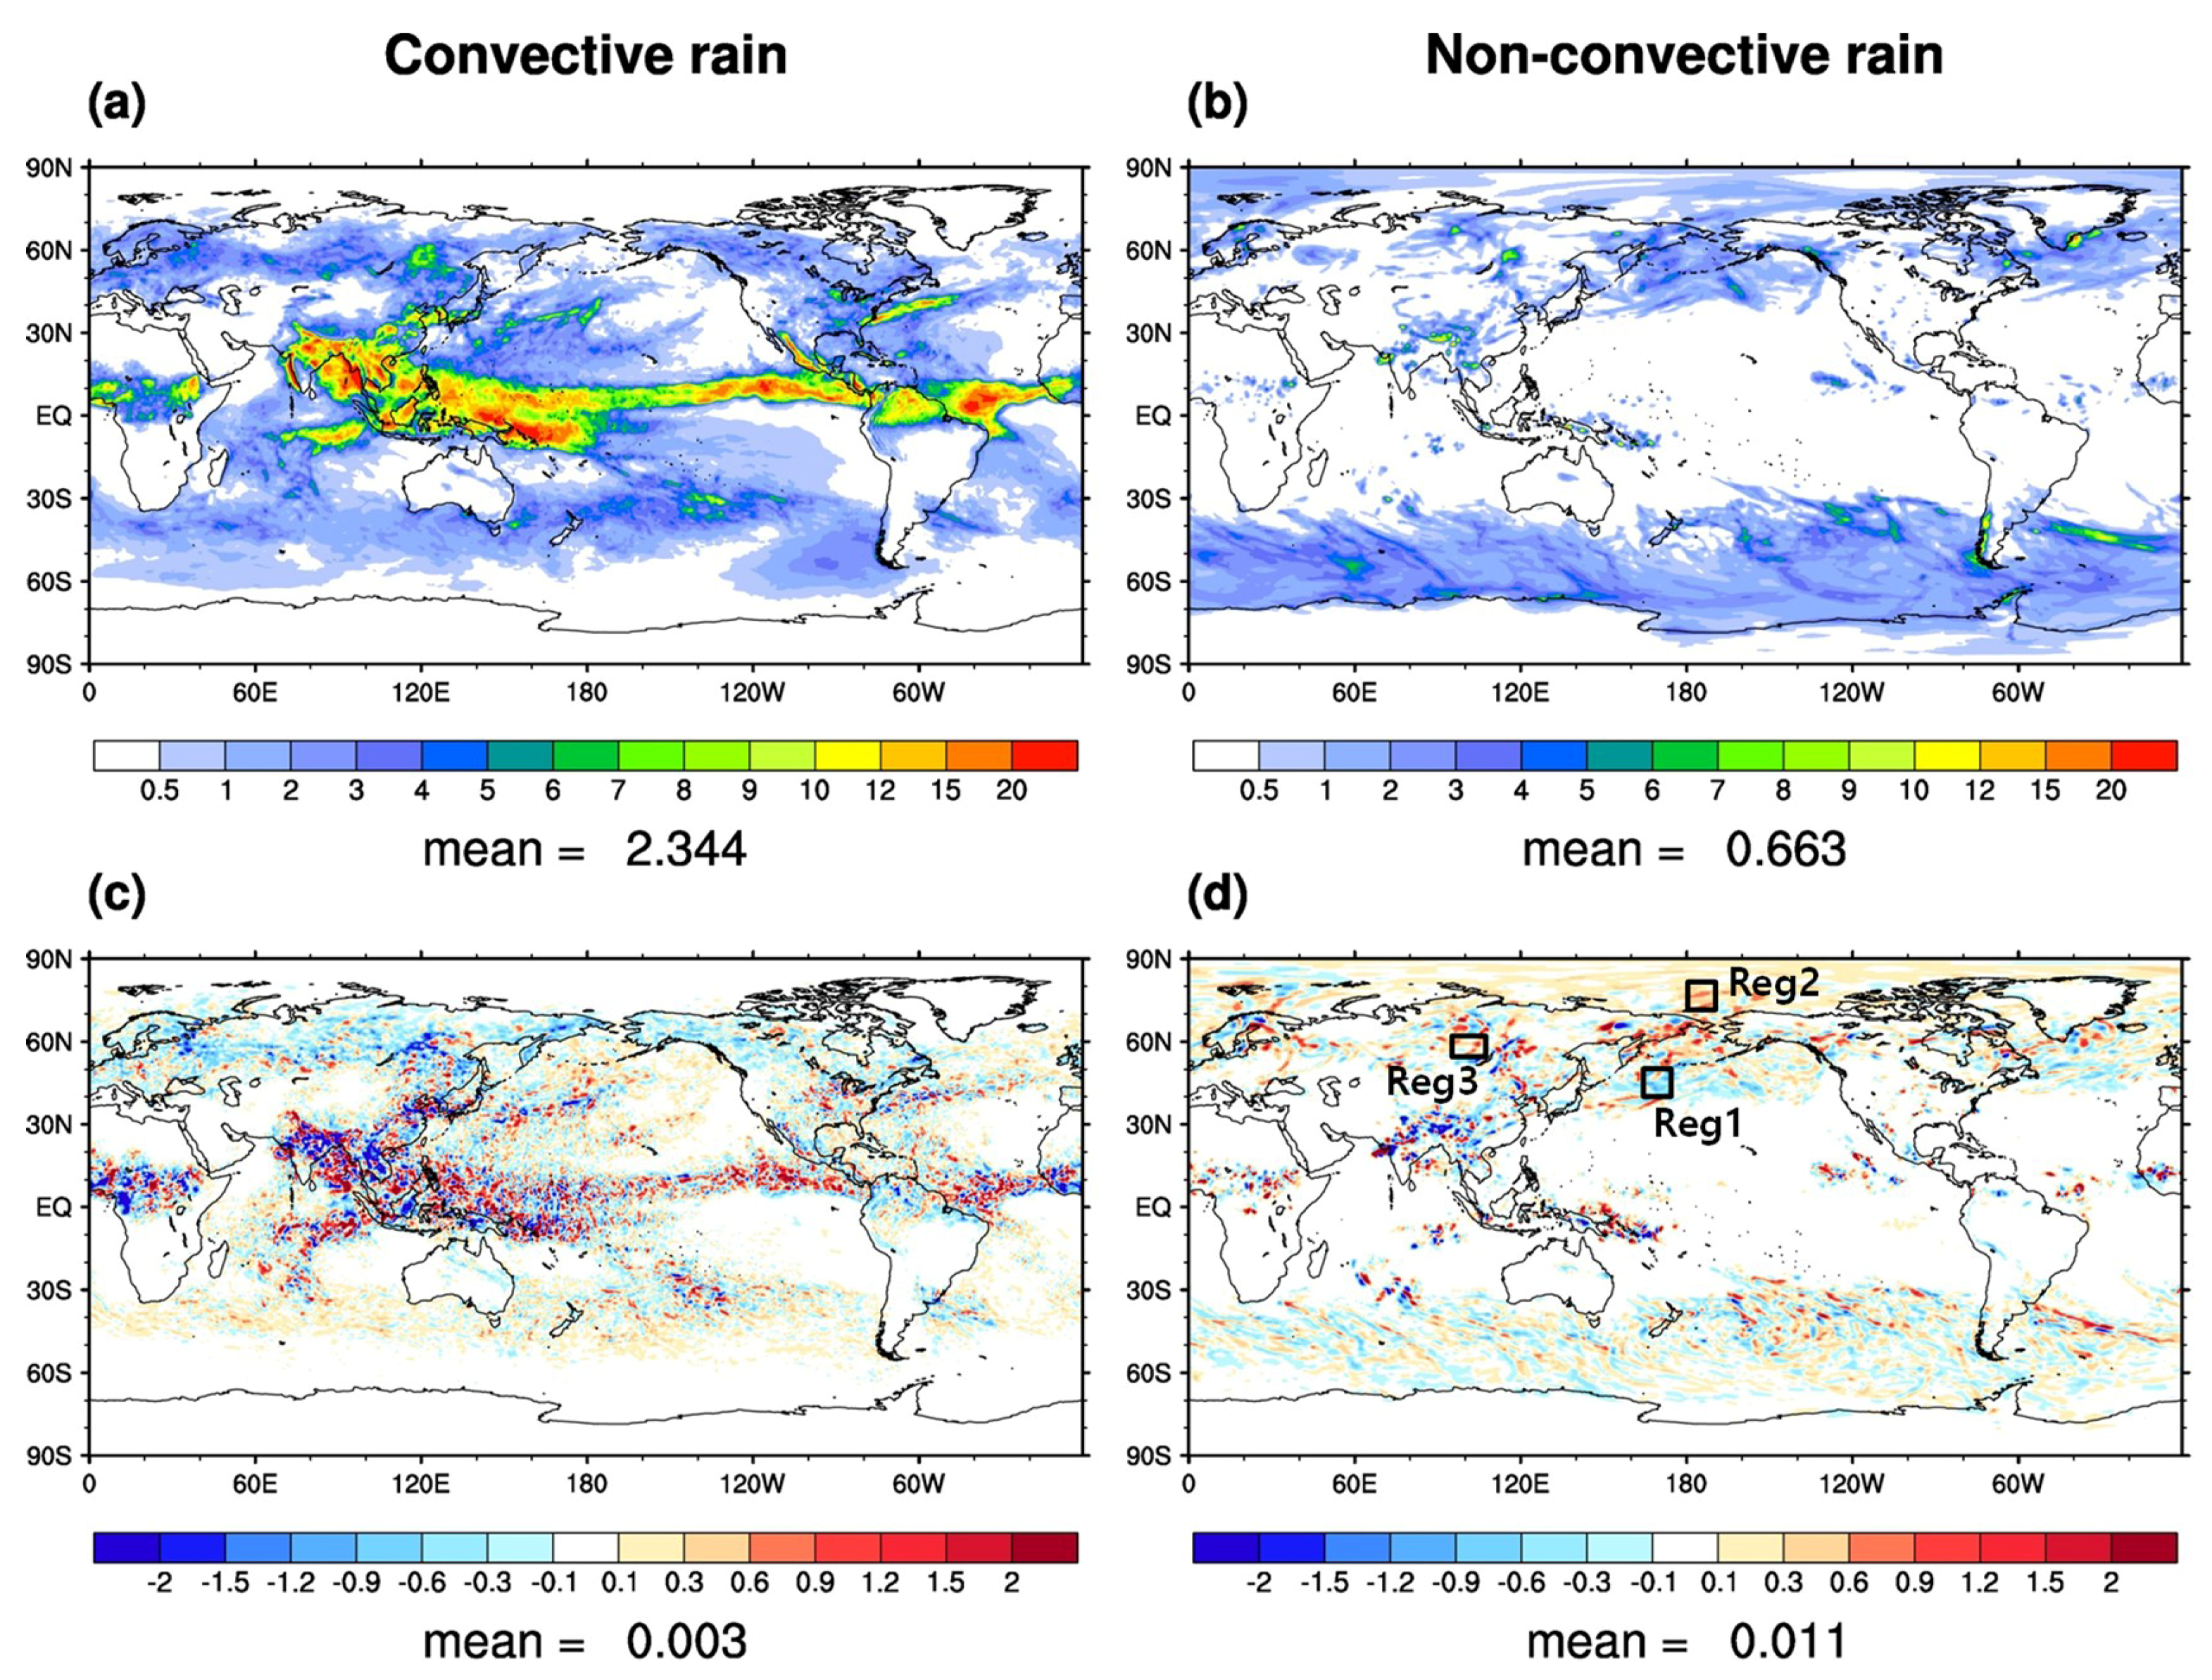
The domain-averaged precipitation amounts for CTL and EXP are summarized in Table 2. In general, the precipitation for the EXP run is increased. The mean difference in the convective rain amount between EXP and CTL (EXP minus CTL) is 0.004 mm day−1 (approximately a 0.17% increase for CTL), whereas that for the non-convective rain amount is 0.011 mm day−1 (approximately a 1.66% increase for CTL).
Figure 4 shows the simulated precipitation fields for the CTL run and the precipitation difference between the EXP and CTL runs for convective and non-convective rains. Convective rain is concentrated around the equatorial region (Figure 4a), whereas non-convective rain is spread out at middle to high latitudes (Figure 4b). Although the concentration of CCN for EXP is generally higher than that for CTL, the effect of aerosols on the precipitation is not monotonic. The convective precipitation is generally decreased over land and increased over the equatorial ocean for EXP runs, whereas the trend of non-convective precipitation change for EXP is mixed.
The CCN factors in the cumulus parameterization act by suppressing (stimulating) convective precipitation with the high CCN conditions for shallow (deep) clouds considered in this study as described in Section 3.2, resulting in increased convective precipitation over the equatorial ocean where deep convective clouds are dominant, and decreased convective precipitation over land.
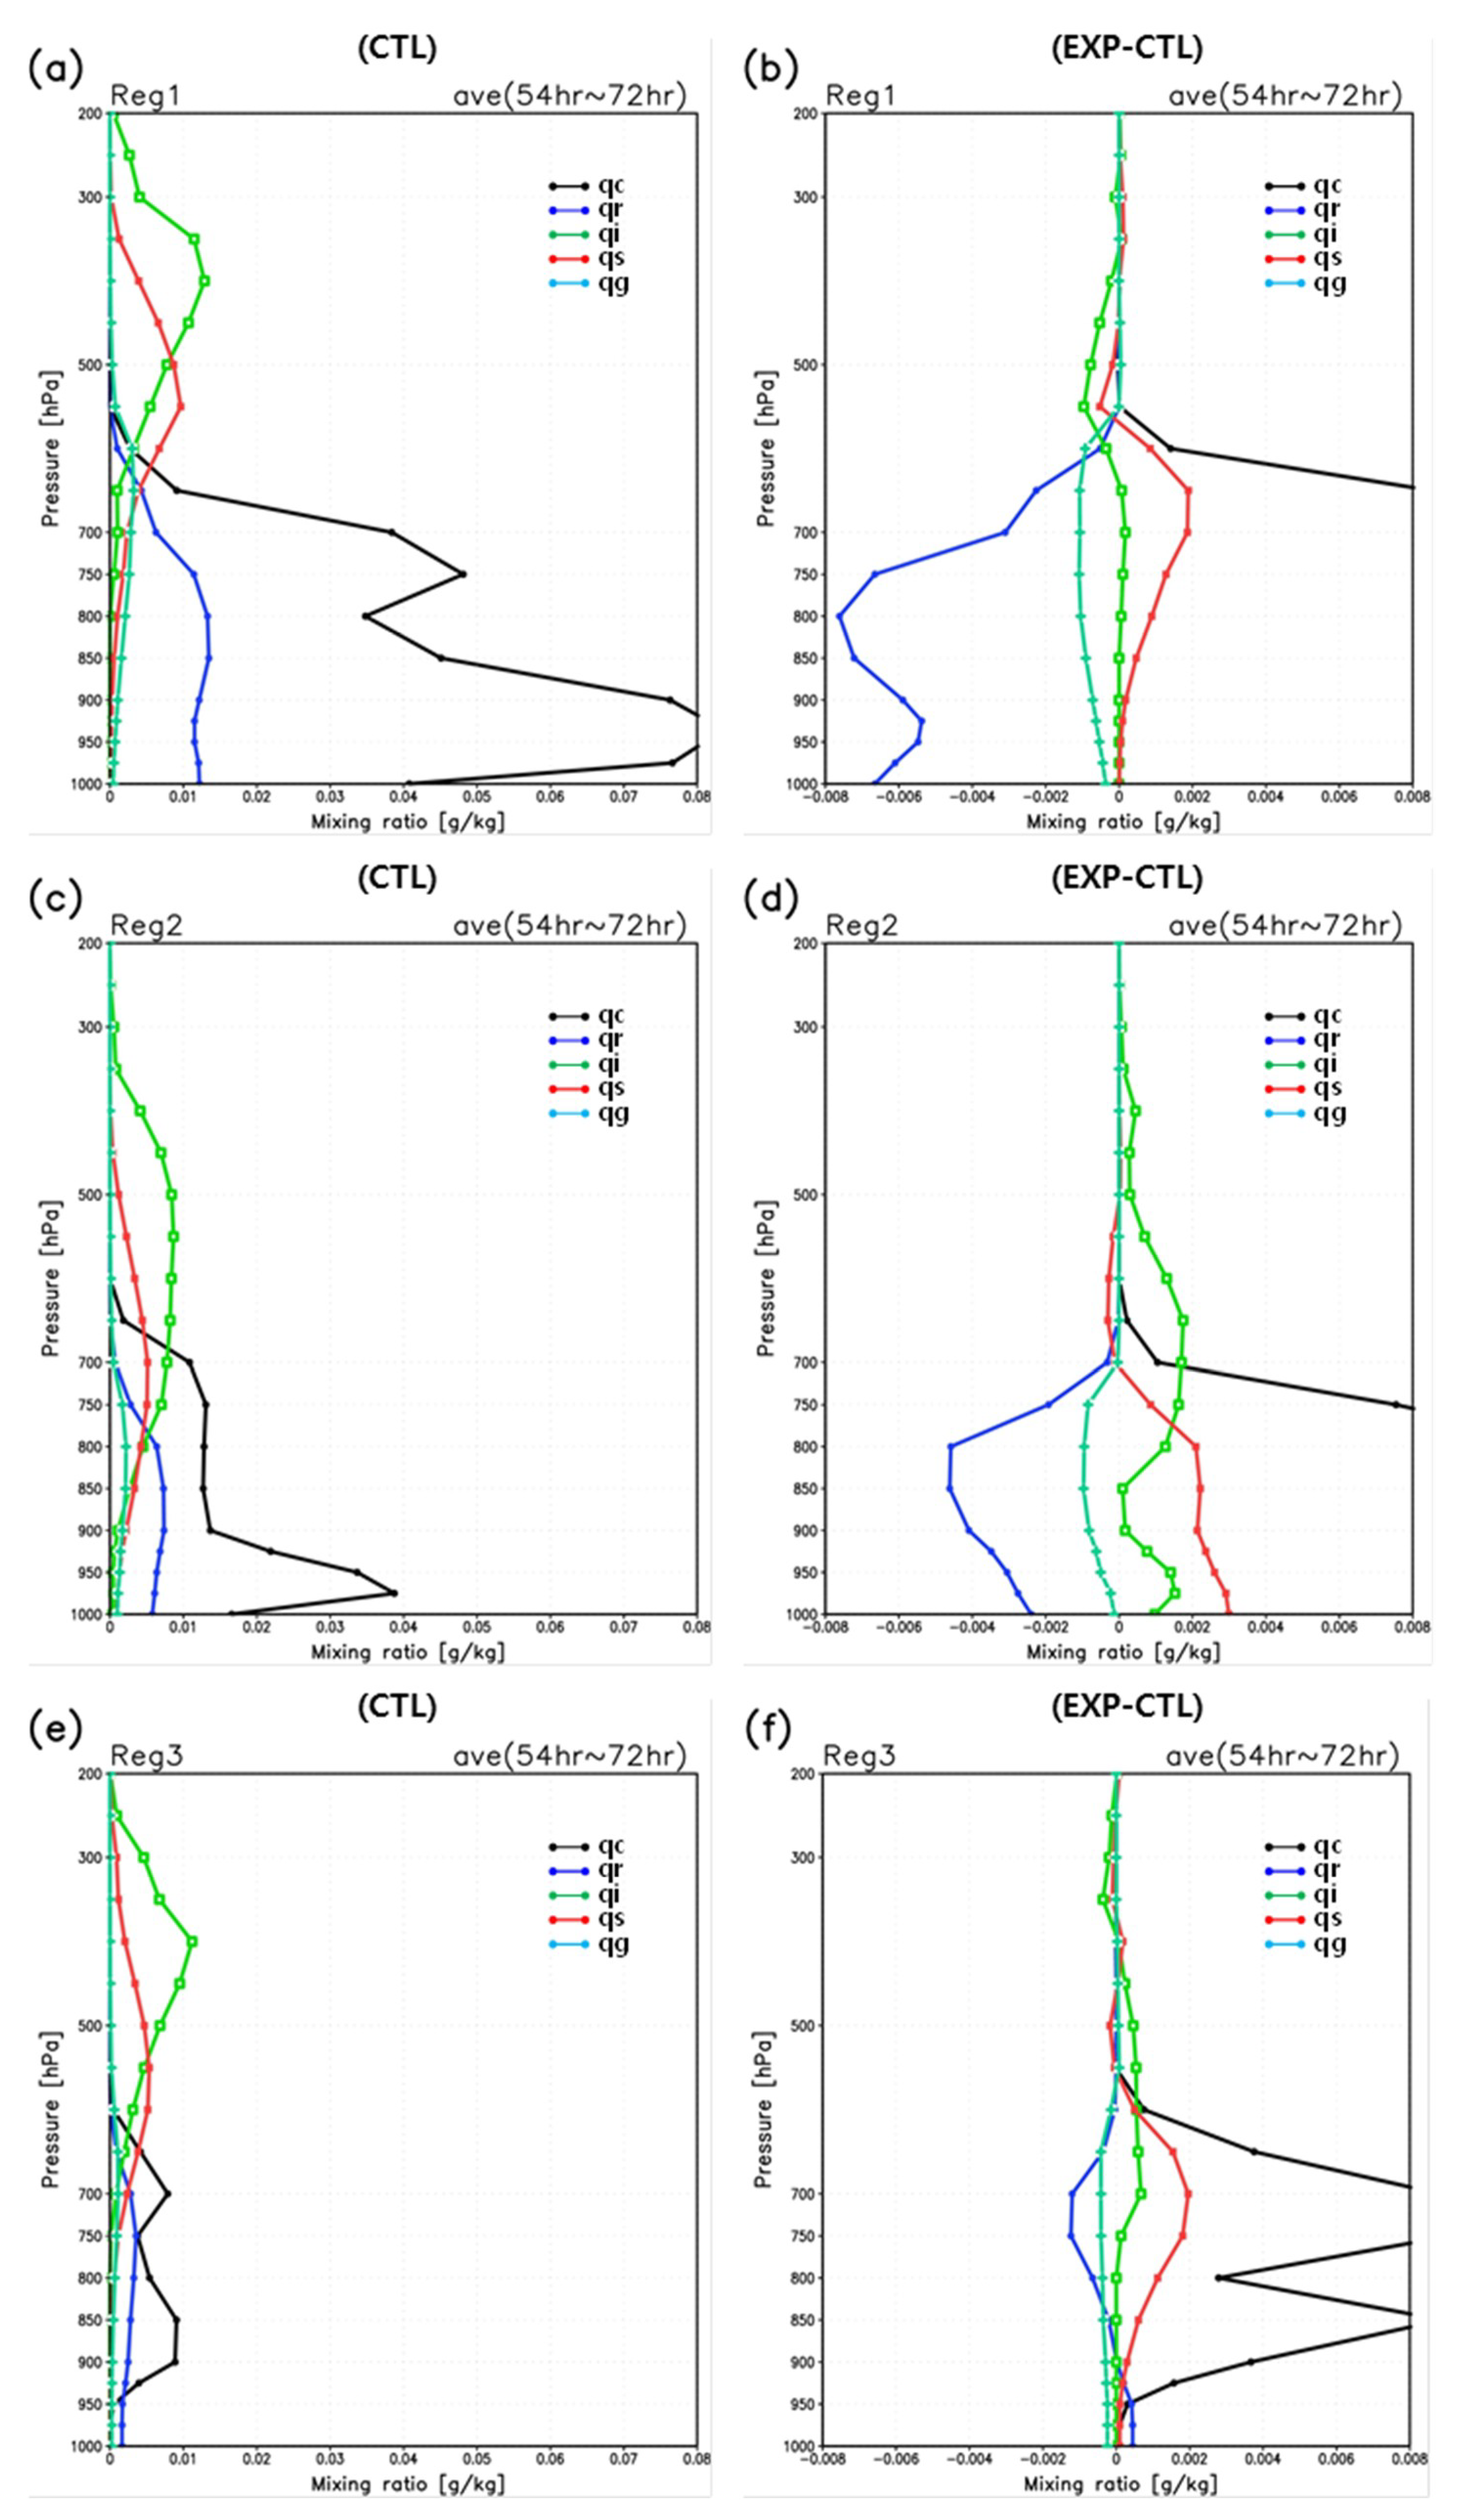
Three regions were selected to investigate the non-convective precipitation change for EXP. Both Regions 1 and 2 are over the ocean, showing a negative and positive precipitation change, respectively. Region 3 is over land with positive precipitation change.
Figure 5 shows the averaged vertical profiles of hydrometeors over the three regions for the CTL run and the differences between the EXP and CTL runs. In region 1, QC is much higher than in other regions for the lower atmosphere, because lower clouds are frequently observed in the North Pacific, as shown in Figure 3c. The QC for EXP increases significantly, whereas rain water concentration (QR) for EXP decreases (Figure 5b). The increased Qc for EXP is due to the high concentration of CCN and it might be difficult for hydrometeors to grow into sufficiently large particles under high aerosol conditions. The mean diameters of Qc averaged from the values of 700 to 950 hPa for Region 1 for CTL and EXP are 12.76 and 3.10 μm, respectively. The vertical profile of the hydrometeors for Region 2 is similar to that for Region 1, whereas QC is much smaller, and ice-phase hydrometeors (cloud ice, snow, and graupel) are also observed in the lower atmosphere, because of the low temperature (Figure 5c). The cloud ice and snow concentrations (QI and QS) are increased remarkably for EXP at the lower atmosphere (Figure 5d). The difference in cloud ice and snow in Regions 1 and 2 could be why the positive (negative) precipitation feedback occurs in Region 2 (Region 1), although the CCN increases in both of Regions 1 and 2. In Region 2, the increased cloud ice and snow indicate the relatively fast growth of cold-phase cloud, compared to warm-phase cloud, which can induce an increase in precipitation, which is described visually in Figure 6.
Region 3 shows the lowest concentrations of hydrometeors among the three regions, indicating dry conditions over land. The difference in QC between EXP and CTL is much smaller compared to the other regions (Figure 5f) because the activated CCN is small owing to the low relative humidity (RH), leading to a small effect of CCN despite the large CCN concentration for EXP.
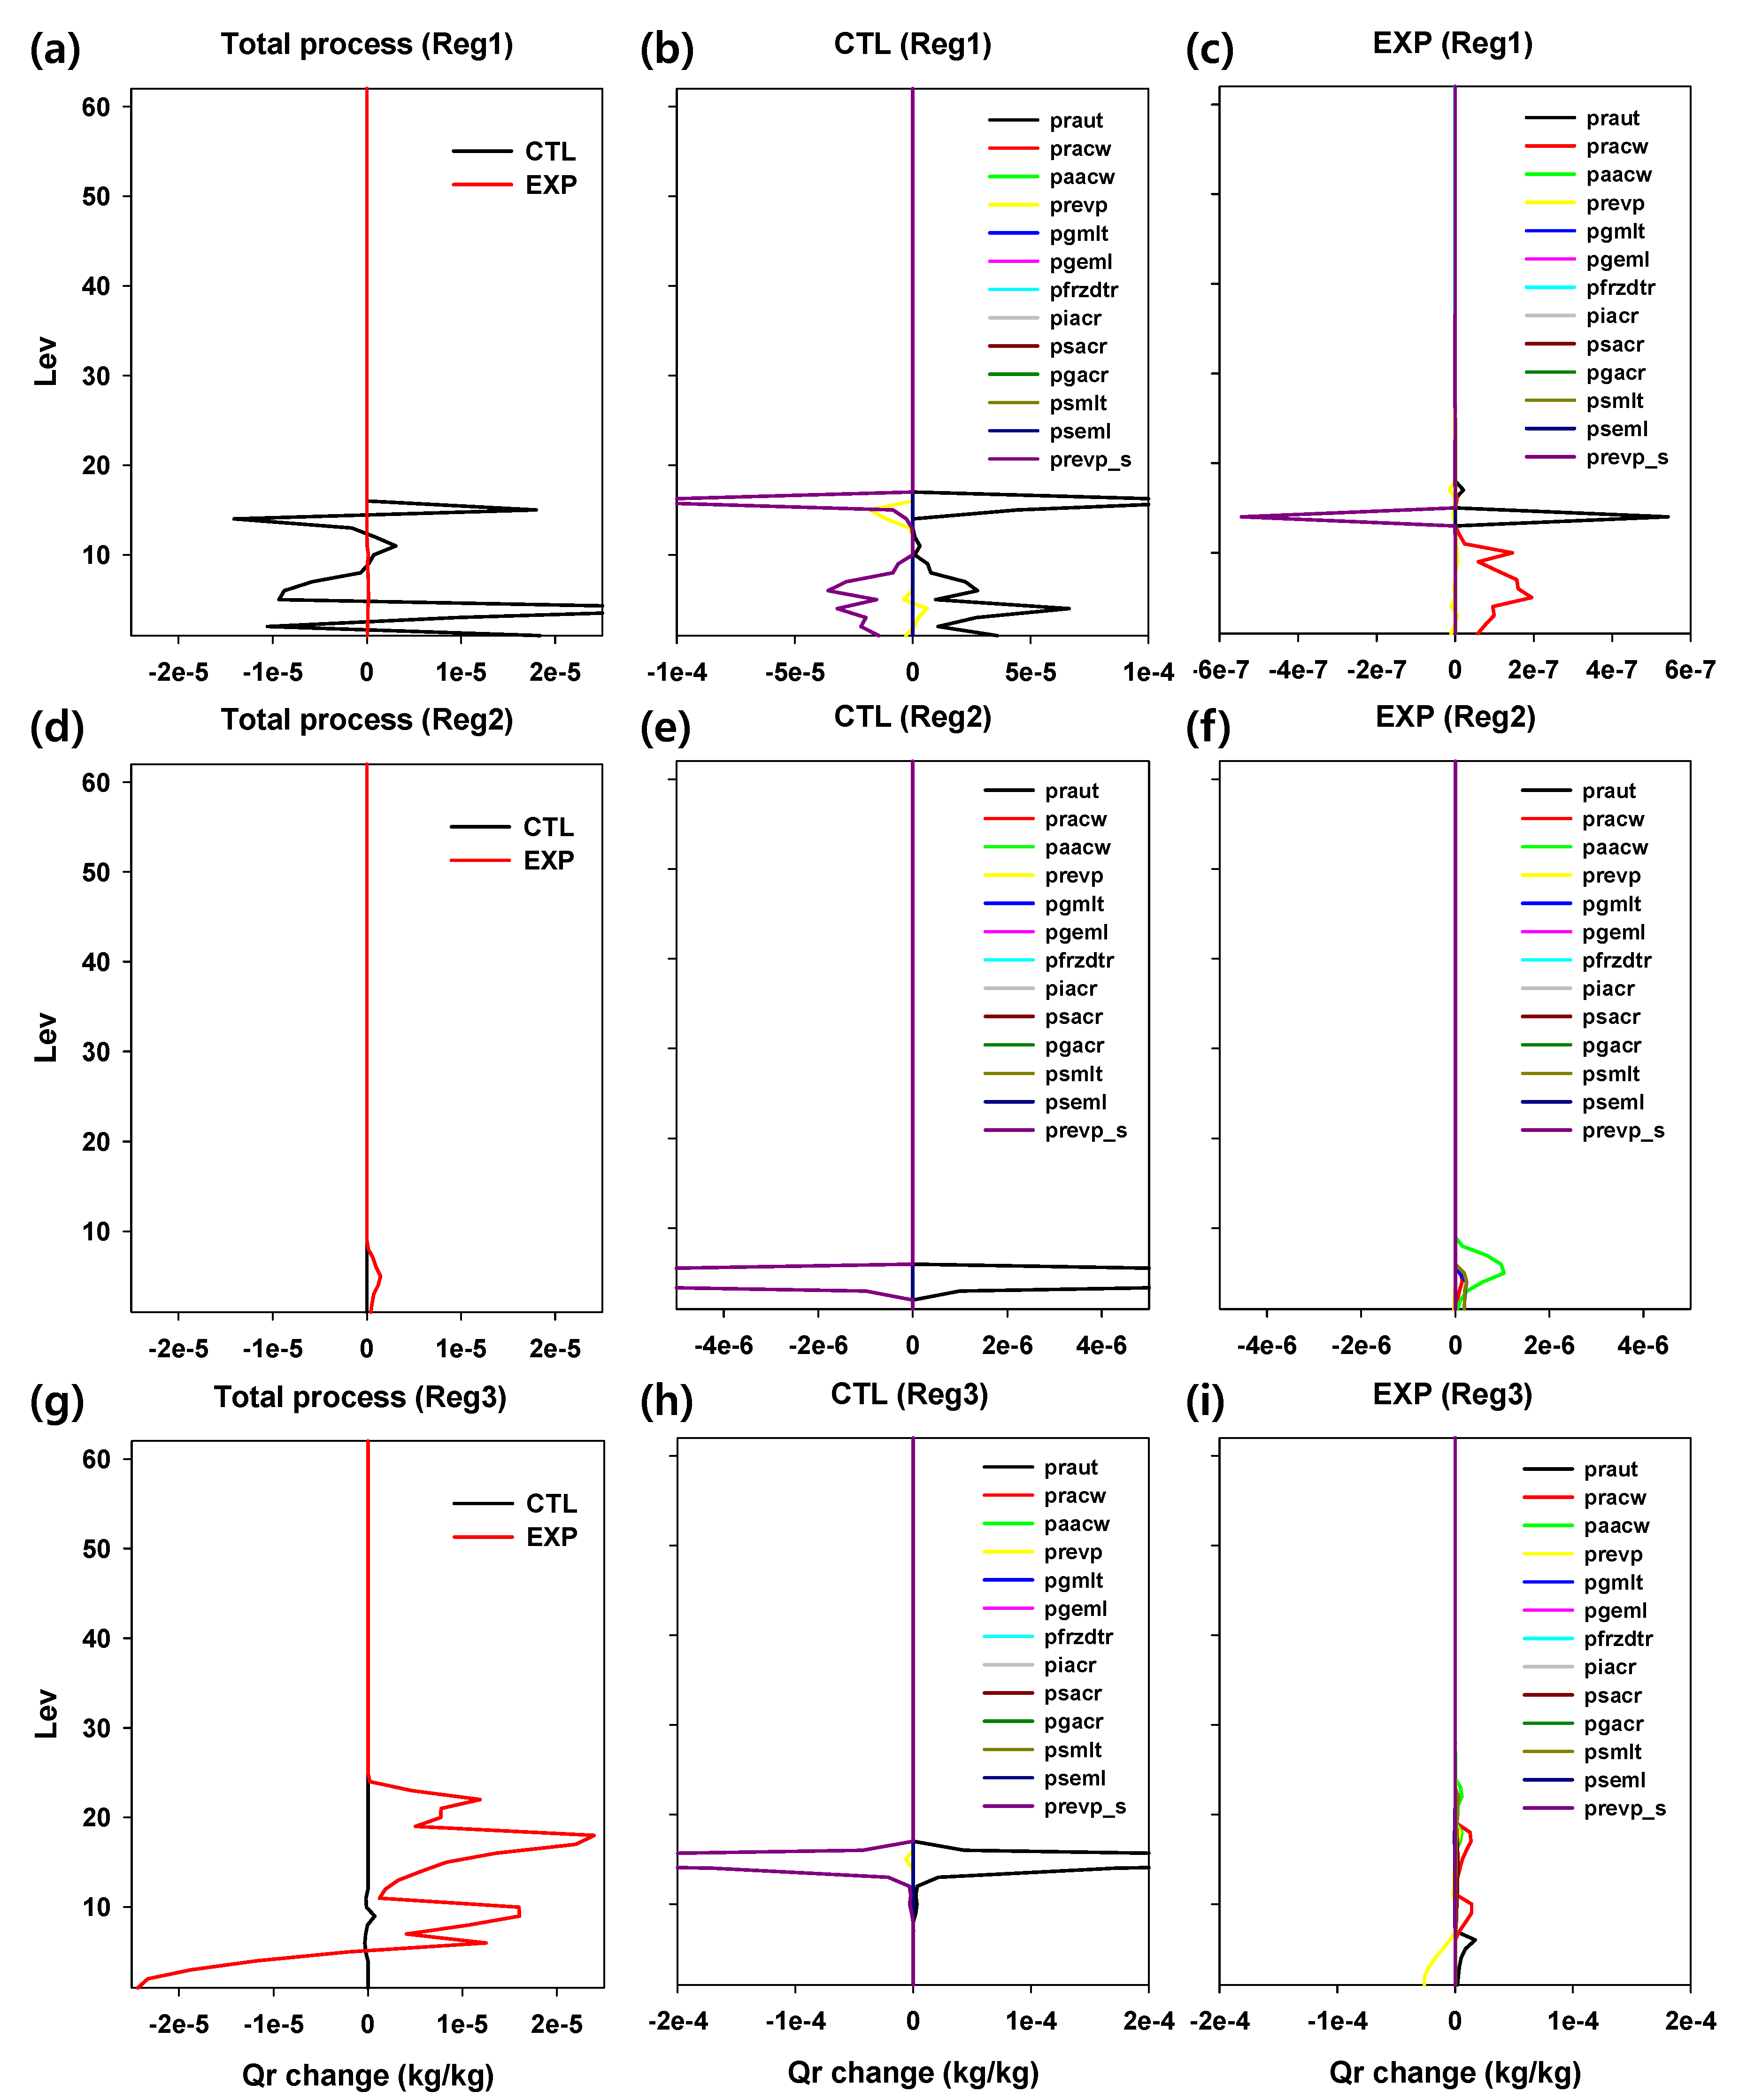
The processes affecting the concentration of rain water in the MPS are compared for the three regions in Figure 6. One point is selected for each region and the vertical profiles of source/sink processes (see Appendix A) for rain water at a specific time step are investigated. The sum of the source/sink processes for the CTL is much larger than that for EXP for Region 1 where the precipitation for CTL is larger than that of EXP (Figure 6a), whereas the process sum for CTL is much smaller for Regions 2 and 3 where the precipitation increases for EXP (Figure 6d,g).
The value of QR in Region 1 for CTL is generated mainly through an autoconversion (praut), whereas that for EXP occurs mainly through the accretion of rain water (pracw). The autoconversion also occurs for EXP, although the amount is much less compared to that for CTL owing to the small size of cloud water. Because of the high CCN concentration, cloud water with small size has a high number concentration and difficulty increasing into rain water, remaining as cloud water in the atmosphere for Region 1, leading to an increase in the cloud lifetime and a reduction in the amount of precipitation.
For the CTL run over Region 2, an autoconversion is dominant for the generation of rain water and other processes are negligible. However, most rain water is evaporated and changed back to cloud water, and not much precipitation occurs. For the EXP run over Region 2, however, no autoconversion occurs because of the cloud water’s small size (less than 15 μm) and high CCN concentrations. Instead of an autoconversion, the accretion of cloud water by snow/graupel and rain (paacw, pracw), and the melting of graupel and snow (pgmlt, psmlt) frequently occur, producing rain water. A high concentration of cloud ice and snow for EXP (Figure 5d) helps a generation of rain water, resulting in a positive precipitation change for EXP. This result is similar to a study by Lkhamjav et al. [68], who showed that the increase in mass content of snow particles contributes to a larger surface precipitation amount through melting and collision–coalescence.
For the EXP run over Region 3, autoconversion occurs for the lower altitude, whereas most of the rain water is evaporated because of low RH. The rain water generated at the middle altitude mainly through accretion of cloud water by rain (pracw) falls to the ground resulting in positive precipitation change for the EXP run.
As shown in Figure 5 and Figure 6, the effect of aerosols on the precipitation is not monotonic. The precipitation can be increased or decreased depending on the atmospheric conditions, such as vertical distributions of the hydrometeors, temperature, and RH. When cloud water with a small size is generated under high aerosol conditions, little autoconversion occurs and the precipitation can be reduced. More precipitation can occur when ice particles are under high CCN conditions because there are high opportunities of accretion and collision with the remaining cloud water that cannot increase into rain water.
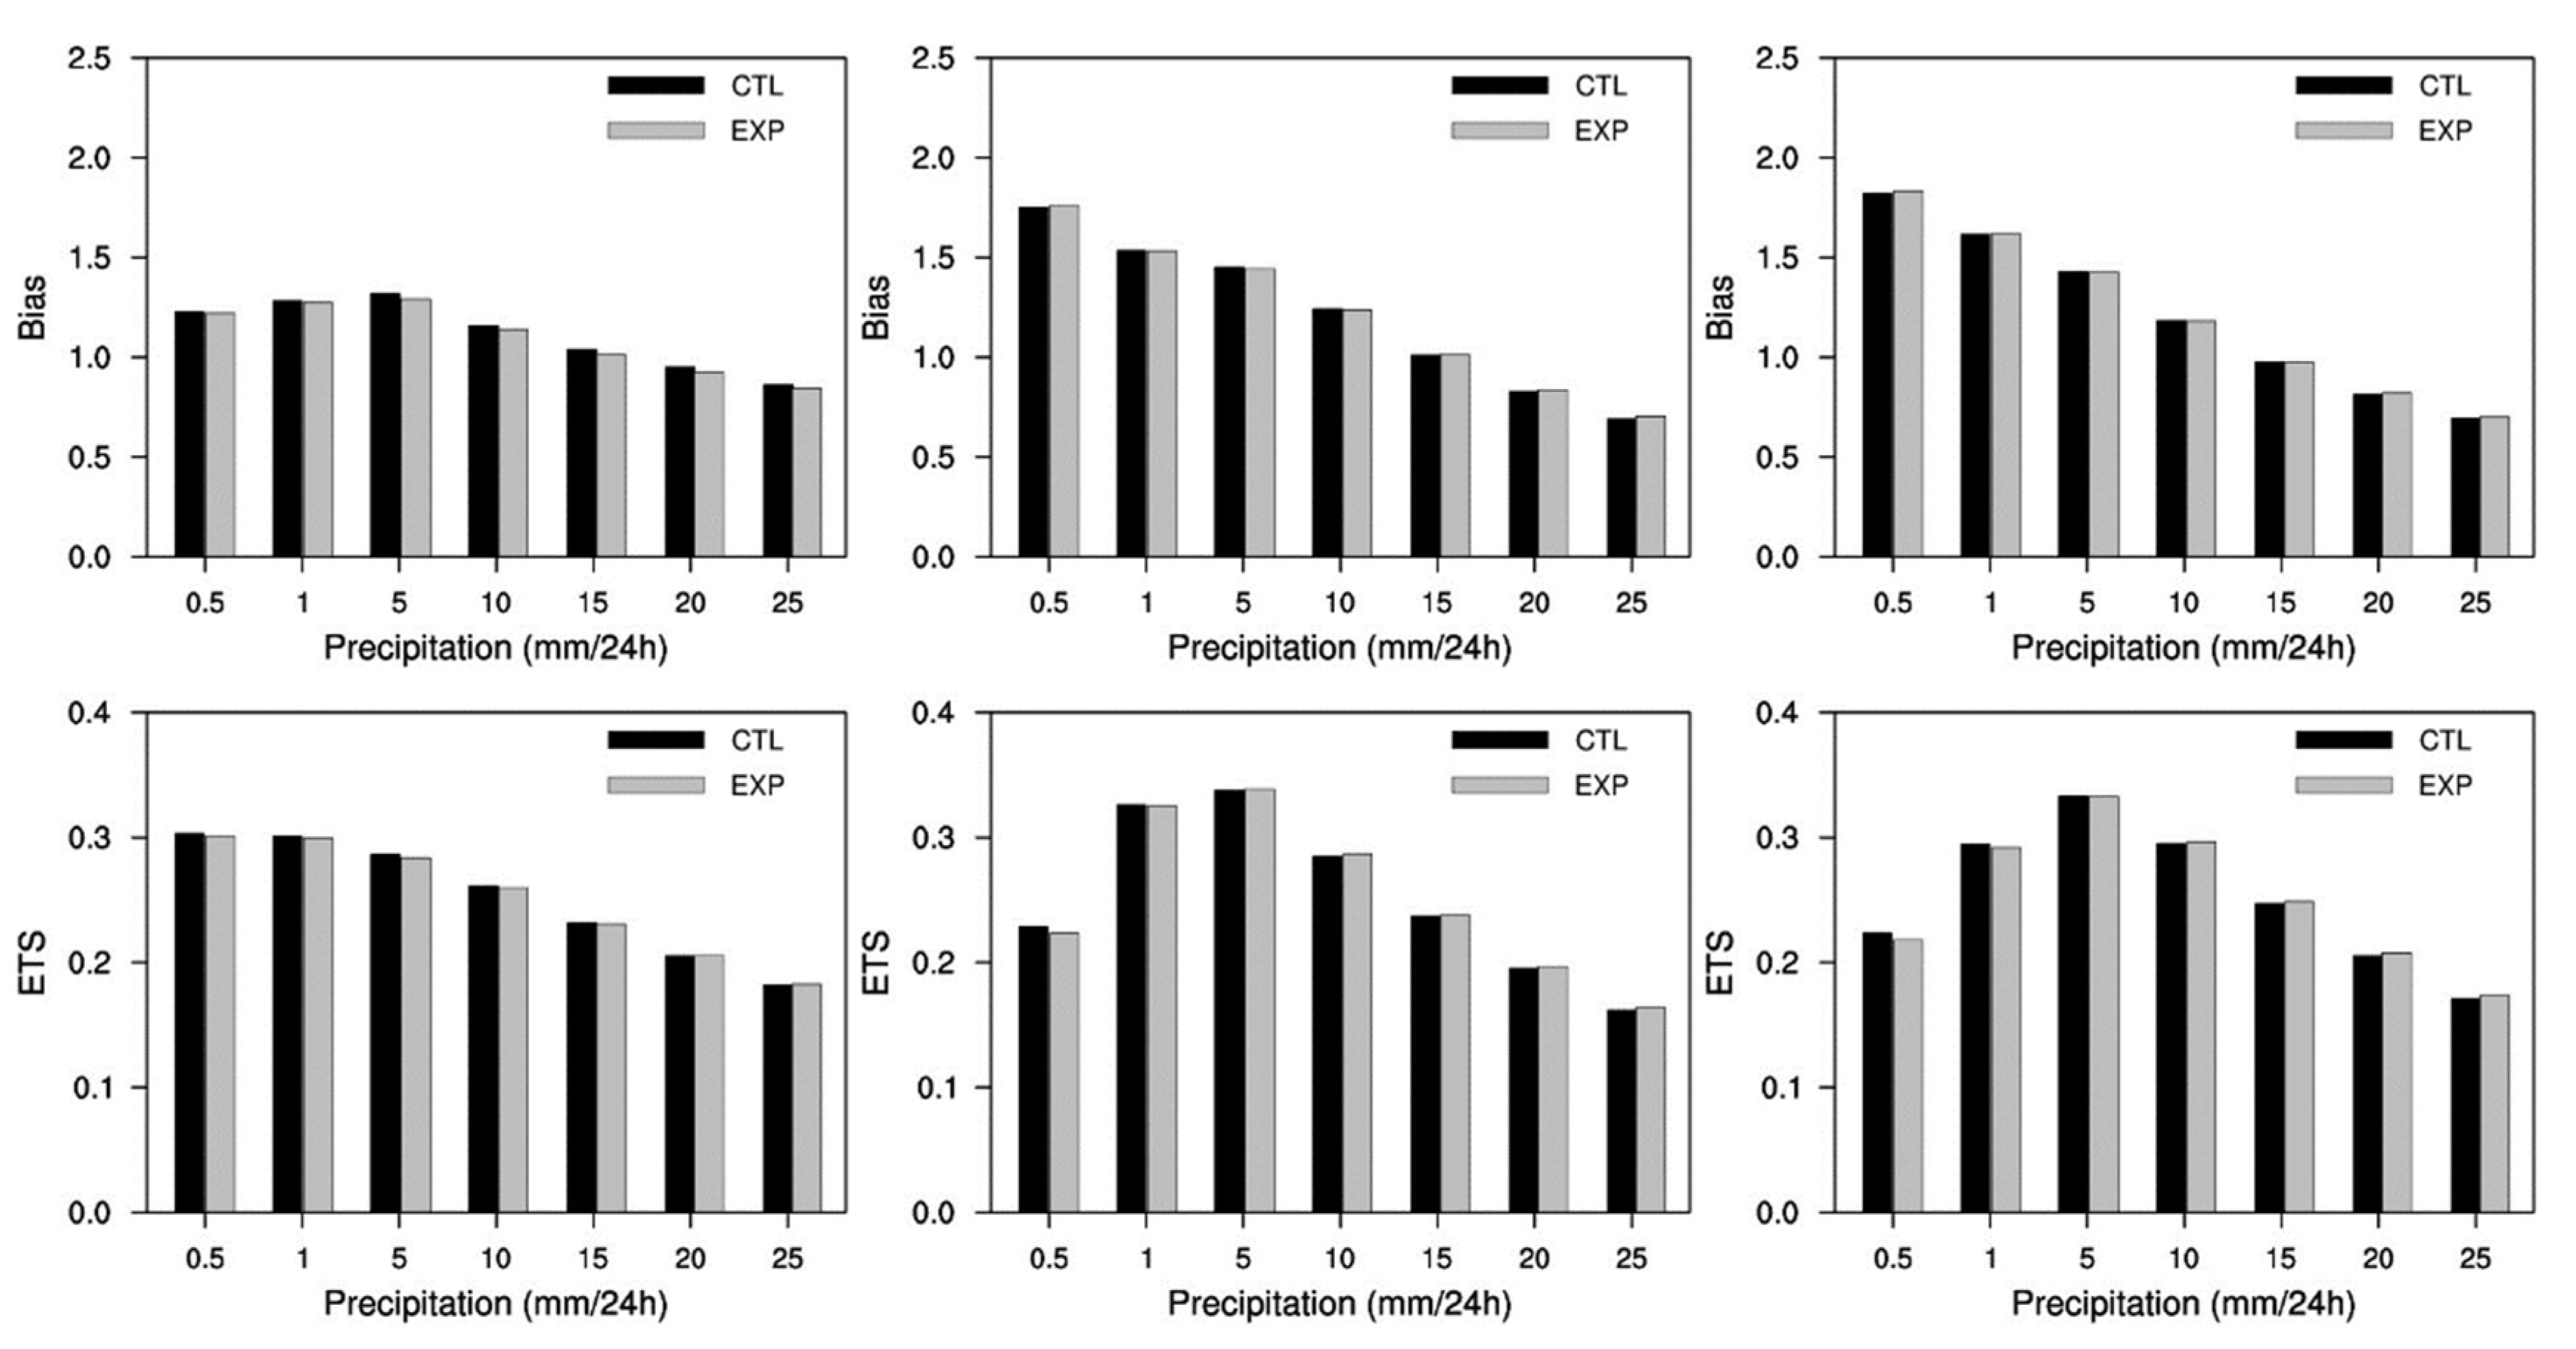
The bias score and equitable threat score (ETS) of the simulated precipitation against a Tropical Rainfall Measuring Mission (TRMM) Multi-Satellite Precipitation Analysis (TMPA) [69] for the globe were calculated for CTL and EXP (Figure 7). Heavy precipitation increases for the EXP run, and the ETS is slightly improved. Most improvements seem to be caused by the enhanced deep convection over the tropics. The decrease of precipitation over the Asia region could be due to the increase of CCN number concentration via shallow convection and microphysics processes. Although the bias score for the precipitation becomes far from 1, ETS is better for EXP than for CTL, which implies that the spatial pattern of the precipitation for EXP is also slightly improved. Although the changes of bias score and ETS of the precipitation in EXP simulation are small, the improvement implies that the complicated change in the precipitation distribution in Figure 4 is a positive feedback of modification with prognostic aerosols from the simplified chemistry package.

5. Summary

To incorporate the indirect aerosol effects in the global forecasting model, GRIMs—a simplified chemistry package based on the GOCART scheme of WRF-Chem—was implemented. Five tracers, namely, SO2, SO4, hydrophobic OC, hydrophilic OC, and sea salt, along with their emission, transport, deposition, and chemical processes, were considered in a simplified chemistry package. The simulated mass concentration of soluble chemical species was converted into the number concentrations of the CCN, which were applied to the precipitation algorithms, MPS and CPS. The increased CCN concentration is assumed to act on reducing (enhancing) shallow (deep) convective cloud precipitation for CPS.
To investigate the sensitivities, model simulations were conducted with and without the simplified chemistry package. The cloud water increases from an increase in the CCN when the chemistry package is coupled, resulting in a decrease in downward shortwave radiation at the surface. The effect of aerosols on the precipitation is not monotonic. For deep convective clouds, precipitation activities are intensified as a result of including the enhanced riming effect for ice particles when the aerosol concentration is high. The trend of non-convective precipitation change is mixed depending on the atmospheric conditions. When cloud water with a small size is generated under high aerosol conditions, little autoconversion occurs and the precipitation is reduced. More precipitation can occur when ice particles are falling under high CCN conditions owing to the accretion of cloud water by snow/graupel and rain and the melting of graupel and snow.
The study presented herein is limited in scope in that it considered only sulfate, OC, and sea salt, neglecting important aerosol constituents such as nitrate and secondary organic carbon. In addition, the particle size is an extremely important factor when the particles serve as CCN; however, the particle size was not considered in this study. Nevertheless, the main advantage of the global weather forecasting model coupled with a simplified chemistry package is the possibility of considering the aerosol feedback mechanisms without interpolations in space and time. Combining two modeling systems requires a high CPU time, which we overcame to a certain degree by adopting a simplified chemistry package. In this study, the computational time for the EXP run was 1.27-times as long as that for the CTL run. For our next study, seasonal simulations will be conducted to investigate the aerosol–thermodynamics–dynamics interactions.

Author Contributions

J.-Y.K. and R.-S.P. leaded the whole processes for the publication of this paper via tight discussion. Most of figures and documentation were made by J.-Y.K. and all revisions are controlled by R.-S.P. S.Y.B. and J.-Y.H. mainly supported ideas and documentations about aerosol-microphysics interaction and aerosol-convection interaction, respectively.

Funding

This work was supported by the R&D project on the development of global numerical weather prediction systems of the Korea Institute of Atmospheric Prediction Systems (KIAPS) funded by the Korea Meteorological Administration (KMA).

Acknowledgments

This work was supported by the R&D project on the development of global numerical weather prediction systems of the Korea Institute of Atmospheric Prediction Systems (KIAPS) funded by the Korea Meteorological Administration (KMA).

Conflicts of Interest

The authors declare no conflicts of interest.

Appendix A

Table A1. List of symbols.
SymbolDescription
PrautAutoconversion of cloud water to form rain
PracwAccretion of cloud water by rain
paacwAccretion of cloud water by averaged snow/graupel
prevpEvaporation/condensation of rain
pgmltMelting of graupel to form rain
pgemlInduced by enhanced melting of graupel
pfrzdtrFreezing of rain water to graupel
piacrAccretion of rain by cloud ice
psacrAccretion of cloud ice by snow
pgacrAccretion of cloud ice by graupel
psmltMelting of snow
psemlInduced by enhanced melting of snow
prevp_sEvaporation of rain to form cloud water
Figure A1. Number concentrations of (a) CCN, (b) cloud droplets, and (c) mixing ratio of cloud water for the GRIMs simulations with (left panel) original and (right panel) doubled aerosol concentrations.
Atmosphere 10 00392 g0a1

References

  1. Bernstein, L.; Bosch, P.; Canziani, O.; Chen, Z.; Christ, R.; Davidson, O.; Hare, W.; Huq, S.; Karoly, D.; Kattsov, V. IPCC, 2007: Climate Change 2007: Synthesis Report. In Contribution of Working Groups I, II and III to the Fourth Assessment Report of the Intergovernmental Panel on Climate Change; Core Writing Team, Pachauri, R.K., Reisinger, A., Eds.; Intergov. Panel on Climate Change: Geneva, Switzerland, 2007. [Google Scholar]
  2. Zhang, Y. Online-coupled meteorology and chemistry models: History, current status, and outlook. Atmos. Chem. Phys. 2008, 8, 2895–2932. [Google Scholar] [CrossRef]
  3. Jones, A.; Roberts, D.L.; Slingo, A. A climate model study of indirect radiative forcing by anthropogenic sulphate aerosols. Nature 1994, 370, 450–453. [Google Scholar] [CrossRef]
  4. Takemura, T.; Nozawa, T.; Emori, S.; Nakajima, T.Y.; Nakajima, T. Simulation of climate response to aerosol direct and indirect effects with aerosol transport-radiation model. J. Geophys. Res. 2005, 110, D02202. [Google Scholar] [CrossRef]
  5. Lohmann, U.; Stier, P.; Hoose, C.; Ferrachat, S.; Kloster, S.; Roeckner, E.; Zhang, J. Cloud microphysics and aerosol indirect effects in the global climate model ECHAM5-HAM. Atmos. Chem. Phys. 2007, 7, 3425–3446. [Google Scholar] [CrossRef] [Green Version]
  6. Bangert, M.; Kottmeier, C.; Vogel, B.; Vogel, H. Regional scale effects of the aerosol cloud interaction simulated with an online coupled comprehensive chemistry model. Atmos. Chem. Phys. 2011, 11, 4411–4423. [Google Scholar] [CrossRef] [Green Version]
  7. Grell, G.A.; Baklanov, A. Integrated modeling for forecasting weather and air quality: A call for fully coupled approaches. Atmos. Environ. 2011, 45, 6845–6851. [Google Scholar] [CrossRef]
  8. Grell, G.A.; Freitas, S.R. A scale and aerosol aware stochastic convective parameterization for weather and air quality modeling. Atmos. Chem. Phys. Discuss. 2013, 13, 23845–23893. [Google Scholar] [CrossRef]
  9. Berg, L.K.; Shrivastava, H.; Easter, R.C.; Fast, J.D.; Chapman, E.G.; Liu, Y.; Ferrare, R.A. A new WRF-Chem treatment for studying regional-scale impacts of cloud processes on aerosol and trace gases in parameterized cumuli. Geosci. Model Dev. 2015, 8, 409–429. [Google Scholar] [CrossRef] [Green Version]
  10. Hong, S.-Y.; Park, H.; Cheong, H.-B.; Kim, J.-E.E.; Koo, M.-S.; Jang, J.; Ham, S.; Hwang, S.-O.; Park, B.-K.; Chang, E.-C.; et al. The Global/Regional Integrated Model System (GRIMs). Asia Pac. J. Atmos. Sci. 2013, 49, 219–243. [Google Scholar] [CrossRef]
  11. Baklanov, A.; Schlünzen, K.; Suppan, P.; Baldasano, J.; Brunner, D.; Aksoyoglu, S.; Carmichael, G.; Douros, J.; Flemming, J.; Forkel, R.; et al. Online coupled regional meteorology chemistry models in Europe: Current status and prospects. Atmos. Chem. Phys. 2014, 14, 317–398. [Google Scholar] [CrossRef]
  12. Chin, M.; Rood, R.B.; Lin, S.-J.; Muller, J.F.; Thompson, A.M. Atmospheric sulfur cycle in the global model GOCART: Model description and global properties. J. Geophys. Res. 2000, 105, 24671–24687. [Google Scholar] [CrossRef]
  13. Grell, G.A.; Peckham, S.E.; Schmitz, R.; McKeen, S.A.; Frost, G.; Skamarock, W.C.; Eder, B. Fully coupled ‘online’ chemistry in the WRF model. Atmos. Environ. 2005, 39, 6957–6976. [Google Scholar] [CrossRef]
  14. Fan, T.; Toon, O.B. Modeling sea-salt aerosol in a coupled climate and sectional microphysical model: Mass, optical depth and number concentration. Atmos. Chem. Phys. 2011, 11, 4587–4610. [Google Scholar] [CrossRef]
  15. Gong, S.; Barrie, L.A.; Blanchet, J.-P. Modeling sea salt aerosols in the atmosphere, 1: Model development. J. Geophys. Res. 1997, 102, 3805–3818. [Google Scholar] [CrossRef]
  16. Monahan, E.C.; Spiel, D.E.; Davidson, K.L. A model of marine aerosol generation via whitecaps and wave disruption. In Oceanic Whitecaps; Monahan, E.C., Niocaill, G.M., Eds.; Springer: Dordrecht, The Netherlands, 1986; pp. 167–174. [Google Scholar]
  17. Granier, C.; Bessagnet, B.; Bond, T.; D’Angiola, A.; van der Gon, H.D.; Frost, G.J.; Heil, A.; Kaiser, J.W.; Kinne, S.; Klimont, Z.; et al. Evolution of anthropogenic and biomass burning emissions of air pollutants at global and regional scales during the 1980–2010 period. Clim. Chang. 2011, 109, 163–190. [Google Scholar] [CrossRef]
  18. Diehl, T.; Heil, A.; Chin, M.; Pan, X.; Streets, D.; Schultz, M.; Kinne, S. Anthropogenic, biomass burning, and volcanic emissions of black carbon, organic carbon, and SO2 from 1980 to 2010 for hindcast model experiments. Atmos. Chem. Phys. Discuss. 2012, 24895–24954. [Google Scholar] [CrossRef]
  19. Shin, H.H.; Hong, S.-Y. Representation of the Subgrid-Scale Turbulent Transport in Convective Boundary Layers at Gray-Zone Resolutions. Mon. Weather Rev. 2015, 143, 250–271. [Google Scholar] [CrossRef]
  20. Wesely, M.L. Parameterization of surface resistance to gaseous dry deposition in regional-scale numerical models. Atmos. Environ. 1989, 23, 1293–1304. [Google Scholar] [CrossRef]
  21. Walcek, C.J.; Brost, R.A.; Chang, J.S.; Wesely, M.L. SO2, sulface and HNO3 deposition velocities computed using regional land use and meteorological data. Atmos. Environ. 1986, 20, 949–964. [Google Scholar] [CrossRef]
  22. Seinfeld, J.H.; Pandis, S.N. Atmospheric Chemistry and Physics: From Air Pollution to Climate Change, 3rd ed.; John Wiley & Sons: Hoboken, NJ, USA, 2006. [Google Scholar]
  23. Roselle, S.J.; Binkowski, F.S. Chapter 11 of CMAQ Model Description. In Science Algorithms of the EPA Models-3 Community Multiscale Air Quality (CMAQ) Modeling System; Byun, D.W., Ching, J.K.S., Eds.; U.S. Environmental Protection Agency: Washington, DC, USA, 1999; EPA/600/R-99/030. [Google Scholar]
  24. Müller, J.-F.; Brasseur, G. IMAGES: A three-dimensional chemical transport model of the global troposphere. J. Geophys. Res. 1995, 100, 16445–16490. [Google Scholar] [CrossRef]
  25. Liu, P.S.K.; Leaitch, W.R.; Banic, C.M.; Li, S.M.; Ngo, D.; Megaw, W.J. Aerosol observations at Chebogue Point during the 1993 North Atlantic Regional Experiment: Relationships among cloud condensation nuclei, size distribution, and chemistry. J. Geophys. Res. 1996, 101, 28971–28990. [Google Scholar] [CrossRef]
  26. Chuang, P.Y.; Collins, D.R.; Pawlowska, H.; Snider, J.R.; Jonsson, H.H.; Brenguier, J.L.; Flagan, R.C.; Seinfeld, J.H. CCN measurements during ACE-2 and their relationship to cloud microphysical properties. Tellus B 2000, 52, 843–867. [Google Scholar] [CrossRef]
  27. Cantrell, W.; Shaw, G.; Cass, G.R.; Chowdhury, Z.; Hughes, L.S.; Prather, K.A.; Guazzotti, S.A.; Coffee, K.R. Closuer between aerosol particles and cloud condensation nuclei at Kaashidhoo Climate Observatory. J. Geophys. Res. 2001, 106, 28711–28718. [Google Scholar] [CrossRef]
  28. Cooke, W.F.; Liousse, C.; Cachier, H.; Feichter, J. Construction of a 1 degrees × 1 degrees fossil fuel emission data set for carbonaceous aerosol and implementation and radiative impact in the ECHAM4 model. J. Geophys. Res. 1999, 104, 22137–22162. [Google Scholar] [CrossRef]
  29. Chin, M.; Ginoux, P.; Kinne, S.; Torres, O.; Holben, B.N.; Duncan, B.N.; Martin, R.V.; Logan, J.A.; Higurashi, A.; Nakajima, T. Tropospheric aerosol optical thickness from the GOCART model and comparisons with satellite and Sun photometer measurements. J. Atmos. Sci. 2002, 59, 461–483. [Google Scholar] [CrossRef]
  30. Lim, K.-S.; Hong, S.-Y. Development of an effective double-moment cloud microphysics scheme with prognostic cloud condensation nuclei (CCN) for weather and climate models. Mon. Weather Rev. 2010, 138, 1587–1612. [Google Scholar] [CrossRef]
  31. Menon, S.; Del Genio, A.D.; Koch, D.; Tselioudis, G. GCM Simulations of the aerosol indirect effect: Sensitivity to cloud parameterization and aerosol burden. J. Atmos. Sci. 2002, 59, 692–713. [Google Scholar] [CrossRef]
  32. Twomey, S. The nuclei of natural cloud formation, Part Ⅱ: The supersaturation in natural clouds and the variation of cloud droplet concentration. Geofis. Pura Appl. 1959, 43, 243–249. [Google Scholar] [CrossRef]
  33. Khairoutdinov, M.; Kogon, Y. A new cloud physics parameterization in a large-eddy simulation model of marine stratocumulus. Mon. Weather Rev. 2000, 128, 229–243. [Google Scholar] [CrossRef]
  34. Hong, S.-Y.; Lim, J.-O. The WRF single-moment 6-class microphysics scheme (WSM6). J. Korean Meteor. Soc. 2006, 42, 129–151. [Google Scholar]
  35. Han, J.-Y.; Hong, S.-Y.; Lim, K.-S.; Han, J. Sensitivity of a cumulus parameterization scheme to precipitation production representation and its impact on a heavy rain event over Korea. Mon. Weather Rev. 2016, 144, 2125–2135. [Google Scholar] [CrossRef]
  36. Kwon, Y.C.; Hong, S.-Y. A mass-flux cumulus parameterization scheme across gray-zone resolutions. Mon. Weather Rev. 2017, 145, 583–598. [Google Scholar] [CrossRef]
  37. Lohmann, U.; Feichter, J.; Chuang, C.C.; Penner, J.E. Predicting the number of cloud droplets in the ECHAM GCM. J. Geophys. Res. 1999, 104, 9169–9198. [Google Scholar] [CrossRef]
  38. Ghan, S.J.; Easter, R.C.; Chapman, E.; Abdul-Razaak, H.; Zhang, Y.; Leung, R.; Laulainen, N.; Saylor, R.; Zaveri, R. A physically based estimate of radiative forcing by anthropogenic sulfate aerosol. J. Geophys. Res. 2001, 106, 5279–5293. [Google Scholar] [CrossRef] [Green Version]
  39. Khain, A.P.; BenMoshe, N.; Pokrovsky, A. Factors determining the impact of aerosols on surface precipitation from clouds: An attempt at classification. J. Atmos. Sci. 2008, 65, 1721–1748. [Google Scholar] [CrossRef]
  40. Khain, A.P. Notes on state-of-the-art investigations of aerosol effects on precipitation: A critical review. Environ. Res. Lett. 2009, 4, 015004. [Google Scholar] [CrossRef]
  41. Han, J.-Y.; Baik, J.-J.; Lee, H. Urban impacts on precipitation. Asia-Pac. J. Atmos. Sci. 2014, 50, 17–30. [Google Scholar] [CrossRef]
  42. Lerach, D.G.; Gaude, B.J.; Cotton, W.R. Idealized simulations of aerosol influences on tornadogenesis. Geophys. Res. Lett. 2008, 35, L23806. [Google Scholar] [CrossRef]
  43. Wang, C. A modeling study of the response of tropical deep convection to the increase of cloud condensation nuclei concentration: 1. Dynamics and microphysics. J. Geophys. Res. 2005, 110, D21211. [Google Scholar] [CrossRef]
  44. Fan, J.; Zhang, R.; Li, G.; Tao, W.-K.; Li, X. Simulations of cumulus clouds using a spectral microphysics cloud-resolving model. J. Geophys. Res. 2007, 112, D04201. [Google Scholar] [CrossRef]
  45. Tao, W.-K.; Li, X.; Khain, A.; Matsui, T.; Lang, S.; Simpson, J. Role of atmospheric aerosol concentration on deep convective precipitation: Cloud-revolsing model simulations. J. Geophys. Res. 2007, 112, D24S18. [Google Scholar] [CrossRef]
  46. Khain, A.; Lynn, B. Simulation of a supercell strom in clean and dirty atmosphere using weather research and forecast model with spectral bin microphysics. J. Geophys. Res. 2009, 114, D19209. [Google Scholar] [CrossRef]
  47. Lim, K.-S.S.; Hong, S.-Y.; Yum, S.S.; Dudhia, J.; Klemp, J.B. Aerosol effects on the development of a supercell storm in a double-moment bulk-cloud microphysics scheme. J. Geophys. Res. 2011, 116, D02204. [Google Scholar] [CrossRef]
  48. Lim, K.-S.S. Investigation of Aerosol Indirect Effects on Simulated Moist Convections. Ph.D. Thesis, Yonsei University, Seoul, Korea, 2011. [Google Scholar]
  49. Baek, S. A revised radiation package of G-packed McICA and two-stream approximation: Performance evaluation in a global weather forecasting model. J. Adv. Model. Earth Syst. 2017, 9, 1628–1640. [Google Scholar] [CrossRef]
  50. Park, R.-S.; Chae, J.-H.; Hong, S.-Y. A revised prognostic cloud fraction scheme in a global forecasting system. Mon. Weather Rev. 2016, 114, 1219–1229. [Google Scholar] [CrossRef]
  51. Han, J.; Pan, H.-L. Revision of convection and vertical diffusion schemes in the NCEP global forecast system. Weather Forecast 2011, 26, 520–533. [Google Scholar] [CrossRef]
  52. Ek, M.B.; Mitchell, K.E.; Lin, Y.; Rogers, E.; Grunmann, P.; Koren, V.; Gayno, G.; Tarpley, J.D. Implementation of Noah land surface model advances in the National Centers for Environmental Prediction operational mesoscale Eta model. J. Geophys. Res. 2003, 108, 8851. [Google Scholar] [CrossRef]
  53. Kim, Y.-J.; Arakawa, A. Improvement of orographic gravity wave parameterization using a mesoscale gravity wave model. J. Atmos. Sci. 1995, 52, 1875–1902. [Google Scholar] [CrossRef]
  54. Chun, H.-Y.; Baik, J.-J. Momentum flux by thermally induced internal gravity waves and its approximation for large-scale models. J. Atmos. Sci. 1998, 55, 3299–3310. [Google Scholar] [CrossRef]
  55. Emmons, L.K.; Walters, S.; Hess, P.G.; Lamarque, J.-F.; Pfister, G.G.; Fillmore, D.; Granier, C.; Guenther, A.; Kinnison, D.; Laepple, T.; et al. Description and evaluation of the Model for Ozone and Related chemical Tracers, version 4 (MOZART-4). Geosci. Model Dev. 2010, 3, 43–67. [Google Scholar] [CrossRef] [Green Version]
  56. MOZART-4. Available online: http://www.acom.ucar.edu/wrf-chem/mozart.shtml (accessed on 12 July 2019).
  57. CAMS Reanalysis. Available online: https://apps.ecmwf.int/data-catalogues/cams-reanalysis/?class=mc&expver=eac4 (accessed on 12 July 2019).
  58. CAMS Reanalysis data documentation. Available online: https://confluence.ecmwf.int/display/CKB/CAMS+Reanalysis+data+documentation (accessed on 12 July 2019).
  59. Jeong, G.-R.; Wang, C. Climate effects of seasonally varying Biomass Burning emitted Carbonaceous Aerosols (BBCA). Atmos. Chem. Phys. 2010, 10, 8373–8389. [Google Scholar] [CrossRef] [Green Version]
  60. Choi, I.-J.; Park, R.-S.; Lee, J. Impacts of a newly-developed aerosol climatology on numerical weather prediction using a global atmospheric forecasting model. Atmos. Environ. 2018, 15, 77–91. [Google Scholar] [CrossRef]
  61. Rasch, P.J.; Feichter, J.; Law, K.; Mahowald, N.; Penner, J.; Benkovitz, C.; Genthon, C.; Giannakopolous, C.; Kasibhatla, P.; Koch, D.; et al. A comparison of scavenging and eposition processes in global models: Results from the WCCRP Cambridge Workshop of 1995. Tellus 2000, 52B, 1025–1056. [Google Scholar] [CrossRef]
  62. Almeida, G.P.; Brito, J.; Morales, C.A.; Andrade, M.F.; Artaxo, P. Measured and modelled cloud condensation nuclei (CCN) concentration in São Paulo, Brazil: The importance of aerosol size-resolved chemical composition on CCN concentration prediction. Atmos. Chem. Phys. 2014, 14, 7559–7572. [Google Scholar] [CrossRef]
  63. Burkart, J.; Steiner, G.; Reischl, G.; Hitzenberger, R. Long-term study of cloud condensation nuclei (CCN) activation of the atmospheric aerosol in Vienna. Atmos. Environ. 2011, 45, 5751–5759. [Google Scholar] [CrossRef]
  64. Che, H.C.; Zhang, X.Y.; Zhang, L.; Wang, Y.Q.; Zhang, Y.M.; Shen, X.J.; Ma, Q.L.; Sun, J.Y.; Zhong, J.T. Prediction of size-resolved number concentration of cloud condensation nuclei and long-term measurements of their activation characteristics. Sci. Rep. 2017, 7, 5819. [Google Scholar] [CrossRef]
  65. Makkonen, R.; Asmi, A.J.; Kerminen, V.-M.; Boy, M.; Arneth, A.; Hari, P.; Kulmala, M. Air pollution control and decreasing new particl formation lead to strong climate warming. Atmos. Chem. Phys. 2012, 12, 1515–1524. [Google Scholar] [CrossRef]
  66. Westervelt, D.M.; Pierce, J.R.; Adams, P.J. Analysis of feedbacks nucleation rate, survival probability and cloud condensation nuclei formation. Atmos. Chem. Phys. 2014, 14, 5577–5597. [Google Scholar] [CrossRef]
  67. Adams, P.J.; Seinfeld, J.H. Predicting global aerosol size distributions in general circulation models. J. Geophys. Res. 2002, 107, 4370. [Google Scholar] [CrossRef]
  68. Lkhamjav, J.; Lee, H.; Jeon, Y.-L.; Seo, J.M.; Baik, J.-J. Impacts of aerosol loading on surface precipitation from deep convective systems over North Central Mongolia. Asia Pac. J. Atmos. Sci. 2018, 54, 587–598. [Google Scholar] [CrossRef]
  69. Huffman, G.J.; Bolvin, D.T.; Nelkin, E.J.; Wolff, D.B. The TRMM Multisatellite Precipitation Analysis (TMPA): Quasi-Global, Multiyear, Combined-Sensor Precipitation Estimates at Fine Scales. J. Hydrometeorol. 2007, 8, 38–55. [Google Scholar] [CrossRef]
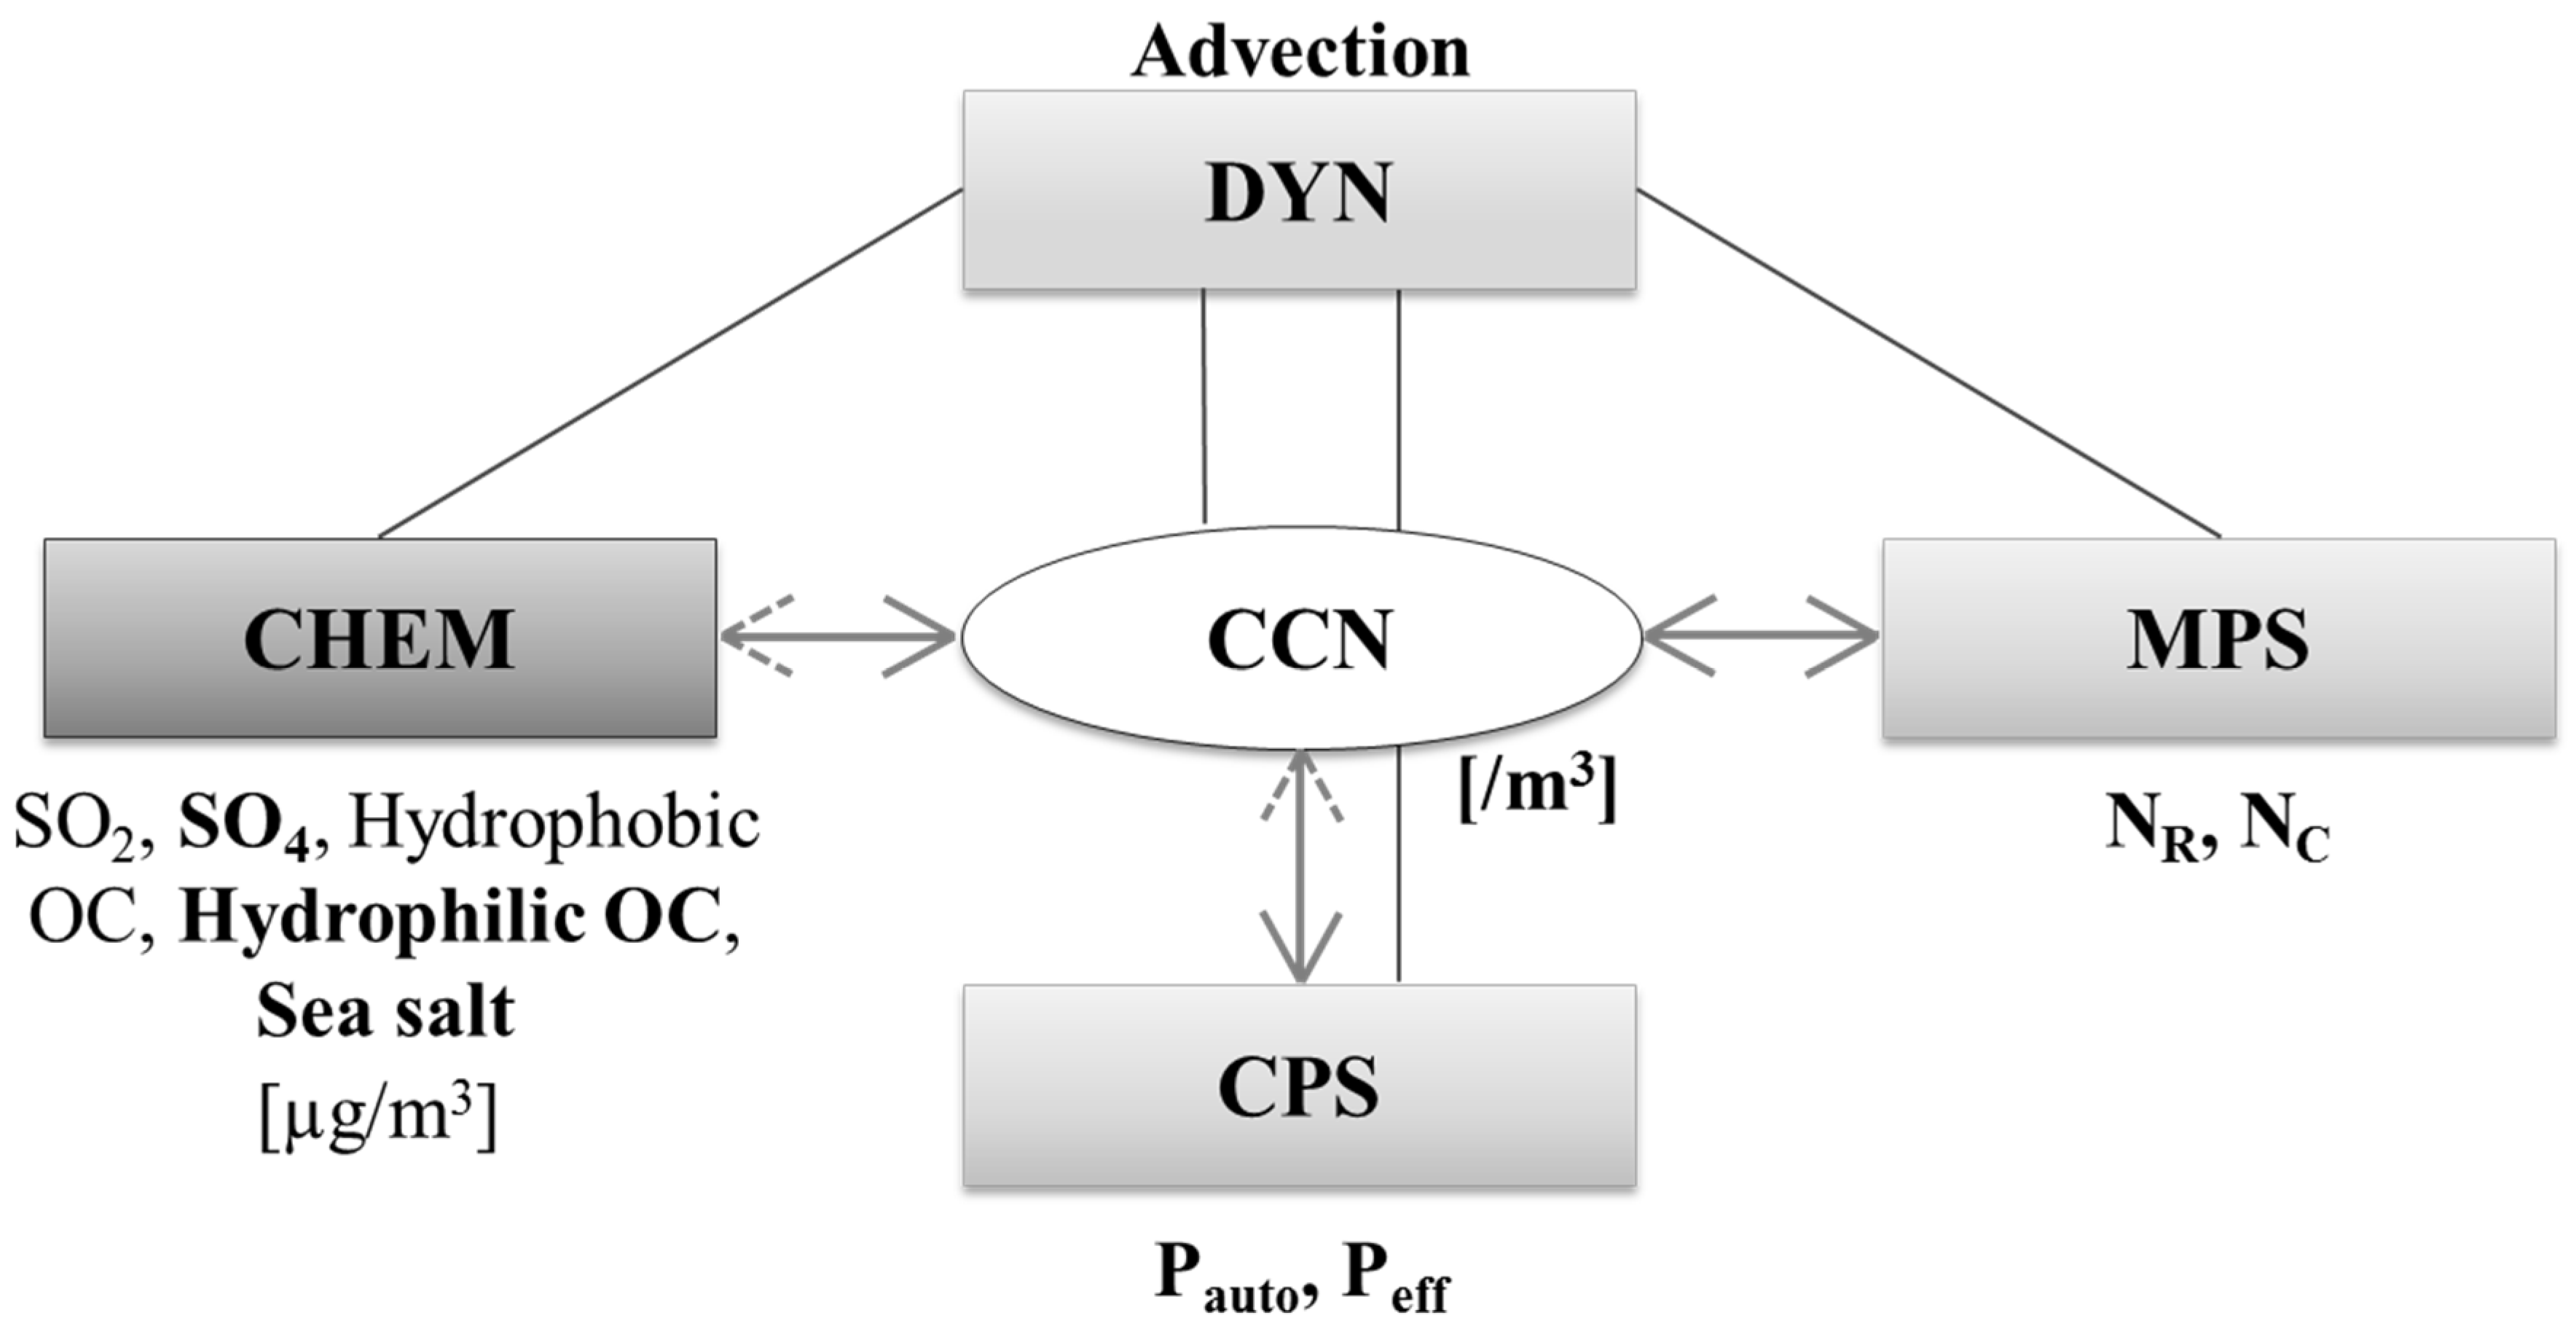
Figure 1. Relationship of the simplified chemistry package to the microphysics scheme (MPS) and the cumulus parameterization scheme (CPS). The soluble species that serve as cloud condensation nuclei (CCN) from the chemistry package are in bold. NR and NC indicate the number of rain and cloud droplets, respectively, and Pauto and Peff are factors for autoconversion and precipitation efficiency.
Atmosphere 10 00392 g001
Figure 2. Horizontal distributions of (a) SO2, (b) SO4, (c) hydrophobic organic carbon (OC), (d) hydrophilic OC, and (e) sea salt averaged from 700 to 950 hPa which are drawn from the (first panel) GRIMs-simulated results, (second panel) CMAS reanalysis, and (third panel) their differences (GRIMs-CMAS). The values are in g k−1 and scaled by 1e−6.
Atmosphere 10 00392 g002
Figure 3. Comparison of (a) number concentration of CCN, (b) number concentration of cloud droplets, and (c) mixing ratio of cloud water averaged from 700 to 950 hPa between the (left panel) CTL and (right panel) EXP simulations.
Atmosphere 10 00392 g003
Figure 4. Horizontal distributions of (a,b) precipitations for the CTL run and (c,d) differences in precipitations (EXP minus CTL). The left (right) panel is for convective (non-convective) rain. Values are in mm day−1 and global averaged values are also shown at the bottom of each plot. The three selected regions for investigating the non-convective precipitation change for EXP are plotted in Figure 4d.
Atmosphere 10 00392 g004
Figure 5. Vertical profiles of hydrometeors averaged for Regions (a) 1, (c) 2, and (e) 3 for the CTL run and the differences in hydrometeor concentrations (EXP minus CTL) for Regions (b) 1, (d) 2, and (f) 3.
Atmosphere 10 00392 g005
Figure 6. Vertical profiles of rain waters formed or eliminated via the total processes (first panel) and each source/sink process of MPS in CTL (second panel) and EXP (third panel) at one point at a specific time step for regions (ac) 1, (df) 2, and (gi) 3. The symbols for each process are described in Table A1.
Atmosphere 10 00392 g006
Figure 7. Comparison of (upper) bias scores and (lower) ETS against TRMM) Multi-Satellite Precipitation Analysis (TMPA) for the (left panel) Asia region, (center) tropics, and (right panel) global in CTL and EXP runs. Scores are shown as black bars for CTL and gray bars for EXP.
Atmosphere 10 00392 g007
Table 1. Source and sink terms for the five species considered.
SpeciesSourceSink
SO2EmissionSO2 + OH → SO4
SO2 + H2O2(aq) → SO4
Dry/Wet deposition
SO4SO2 + OH → SO4
SO2 + H2O2(aq) → SO4
Dry/Wet deposition
Hydrophobic OCEmissionOChydrophobic → OChydrophilic
Dry deposition
Hydrophilic OCOChydrophobic → OChydrophilicDry/Wet deposition
Sea saltEmissionDry/Wet deposition
Settling
Table 2. Domain-averaged downward radiation flux at the surface and precipitation amounts for CTL and EXP. 1 Shortwave radiation flux. 2 Longwave radiation flux.
CasesSWsfc (W m−2) 1LWsfc (W m−2) 2Non-Convective Precipitation (mm day−1)Convective Precipitation (mm day−1)Total Precipitation (mm day−1)
CTL199.8342.30.6632.3443.007
EXP183.5345.40.6742.3483.022
EXP-CTL-16.33.10.0110.0040.015