Article

Characterization and Spatial Coverage of Heat Waves in Subtropical Brazil

by
Nicolle Cordero Simões dos Reis
*,
Nathalie Tissot Boiaski
and
Simone Erotildes Teleginski Ferraz
Department of Physics, Federal University of Santa Maria, Santa Maria 97105900, Brazil
*
Author to whom correspondence should be addressed.
Atmosphere 2019, 10(5), 284; https://doi.org/10.3390/atmos10050284
Submission received: 25 March 2019 / Revised: 14 May 2019 / Accepted: 18 May 2019 / Published: 21 May 2019
(This article belongs to the Special Issue Weather and Climate Extremes: Current Developments)

Abstract

:
Given the increase in the frequency, intensity, and persistence of heat waves since the 1970s, and in view of the impacts that extreme temperatures may cause for society and the economy, this study aims to characterize heat waves in the subtropical region of Brazil and compare findings with the criterion defined by the World Meteorological Organization (WMO). Daily maximum temperature data was used. By using the percentile methodology, the subtropical region was divided into two regions: region 1 and region 2. We identified 54 heat waves in region 1 and 34 in region 2, which occurred more frequently in winter and spring, and less frequently in summer. A close relationship was observed between the Pacific Decadal Oscillation (PDO) and El Niño–Southern Oscillation (ENSO), both of which are able to modulate the heat waves in each of the different regions. Region 1 presented the highest number of heat waves during the warm (cold) phase of the PDO. As for ENSO, heat waves were more frequent in the neutral phase in both regions. Finally, there was shown to be an increase in the frequency and persistence of heat waves since the 1980s, especially in region 2. The methodology used in this study allows the identification and characterization of heat waves in several regions of different climates.

1. Introduction

Given the increasing number of extreme weather events in recent years, the debate over climate change has intensified in the scientific community. Since the 1970s, each decade has been warmer than the previous one, and recently the World Meteorological Organization (WMO) [1] reported that the 21st century has been the warmest recorded yet. The increase in global mean temperature is only one of the consequences of human activity, which causes an increase in greenhouse gas emissions [2] and consequently increases the risk of extreme events, such as heavy rains, heat waves and hurricanes [3]. In addition to the increase in the concentration of greenhouse gases, some studies also suggest that teleconnection patterns, such as El Niño–Southern Oscillation (ENSO) and Pacific Decadal Oscillation (PDO), influence warming and can often be associated with the formation of heat waves [4,5,6] because they may induce different atmospheric circulation responses in both hemispheres. Thus, a certain phase of these phenomena may influence the development of heat waves.
Since there is still no universal definition for determining heat waves, they are broadly defined as events in which the air temperature goes above a given threshold for more than 24 h and may persist for a few days, causing discomfort for most of the population [7]. If these positive temperature anomalies persist for longer periods than the synoptic scale, it is characterized as an extreme event [8,9]. The WMO uses the Heat Wave Duration Index (HWDI) to determine the occurrence of the phenomenon. It characterizes a heat wave as a sequence of more than five days in which the maximum daily temperature is at least 5 °C above the climatological average. However, this index is contested by some authors, who claim that HWDI has limited usefulness in regions with small annual temperature distribution, as in the tropics [10,11,12,13]. This index characterizes the phenomenon based on two arbitrarily defined constants, which makes it difficult to characterize and compare the heat waves between regions with different climates [13].
During the last decade, a considerable amount of severe heat waves occurred in several regions of the globe [14]. The impacts of a heat wave vary depending on the affected sites and on the intensity and persistence of the event. Among them are the thermal discomfort generated for the population, mortality due to hyperthermia, problems in water and energy supply in urban centers, as well as damage to plants. This damage decreases agricultural productivity, causes more frequent droughts and, consequently, increases the risk of fires. The intensity of impacts caused by high temperatures varies according to the amount of heat accumulated during the event and the capacity of each site to adapt and mitigate these impacts.
Despite the ongoing debate on extreme positive temperatures, some authors suggest that the global mean temperature increased more slowly between 1999 and 2013 [15,16,17,18]. This period of deceleration was defined by these authors as a “hiatus” in global warming. However, even with this drop in heating rate, several studies show an increase in frequency, intensity and persistence of extreme positive temperatures around the globe [14,19,20]. Regional scale analysis about heat waves also indicate an increased frequency and magnitude of events in the last decades in regions such as Africa, [21], Central Europe [22], China [23], India [24] and Australia [14,25]. In addition, modelling studies have projected global increases in heat waves over the course of the 21st century [26].
In South America, the mean maximum temperature has increased 1 °C per decade, concomitantly with an increase in the intensity and frequency of heat waves in the last decades [27]. In Brazil, an increase in the intensity and frequency of heat waves has also been observed [28,29]. However, there are still few studies on the phenomenon in Brazil. Knowing that the subtropical region is more populous and has the largest agricultural and livestock based economy in the country, it is important to study the behavior of this type of phenomenon, so that weather and climate prediction models can be improved. In this study, we examined the characteristics of atmospheric heat waves in South America as well as their relationship with ENSO and PDO. We also considered two different metrics commonly used by the heat wave community and discuss their limitations.

2. Data and Methodology

2.1. Data and Region of Study

This study used daily maximum temperature (Tmax) data in degrees Celsius (°C) from 1980 to 2013. These data have a grid with spatial resolution of 0.25° × 0.25° and were obtained from Xavier et al. [30]. Initially, a preliminary analysis was performed to verify the behavior of temperature anomalies throughout Brazil. For this, the daily anomalies of Tmax were calculated in two ways, both removing the average annual cycle for each grid point and considering the mean Tmax of February 28th and 29th in each leap year:
(i) Based on the HWDI, only the Tmax anomalies higher than 5 °C were considered, then a composition of these anomalies was calculated for each grid point. The average behavior of the anomalies presented in Figure 1 makes clear one of the problems of defining an arbitrary minimum value for the Tmax anomalies.
Brazil, for example, is a country with a large territorial extension and presents different climatic regimes, thus in the case of a pre-defined threshold of 5 °C, the regions closer to the line of the equator do not display good feedback, since their seasonal thermal amplitude, from 1 °C to 2 °C, is very small [31]. Then, with this method, it would only be possible to analyze the heat waves in the subtropics, which have well-defined seasons and greater annual thermal amplitude.
(ii) To better characterize the extreme temperatures, the 90% percentile (P90) was calculated for each day of the year and for each grid point; thus, only anomaly values above this threshold were considered. As in the previous item, a composition for the Tmax anomalies was calculated for each grid point.
In Figure 2, each region shows Tmax anomalies according to its climatic characteristics. Regions near the equator, which are warm year-round and have lower temperature variability [31], present the lowest values of the P90 threshold. On the other hand, the subtropical regions, where there is greater temperature variability throughout the year [32,33] and are more influenced by the passage of synoptic systems [28], such as cyclones, anticyclones and cold fronts, have the greatest anomalies. Therefore, this second method may represent in more detail the characteristics of the heat waves in each region.
The subtropical region of Brazil is subdivided into two other regions with very similar behaviors, enabling the visualization of the spatial extent of the phenomenon, in other words, the horizontal extension of Tmax anomalies, as observed in Figure 2. Hereafter, these two regions will be referred to as region 1 (34° S to 24.7° S and 57.7° W to 48° W) and region 2 (24.7° S to 20.2° S and 58.3° W to 40.5° W). On average, these two regions presented the most extreme daily anomalies of Tmax—above 3.5 °C—in relation to the other regions of the country.

2.2. Definition of Heat Waves in Regions 1 and 2

To optimize the analyses, the spatial means of daily anomalies of Tmax from 1980 to 2013 for regions 1 and 2 were calculated, reducing the data set into two different time series. Then, the P90 value of each time series was calculated and, from this threshold, the heat waves were defined. The distribution of Tmax anomalies in the two studied regions and the P90 threshold (blue line), which corresponds to approximately 4.1 °C in region 1 and 3.1 °C in region 2, are depicted in Figure 3a,b. To characterize the intensity of the heat waves, the cumulative Tmax anomalies above P90 (cumulative Tmax) were used, that is, the sum of the Tmax anomalies during each heat wave.
Some indices that define heat waves through the P90 threshold of temperature already exist in the literature, such as the Warm Spell Duration Index (WSDI) [11]. However an arbitrary value of persistence is still used. In this study, the persistence of the events was defined as the number of consecutive days when Tmax anomalies remained above P90 (Figure 4). Persistence varied from 1 to 13 days in region 1 and from 1 to 15 days in region 2. Nonetheless, in order to account only for events with more extreme and more persistent anomalies, the P90 of persistence was calculated, which corresponded to 4 days in region 1 and 6 days in region 2. Therefore, a heat wave is defined here as when the Tmax anomalies remain above their respective P90 for a period of days greater than the persistence P90. Through this methodology, it was possible to identify the number of heat waves during the 34 years of data for each study region. The seasonal, interannual and interdecadal variability of the phenomenon was also determined in order to verify at which period of the year they are more frequent and how their statistical characteristics (frequency, intensity and persistence) have behaved over the years.
The ENSO and PDO explain the largest portion of interannual to decadal variability of sea surface temperature (SST) in the equatorial Pacific region, respectively. This variability plays a significant role in the thermal regime on a global scale [34,35]. In El Niño (La Niña) years, for example, there is an increase in the frequency of severe heat events over southern South America [4]. Thus, this study also observed the role of ENSO and PDO on the frequency, magnitude and persistence of heat waves in each study region.
For each heat wave, it was verified in which phase ENSO was in the month of the event occurred (Appendix A). The ENSO signal was obtained from the website: http://ggweather.com/enso/oni.htm, which is based on the Oceanic Niño Index (ONI). The PDO phases were obtained through the PDO index of the National Centers for Environmental Information (NCEI), from the link: https://www.ncdc.noaa.gov/teleconnections/pdo/. Then, the statistical test of the difference between two proportions by Spiegel and Stephens [36] was applied from the number of heat waves in each of the phases of the ENSO (PDO) to verify if the differences in the occurrence of heat waves between the phases were statistically significant at the 90% level. In addition, Pearson’s correlation coefficients were calculated to analyze if there was a relationship between the ENSO (PDO) phases and the intensity and persistence of the heat waves.

3. Results and Discussion

From the calculation of P90 of daily Tmax anomalies and persistence, 54 heat waves were identified in region 1 and 34 in region 2 from 1980 to 2013 (see Table 1). The seasonal behavior of these heat waves is shown in Figure 5. The month that presented the highest number of heat waves in region 1 was July, while in region 2 the highest frequency was in September. Seasonally, the total number of events in region 1 was higher in the winter months in the southern hemisphere, almost 60% of the heat waves occurred in winter (Figure 5a and Table 1).
In region 2 (Figure 5b and Table 1), heat waves were more frequent in spring and winter (approximately 40% in each season). Overall, summer was the season with the least heat waves (only 2% in region 1 and 6% in region 2). Some authors have already shown that heat waves outside summer are becoming more frequent in both hemispheres [11,14]. A possible reason for this increase in heat waves during the cold season is the warming reported during the winter months in southern Brazil [37].
These results are in agreement with other authors [29,34], who also found a higher frequency of heat waves in winter in studies on certain regions of Brazil. They stated that this seasonal dependence is due to the atmosphere being more unstable and subject to temperature changes during this time of year. In addition, Damião [38] and Oliveira [39] stated that atmospheric blocks in the South Pacific, a phenomenon that has been attributed to the development of heat waves [5], are more frequent and persistent during winter and less frequent in the summer.
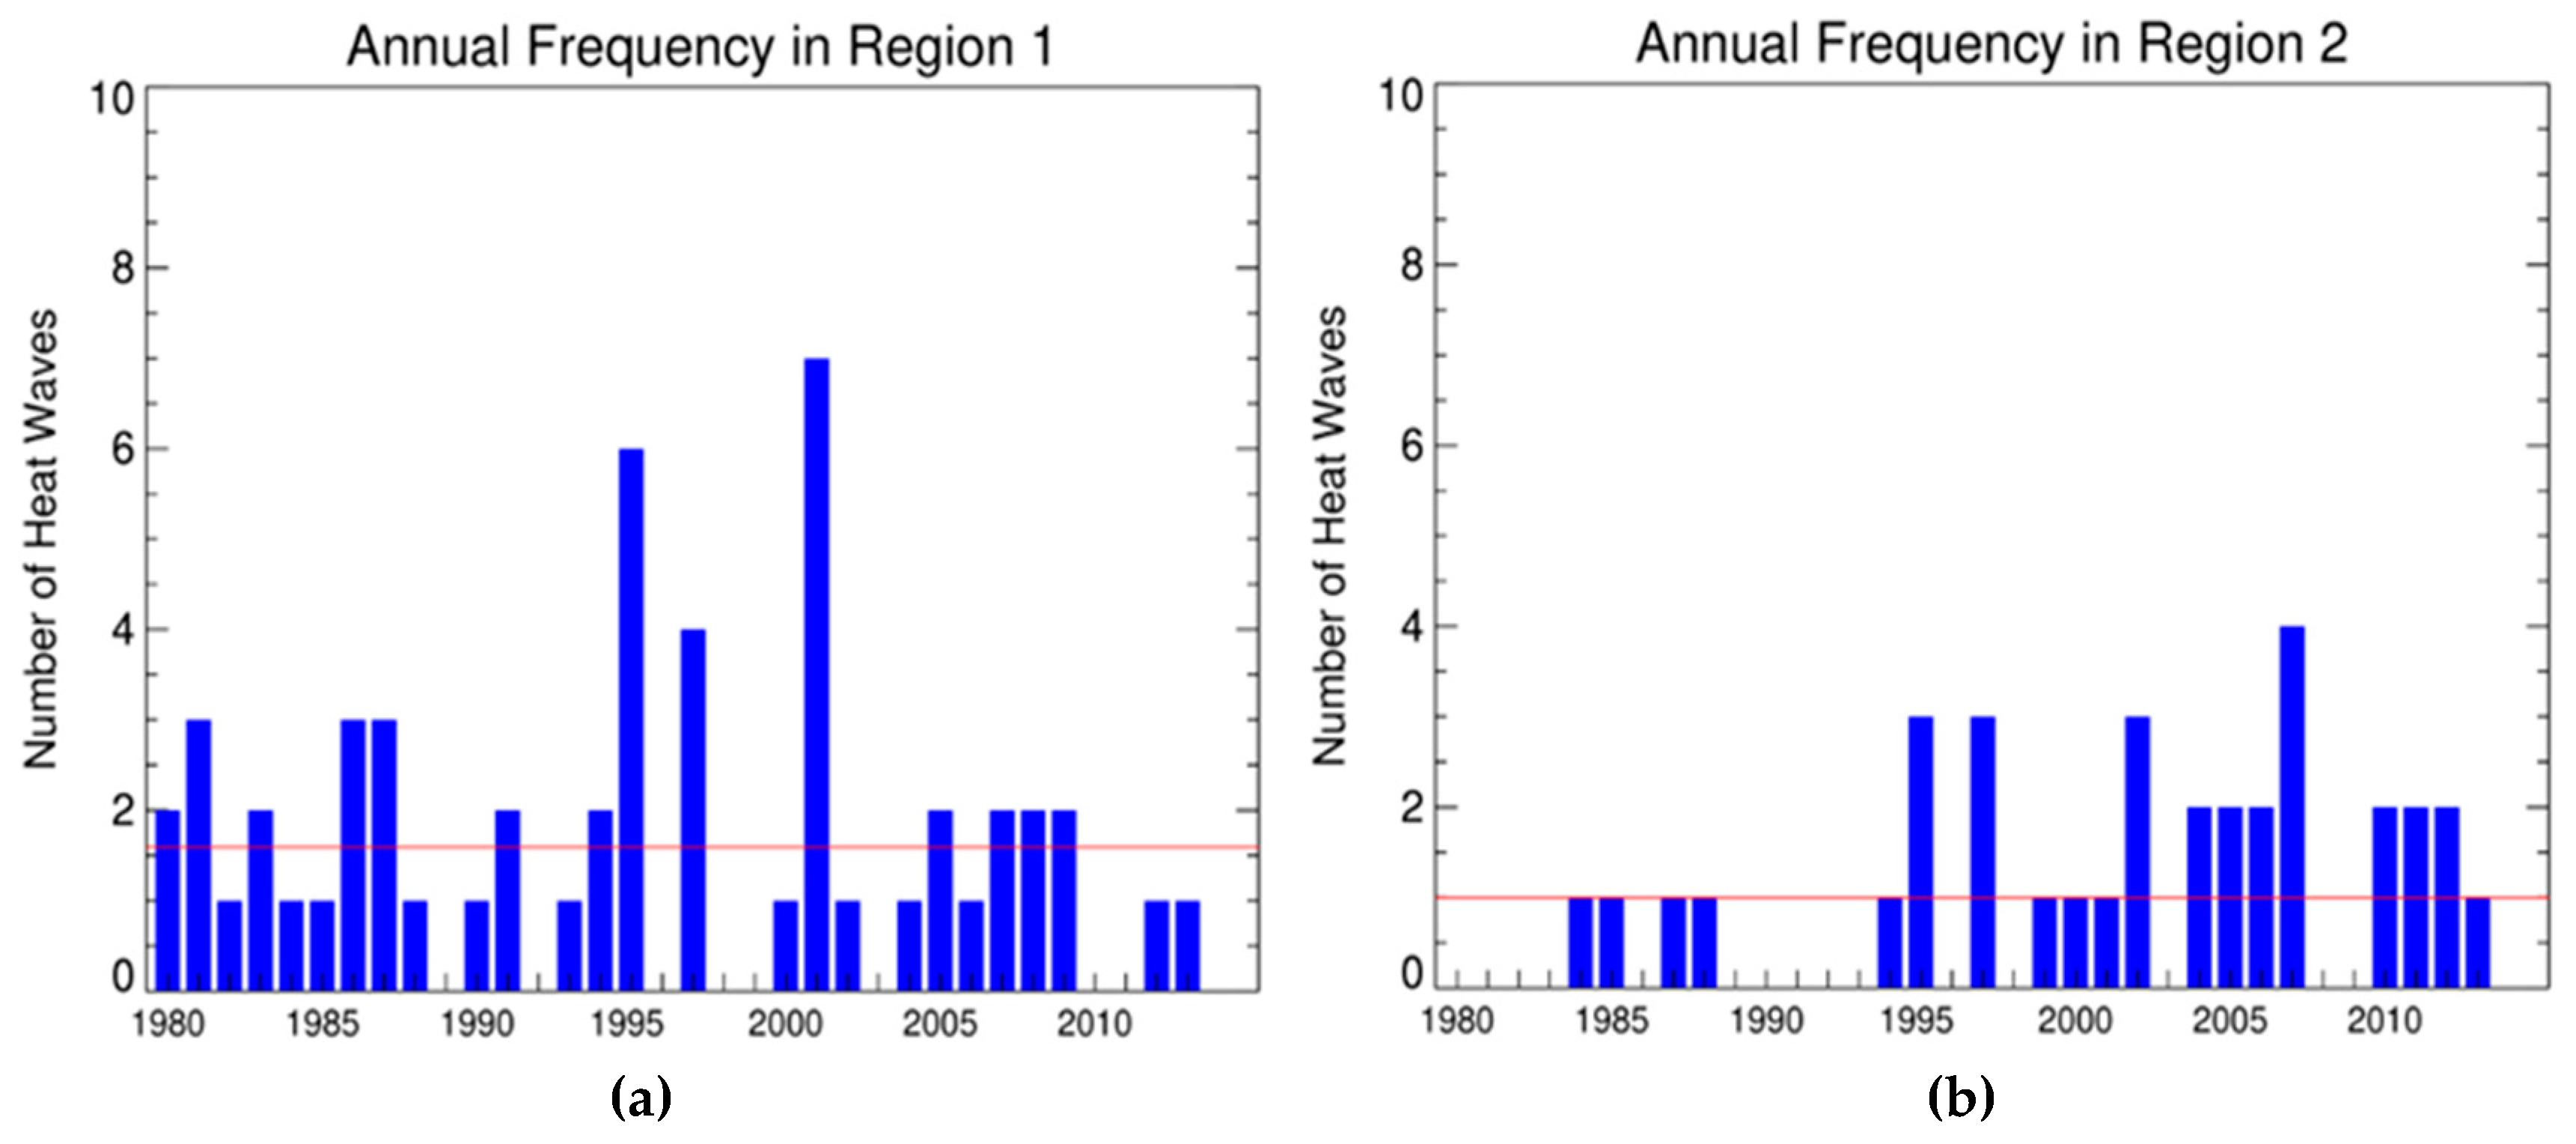
The number of heat waves in each year of the analysisis presented in Figure 6. On average, region 1 had a higher frequency of heat waves (about 1.6 events/year) than region 2 (1 event/year). In region 1, the heat waves presented a more regular frequency since the 80s and 90s, both with 16 events (Figure 6a and Table 2), followed by the year 2000, in which 18 events were recorded. However, the differences in frequency between the decades in this region were not statistically significant. In region 2 (Figure 6b and Table 2), the increase in frequency of occurrence from the 1980s (4 events) to the 1990s (9 events) and 2000 (16 events) was much more evident—about 47% of the total events occurred in the last decade analyzed. In this region, there were significant statistical changes at the 90% level from the 1980s to the 2000s.
A similar feature of the increasing frequency of extreme temperatures in Brazil since 1980 was found by Bitencourt et al. [28] and Geirin has [29]. In addition, the result can be compared to other regions of the Southern Hemisphere, such as Australia, and regions of the Northern Hemisphere, such as Europe (including the 2003 mega-heat wave that caused thousands of deaths), Canada, the United States, China and India, which also reported an increase in the frequency and magnitude of heat waves [14,22,23,24,25].
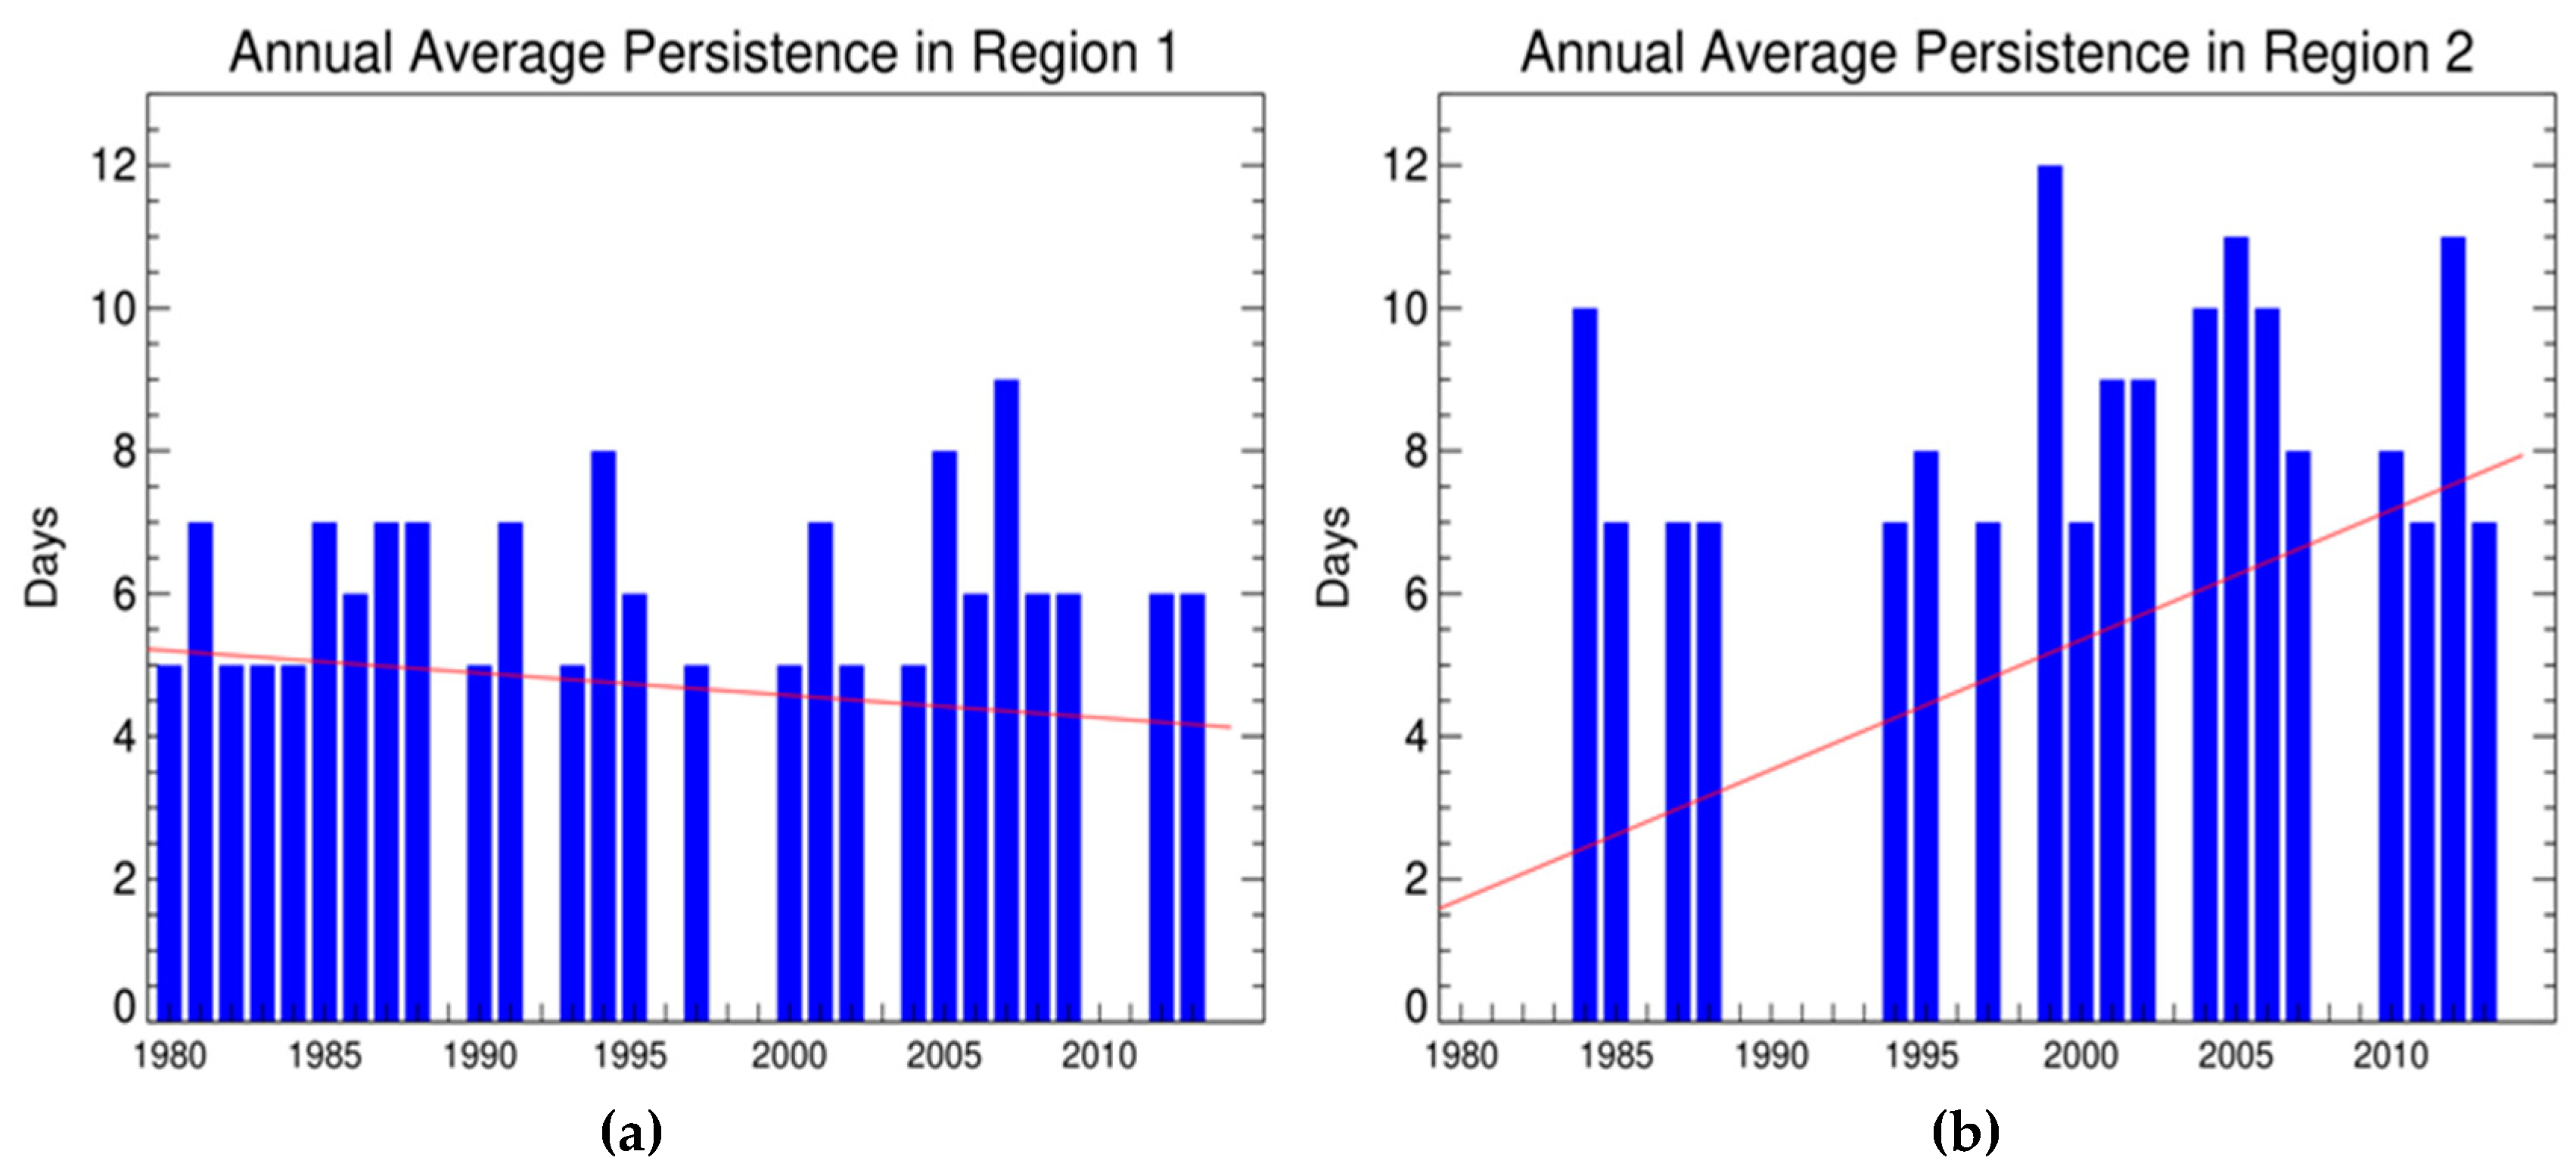
The annual average of the intensity of the heat waves (cumulative Tmax) was slightly higher in region 1 (Figure 7a), about 41.9 °C/event, than in region 2 (around 40.4 °C/event, Figure 7b). On the other hand, it could be observed that region 2 presented more persistent events, about 8.8 days/event, than region 1, which presented a mean persistence of 6.6 days/event (Figure 8). This characteristic corresponds to what has already been observed in the distribution of the Tmax anomalies and persistence in the box plot analysis (Figure 3 and Figure 4).
As for the frequency, a different behavior can be observed between the two regions in both the intensity of the events and the persistence. The trend detection has been performed to estimate the significance of temporal changes in the annual average of intensity and persistence. Through the trend analysis, it was found that in region 1 the intensity of heat waves decreased over the years (Figure 7a), but this trend was not significant by the statistical Student’s t-test. Meanwhile, region 2 showed a significant increase at a 95% level in the Student’s t-test in the intensity of the events (Figure 7b). The duration of the events presented the same pattern: in region 1 the events were less persistent (not significant) over the years (Figure 8a), whereas in region 2 the heat waves became significantly more durable at the 95% level (Figure 8b). The behavior of these characteristics can also be observed in Table 2.
Even with the increasing average global temperature and hot extremes, cooling trends at minimum temperature are also prevalent in some areas, with sufficient observational data in the Southern Hemisphere, such as in southern South America, South Africa and parts of Australia—decreasing up to 0.5 °C per decade in the extra tropics [20,27]. Sillmann et al. [20] affirm that short-term regional cooling trends do not undermine the global long-term warming trend; however, given the negative trend observed in the intensity and persistence of heat waves in region 1, it is to be concluded that this result may be related to the cooling trend observed in the extratropics of South America. Nevertheless, further studies are needed to confirm this theory.
From the characteristics of heat waves obtained in this study, the relation of these extremes with climatic patterns of a global scale was analyzed. The PDO, which presents a decadal variability, remained in the warm phase (PDO+) from 1980 to 1998, for most of the analyzed period (19 years), and in the cold phase (PDO-) from 1999 to 2013 (15 years). In region 1, there were 33 heat waves in the warm phase and 21 in the cold phase (Table 3). Inversely, in region 2, there were 11 heat waves in the warm phase and 23 in the cold phase (Table 4).
Through the statistical test of proportions, the differences in frequency of heat waves between the cold and warm phases of PDO were significant at the 90% level for both regions. In addition, it is possible that the PDO phases induce different atmospheric responses in the two regions, leading to these differences in the behavior of the heat waves in each region. On the other hand, the results found for region 2 are analogous to those reported by Bitencourt et al. [28], which confirm that heat waves in Brazil increased during the warm phase of the PDO, but increased even more during the cold phase.
For the intensity and persistence of the heat waves in region1, the average values in each phase were very similar and there were no significant differences between the phases. The correlation coefficients (Table 5) presented very small values, suggesting that the percentage of variation explained by the relationship between heat waves and PDO is very low. In region 2, the difference in intensity and persistence of events in each phase was higher than in region 1: in the cold phase the heat waves were about 8 °C more intense and 1.6daysmore persistent than in the warm phase (Table 4).
Bitencourt et al. [28] also found more intense and persistent heat waves in the cold phase of PDO, which began in 1999.However the correlation coefficients in this study presented small values, and what may justify the more intense and persistent heat waves in the negative phase of the PDO (1999–2013) is the positive trend in these variables over the years in region 2 (Figure 7 and Figure 8).
In addition to the PDO, the relationship between heat waves and ENSO was verified. El Niño and La Niña produce significant changes in atmospheric circulation in the Southern Hemisphere and, consequently, near-surface temperatures, particularly over central and southern South America [4,40]. Saurral et al. [40] showed the correlation patterns of temperature anomalies with ENSO and reported that during La Niña (El Niño) years, warmer (colder) conditions prevail over the subtropical region of Brazil, while colder (warmer) temperatures prevail over the Pacific coasts of South America, and anomalies of the opposite sign are found east of Australia.
Some authors [37,41] have analyzed the behavior of maximum temperatures over the southern region of Brazil since the 1960s and stated that the most intense surface warming and increase in the frequency of extreme events occurred from the 1990s to the 2000s, related to the greater frequency and intensity of El Niño events during the 1990s.
In this study, during the 34 years of the analysis, both regions presented a higher frequency of heat waves in periods of neutrality, followed by years under the influence of El Niño (Table 3 and Table 4). Bitencourt et al. [28] and Firpo et al. [34] also analyzed the influence of ENSO on heat waves in Brazil and found an increase in the frequency of these extreme temperatures during the warm phase of ENSO. Grimm and Togatlian [4] found the same response throughout the subtropical region of South America. In Australia, Perkins et al. [42] found significantly more frequent, intense and longer heat waves during El Niño compared to La Niña.
The preference for the occurrence of heat waves during climate neutrality in this study may be related to the fact that most events identified in this study occurred in winter (region 1) and spring (region 2), while the greatest influence of ENSO occurred during the months of November to February [43]. Through the statistical test of proportions, the differences between the frequency of heat waves in neutral periods versus El Niño and neutral periods versus La Niña were significant for both regions. However, the difference between the events that occurred in periods influenced by El Niño and La Niña in both regions was not significant at the 90% level.
In relation to the intensity and persistence of the heat waves, region 1 presented more intense and persistent heat waves in periods of La Niña (Table 3), opposite to that reported in the literature for Australia [40,42]. In the La Niña phase, the heat waves were on average 5 °C more intense and almost 1 day more persistent than in periods of El Niño. In addition, they were 4 °C more intense than neutral periods, but with the same persistence. This result was consistent with the warming of the subtropical region of Brazil reported by Saurral et al. [40] at this phase, which may influence the accumulated heat and magnitude of heat waves in this region.
For region 2 (Table 4), the heat waves were more intense in the neutral phase, about 4 °C more intense than in the La Niña periods and about 3.5 °C more intense than in the El Niño periods. On average, the events were also more persistent at this stage: they presented practically the same persistence in years of El Niño and La Niña, but in neutral years the heat waves were almost 1.5 days more persistent. These results for region 2 may be related to the higher frequency of heat waves in the neutral phase of ENSO.
As for PDO, correlation coefficients were also calculated to evaluate the relationship between heat wave characteristics and ENSO phases (Table 5). For region 1, the values found were very low, which indicates a low influence of the ENSO phases in the intensity and persistence of the heat waves in this region. For region 2, the variables intensity and persistence presented a negative correlation with El Niño and La Niña, while with the neutral phase, the variables were positively correlated. That is, in the neutral phase, an increase in the intensity and persistence of the heat waves in region 2 occurred (Table 4).
In 1997, when there was one of the most intense El Niño events [44], all heat waves in regions 1 and 2 occurred in the warm phase (Appendix A), even in months of less influence from ENSO. This same pattern was observed in the years when El Niño was classified as strong (1987 and 1991). In 2001, a year that presented the highest number of heat waves (seven) in region 1, all events occurred in periods of neutrality. In region 2, in 2007, under the influence of a strong La Niña, there were a greater number of heat waves (four). However, in the latter case, two heat waves occurred in months where there was no influence from ENSO, and two heat waves occurred in the cold phase.
In a year-by-year observation, the influence of La Niña (12 years) and periods of neutrality (12 years) predominated throughout the study period in relation to El Niño events (10 years). In all El Niño years, heat waves occurred in region 1. In region 1, 8 years of no events were presented (Figure 6a): 4 years of La Niña (1998, 1999, 2010 and 2011) and 4 years of neutrality (1989, 1992, 1996 and 2003). In region 2, no heat waves were observed in 15 years (Figure 6b): 4 years of El Niño (1982, 1986, 1991 and 2009), 3 years of La Niña (1983, 1998 and 2008) and 8 neutral periods (1980, 1981, 1989, 1990, 1992, 1993, 1996 and 2003).
In region 1, the most intense heat wave occurred in 1995 in the ENSO cold phase, with an accumulated temperature of 75.01 °C during the 11-day event (Appendix A), and the most persistent event lasted 13 days in 2001 in the neutral phase. In region 2, the most intense heat wave was also the most persistent, and occurred in 2012 in the neutral period, accumulating a temperature of 61.70 °C (Tmax anomalies) during the 15 days. Despite the weak relationship shown by the correlation coefficients between temperature extremes and global scale climate variability, there was a temporal coherence between heat waves and ENSO (PDO) and these results suggest that both could modulate the heat waves in each of the regions differently. However to explore and confirm this theory, analyses of the atmospheric patterns surrounding the phenomena are needed.

4. Conclusions

Defining extreme temperatures has been a challenge up until the present day and there is a consensus in the scientific community that a fixed temperature anomaly threshold is not the best approach to identify atmospheric heat waves. In Brazil, different aspects of the occurrence of heat waves are still lacking, and since the country has a vast territorial extension and presents different types of climate, it is important that heat waves are not defined from arbitrary temperature and/or persistence thresholds. The percentiles technique is not a pioneering technique; however, indexes such as WSDI use a temperature threshold above P90 but define persistence from an arbitrary number of days. Thus, from the percentile technique used in this study, a new index was proposed for the definition of heat waves, which was not based on arbitrary temperature anomaly or persistence values, such as the HWDI and WSDI. The arbitrarily thresholds make it difficult to characterize and compare heat waves between regions with different climates, such as tropics and extratropics [10,11,12,13], as seen in Figure 1 and Figure 2. With the new index proposed in this study, heat waves may be defined according to the climatic characteristics of each region, allowing researchers to characterize and compare the phenomenon between regions with different climatic characteristics.
Based on the methodology used, it was possible to determine the spatial extent of the phenomenon, which resulted in the subdivision of the subtropical region of Brazil. Thus, 54 heat waves were recorded in region 1, and 34 in region 2. In addition, it was possible to identify the seasonal, interannual and interdecadal variability of the phenomenon and how their frequency, intensity and persistence have behaved over the years. In region 1, heat waves were more regular since the 80s, while in region 2 they became more frequent from the mid-90s.
Region 1, which presented the highest frequency of events during the analyzed period, also presented the most intense heat waves on average compared with region 2. On the other hand, region 2 presented more persistent events. Through the trend analysis, it was found that in region 1 the intensity and persistence of heat waves decreased over the years, while region 2 presented an increase in the intensity and persistence of the events. According to some authors [20,27], cooling trends at minimum temperature have been observed in southern South America, thus the negative trend found in this study could be related to this cooling trend.
With regard to the seasonality of events, in region 1, heat waves were more frequent in the winter (60% of events occur this season) and in region 2 they are more frequent in winter and spring (40% in each season). In both regions, the season that presented the least heat waves was summer, which was also verified by Geirinhas [28] and by Firpo et al. [34]. This result could be associated with the fact that warm periods outside summer are more significantly frequent around the globe [14]. In addition, atmospheric block phenomena, which has been attributed to the development of heat waves [5], also occur more frequently in winter and spring [38,39].
The relationship between the statistical characteristics of heat waves in the two regions and the ENSO and PDO phases was also analyzed. The two regions presented different behaviors regarding climate variability. Region 1 presented a higher frequency of heat waves during the warm phase of the PDO, while in region 2, the heat waves were more frequent during the cold phase. The higher frequency of heat waves in the warm phase of PDO in region 1 may have occurred because the period is longer during this phase. On the other hand, in region 2, heat waves became more frequent from the 2000s, which confirms that heat waves in Brazil increased during the warm phase of the PDO, but increased even more during the cold phase [28]. In region 1, the intensity and persistence of heat waves did not change significantly between the two phases of the PDO, but in region 2, the events were clearly more intense and persistent in the cold phase.
Regarding the relationship with the ENSO phases, most of the heat waves in regions 1 and 2 occurred in periods of neutrality, since heat waves are more frequent in months when the ENSO signal is weaker. Region 1 presented more intense and persistent heat waves in periods of La Niña, while in region 2, the events were more intense and persistent in the neutral phase. Generally, the linear trend analyses of sporadic events do not give significant results on traditional seasonal and regional scales [10]. Thus, despite the weak relationship shown by the correlation coefficients between temperature extremes and ENSO (PDO), these results suggest that there is a close relationship between the phenomena. However, further studies are necessary to investigate the dynamic and thermodynamic aspects of heat waves in Brazil to provide more information about this relationship.
In general, the results obtained here show that the subtropical region of Brazil has been affected by increasingly frequent and persistent heat waves, especially in region 2. This result is in agreement with the studies of Bitencourt et al. [28] and Geirinhas [29], who reported an increase in the frequency of heat waves throughout Brazil, even during the period known as the global warming “hiatus”. Thus, in view of the extreme temperature impacts in a densely populated area such as this, it is important for further studies to be done on heat wave advance, seeking to better understand the dynamic aspects of the phenomenon, to enable predictability and to contribute to the minimization of its impacts.

Author Contributions

Conceptualization, N.C.S.d.R., N.T.B. and S.E.T.F.; formal analysis, N.C.S.d.R.; methodology, N.C.S.d.R. and N.T.B.; project administration, N.T.B. and S.E.T.F.; software, N.C.S.d.R. and N.T.B.; supervision, N.T.B. and S.E.T.F.; writing—original draft, N.C.S.d.R.; writing—review and editing, N.T.B. and S.E.T.F.

Funding

This research received no external funding.

Acknowledgements

We would like to thank CAPES for granting fellowship, the P&D ANEEL project, developed in partnership between UTE Pecém II, UTE Parnaíba I, Parnaíba II and III Geração de Energia S.A. and the Federal University of Santa Maria-UFSM. N.T.Boiaski would like to thank FAPERGS for the assistance at 17/2551-0000821-9. S.E.T.Ferraz would like to thank Cnpq and Fapergs (projects 304970/2015-8 and 24796.414.28046.06062017-PqG). We are also thankful to Daniel PiresBitencourt (Fundacentro-CESC) for his important collaboration.

Conflicts of Interest

The authors declare no conflict of interest.

Appendix A

Table A1. Heat waves’ initial day in region 1, intensity (cumulative Tmax anomalies) of each heat wave, its persistence and index values of ENSO.
Initial DayIntensity (°C)Persistence (Days)ENSO Index
10/03/8035.81060.3
21/01/8031.66050.4
05/05/8154.3509−0.3
12/07/8132.7005−0.3
29/07/8151.2309−0.3
13/09/8230.42051.6
18/06/8329.74050.7
25/08/8328.3405−0.1
25/10/8429.8805−0.6
11/11/8541.7607−0.3
02/08/8657.36100.4
11/09/8632.71050.7
03/10/8630.92050.9
10/07/8757.57091.5
23/07/8746.17071.5
10/08/8745.81071.7
21/03/8841.60070.1
04/10/9030.17050.3
26/05/9154.02090.5
26/07/9130.31050.7
19/07/9335.47050.3
15/07/9453.57080.4
18/09/9446.40080.6
11/07/9531.6205−0.2
24/07/9530.7405−0.2
22/08/9575.0111−0.5
05/09/9535.2506−0.8
04/11/9545.9506−1.0
16/12/9554.3106−1.0
09/07/9737.63051.6
27/07/9736.66051.6
14/08/9742.68061.9
27/08/9742.66061.9
20/08/0034.5605−0.5
01/03/0127.3205−1.1
28/05/0171.5213−0.3
11/06/0132.7106−0.1
07/07/0129.8505−0.1
16/07/0131.1105−0.1
30/07/0147.7908−0.1
10/08/0156.6210−0.1
11/05/0234.65050.4
04/09/0429.89050.7
01/06/0554.56080.1
29/07/0560.1609−0.1
18/07/0634.16060.1
17/04/0740.3307−0.2
03/09/0766.9412−1.1
18/05/0844.4206−0.8
13/07/0844.6906−0.4
28/08/0938.34050.5
30/10/0950.24071.0
27/06/1236.55060.1
09/09/1337.9606−0.3
Table A2. Heat waves’ initial day in region 2, intensity (cumulative Tmax anomalies) of each heat wave, its persistence and index values of ENSO.
Initial DayIntensity (°C)Persistence (Days)ENSO Index
19/05/8447.1610−0.5
12/11/8529.9607−0.3
12/07/8730.32071.5
21/09/8831.0107−1.2
20/09/9434.71070.6
24/07/9546.6111−0.2
08/08/9535.0408−0.5
27/08/9528.8507−0.5
04/09/9743.90072.1
09/10/9728.62072.3
22/12/9727.68072.4
28/08/9951.7512−1.1
17/10/0033.6307−0.6
29/05/0143.0609−0.3
15/04/0234.23070.2
03/06/0237.87090.7
05/10/0252.31121.2
01/09/0454.49100.7
19/09/0450.75100.7
06/04/0558.17120.4
11/05/0548.39100.3
21/07/0633.17080.1
05/08/0648.89120.3
26/03/0744.28100.0
07/06/0744.4409−0.4
02/09/0744.1008−1.1
05/10/0746.7108−1.4
02/02/1031.19071.3
21/08/1043.4210−1.4
10/07/1142.6008−0.5
12/08/1128.9507−0.7
05/09/1261.70150.3
25/10/1231.36070.2
31/07/1327.0807−0.4

References

  1. World Meteorological Organization (WMO). NASA, NOAA Data Show 2016 Warmest Year on RecordGlobally. Available online: https://www.nasa.gov/press-release/nasa-noaa-data-show-2016-warmest-year-on-record-globally (accessed on 23 January 2019).
  2. Trenberth, K.E.; Fasullo, J.T.; Kiehl, J. Earth’s global energy budget. Bull. Am. Meteorol. Soc. 2009, 90, 311–323. [Google Scholar] [CrossRef]
  3. Intergovernmental Panel on Climate Change (IPCC). Climate Change 2014: Impacts, Adaptation, and Vulnerability; Cambridge University Press: Cambridge, UK; New York, NY, USA, 2014. [Google Scholar]
  4. Grimm, A.M.; Togatlian, I.M. Relação Entre Eventos El Niño/La Niña e Frequência de Ocorrência de Extremos Frios e Quentes de Temperatura no Cone Sul Da América do Sul. Available online: http://www.repositorio.ufal.br/bitstream/riufal/2119/1/Rela%C3%A7%C3%A3o%20entre%20oscila%C3%A7%C3%A3o%20decadal%20do%20pac%C3%ADfico%2C%20el%20ni%C3%B1o-oscila%C3%A7%C3%A3o%20sul%20e%20a%20circula%C3%A7%C3%A3o%20atmosf%C3%A9rica%20de%20ver%C3%A3o%20na%20Am%C3%A9rica%20do%20Sul.pdf (accessed on 10 May 2019).
  5. Pezza, A.B.; Van Rensch, P.; Cai, W. Severe heat waves in Southern Australia: synoptic climatology and large scale connections. Clim. Dyn. 2012, 38, 209–224. [Google Scholar] [CrossRef]
  6. Rusticucci, M. Observed and simulated variability of extreme temperature events over South America. Atmos. Res. 2012, 106, 1–17. [Google Scholar] [CrossRef]
  7. Robinson, P.J. On the definition of a heat wave. J. Appl Meteor. 2001, 40, 762–775. [Google Scholar] [CrossRef]
  8. Rusticucci, M.; Vargas, W. Synoptic situations related to spells of extremes temperatures over Argentina. Meteorol. Appl. 1995, 2, 291–300. [Google Scholar] [CrossRef]
  9. Norte, F.; Simonelli, S.C.; Seluchi, M.; Viale, M. The heat waves in the center of Argentina. Preprints sixth international conference on Southern Hemisphere meteorology and oceanography. Am. Meteor. Soc. Chile 2000, 198–199. [Google Scholar]
  10. Frich, P.; Alexander, L.V.; Della-Marta, P.; Gleason, B.; Haylock, M.; Klein Tank, A.M.G.; Peterson, T. Observed coherent changes in climatic extremes during the second half of the twentieth century. Clim. Res. 2002, 19, 193–212. [Google Scholar] [CrossRef] [Green Version]
  11. Alexander, L.V.; Zhang, X.; Peterson, T.C.; Caesar, J.; Klein Tank, A.M.G.; Haylock, M.; Collins, D.; Trewin, B.; Rahimzadeh, F.; Tagipour, A.; et al. Global observed changes in daily climate extremes of temperature and precipitation. J. Geophys. Res. 2006, 111, D05109. [Google Scholar] [CrossRef]
  12. Perkins, S.E. Biases and Model Agreement in Projections of Climate Extremes over the Tropical Pacific. Earth Interact. 2011, 15, 1–36. [Google Scholar] [CrossRef]
  13. Radinović, D.; Ćurić, M. Criteria for heat and cold wave duration indexes. Theor. Appl. Climatol. 2012, 107, 505–510. [Google Scholar] [CrossRef]
  14. Perkins, S.E.; Alexander, L.V.; Nairn, J.R. Increasing frequency, intensity and duration of observed global heatwaves and warm spells. Geophys. Res. Lett. 2012, 39. [Google Scholar] [CrossRef]
  15. Lewandowsky, S.; Risbey, J.S.; Oreskes, N. On the definition and identifiability of the alleged “hiatus” in global warming. Sci. Rep. 2015, 5, 1–13. [Google Scholar] [CrossRef]
  16. Kosaka, Y.; Xie, S.-P. Recent global-warming hiatus tied to equatorial Pacific surface cooling. Nature 2013, 501, 403–407. [Google Scholar] [CrossRef] [Green Version]
  17. Meehl, G.A.; Arblaster, J.M.; Fasullo, J.Y.; Hu, A.; Trenberth, K.E. Model-based evidence of deep-ocean heat uptake during surface-temperature hiatus periods. Nat. Clim. Chang. 2011, 1, 360–364. [Google Scholar] [CrossRef]
  18. Trenberth, K.E.; Fasullo, J.T. An apparent hiatus in global warming? Earth’s Future 2013, 1, 19–32. [Google Scholar] [CrossRef]
  19. Seneviratne, S.I. No pause in the increase of hot temperature extremes. Nat. Clim. Chang. 2014, 4, 161–163. [Google Scholar] [CrossRef]
  20. Sillmann, J.; Donat, M.G.; Fyfe, J.C.; Zwiers, F.W. Observed and simulated temperature extremes during the recent warming hiatus. Environ. Res. Lett. 2014, 9, 064023. [Google Scholar] [CrossRef]
  21. Ceccherini, G.; Russo, S.; Ameztoy, I.; Marchese, A.F.; Carmona-Moreno, C. Heat waves in Africa1981–2015, observations and reanalysis. Nat. Hazards Earth Syst. Sci. 2017, 17, 115–125. [Google Scholar] [CrossRef]
  22. Tomczyk, A.M.; Bednorz, E. Heat waves in Central Europe and tropospheric anomalies of temperature and geopotential heights. Int. J. Climatol. 2019, 1–17. [Google Scholar] [CrossRef]
  23. Chen, Y.; Hu, Q.; Yang, Y.; Qian, W. Anomaly based analysis of extreme heat waves in Eastern China during 1981–2013. Int. J. Climatol. 2017, 37, 509–523. [Google Scholar] [CrossRef]
  24. Panda, D.K.; Aghakouchak, A.; Ambast, S.K. Increasing heat waves and warm spells in India, observed from a multiaspect framework. J. Geophys. Res. Atmos. 2017, 122, 3837–3858. [Google Scholar] [CrossRef]
  25. Perkins, S.E.; White, C.J.; Alexander, L.V. Natural hazards in Australia: heat waves. Clim. Chang. 2016, 139, 101–114. [Google Scholar] [CrossRef]
  26. Clark, R.T.; Brown, S.J.; Murphy, J.M. Modeling Northern Hemisphere summer heat extreme changes and their uncertainties using a physics ensemble of climate sensitivity experiments. J. Clim. 2006, 19, 4418–4435. [Google Scholar] [CrossRef]
  27. Ceccherini, G.; Russo, S.; Ameztoy, I.; Romero, C.P.; Moreno, C.C. Magnitude and frequency of heat and cold waves in recent decades: the case of South America. Nat. Hazards Earth Syst. Sci. 2016, 16, 821–831. [Google Scholar] [CrossRef] [Green Version]
  28. Bitencourt, D.P.; Fuentes, M.V.; Maia, P.A.; Amorim, F.T. Frequência, Duração, Abrangência Espacial e Intensidade das Ondas de Calor no Brasil. Revista Brasileira de Meteorologia 2016, 31, 506–517. [Google Scholar] [CrossRef]
  29. Geirinhas, J.L.M. Caracterização Climática e Sinóptica das Ondas de Calor no Brasil. Masters Dissertation, Faculty of Sciences of the University of Lisbon, Lisbon, Portugal, 2016. [Google Scholar]
  30. Xavier, A.C.; King, C.W.; Scanlon, B.R. Daily gridded meteorological variables in Brazil (1980–2013). Int. J. Climatol. 2015, 36, 2644–2659. [Google Scholar] [CrossRef]
  31. Marengo, J.A.; Nobre, C.A. Clima da Região Amazônica. In Tempo e Clima no Brasil; Cavalcanti, I.F.A., Ferreira, N.J., Justi Da Silva, M.G.A., Silva Dias, M.A.F., Eds.; Oficina M.G.A. de Textos: São Paulo, Brazil, 2009; Volume 1, pp. 197–212. [Google Scholar]
  32. Grimm, A.M. Clima da Região Sul do Brasil. In Tempo e Clima no Brasil; Cavalcanti, I.F.A., Ferreira, N.J., Justi Da Silva, M.G.A., Silva Dias, M.A.F., Eds.; Oficina M.G.A. de Textos: São Paulo, Brazil, 2009; Volume 1, pp. 259–276. [Google Scholar]
  33. Nunes, L.H.; Vicente, A.K.; Candido, D.H. Clima da Região Sudeste do Brasil. In Tempo e Clima no Brasil; Cavalcanti, I.F.A., Ferreira, N.J., Justi Da Silva, M.G.A., Silva Dias, M.A.F., Eds.; Oficina M.G.A. de Textos: São Paulo, Brazil, 2009; Volume 1, pp. 243–258. [Google Scholar]
  34. Firpo, M.A.F.; Sansigolo, C.A.; Assis, S.V. Climatologia e variabilidade sazonal do número de ondas de calor e de frio no Rio Grande do Sul associadas ao ENOS. Revista Brasileira de Meteorologia 2012, 27, 95–106. [Google Scholar] [CrossRef]
  35. Newman, M.; Alexander, M.A.; Ault, T.R.; Cobb, K.M.; Deser, C.; Di Lorenzo, E.; Mantua, N.J.; Miller, A.J.; Minobe, S.; Nakamura, H. The Pacific Decadal Oscillation, Revisited. J. Clim. 2016, 29, 4399–4427. [Google Scholar] [CrossRef] [Green Version]
  36. Spiegel, M.R.; Stephens, L.J. Theory and Problems of Statistics; Shaum’s Outline Series: New York, NY, USA, 1998; Volume 3, p. 220. [Google Scholar]
  37. Marengo, J.A.; Camargo, C.C. Surface air temperature trends in Southern Brazil for 1960–2002. Int. J. Climatol. 2008, 28, 893–904. [Google Scholar] [CrossRef]
  38. Damião, M.C.M. Bloqueios atmosféricos de 1960 a 2000 sobre o oceano Pacífico Sul: impactos climáticos e mecanismos físicos associados. Revista Brasileira de Meteorologia 2005, 20, 175–190. [Google Scholar]
  39. Oliveira, F.N.M. Climatologia de Bloqueios Atmosféricos no Hemisfério Sul: observações, simulações do clima do século XX e cenários futuros de mudanças climáticas. Doctoral Thesis, University of São Paulo, São Paulo, Brazil, 2011. [Google Scholar]
  40. Saurral, R.I.; Doblas-Reyes, F.J.; García-Serrano, J. Observed modes ofsea surface temperature variability intheSouth Pacific región. Clim Dyn. 2018, 50, 1119–1143. [Google Scholar] [CrossRef]
  41. Rosso, F.V.; Boiaski, N.T.; Ferraz, S.E.T.; Dewes, C.F.; Tatsch, J.D. Trends and Decadal Variability in Air Temperature over Southern Brazil. Am. J. Environ. Eng. 2015, 5, 85–95. [Google Scholar] [CrossRef]
  42. Perkins, S.E.; Argüeso, D.; White, C.J. Relationships between climatevariability, soil moisture, and Australianheatwaves. J. Geophys. Res. Atmos. 2015, 120, 8144–8164. [Google Scholar] [CrossRef]
  43. Grimm, A.M.; Ferraz, S.E.T.; Gomes, J. PrecipitationAnomalies in SouthernBrazilAssociatedwith El Niño and La Niña Events. J. Clim. 1998, 11, 2863–2880. [Google Scholar] [CrossRef]
  44. Trenberth, K.E. Has there been a hiatus? Science 2015, 349, 691–692. [Google Scholar] [CrossRef] [Green Version]
Figure 1. Composition of daily maximum temperature anomalies in Brazil, based on Heat Wave Duration Index (HWDI), from 1980 to 2013.
Atmosphere 10 00284 g001
Figure 2. Composition of daily maximum temperature anomalies above the 90% percentile (P90) threshold in Brazil, from 1980 to 2013.
Atmosphere 10 00284 g002
Figure 3. Box plot of the distribution of the daily maximum temperature (Tmax) anomalies (°C) in regions (a) 1 and (b) 2. The horizontal blue line represents the 90% percentile of these anomalies and the red circles represent the extreme values.
Atmosphere 10 00284 g003
Figure 4. Box plot of the persistence distribution (days) of Tmax above the threshold in regions (a) 1 and (b) 2. The horizontal blue line represents the 90% percentile of persistence and the red circles represent the extreme values.
Atmosphere 10 00284 g004
Figure 5. Number of heat waves per month from 1980 to 2013 in regions (a) 1 and (b) 2.
Atmosphere 10 00284 g005
Figure 6. Number of heat wave events per year in regions (a) 1 and (b) 2 from 1980 to 2013. The red line represents the means of the events.
Atmosphere 10 00284 g006
Figure 7. Annual average of the intensity (°C) of heat wave events in regions (a) 1 and (b) 2. The red line represents the trend of the intensity of the heat waves over the years.
Atmosphere 10 00284 g007
Figure 8. Annual average of the persistence (days) of the heat wave events in regions (a) 1 and (b) 2. The red line represents the trend of heat wave persistence.
Atmosphere 10 00284 g008
Table 1. Seasonal frequency of heat waves in regions 1 (R1) and 2 (R2) from 1980 to 2013.
SeasonsNumber of EventsPercentage (%)Number of EventsPercentage (%)
R1R2
Summer11.825.9
Fall1018.5617.7
Winter3055.61338.2
Spring1324.11338.2
TOTAL54 34
Table 2. Number of heat waves events per decade and decadal means of intensity (°C) and persistence (days) in region 1 (R1) and region 2 (R2).
DecadesNumber of EventsMeans of Intensity (°C)Means of Persistence (Days)
R1R2R1R2R1R2
1981–1990160440.0434.616.57.7
1991–2000160942.9336.766.38.1
2001–2010181644.1844.727.19.4
Table 3. Number of heat waves in region1 (R1), the corresponding means of intensity (°C) and persistence (days) of the events in each phase of the El Niño–Southern Oscillation (ENSO) and Pacific Decadal Oscillation (PDO).
PhaseNumberof Events (R1)Means of Intensity (°C)Means of Persistence (Days)
PDO+33 (61.1%)41.236.4
PDO-21 (38.9%)43.066.9
El Niño17 (31.5%)40.136.1
La Niña09 (16.7%)45.966.9
Neutral28 (51.8%)41.756.8
Table 4. Number of heat waves in region 2 (R2), the corresponding means of intensity (°C) and persistence (days) of the events in each phase of the ENSO and PDO.
PhaseNumber of Events (R2)Means of Intensity (°C)Means of Persistence (Days)
PDO+11 (32.3%)34.907.7
PDO-23 (67.7%)43.159.3
El Niño10 (29.4%)39.188.3
La Niña10 (29.4%)38.608.2
Neutral14 (41.2%)42.759.6
Table 5. Pearson correlation coefficients between the intensity and duration of the heat waves and the ENSO and PDO phases.
PhaseIntensity (°C)Persistence (Days)
R1R2R1R2
PDO+−0.180.24−0.270.19
PDO-−0.020.08−0.07−0.01
El Niño0.20−0.530.01−0.51
La Niña−0.01−0.55−0.06−0.44
Neutral−0.130.42−0.170.42

