Article

Characteristics and Sources of Water-Soluble Ions in PM2.5 in the Sichuan Basin, China

1
School of Safety and Environmental Engineering, Capital University of Economics and Business, NO.121 Zhangjialukou Rd, Fengtai District, Beijing 100070, China
2
College of Environmental Science and Engineering, Peking University, NO.5 Yiheyuan Rd, Haidian District, Beijing 100871, China
3
Sichuan Provincial Environmental Monitoring Center, NO.88 3rd East Guanghua Rd, Qingyang Districat, Chengdu 610041, China
4
Chongqing Environmental Monitoring Center, NO.252 Qishan Rd, Yubei District, Chongqing 401147, China
*
Author to whom correspondence should be addressed.
Atmosphere 2019, 10(2), 78; https://doi.org/10.3390/atmos10020078
Submission received: 19 January 2019 / Revised: 4 February 2019 / Accepted: 7 February 2019 / Published: 15 February 2019
(This article belongs to the Special Issue Atmospheric Aerosol Regional Monitoring)

Abstract

:
To track the particulate pollution in Sichuan Basin, sample filters were collected in three urban sites. Characteristics of water-soluble inorganic ions (WSIIs) were explored and their sources were analyzed by principal component analysis (PCA). During 2012–2013, the PM2.5 concentrations were 86.7 ± 49.7 μg m−3 in Chengdu (CD), 78.6 ± 36.8 μg m−3 in Neijiang (NJ), and 71.7 ± 36.9 μg m−3 in Chongqing (CQ), respectively. WSIIs contributed about 50% to PM2.5, and 90% of them were secondary inorganic ions. NH4+ and NO3 roughly followed the seasonal pattern of PM2.5 variations, whereas the highest levels of SO42− appeared in summer and autumn. PM2.5 samples were most acidic in autumn and winter, but were alkaline in spring. The aerosol acidity increased with the increasing level of anion equivalents. SO42− primarily existed in the form of (NH4)2SO4. Full neutralization of NH4+ to NO3 was only observed in low levels of SO42− + NO3, and NO3 existed in various forms. SO42− and NO3 were formed mainly through homogeneous reactions, and there was the existence of heterogeneous reactions under high relative humidity. The main identified sources of WSIIs included coal combustion, biomass burning, and construction dust.

Graphical Abstract

1. Introduction

Water-soluble inorganic ions (WSIIs) are a major part of fine particles (PM2.5, particulate matter with an aerodynamic diameter less than 2.5 μm). Of the various components, secondary inorganic ions (SII), including sulfate (SO42−), nitrate (NO3), and ammonium (NH4+), are the predominant species and account for more than 90% of WSIIs [1]. Nationwide, SII contribute about 25%–48% to PM2.5 mass, and are attributable to about 60% of the visibility reduction in China [2]. Moreover, they also play important roles in atmospheric acidification and climate change [3,4]. Characteristics of the WSII pollution in many cities of China have been studied, and the formation of SII has always been a focus [5]. Sulfate is primarily formed through homogeneous gas-phase oxidation of sulfur dioxide, while heterogeneous transformation processes, i.e., metal-catalyzed oxidation, H2O2/O3 oxidation, and in-cloud process, are also reported [6] (p. 348), [7]. Both homogeneous reaction via NO2 oxidation by OH radical and O3, and the heterogeneous hydrolysis of N2O5 on preexisting aerosols, are important pathways of nitric acid formation [8].
The Sichuan Basin (also called the Cheng-Yu region) is located in southwestern China (Figure 1a), covering the eastern part of Sichuan Province and most regions of Chongqing city. The basin is an important city agglomeration in western China with two megacities, namely, Chengdu and Chongqing, and 14 small and medium-sized cities. In total, the region has a population of more than 100 million. As a region with high RH, low wind speed, and unfavorable dispersion conditions, the Sichuan Basin has suffered from low visibility and air quality deterioration for a long period [9]. With its rapid urbanization, soaring industrialization, and booming population in the last two decades, air pollution is of great concern in the basin. The limited studies about particulate pollution in the Sichuan Basin have focused on Chengdu, and some of them covered Chongqing while a few of them studied the small cities in the basin. Source apportionment concluded that secondary inorganic aerosols contributed 37% to PM2.5 mass and were the predominant sources of particles in Chengdu [10]. In Chongqing, WSIIs generally accounted for more than 40% of PM2.5 and displayed an acidic feature [11,12,13,14]. Water content and RH played more critical roles than aerosol acidity in the heterogeneous formation of nitrate in Chongqing [12,15]. After the implementation of the Clean Air Action Plan in 2013, the PM2.5 levels in most of the cities of the Sichuan Basin have shown remarkable decreases (i.e., 52.2 μg m−3 for Chengdu and 44.0 μg m−3 for Chongqing in 2017) (Ranking of Air Quality in China, 2017). However, the current PM2.5 levels still exceed the Grade II National Ambient Air Quality Standard (NAAQS-II) (35 μg m−3 for annual average). Meanwhile, long-term observations of the local WSII pollution, especially in medium or small cities, are still lacking. As for the production of sulfate and nitrate, this varies from site to site, depending on the emission of gaseous precursors (SO2 and NOx), levels of gaseous and aqueous oxidants, characteristics of existing particles, and meteorological conditions [16]. Therefore, more studies addressing the WSII characteristics and the formation of secondary aerosols in the region, with specific geographical and meteorological conditions, are needed to supply effective guidance on local control strategies.
During 2012–2013, an intensive haze campaign was carried out in the region and detailed information about fine particle pollution was gathered from Chengdu, Chongqing, and Neijiang (a medium-sized city in the Sichuan Basin). The one-year field sampling data is summarized, here, to provide a comprehensive study of the WSIIs in PM2.5 of the Sichuan Basin. The WSII property is analyzed from annual and seasonal perspectives, and the acidity characteristics of the sulfate–nitrate–ammonium system and nitrate formation are investigated in the three cities of different sizes. The indicators reflected from the WSIIs are also explored to track the sources of PM2.5 in the region.

2. Experiments

2.1. Site Description and Field Sampling

Locations of the three sampling sites in the Sichuan Basin are denoted in Figure 1b. Chengdu is the provincial capital of Sichuan Province and surrounded by many small and medium-sized cities in the west of Sichuan basin. The sampling site in Chengdu is on the roof of a sixth-floor building with a height of 28 m (CD, 104°6′ E, 30°36′ N), which stands beside a main road with high traffic density. The site is representative of urban air quality, combining the influence of local vehicular emission, residential emission and regional pollution.
Chongqing is a municipality that is directly administrated by the Central Government. The sampling site in Chongqing is on the roof of a commercial building (CQ, 29°37′ N, 106°30′ E) in Yubei District in a downtown region (Figure 1b), and the sampling height is 35 m. The site is surrounded by main roads and office buildings. The third sampling site in Neijiang is on the roof of Neijiang Environmental Monitoring Center (NJ, 105°4′ E, 29°42′ N) with a height of 25 m. Neijiang is located 150 km southeast of Chengdu and 145 km west of Chongqing with an area of 75 km2 and a population of about 1 million in the downtown region.
During May 2012 to May 2013, particulate samples were synchronously collected at the above three sites. Both PM2.5 and PM10 were sampled once every six days on 47 mm teflon filters using a four-channel sampler at a flow rate of 16.7 L/min (model: TH-16A, Tianhong Instrument Co., Ltd., Wuhan). The sampling process was carried out by trained staff of a local monitoring station, and the flow rate of the sampler was checked monthly using a bubble flow meter (Gilian Gilibrator 2, Sensidyne, US) to ensure collection efficiency. The sampled filters were stored in refrigerator at −18 °C and transported by air. The filters were balanced and weighted in a superclean laboratory with controlled temperature (20 ± 1°C) and RH (40 ± 3%), both before and after the sampling.

2.2. Water-Soluble Ion Measurement

Samples on teflon filters were firstly extracted ultrasonically using 10 mL ultrapure water (18.5 MΩ cm−1) for 30 minutes. The aqueous extract was filtered through a 0.45 μm water filter and the ion concentrations were determined using ion chromatography (Dionex, ICS 2000). A Dionex separator column of AS11-HC with KOH eluent was used for anion analysis (NO3, SO42−, and Cl), and a cation analytical column of CS12A and an eluent of 20 mM methyl sulfonic acid was used to analyze inorganic cations (Na+, NH4+, K+, Mg2+, Ca2+). Careful quality assurance and quality control (QA/QC) procedure was applied. Reference materials from the National Institute of Metrology, China were used as standards. Blank and standard samples were repeated every ten samples. Examples of a calibration curve of standard samples are displayed in the Supplementary Material.

3. Results and Discussion

3.1. Concentrations of PM10, PM2.5, and WSIIs

Table 1 summarizes the observed particle and WSII concentrations in the three sampling sites. During 2012–2013, the annual average PM10 and PM2.5 concentrations were 125.8 ± 74.4 and 86.7 ± 49.7 μg m−3 in CD, 116.3 ± 54.7 and 78.6 ± 36.8 μg m−3 in NJ, and 101.0 ± 51.7 and 71.7 ± 36.9 μg m−3 in CQ, respectively. Obviously, they all exceeded the latest NAAQS-II issued in 2012, and the annual PM2.5 concentrations were more than 2 times the 35 μg m−3 limit. Daily PM2.5 levels in more than one-third of the sampling days surpassed the daily 75 μg m−3 criteria, and there were 8, 3, and 3 heavy pollution days in CD, NJ, and CQ with PM2.5 higher than 150 μg m−3. The average PM2.5/PM10 ratios were 0.72 in CD, 0.69 in NJ, and 0.71 in CQ, indicating a predominance of fine particulate pollution in the Sichuan Basin.
The annual averages of total WSIIs were 43.0 ± 27.9, 36.2 ± 18.4, and 35.4 ± 18.4 μg m−3 in CD, NJ, and CQ (Table 1), which accounted for 49.9%, 46.1%, and 49.4% of the PM2.5 mass, respectively. Although the average WSIIs in PM2.5 showed minor differences among sites, there were large fluctuations within each site, from a few to a couple of hundred μg m−3. For instance, WSII levels in CD were lower than 10 μg m−3 during clean period (PM2.5 < 35 μg m−3), and they increased to higher than 90 μg m−3 under heavy polluted period (PM2.5 > 150 μg m−3). SO42− was the most abundant species of WSIIs, with an average concentration of 17.7 ± 11.2 μg m−3 in CD, 18.1 ± 10.0 μg m−3 in NJ, and 17.6 ± 9.6 μg m−3 in CQ. Annual average concentrations of the other ions were ranked in the order of NO3 > NH4+ > Cl > K+ > Na+ > Ca2+ > Mg2+ in CD, whereas the order was NH4+ > NO3 > K+ > Cl > Ca2+ > Na+ > Mg2+ in both NJ and CQ (Table 1). The secondary inorganic components, in total, constituted about 90% of the total WSIIs (89.3% in CD, 92.4% in NJ, and 94.2% in CQ), and the rest of the ions each had a minor contribution.
Among the three cities, PM2.5 and WSII levels were highest in CD, followed by NJ and CQ. The three cities have roughly the same SO42− levels, while CD was characterized by higher NO3 and NH4+ concentrations, indicating that the sampling site in CD was more affected by motor vehicles from its surrounding road. Specifically, concentration of chloride was also the highest in CD, which might be associated with coal combustion. CD and NJ suffered from higher loadings of K+ (Table 1), and it was a diagnostic tracer for intensive biomass burning in the suburban regions [17].
When compared with the observed values in 2011, the levels of WSIIs in Chengdu have shown a downward trend except for NO3 and Cl [8]. In Chongqing, the PM2.5 and SO42− levels have decreased by 57.3% and 31% compared to those in 2005–2006, whereas the NO3 level increased by 43% (7.8 vs. 5.46 μg m−3) [13]. The similar trend of decreasing SO42− and increasing NO3 in both Chengdu and Chongqing were related to the strict enforcement of desulfurization engineering and the soaring of the vehicular population in large cities of China [18]. After 2013, the decrease of PM2.5 concentration in Chongqing was minor and stabilized around 67.5 μg m−3 from 2015 to 2016 [15]. However, there was still an increase in NO3 (10.9 μg m−3) [15], which further highlights the importance of vehicular emissions in Chongqing.
Results of the study were also compared with previous measurements conducted in other cities of China. CD displayed lower loadings of PM2.5 and SO42− than Deyang, which was a medium-sized city in the Sichuan Basin located on the diffusion air pathways of Chengdu [19]. WSII levels in the Sichuan Basin were generally lower than cities in northern China, i.e., Handan (2013–2014) [20], Shijiazhuang (2009–2010) [21], and Taiyuan (2009–2010) [22]. However, the SO42− and NH4+ levels were higher than those of Beijing during 2009–2010 [23], despite lower PM2.5 and NO3 levels. When compared with cities in southern China, like Shanghai and the Pearl River Delta (PRD) [24], the pollution situation of PM2.5 and WSIIs was more serious in the Sichuan Basin.

3.2. Seasonal Variations of PM2.5 and WSIIs

The seasonal variations of PM2.5 and WSIIs at the three sites are depicted in Figure 2. Notably, winter has the highest PM2.5 levels (108.1, 97.6, and 97.5 μg m−3 in CD, NJ, and CQ, respectively), and was the most heavily polluted season in the Sichuan Basin. Autumn in CD and NJ also recorded high PM2.5 concentrations (101.6 μg m−3 in CD and 81.2 μg m−3 in NJ), whereas spring and summer were relatively clean (spring: 72.2 μg m−3 in CD and 67.5 μg m−3 in NJ; summer: 68.3 μg m−3 in CD and 68.7 μg m−3 in NJ). In CQ, PM2.5 concentrations in spring (57.3 μg m−3), summer (64.9 μg m−3), and autumn (68.0 μg m−3) were rather close to each other.
The seasonal patterns of WSIIs were attributable to local and regional source variations between seasons, as well as meteorological factors, which affected their formation, transformation, and transport. The seasonal variations of NH4+ followed the changes of PM2.5 in each city, and NH4+ levels were highest in winter. Undoubtedly, the sulfate concentrations were also high in winter, which were due to poor dispersion in the cold season, enhanced in-cloud process under high RH, and long contact time for gas–liquid reaction under stable meteorology. Specifically, NJ and CQ suffered from the highest loading of sulfate in summer, though the PM2.5 concentrations were low. As a typical secondary ion, SO42− formation via homogeneous gas phase reaction was greatly enhanced at high temperature and intensive solar radiation in summer. It is worthy to note that autumn samples in CD showed an elevated level of sulfate with respect to summer (Figure 2, 17.9 μg m−3 in summer vs. 19.5 μg m−3 in autumn), which might be ascribed to the elevated PM2.5 loading in the season.
Different from sulfate, the season pattern of nitrate was characterized by winter maxima, autumn medium, and spring/summer minima at the three sites (Figure 2). Temperature and relative humidity are two important meteorological factors influencing the thermodynamic features of nitrate, and high temperature and low RH is highly favorable for nitrate volatilization [25]. Therefore, the low temperature and high RH in winter and autumn are beneficial for nitrate stabilization. Moreover, the high loadings of PM2.5 in winter provided more aerosol surfaces for heterogeneous formation of nitrate [26].

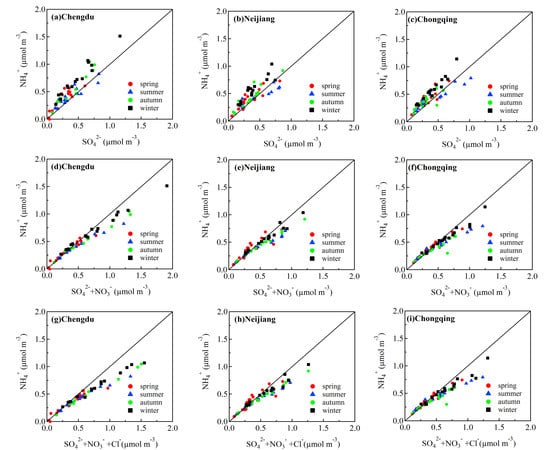
3.3. Stoichiometric Analysis of Cations and Anions

To examine the ion balance and acidity of PM2.5 samples, the ion mass concentrations (μg m−3) are converted into microequivalents (μmol m−3) by the following equations.
AE ( anion   equivalent ) = S O 4 2 96 × 2 + N O 3 62 + C l 35.5 ,
CE ( cation   equivalent ) = N a + 23 + N H 4 + 18 + K + 39 + M g 2 + 24 × 2 + C a 2 + 40 × 2 .
Figure 3 illustrates the scatter plots of AE vs. CE in four seasons of CD, NJ, and CQ. Strong correlations between anion and cation equivalents were found for all the three cities (~1.0), supporting that the measured eight ions were dominant species in the PM2.5 ionic components. In CD, most of the samples in autumn and winter were above the 1:1 (AE/CE) line, indicating an acidic feature. By contrast, the majority of the samples in spring fall below the 1:1 line, demonstrating a deficiency of anions which might be associated with more alkaline dust particles. CO32− and HCO3 were not measured by the method, and also contributed to the anion deficiency. In the summer of CD, most of the samples generally showed a balance between anions and cations, while some of them also denoted acidic features which might result from the enhanced formation of sulfate and loss of cations from the volatilization of nitrate and ammonium. Similar seasonal patterns of PM2.5 acidity were also observed in NJ and CQ (Figure 3b, Figure 3c). Interestingly, it was reflected from the scatter plots (Figure 3) that aerosol acidity increased with the level of AE, indicating PM2.5 samples under heavy pollution were mostly acidic. Tian et al. [15] also found increased acidity with aerosol pollution level. High humidity and low wind speed were common meteorological conditions for heavy pollution [27]. They were unfavorable for horizontal dispersion and vertical mixing of pollutants but beneficial for the formation of nitrate and sulfate, therefore resulting in the acidic feature.

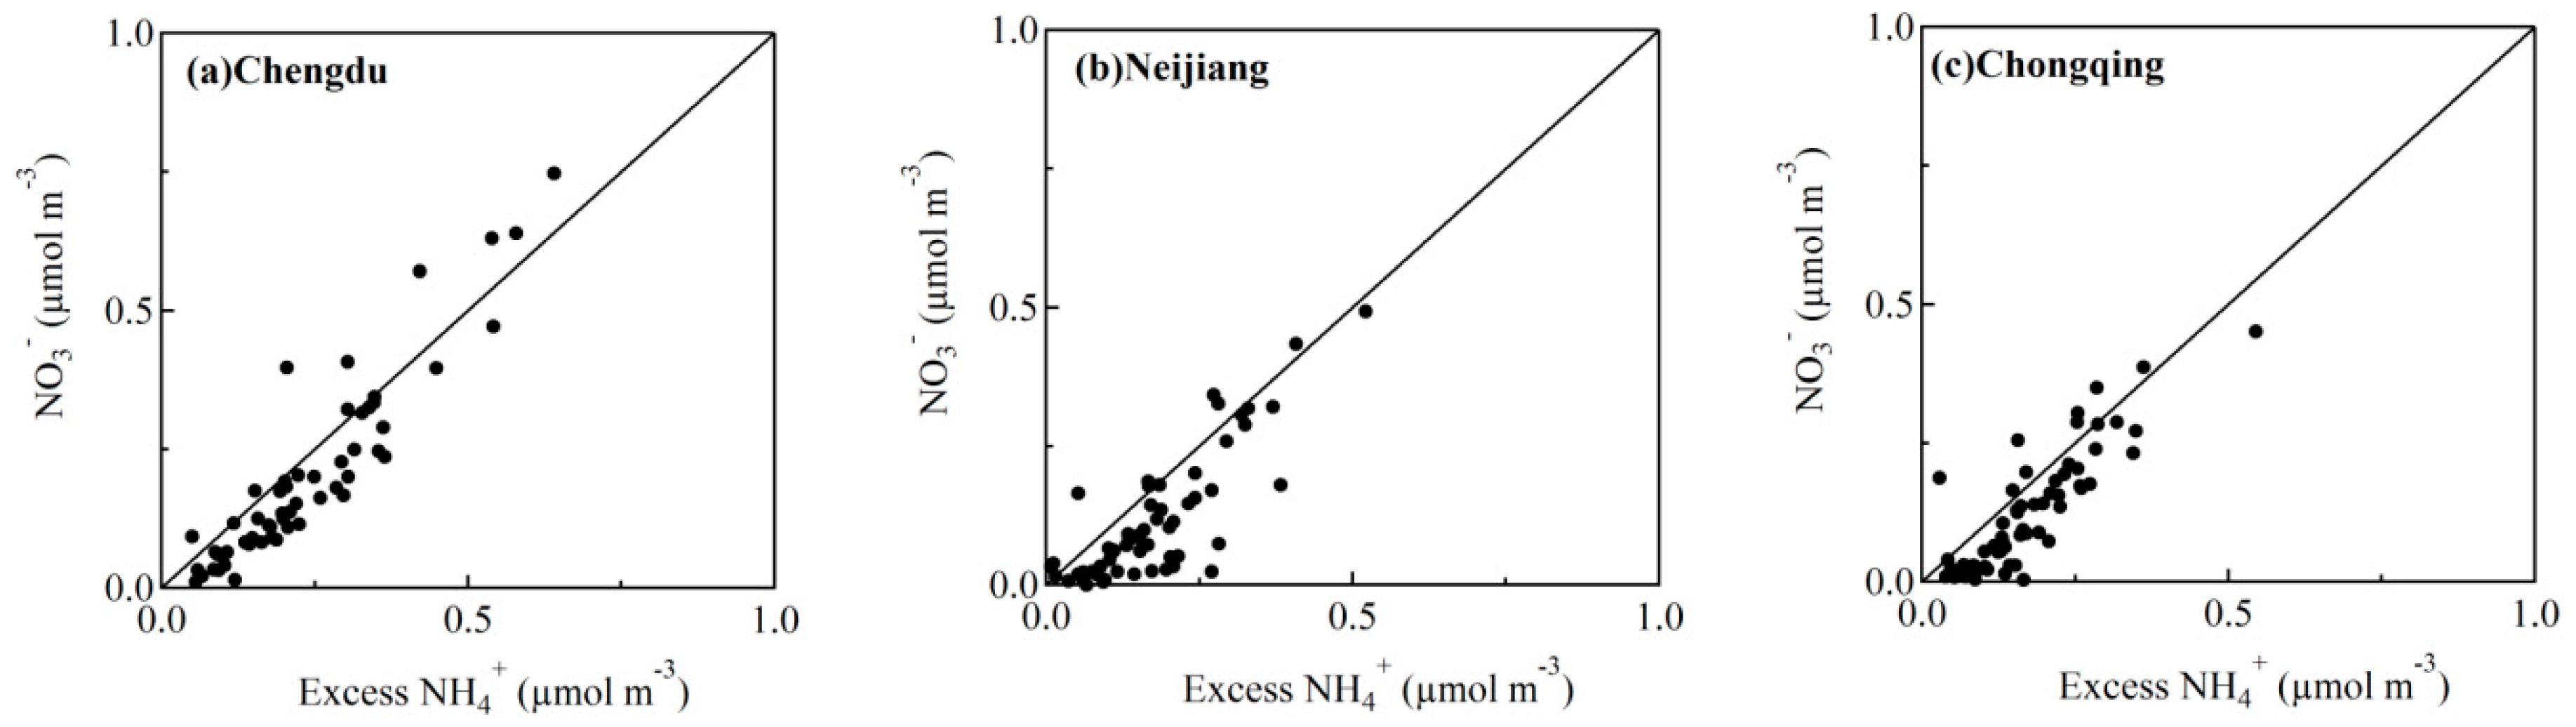
3.4. Chemical Forms of Nitrate and Sulfate

The scatter plots of NH4+ vs. SO42−, SO42− + NO3, and SO42− + NO3 + Cl (all the above denote electron equivalent concentrations) in CD, NJ, and CQ are depicted in Figure 4. As (NH4)2SO4 is less volatile and preferentially formed compared to NH4NO3 and NH4Cl, the relationships between NH4+ and SO42− are firstly explored to investigate the chemical forms of sulfate and nitrate. It is reflected from Figure 4a–c that NH4+ was closely related with SO42−, and the data were mostly above the 1:1 (NH4+/SO42−) line, suggesting the complete neutralization of SO42− by NH4+, and (NH4)2SO4 was the major species. However, there were a few exceptions below the 1:1 (NH4+/SO42−) line in the summer of NJ and CQ (Figure 4a–c). It was understandable that the formation of SO42− was greatly enhanced under the high temperature of summer while NH4+ was more easily removed by decomposition. Therefore, the samples did not have sufficient NH4+ to fully neutralize SO42−, and NH4HSO4 existed in summer.
When it came to nitrate, the samples in spring mostly occupied enough NH4+ to neutralize both SO42− and NO3 (Figure 4d–f) and formed (NH4)2SO4 and NH4NO3, in spite of a few exceptions. In other seasons, NH4+ was able to neutralize the secondary anions when their levels were low (SO42− + NO3 < 0.5 μmol m−3) (Figure 4d–f). In fact, the abundance of NH4+ almost equaled to the sum of SO42−, NO3, and Cl under low PM loadings (Figure 4g–i), and dominant anions existed in the form of (NH4)2SO4, NH4NO3, and NH4Cl. However, under high SO42− and NO3 levels (SO42− + NO3 > 0.5 μmol m−3), NH4+ was far from fully neutralized (Figure 4d–f). It was observed in most previous studies that high NO3 levels were associated with high levels of NH4+ [28]. In contrast, the relatively high NO3 observed in the present study was with moderate levels of NH4+, suggesting that the formation rate of nitrate may be much higher than other ions. The high NO3 might also be associated with high levels of NO2 under heavy pollution.
The correlation coefficients between NO3 and other cations in PM2.5 were further calculated in Table 2 to identify the chemical forms of nitrate. Na+ and K+ were found to be correlated with NO3 in most seasons, and NaNO3 and KNO3 were also the major chemical species in aerosol particles. Notably, there were exceptionally high levels of NO3 in the winter of CD, and NO3 were significantly correlated with all cations and existed in various forms of NH4NO3, NaNO3, KNO3, Mg(NO3)2, and Ca(NO3)2.

3.5. Formation Mechanism of Nitrate and Sulfate

Sulfur oxidation ratio (SOR), defined as n-SO42−/(n-SO2 + n-SO42−), and nitrogen oxidation ratio (NOR) defined as n-NO3/(n-NO2 + n-NO3), in CD, NJ, and CQ, are listed in Table 3 and used to indicate the secondary transformation processes. Generally, the SOR values were much higher than 0.10 (Table 3), demonstrating the occurrence of strong secondary oxidation of SO2 to SO42− throughout the year [29]. The interseasonal variation of SOR peaked in summer in both CD and CQ, and it was explicable by the accelerated homogenous gas-phase oxidation of SO2 under high temperature [30]. Moreover, the increased oxidizing capacity from the greater production of ozone in summer also promoted SO42− formation. By contrast, the highest SOR in NJ appeared in autumn instead of summer, and a good correlation was found between SOR and RH (r = 0.58). This suggested that high RH also increased the formation of SO42− by prompting SO2 oxidation through heterogeneous reaction [31], i.e., metal-catalyzed H2O2/O3 oxidation and in-cloud process. The good correlation between SOR and RH in winter of CD (r = 0.66) and CQ (r = 0.71) also confirmed the existence of heterogeneous reaction. On days with elevated RH, the hygroscopic growth of sulfate would increase the liquid water content, and the aqueous phase on the aerosol surface could provide heterogeneous transformation vectors for gaseous pollutants (SO2). Therefore, the elevated RH would largely promote the secondary formation of sulfate [32,33].
The annual average NOR in CD, NJ, and CQ all surpassed 0.1 (Table 3), indicating the existence of secondary oxidation of NO2 to NO3 [29]. Reflected in Table 3, the NOR values had a different seasonal pattern from SOR, and reached their maxima in winter. Although the absolute concentrations of sulfate and nitrate both increased with PM2.5 levels, their relative importance changed under different pollution levels. Table 4 listed the variations of NO3/SO42− ratios and NOR/SOR ratios as a function of different PM2.5 levels. The continuous increase of NO3/SO42− ratio as a function of PM2.5 concentrations (Table 4), as well as the increase of NOR/SOR ratio, indicated that NO2 oxidation under heavy pollution was more significant than SO2, and nitrate formation might play an important role in haze in the Sichuan Basin. The above result is also supported by the findings of Hewitt [34] and Tian et al. [15]. It is worth noting that the high concentrations of nitrate in the study were mostly collected during hazy and humid weather with high sulfate and acidity. Thus, the details of nitrate formation are discussed below.
Figure 5 shows the molar ratio of nitrate-to-sulfate ([NO3]/[SO42−]) as a function of the ammonium-to-sulfate molar ratio ([NH4+]/[SO42−]) in CD, NJ, and CQ. The majority of the [NH4+]/[SO42−] ratios in the Sichuan Basin were >1.5 (one exception in CD, and two exceptions in CQ). Thus, these samples were categorized into NH4+-rich conditions ([NH4+]/[SO42−] ratio > 1.5). According to Pathak et al. [28], the relationship between [NO3]/[SO42−] and [NH4+]/[SO42−] could be used to show the formation pathways of NO3. Under NH4+-rich conditions, a linear relationship exists between them, suggesting homogeneous gas-phase formation for NO3, and, otherwise, hydrolysis of NOx on preexisting aerosols is responsible for the high NO3 level [12,15,28]. In Figure 5, the relative abundance of nitrate ([NO3]/[SO42−]) increased as the [NH4+]/[SO42−] ratio increased (r = 0.81 in CD, r = 0.75 in NJ, and r = 0.68 in CQ), suggesting that nitrate formation via gas-phase reaction became evident in the NH3–H+–SO42−–H2O system in aerosol [35,36]. In fact, the good relationship between the excess ammonium (excess [NH4+] = [NH4+] − 1.5[SO42−]) and nitrate (Figure 6) further confirmed that the homogeneous gas-phase formation of nitrate was significant. Reflected from Figure 6, the increase of nitrate rate seemed to surpass the increase of excess [NH4+] under high concentrations (NO3 > 0.25 μmol m−3). As more NO3 led to more ions, it could further explain the observed high acidity of PM2.5 under high pollution levels in Section 3.3.
However, it is hard to ignore that some plots are rather scattered in Figure 5, and the relationship between [NO3]/[SO42−] and [NH4+]/[SO42−] were further explored under different acidity and RH (Figure 7). The scatter plots of [NO3]/[SO42−] and [NH4+]/[SO42−] for both AE/CE > 1 and AE/CE < 1 displayed significant linear relationships, highlighting the importance of homogeneous gas-phase reaction. However, the correlation of R2 = 0.45 between [NO3]/[SO42−] and [NH4+]/[SO42−] for samples with RH > 75% was lower than samples with RH < 75% (R2 = 0.65), and the plots were more scattered (Figure 7b). The result was consistent with other research in Suzhou and Chongqing [15,16], where they also tended to have better linear correlation under lower RH conditions (<75%). The scattered plots under RH > 75% implied the existence of different mechanisms other than the homogeneous reaction. The critical parameters to heterogeneous formation of nitrate via N2O5 hydrolysis on pre-existing particles include particulate hygroscopicity, surface area, and acidity. On the one hand, high RH relates to greater water content and surface areas of aerosols, which may promote N2O5 uptake on the aerosol surfaces. On the other hand, the high concentrations of PM2.5 mass and large fractions of WSIIs with acidic conditions would favor the hydrolysis of N2O5 [34].

3.6. Source Analysis of WSIIs

Principal component analysis (PCA) is applied in the study using SPSS version 16.0 software packages to explore the sources of WSIIs in CD, NJ, and CQ. In the analysis, all the WSIIs are considered as variables, and factors explaining more than 80% of the total variance are extracted. Varimax rotation is then used to redistribute the variance and provide a more interpretable pattern of the factors. Three factors in each city, with their component loadings, eigenvalues, and explained variance are displayed in Table 5.
Factor 1 in CD covered 61.1% of the total variance, and had high loadings of Na+ (0.74), NH4+ (0.96), Cl (0.77), SO42− (0.85), and NO3 (0.93). NH4+, SO42−, and NO3 are typical secondary ions, and Cl is a tracer for coal combustion. Thus, factor 1 in CD was recognized as a mixture of secondary aerosols and coal combustion, and the good correlation between Na+ and Cl indicated their similar origins or coexistence in aerosols. In factor 2, 14.9% of the total variance was explained and loadings of K+ and Ca2+ were much higher than other variables, indicating the contribution from biomass burning and natural dust. Factor 3 was responsible for 8.5% of total variance, and was heavily loaded by Mg2+ (0.89). Mg2+ was from construction dust, and the factor was related with the wide reconstruction work in urban Chengdu.
In NJ, the loadings of Na+ (0.70), K+ (0.68), Mg2+ (0.81), and Ca2+ (0.83) in factor 1 were high, and these were probably from natural dust and biomass burning. Factor 2 had high loadings of NO3 (0.88) and Cl (0.88), indicating the influence from secondary nitrate and coal combustion. In factor 3, both loadings of SO42− (0.96) and NH4+ (0.84) were high, and they were tracers for secondary sulfate.
In CQ, factor 1, explaining 57.8% of total variance, had high loadings of NH4+ (0.79), K+ (0.79), and SO42− (0.89), and reflected a combination of biomass burning and secondary sulfate. Factor 2 was mainly affected by Na+ (0.61), NH4+ (0.55), Cl (0.92), and NO3 (0.87), and was a mixed influence from coal combustion and secondary nitrate. Similar to CD, factor 3 in CQ was heavily loaded by dust elements of Mg2+ and Ca2+, which were tracers for construction and road dust, respectively.

4. Conclusions

The annual average PM2.5 concentrations were 86.7 ± 49.7 μg m−3 in CD, 78.6 ± 36.8 μg m−3 in NJ, and 71.7 ± 36.9 μg m−3 in CQ from 2012 to 2013. The total WSIIs contributed 49.9%, 46.1%, and 49.4% to the PM2.5 mass, respectively. Secondary inorganic ions dominated WSIIs, accounting for 89.3% of WSIIs in CD, 92.4% in NJ, and 94.2% in CQ. In the recent decade, a trend of decreasing SO42− and increasing NO3 was observed in both Chengdu and Chongqing, which was probably due to the performance of desulfurization projects and elevated vehicular population.
The seasonal variations of PM2.5 were significant in the Sichuan Basin, and winter was the most heavily polluted season. NH4+ and NO3 exhibited similar seasonal pattern of PM2.5 variations, whereas peaks of sulfate appeared in summer of NJ and CQ, and in autumn of CD. The PM2.5 samples also showed pronounced seasonal variations with acidic feature in autumn and winter, and were alkaline in spring. The aerosol acidity tended to increase with the increasing level of anion equivalents. SO42− was fully neutralized and existed mainly in the form of (NH4)2SO4, but there was NH4HSO4 in summer when SO42− formation was enhanced. Full neutralization of NH4+ to NO3 was only observed in low levels of SO42− + NO3 (<0.5 μmol m−3), and mostly NO3 existed in a variety forms of NH4NO3, NaNO3, KNO3, Mg(NO3)2, and Ca(NO3)2.
Homogeneous reactions played an important role in the formation of SO42−, and there was the existence of heterogeneous reactions in winter with high RH. The formation of NO3 was enhanced under heavy pollution, and the mechanisms were more complex. Generally, PM2.5 samples in the basin were under NH4+-rich conditions, and homogeneous reactions dominated nitrate formation. The scatter plots between [NO3]/[SO42−] and [NH4+]/[SO42−] denoted possible heterogeneous reactions, especially under RH > 75%. Principal component analysis (PCA) showed that sources of WSIIs in the Sichuan Basin were the mixture of secondary origins and coal combustion, biomass burning, and construction dust.

Supplementary Materials

The following are available online at https://www.mdpi.com/2073-4433/10/2/78/s1, the sampling data used in the manuscript are in the ‘Supplementary Material 1’, and the calibration curve used in Section 2.2 is in the ‘Supplementary Material 2’.

Author Contributions

Formal analysis, Y.C.; Funding acquisition, S.-d.X.; Methodology, Y.C.; Project administration, B.L. and C.Z.; Supervision, S.-d.X.; Writing—original draft, Y.C.

Acknowledgments

This study was funded by the National Key R & D Program of China (Demonstration of integrated air pollution control technology in the Cheng-Yu region, NO. 2018YFC0214000), the Special Funds from the Ministry of Environmental Protection, China (NO. 201009001) and the Funds for Excellent Teachers from Capital University of Economics and Business (2016). We also would like to thank the staff in Sichuan Provincial Environmental Monitoring Center, Neijiang Environmental Monitoring Station and Chongqing Environmental Monitoring Center for the help in the sample collection.

Conflicts of Interest

The authors declare no conflict of interest. The funders had no role in the design of the study; in the collection, analyses, or interpretation of data; in the writing of the manuscript, or in the decision to publish the results.

References

  1. Zhang, X.Y.; Wang, Y.Q.; Niu, T.; Zhang, X.C.; Gong, S.L.; Zhang, Y.M.; Sun, J.Y. Atmospheric aerosol compositions in China: Spatial/temporal variability, chemical signature, regional haze distribution and comparisons with global aerosols. Atmos. Chem. Phys. 2012, 12, 779–799. [Google Scholar] [CrossRef]
  2. Tao, J.; Zhang, L.; Cao, J.; Zhang, R. A review of current knowledge concerning PM2. 5 chemical composition, aerosol optical properties and their relationships across China. Atmos. Chem. Phys. 2017, 17, 9485–9518. [Google Scholar] [CrossRef]
  3. Andreae, M.O.; Schmid, O.; Yang, H.; Chand, D.; Yu, J.Z.; Zeng, L.-M.; Zhang, Y.-H. Optical properties and chemical composition of the atmospheric aerosol in urban Guangzhou, China. Atmos. Environ. 2008, 42, 6335–6350. [Google Scholar] [CrossRef]
  4. Zheng, S.; Pozzer, A.; Cao, C.X.; Lelieveld, J. Long-term (2001–2012) concentrations of fine particulate matter (PM2.5) and the impact on human health in Beijing, China. Atmos. Chem. Phys. 2015, 15, 5715–5725. [Google Scholar] [CrossRef]
  5. Wang, Y.; Zhuang, G.; Tang, A.; Yuan, H.; Sun, Y.; Chen, S.; Zheng, A. The ion chemistry and the source of PM2.5 aerosol in Beijing. Atmos. Environ. 2005, 39, 3771–3784. [Google Scholar] [CrossRef]
  6. Seinfeld, J.H. Atmospheric Chemistry and Physics of Air Pollution; Wiley: New York, NY, USA, 1986; p. 348. [Google Scholar]
  7. Wang, Y.; Zhuang, G.; Sun, Y.; An, Z. The variation of characteristics and formation mechanisms of aerosols in dust, haze, and clear days in Beijing. Atmos. Environ. 2006, 40, 6579–6591. [Google Scholar] [CrossRef]
  8. Khoder, M.I. Atmospheric conversion of sulfur dioxide to particulate sulfate and nitrogen dioxide to particulate nitrate and gaseous nitric acid in an urban area. Chemosphere 2002, 49, 675–684. [Google Scholar] [CrossRef]
  9. Chen, Y.; Xie, S.D. Temporal and spatial visibility trends in the Sichuan Basin, China, 1973 to 2010. Atmos. Res. 2012, 112, 25–34. [Google Scholar] [CrossRef]
  10. Tao, J.; Gao, J.; Zhang, L.; Zhang, R.; Che, H.; Zhang, Z.; Lin, Z.; Jing, J.; Cao, J.; Hsu, S.C. PM2.5 pollution in a megacity of southwest China: Source apportionment and implication. Atmos. Chem. Phys. 2014, 14, 8679–8699. [Google Scholar] [CrossRef]
  11. Chen, Y.; Xie, S.D.; Luo, B.; Zhai, C.Z. Particulate pollution in urban Chongqing of southwest China: Historical trends of variation, chemical characteristics and source apportionment. Sci. Total. Environ. 2017, 584–585, 523–534. [Google Scholar] [CrossRef]
  12. He, K.; Zhao, Q.; Ma, Y.; Duan, F.; Yang, F.; Shi, Z.; Chen, G. Spatial and seasonal variability of PM2.5 acidity at two Chinese megacities: Insights into the formation of secondary inorganic aerosols. Atmos. Chem. Phys. 2012, 12, 1377–1395. [Google Scholar] [CrossRef]
  13. Yang, F.; Tan, J.; Zhao, Q.; Du, Z.; He, K.; Ma, Y.; Duan, F.; Chen, G. Characteristics of PM2.5 speciation in representative megacities and across China. Atmos. Chem. Phys. 2011, 11, 5207–5219. [Google Scholar] [CrossRef]
  14. Zhao, Q.; He, K.; Rahn, K.A.; Ma, Y.; Jia, Y.; Yang, F.; Duan, F.; Lei, Y.; Chen, G.; Cheng, Y.; et al. Dust storms come to Central and Southwestern China, too: Implications from a major dust event in Chongqing. Atmos. Chem. Phys. 2010, 10, 2615–2630. [Google Scholar] [CrossRef]
  15. Tian, M.; Wang, H.; Chen, Y.; Zhang, L.; Shi, G.; Liu, Y.; Yu, J.; Zhai, C.; Wang, J.; Yang, F. Highly time-resolved characterization of water-soluble inorganic ions in PM2.5 in a humid and acidic mega city in Sichuan Basin, China. Sci. Total. Environ. 2017, 580, 224–234. [Google Scholar] [CrossRef] [PubMed]
  16. Tian, M.; Wang, H.; Chen, Y.; Yang, F.; Zhang, X.; Zou, Q.; Zhang, R.; Ma, Y.; He, K. Characteristics of aerosol pollution during heavy haze events in Suzhou, China. Atmos. Chem. Phys. 2016, 16, 7357–7371. [Google Scholar] [CrossRef] [Green Version]
  17. Chen, Y.; Xie, S.-D. Characteristics and formation mechanism of a heavy air pollution episode caused by biomass burning in Chengdu, Southwest China. Sci. Total. Environ. 2014, 473, 507–517. [Google Scholar] [CrossRef] [PubMed]
  18. National Bureau of Statistics of China. Available online: http://www.stats.gov.cn/ (accessed on 1 February 2019).
  19. Zhou, J.; Xing, Z.; Deng, J.; Du, K. Characterizing and sourcing ambient PM2.5 over key emission regions in China I: Water-soluble ions and carbonaceous fractions. Atmos. Environ. 2016, 135, 20–30. [Google Scholar] [CrossRef]
  20. Meng, C.C.; Wang, L.T.; Zhang, F.F.; Wei, Z.; Ma, S.M.; Ma, X.; Yang, J. Characteristics of concentrations and water-soluble inorganic ions in PM2.5 in Handan City, Hebei province, China. Atmos. Res. 2016, 171, 133–146. [Google Scholar] [CrossRef]
  21. Zhao, P.S.; Dong, F.; He, D.; Zhao, X.J.; Zhang, X.L.; Zhang, W.Z.; Yao, Q.; Liu, H.Y. Characteristics of concentrations and chemical compositions for PM2.5 in the region of Beijing, Tianjin, and Hebei, China. Atmos. Chem. Phys. 2013, 13, 4631–4644. [Google Scholar] [CrossRef]
  22. He, Q.; Yan, Y.; Guo, L.; Zhang, Y.; Zhang, G.; Wang, X. Characterization and source analysis of water-soluble inorganic ionic species in PM2.5 in Taiyuan city, China. Atmos. Res. 2017, 184, 48–55. [Google Scholar] [CrossRef]
  23. Zhang, R.; Jing, J.; Tao, J.; Hsu, S.C.; Wang, G.; Cao, J.; Lee, C.S.L.; Zhu, L.; Chen, Z.; Zhao, Y.; et al. Chemical characterization and source apportionment of PM2.5 in Beijing: seasonal perspective. Atmos. Chem. Phys. 2013, 13, 7053–7074. [Google Scholar] [CrossRef]
  24. Wang, Y.G.; Ying, Q.; Hu, J.L.; Zhang, H.L. Spatial and temporal variations of six criteria air pollutants in 31 provincial capital cities in China during 2013–2014. Environ. Int. 2014, 73, 413–422. [Google Scholar] [CrossRef] [PubMed]
  25. Pathak, R.K.; Louie, P.K.K.; Chan, C.K. Characteristics of aerosol acidity in Hong Kong. Atmos. Environ. 2004, 38, 2965–2974. [Google Scholar] [CrossRef]
  26. Anttila, T.; Kiendlerscharr, A.; Ralf Tillmann, A.; Mentel, T.F. On the reactive uptake of gaseous compounds by organic-coated aqueous aerosols:  Theoretical analysis and application to the heterogeneous hydrolysis of N2O5. J. Phys. Chem. A 2006, 110, 10435. [Google Scholar] [CrossRef] [PubMed]
  27. Liao, T.; Wang, S.; Ai, J.; Gui, K.; Duan, B.; Zhao, Q.; Zhang, X.; Jiang, W.; Sun, Y. Heavy pollution episodes, transport pathways and potential sources of PM2.5 during the winter of 2013 in Chengdu (China). Sci. Total. Environ. 2017, 584–585, 1056–1065. [Google Scholar] [CrossRef] [PubMed]
  28. Pathak, R.K.; Wu, W.S.; Wang, T. Summertime PM2.5 ionic species in four major cities of China: Nitrate formation in an ammonia-deficient atmosphere. Atmos. Chem. Phys. 2009, 9, 1711–1722. [Google Scholar] [CrossRef]
  29. Ohta, S.; Okita, T. A ChemicaL characterization of atmospheric aerosol in Sapporo. Atmos. Environ. 1990, 24, 815–822. [Google Scholar] [CrossRef]
  30. Takekawa, H.; Minoura, H.; Yamazaki, S. Temperature dependence of secondary organic aerosol formation by photo-oxidation of hydrocarbons. Atmos. Environ. 2003, 37, 3413–3424. [Google Scholar] [CrossRef]
  31. Sun, Y.; Wang, Z.; Fu, P.; Jiang, Q.; Yang, T.; Li, J.; Ge, X. The impact of relative humidity on aerosol composition and evolution processes during wintertime in Beijing, China. Atmos. Environ. 2013, 77, 927–934. [Google Scholar] [CrossRef]
  32. Svenningsson, B.; Rissler, J.; Swietlicki, E.; Mircea, M.; Bilde, M.; Facchini, M.C.; Decesari, S.; Fuzzi, S.; Zhou, J.; Mønster, J.; et al. Hygroscopic growth and critical supersaturations for mixed aerosol particles of inorganic and organic compounds of atmospheric relevance. Atmos. Chem. Phys. 2006, 6, 1937–1952. [Google Scholar] [CrossRef] [Green Version]
  33. Huang, X.; Liu, Z.; Zhang, J.; Wen, T.; Ji, D.; Wang, Y. Seasonal variation and secondary formation of size-segregated aerosol water-soluble inorganic ions during pollution episodes in Beijing. Atmos. Res. 2016, 168, 70–79. [Google Scholar] [CrossRef]
  34. Hewitt, C.N. The atmospheric chemistry of sulphur and nitrogen in power station plumes. Atmos. Environ. 2001, 35, 1155–1170. [Google Scholar] [CrossRef]
  35. Jansen, R.C.; Yang, S.; Chen, J.; Yunjie, H.U.; Chang, X.U.; Hong, S.; Jiao, L.I. Using hourly measurements to explore the role of secondary inorganic aerosol in PM2.5 during Haze and Fog in Hangzhou, China. Adv. Atmos. Sci. 2014, 31, 1427–1434. [Google Scholar] [CrossRef]
  36. Pathak, R.; Chan, C. Inter-particle and gas-particle interactions in sampling artifacts of PM2.5 in filter-based samplers. Atmos. Environ. 2005, 39, 1597–1607. [Google Scholar] [CrossRef]
Figure 1. (a) Location of Sichuan and Chongqing in China; (b) Sampling sites of Chengdu (CD), Neijiang (NJ), and Chongqing (CQ).
Atmosphere 10 00078 g001
Figure 2. Seasonal variations of PM2.5 and WSIIs in CD, NJ, and CQ.
Atmosphere 10 00078 g002
Figure 3. Scatter plots of total anions vs. total cations in (a) CD, (b) NJ, and (c) CQ.
Atmosphere 10 00078 g003
Figure 4. Scatter plots of ammonium and the major acidic anions in PM2.5 of (a,d,g) CD, (b,e,h) NJ, and (c,f,i) CQ.
Atmosphere 10 00078 g004
Figure 5. [NO3]/[SO42−] ratio as a function of [NH4+]/[SO42−] in (a) CD, (b) NJ, and (c) CQ.
Atmosphere 10 00078 g005
Figure 6. NO3 concentration as a function of excess NH4+ in (a) CD, (b) NJ, and (c) CQ.
Atmosphere 10 00078 g006
Figure 7. Relationship between [NO3]/[SO42−] and [NH4+]/[SO42−] under different (a) acidity and (b) RH.
Atmosphere 10 00078 g007
Table 1. Particle and water-soluble inorganic ion (WSII) concentrations in CD, NJ, and CQ (2012–2013).
CDNJCQ
PM10 (μg m−3)125.8 ± 74.4116.3 ± 54.7101.0 ± 51.7
PM2.5 (μg m−3)86.7 ± 49.778.6 ± 36.871.7 ± 36.9
Na+ (μg m−3)0.45 ± 0.230.21 ± 0.090.25 ± 0.12
NH4+ (μg m−3)9.0 ± 5.18.2 ± 3.68.0 ± 3.5
K+ (μg m−3)1.23 ± 1.221.17 ± 0.940.77 ± 0.45
Mg2+ (μg m−3)0.07 ± 0.040.06 ± 0.060.04 ± 0.03
Ca2+ (μg m−3)0.44 ± 0.280.35 ± 0.210.32 ± 0.17
SO42− (μg m−3)17.7 ± 11.218.1 ± 10.017.6 ± 9.6
NO3 (μg m−3)11.9 ± 10.37.1 ± 7.17.8 ± 6.5
Cl (μg m−3)2.46 ± 2.170.95 ± 0.880.69 ± 0.75
WSII (μg m−3)43.0 ± 27.936.2 ± 18.435.4 ± 18.4
Number of samples605963
SO233.3 ± 20.634.7 ± 16.928.1 ± 17.3
NO276.6 ± 27.433.2 ± 15.939.8 ± 18.9
Table 2. The correlation coefficients (R) between NO3 and cations in PM2.5 of CD, NJ, and CQ.
NO3SeasonNa+NH4+K+Mg2+Ca2+
CDSpring0.520.890.320.20−0.17
Summer0.720.760.71−0.150.40
Autumn0.750.950.800.400.78
Winter0.840.950.670.590.59
NJSpring0.120.190.620.000.06
Summer0.590.380.730.62−0.08
Autumn0.650.870.560.19−0.06
Winter0.550.760.370.080.06
CQSpring0.640.700.470.130.01
Summer0.750.670.590.010.57
Autumn0.700.810.670.390.20
Winter0.760.900.320.200.40
Note: characters in bold denote significance under 95% confidence level.
Table 3. Seasonal variation of sulfur oxidation ratio (SOR) and nitrogen oxidation ratio (NOR) in CD, NJ, and CQ.
SORNOR
CDNJCQCDNJCQ
Spring0.270.280.440.080.070.23
Summer0.490.410.500.090.110.07
Autumn0.330.430.340.140.250.17
Winter0.330.290.410.180.260.28
Annual0.350.340.410.120.170.19
Table 4. NO3/SO42− ratios and NOR/SOR ratios under four different PM2.5 levels.
PM2.5 (μg m−3)CDNJCQ
NO3/SO42−NOR/SORNO3/SO42−NOR/SORNO3/SO42−NOR/SOR
PM2.5 < 750.960.300.600.430.620.37
75 ≤ PM2.5 < 1150.890.340.720.510.990.75
115 ≤ PM2.5 < 1501.320.590.790.720.640.66
150 ≤ PM2.51.340.570.930.861.150.84
Table 5. PCA factor loadings of WSIIs in CD, NJ, and CQ.
CDNJCQ
F 1F 2F 3F 1F 2F 3F 1F 2F 3
Na+0.740.450.220.700.340.450.530.610.39
NH4+0.960.080.190.070.510.840.790.550.04
K+0.470.730.010.680.340.210.790.270.23
Mg2+0.270.250.890.810.03−0.040.020.100.88
Ca2+−0.040.810.350.83−0.180.150.400.040.77
Cl0.770.480.030.200.880.100.190.920.16
SO42−0.850.060.350.220.080.960.890.230.19
NO30.930.130.08−0.810.880.300.370.87−0.05
Eigenvalues4.901.190.683.711.800.934.621.320.77
% of variance61.114.98.546.422.511.757.816.59.6

