Article

An Assessment of the Suitability of Active Green Walls for NO2 Reduction in Green Buildings Using a Closed-Loop Flow Reactor

1
Plants and Environmental Quality Research Group, School of Life Sciences, Faculty of Science, University of Technology Sydney, Sydney, NSW 2007, Australia
2
Centre for Green Technology, School of Civil and Environmental Engineering, University of Technology Sydney, Sydney, NSW 2007, Australia
*
Author to whom correspondence should be addressed.
Atmosphere 2019, 10(12), 801; https://doi.org/10.3390/atmos10120801
Submission received: 22 October 2019 / Revised: 2 December 2019 / Accepted: 10 December 2019 / Published: 11 December 2019
(This article belongs to the Special Issue Green Buildings and Indoor Air Quality)

Abstract

:
Nitrogen dioxide (NO2) is a common urban air pollutant that is associated with several adverse human health effects from both short and long term exposure. Additionally, NO2 is highly reactive and can influence the mixing ratios of nitrogen oxide (NO) and ozone (O3). Active green walls can filter numerous air pollutants whilst using little energy, and are thus a candidate for inclusion in green buildings, however, the remediation of NO2 by active green walls remains untested. This work assessed the capacity of replicate active green walls to filter NO2 at both ambient and elevated concentrations within a closed-loop flow reactor, while the concentrations of NO and O3 were simultaneously monitored. Comparisons of each pollutant’s decay rate were made for green walls containing two plant species (Spathiphyllum wallisii and Syngonium podophyllum) and two lighting conditions (indoor and ultraviolet). Biofilter treatments for both plant species exhibited exponential decay for the biofiltration of all three pollutants at ambient concentrations. Furthermore, both treatments removed elevated concentrations of NO and NO2, (average NO2 clean air delivery rate of 661.32 and 550.8 m3∙h−1∙m−3 of biofilter substrate for the respective plant species), although plant species and lighting conditions influenced the degree of NOx removal. Elevated concentrations of NOx compromised the removal efficiency of O3. Whilst the current work provided evidence that effective filtration of NOx is possible with green wall technology, long-term experiments under in situ conditions are needed to establish practical removal rates and plant health effects from prolonged exposure to air pollution.

1. Introduction

Nitrogen dioxide (NO2) is a common urban air pollutant that is largely associated with combustion processes, particularly traffic-related emissions [1,2]. High concentrations of NO2 remain problematic across many urban centres despite the implementation of vehicle emissions controls over several decades [3]. Frequently, in large urban centres, ambient outdoor NO2 concentrations, and thus human exposure, exceed the World Health Organisation’s guideline values of 200 μg/m3 (short-term: 1 h mean) and 40 μg/m3 (long-term: annual mean) [4]. Indoor NO2 exposure is associated with a range of respiratory symptoms and decreased pulmonary and lung function [5,6,7,8,9] and increases in NO2 concentrations are associated with increases in all-cause mortality and hospital admissions [10]. Consequently, increased risk to public health has emerged with the growing evidence of the health effects linked to elevated NO2 exposure [11]. As is the case with most emissions, roadside emissions may make a considerable contribution to the NO2 concentration of nearby indoor environments [12].
In addition to problems arising from NO2 exposure, NO2 can act as an ozone (O3) precursor [13] and is readily photolysed to nitrogen dioxide (NO) [14]. The relationship between O3 and NOx (oxides of nitrogen, i.e., NO + NO2) is very important, as NOx are highly reactive and promote O3 formation in the presence of sunlight, high temperatures, and other atmospheric gases such as methane and volatile organic compounds (VOCs) [15,16].
Current indoor environmental quality management systems for buildings are reliant on heating, ventilation and air-conditioning systems (HVAC) to manage indoor air quality and climate. These functions are based around ventilation with fresh air; however, this air must be temperature modulated, using very large quantities of energy [17]. Furthermore, some green building certification schemes promote increased mechanical ventilation as the preferred or only method to maintain indoor air quality [18]. While ventilation is effective in many circumstances, simply increasing ventilation rates may not provide improved indoor air quality for all areas, particularly those with high outdoor pollution or episodic and uncontrolled release of gaseous air pollutants. Common ventilation systems do not filter gaseous pollutants such as NO2, and thus the use of mechanical ventilation may increase the rate at which outdoor generated pollutants infiltrate into the indoor environment [19]. We propose that it would therefore be beneficial if green building schemes included foci on reducing human–air pollution exposure such as rewarding actions that result in source control and energy efficient means of air pollution reduction. It is thus paramount to advance technologies capable of controlling NO2 concentrations both near the emission source (i.e., roadsides) and in areas relevant to urban peoples’ breathing zones (i.e., the indoor environment).
Although plants can phytoremediate NO2, their ability to filter NO2 is primarily limited to studies that have assessed the potential of urban forestry to provide enhanced air quality [20]. NO2 can be removed through both dry deposition to the leaf surface and direct dissolution into a water film present on the plant surface [21]. It has been estimated that urban trees can remove considerable volumes of NO2 from the ambient air: Nowak et al. [22] estimated that urban trees in the coterminous United States are capable of removing ~97,800 t of NO2 per year at a value of USD $660 million. Despite these benefits, it has been suggested that in some cases, plants may compromise the air quality as their emission of biogenic VOCs interacts with urban NOx to produce ozone [23]. Nonetheless, fusing the removal mechanisms of the plant foliage with biofiltration technology to create active green walls (botanical biofilters) has proven to be an efficient means for the removal of other gaseous pollutants, primarily different species of VOCs [24], however, it is unknown whether botanical biofilters are capable of filtering NOx, and what implications this may have for the ambient O3 concentration.
Active green wall technology has been proposed as an effective and innovative approach for indoor gaseous pollutant control [25]. Active green walls are a green technology that can simultaneously treat a large number of air pollutants at a relatively low cost. This technology builds upon the vast literature purporting the air phytoremediation potential of potted plants ([24,26,27,28], plus references therein). Whilst pollutant reduction by potted plants has been well described, for in situ use, such systems will be severely limited in their efficacy [29]. Several recent studies have reported that green wall systems, in particular active green walls, have a high capacity to phytoremediate several air pollutants including particulate matter (PM) [30,31] and VOCs [32,33]. Regarding green wall VOC removal, biodegradation of VOCs by the rhizospheric bacteria along with substrate adsorption are considered as the primary sinks for VOC removal [24,34], however, plant-associated effects also play a role in VOC removal [35]. In the current experiment, all treatments contained both plants and substrate as discriminating between the substrate and plant effects are of no interest in practical applications of this technology. Green walls have practical advantages over potted plants for practical pollutant removal due to their increased plant density, vertical alignment, and the efficiency with which polluted air can be passed through the substrate and roots through the use of mechanically-assisted ventilation, which is a defining characteristic of active systems. Furthermore, their design allows them to have potential applications in both unique high-pollution applications such as traffic tunnels and carparks as well as in green buildings to achieve an energy efficient equivalent to ventilation and thermal comfort [36]. This has led to the possibility of maintaining indoor air quality through the biofiltration of air recirculating through the active green wall within a building, rather than through the traditional approach of ventilation through HVAC systems [37].
Previous research testing the pollutant removal capabilities of this technology has been limited to VOCs [33,37,38,39], CO2 [40], and PM [30,31] and thus the use of active green wall technology for the remediation of other criteria air pollutants including NO2 remains untested. In addition to these previously tested functions, a potential reduction of the ambient NOx concentration through botanical biofiltration is an important consideration that could further improve air quality and reduce occupant exposure to these pollutants. Plant species-dependent differences in NO2 removal have been linked to stomatal uptake in trees [41], however, if active botanical biofiltration systems primarily remove NO2 through substrate-pollutant adsorption and dissolution into the aqueous phase, it is possible that differences in NO2 removal amongst different plant species will be less variable. Additionally, it is possible that the potential reactions between NO2 and VOCs including biogenic VOCs associated with the biofilter itself may have implications for the concentrations of associated pollutants such as NO and O3 [42]. Despite potential reductions in the NO2 concentration through phytoremediation, any production of NO or O3 is clearly problematic if botanical systems are placed in environments with high concentrations of NO2.
This work provides the first assessment of the botanical biofiltration of NOx with O3 concentrations simultaneously monitored. Specifically, this work assessed the capacity of active green walls to remove both ambient and elevated concentrations of NO2, with comparisons made between two plant species (Spathiphyllum wallisii and Syngonium podophyllum) that are commonly grown in active green walls. Additionally, the associated gases, NO and O3, were simultaneously monitored to ensure that potential reductions of one hazardous chemical did not lead to the production of an alternative hazardous gas.

2. Methods

2.1. Biofilter Design and Plant Selection

Replicate biofilters were housed in open-ended poly vinyl chloride (PVC) pipe (88 mm internal diameter, 120 mm in length). Each PVC pipe contained a coconut husk-based growth substrate packed to a depth of 85 mm to represent a realistic active green wall substrate depth that would be sufficient to support plant growth, as has been tested in previous research [34,43]. Coconut husk is a favourable substrate for use as a growth substrate in botanical biofilters as it has not been associated with bioaerosol emissions [44], and has a demonstrated capacity to filter VOCs [33] and PM [30]. The substrate was retained within the pipe by loose weave high-density polyethylene (HDPE) cloth at each end of the pipe. A single plant was planted into each biofilter; the plant roots were supported by the substrate while the aerial phytomass grew through a small incision cut through the HDPE cloth (Figure 1). To provide nutrients to the plants, the growth substrate was fertilised with a general purpose fertiliser (Green Jacket 12–14 month controlled release fertiliser [N-P-K:18-2.5-10; N as nitrate = 8.3%; N as ammonium = 9.8%; N as urea = 0%; P = 2.5%; K as soluble potash = 10%; S = 4%) at an application rate of 4 kg∙m−3 as per the manufacturer’s recommendations (Australian Growing Solutions; Tyabb, Vic, Australia).
Biofilters containing two different plant species were tested for their capacity to filter NO2. These species were Spathiphyllum wallisii (peace lily) and Syngonium podophyllum (arrowhead vine). These species are both common indoor houseplants and green wall species, and both have been tested for their capacity to phytoremediate a range of VOCs [33,45,46,47,48,49,50]. All tested plants were grown in their biofilters in a glasshouse (Sydney, Australia) for ~8 weeks prior to testing. During this period, plants were stored vertically, placed on saucers, and watered to field capacity once weekly. The average solar exposure over this period was 12.4 MJ∙m−2 per day and the average daily photoperiod (bright sun exposure) was 7.65 h [51].

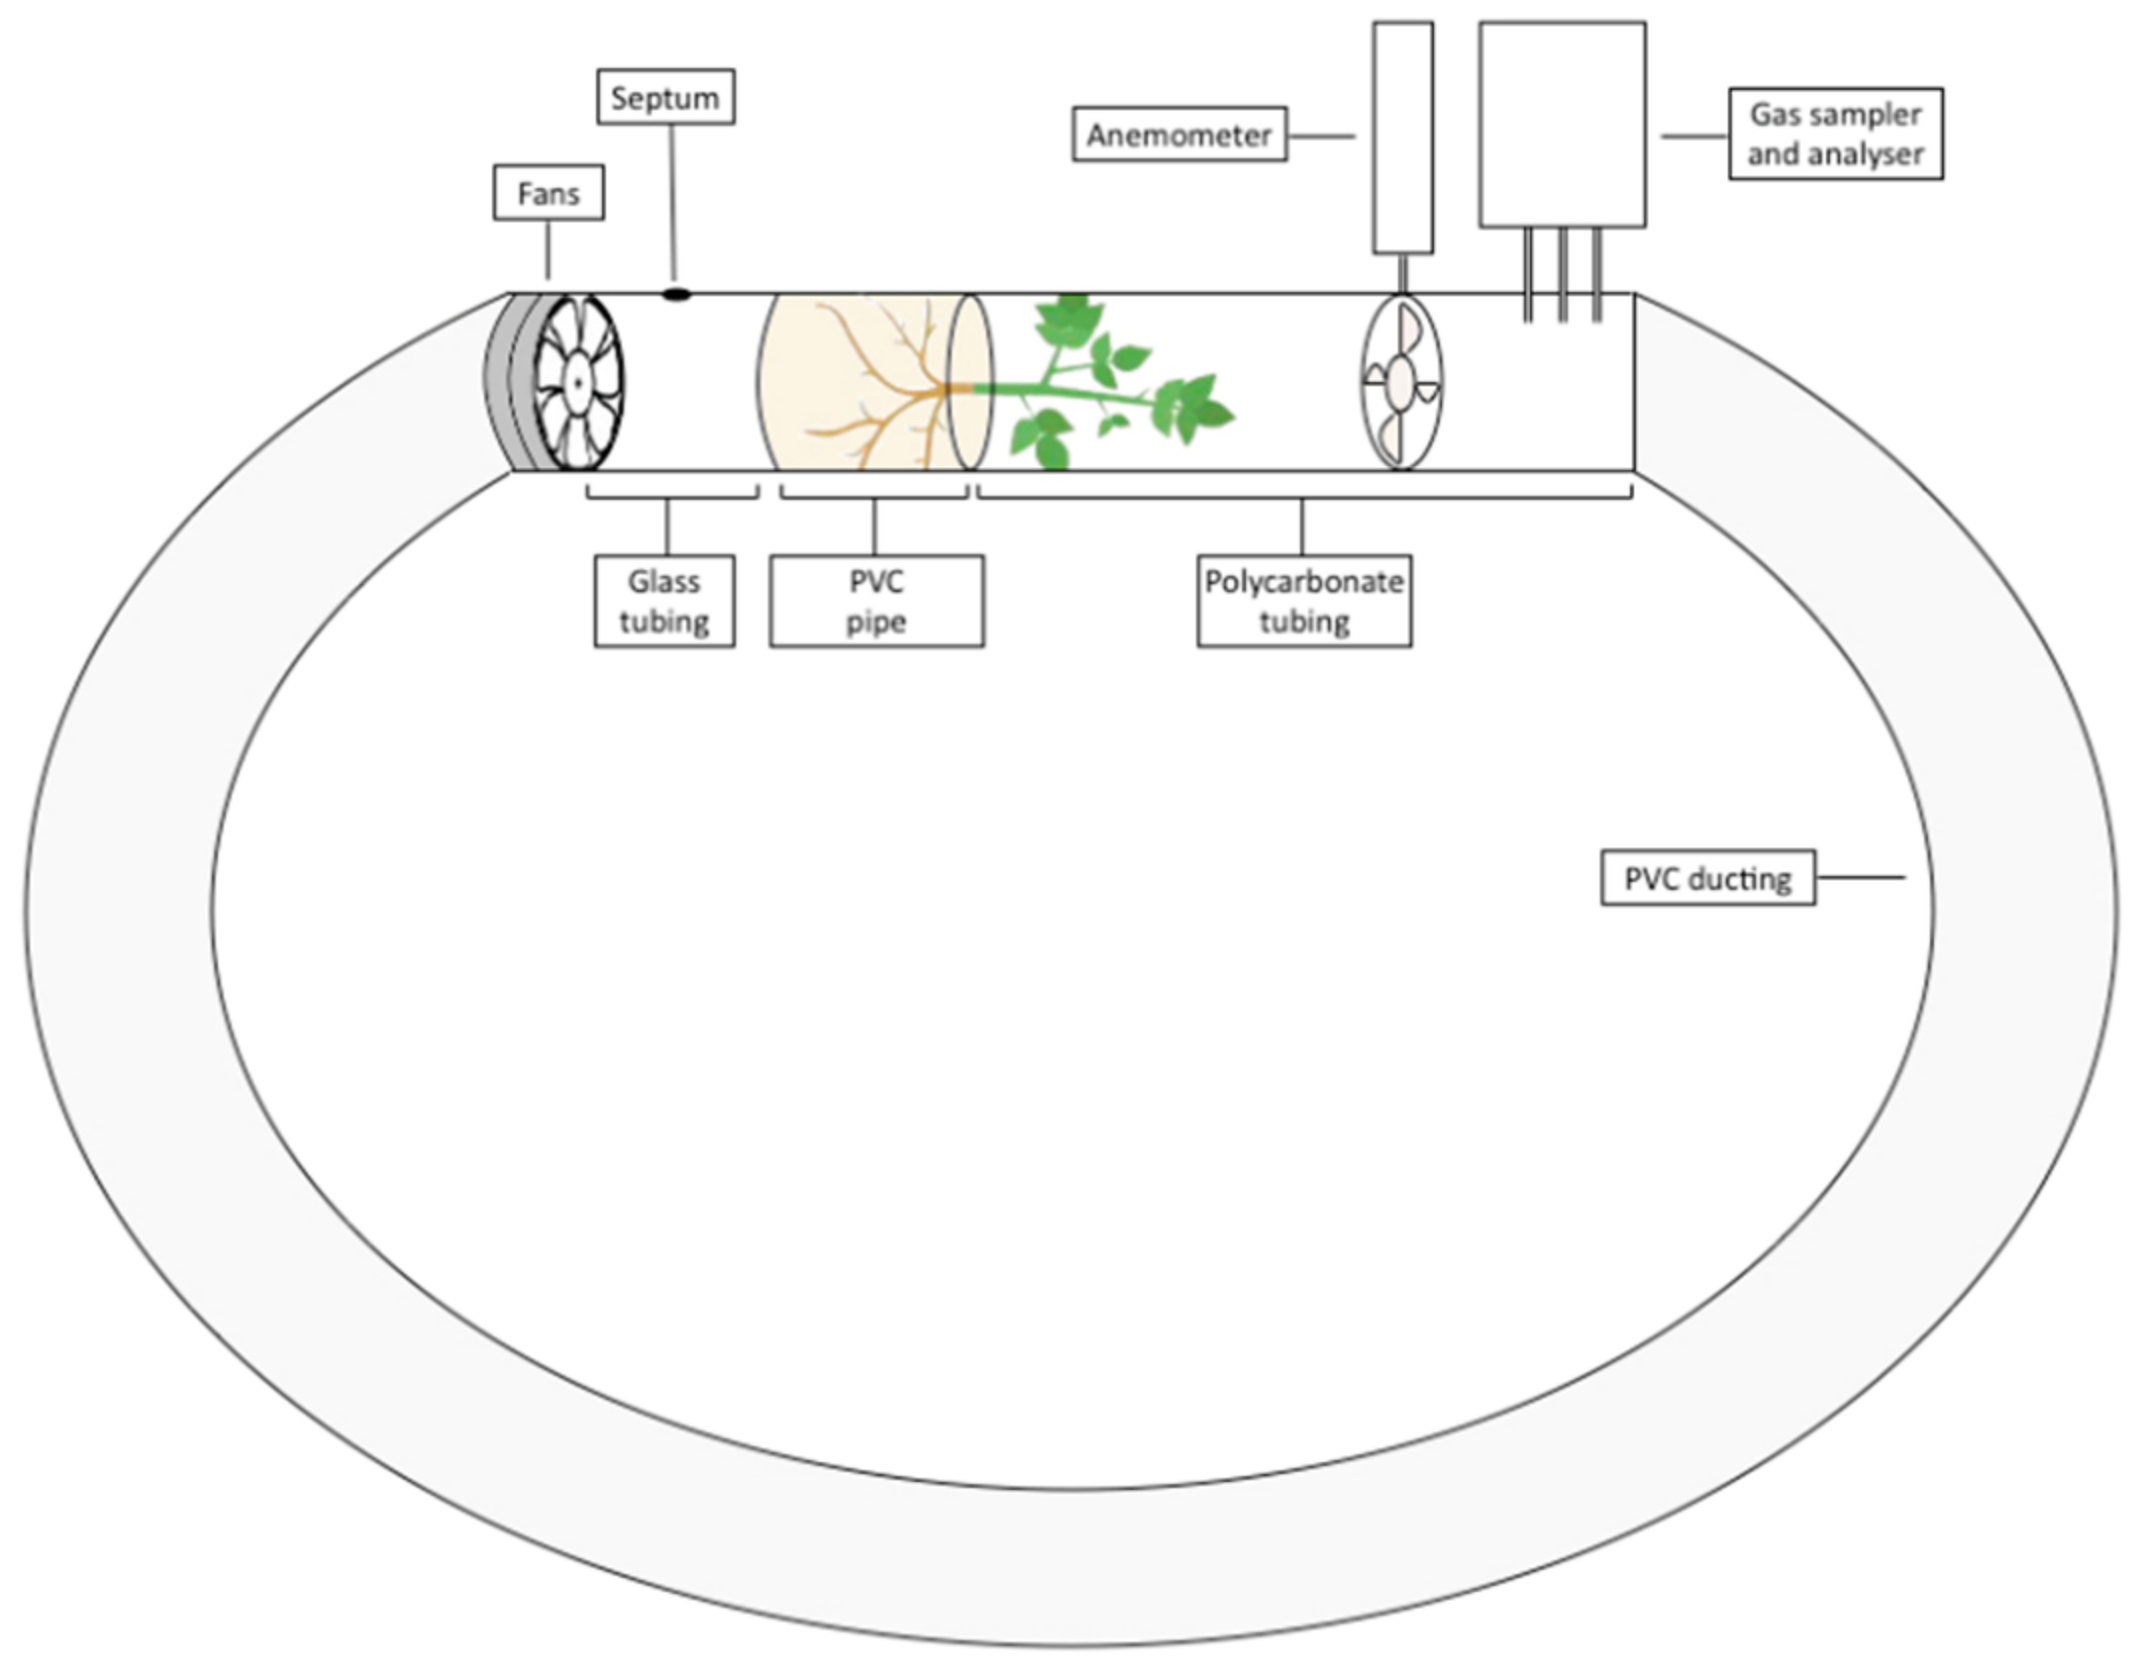
2.2. Closed-Loop Flow Reactor

For testing, botanical biofilters were placed individually into a closed-loop flow reactor (Figure 2). In this system, air circulated through the loop and passed through the biofilter once for each completed circuit. The closed-loop flow reactor, composed of polyvinyl chloride (PVC) ducting, glass tubing, and clear polycarbonate tubing, had a 100 mm internal diameter and was 2.80 m in length with several sensors embedded throughout. Total reactor internal volume was 0.9 m3. Two axial impellers (FANTECH TEF-100 fan 16 W) were ducted in series into the flow reactor to provide active airflow. The fans were connected to a potentiometer to enable modifications to fan power, ensuring each trial was conducted at the same airflow rate. Airflow generated by the fans passed through the biofilter substrate and then the foliage, after which the airstream was exposed to several sensors before return to the axial impellers and thus recirculated through the flow reactor. Pressure drop across the botanical biofilters within the closed loop flow reactor was measured with a Sensirion digital sensor (SDP610 125 Pa) and the average pressure drop was 83.2 and 84.3 Pa for S. wallisii and S. podophyllum, respectively. An anemometer (Digitech Thermo-anemometer QM1646) was embedded on the downstream side of the biofilter to measure the air velocity flowing through the biofilter, from which the volumetric airflow rate could be determined. Instruments for measuring the concentrations of NO, NO2 (Ecotech EC9841 nitrogen oxides analyser), and O3 (Ecotech Serinus 10 ozone analyser) were ducted into the biofilter’s leeward side within the flow reactor with Teflon tubing.
The downstream end of the biofilter from which the plant’s foliage emerged was connected to a clear polycarbonate pipe so that the photosynthetic plant parts were exposed to light. The level of photosynthetically active radiation (PAR) within the section of the flow reactor where the plant foliage was exposed was measured with a LI-250A light meter with an LI 190 Quantum Sensor (LI-COR Biosciences; Lincoln, NE, USA) and had an average photosynthetic flux density of 9.95 µmol∙m−2∙s−1. Finally, a septum located between the axial impellers and biofilter allowed the addition of reagents to the flow reactor to facilitate pollutant generation (see below; Section 2.3.2). All experiments were conducted in a laboratory at 22 °C.

2.3. Pollutant Generation and Experimental Trials

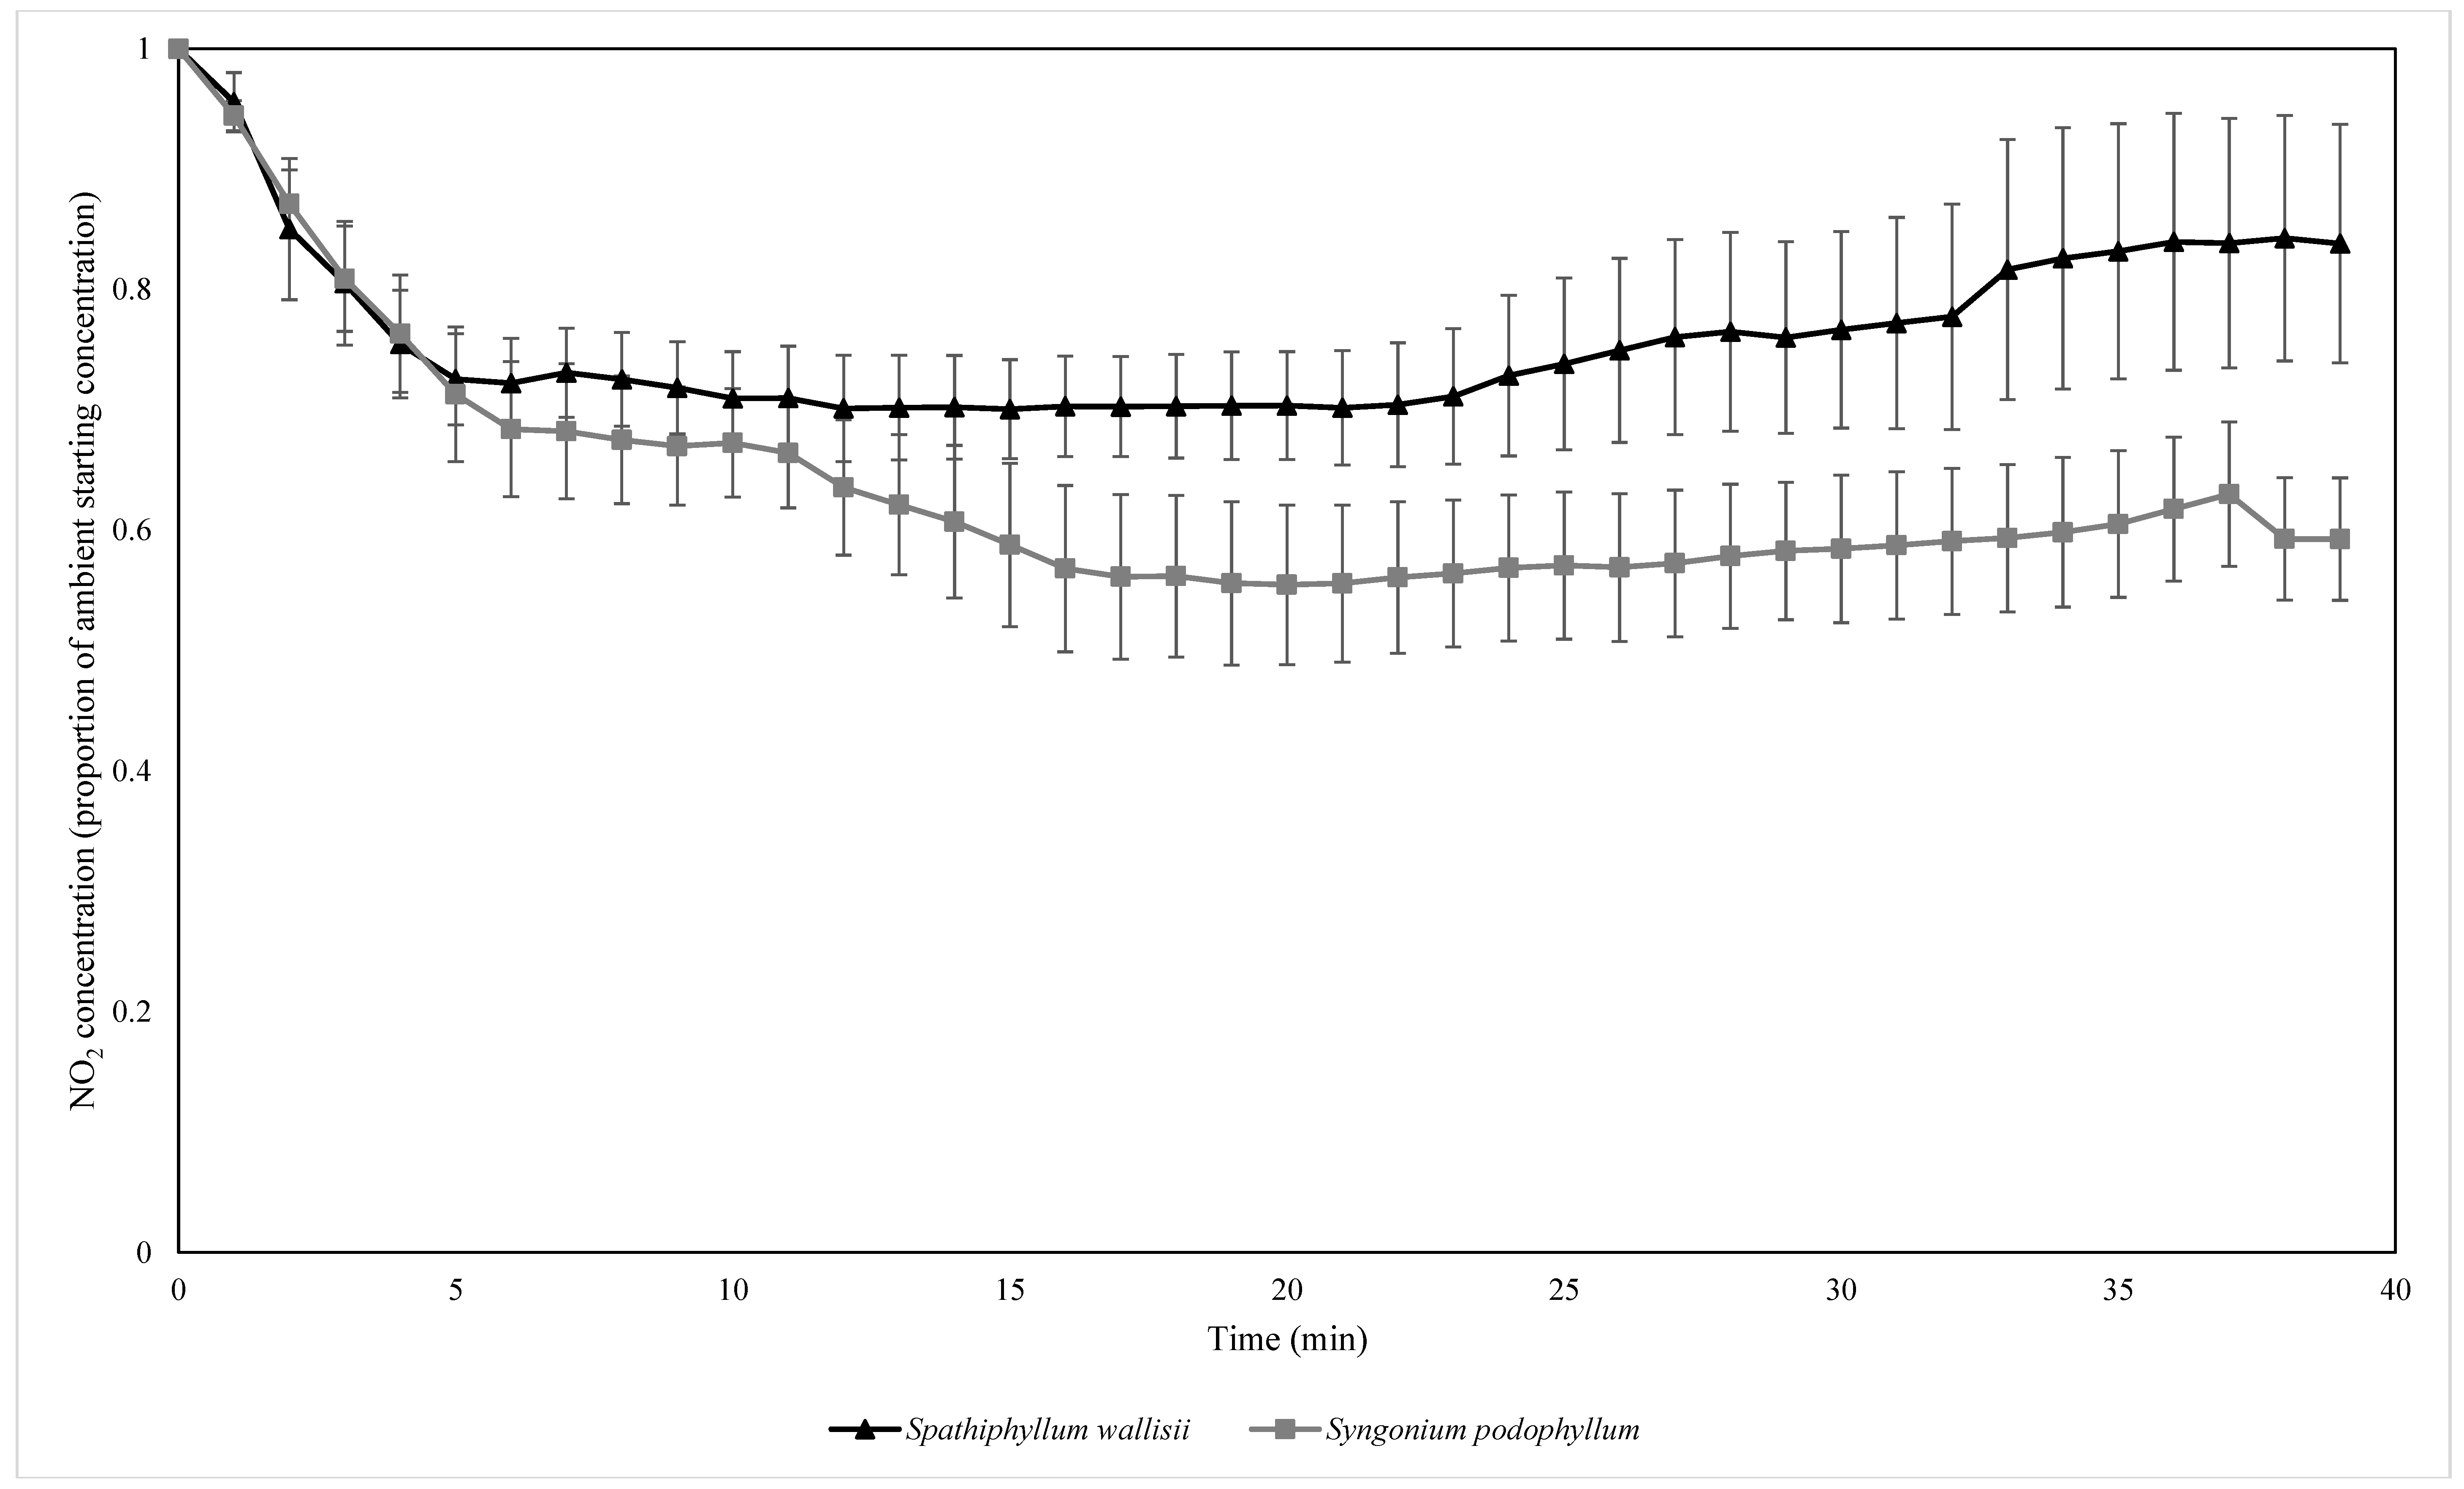
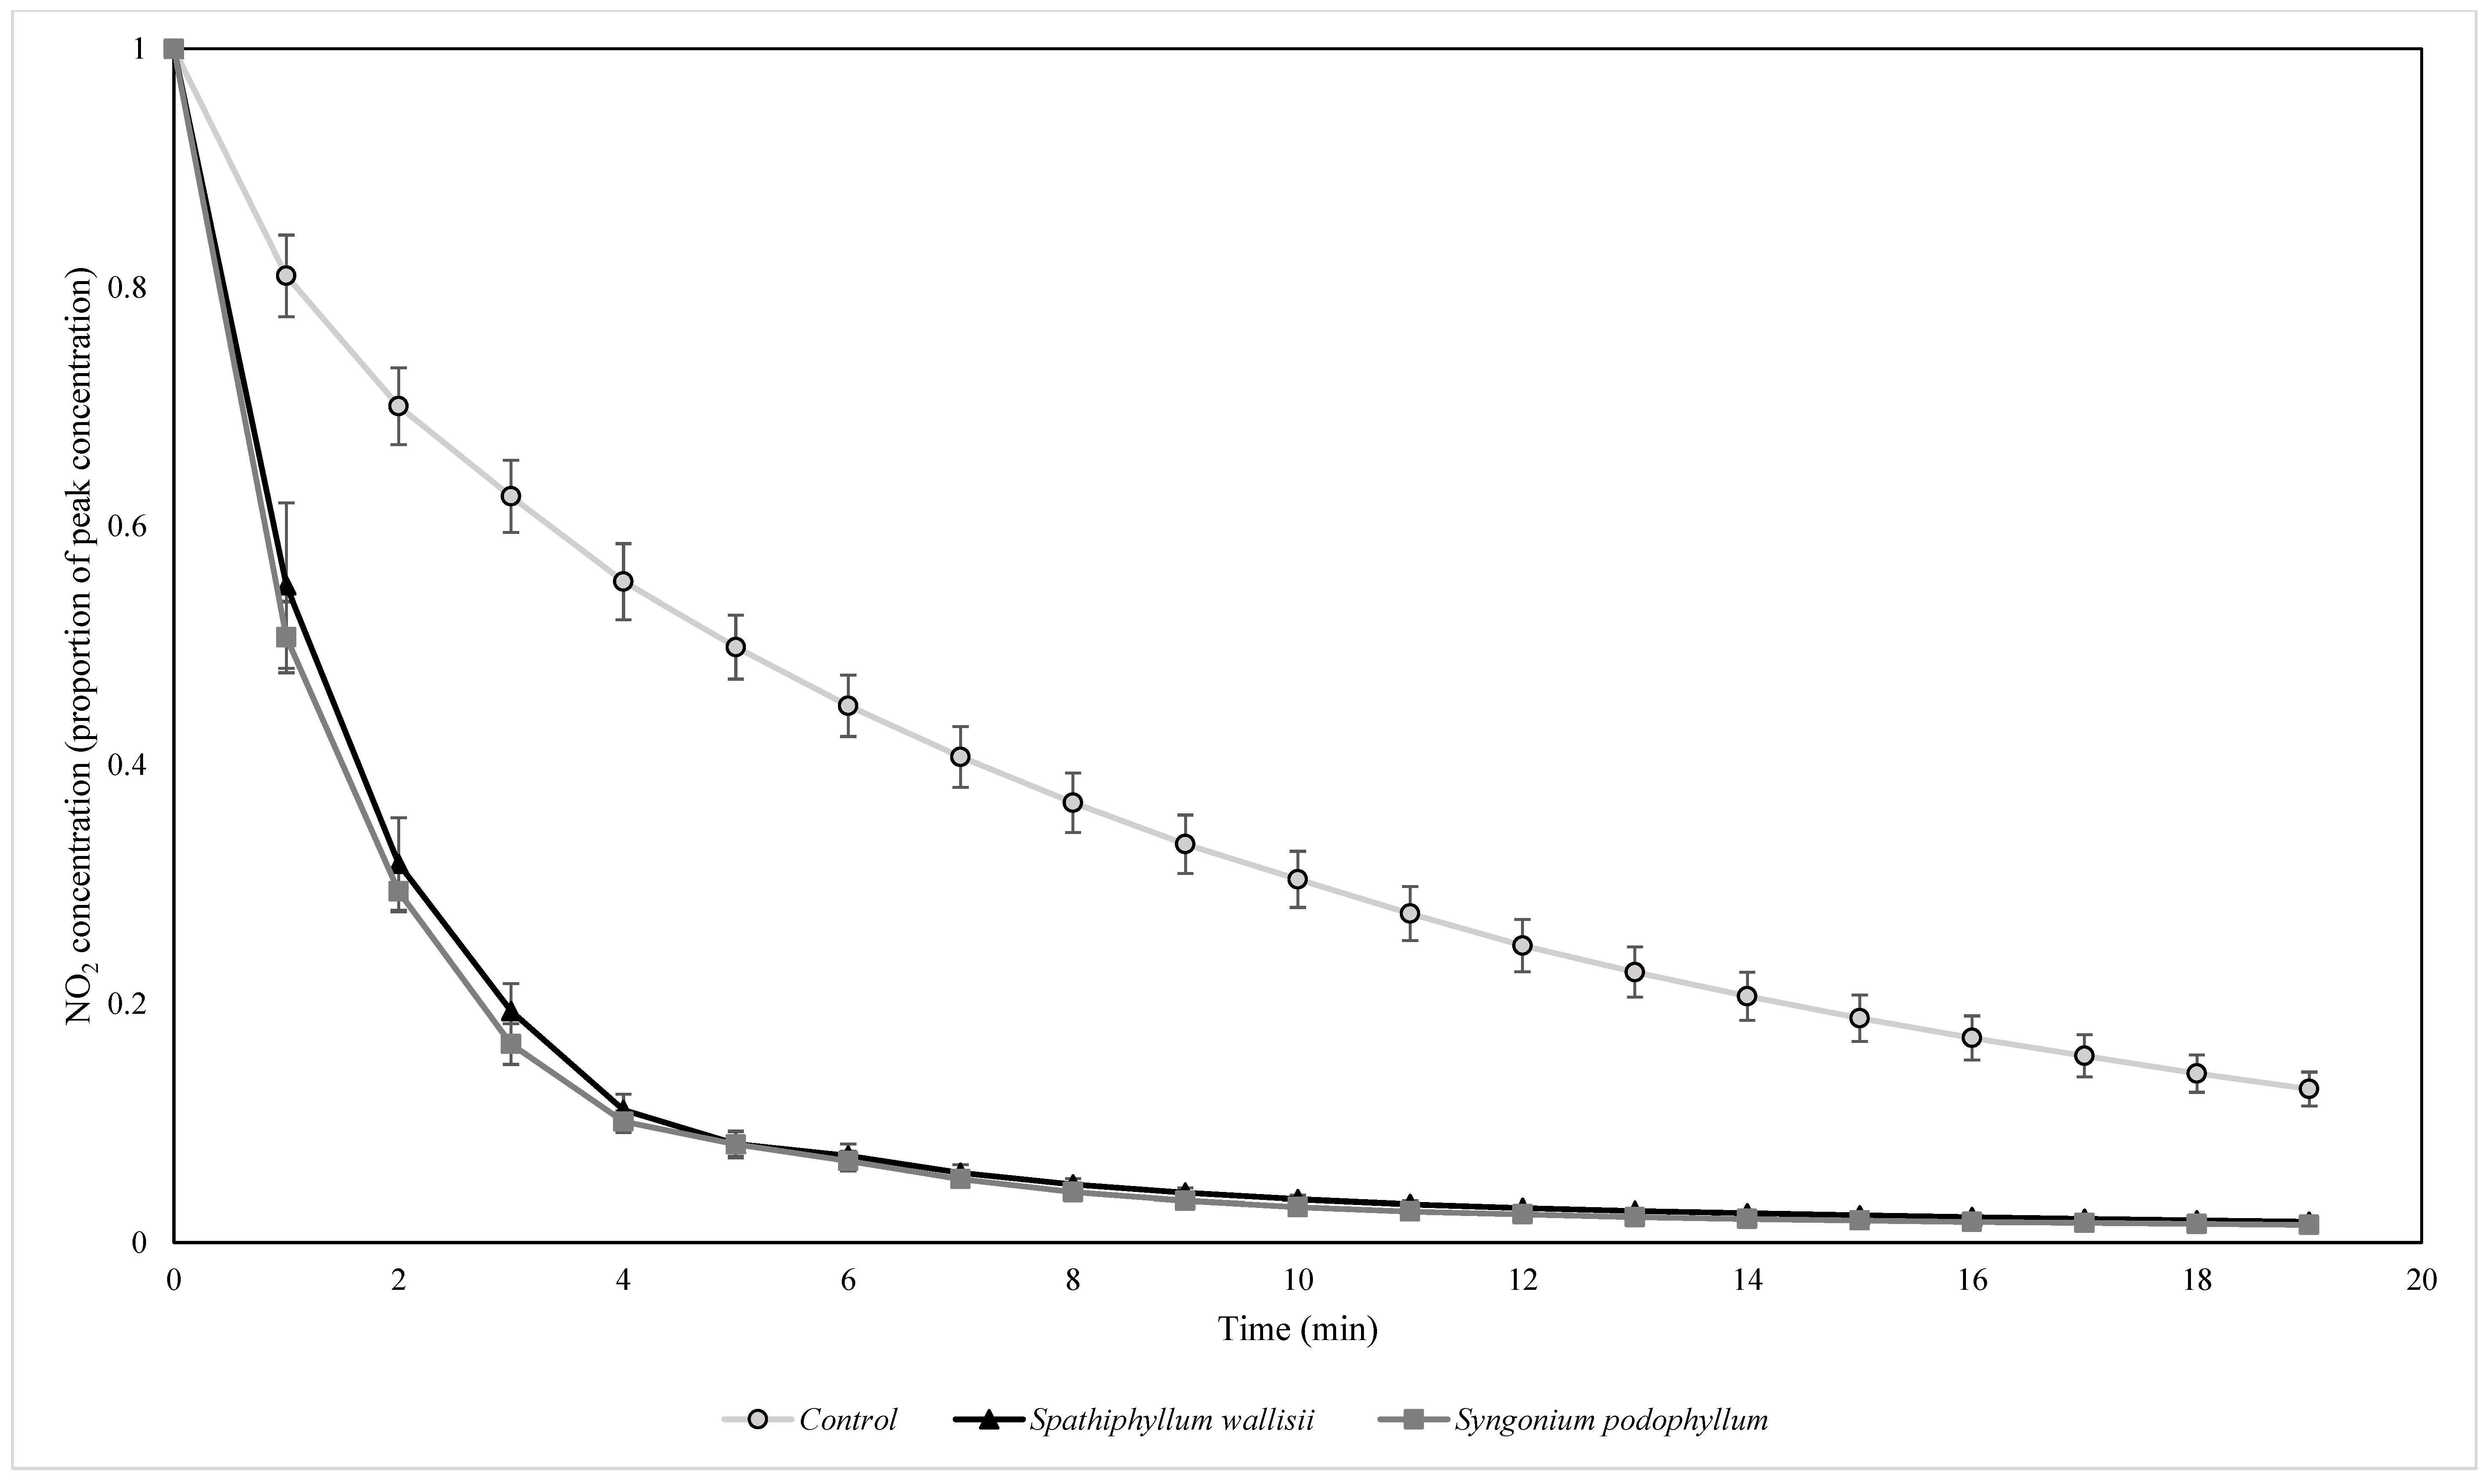
2.3.1. Biofiltration of Ambient NO2

Biofilters were first trialled for their capacity to remove ambient concentrations of NO, NO2, and O3. Six biofilters containing S. wallisii and six biofilters containing S. podophyllum were used for this experiment. Additionally, 10 trials were conducted without any biofilter in the flow reactor to represent a procedural control to account for any effects resulting from loss by diffusion, chemical reactions, and adsorption to the flow reactor surfaces. Species and control treatments were conducted in a randomised order. Trials were run for 40 min, which was sufficient time for the concentration of NO2 to reach an asymptote across both biofilter treatments. The average ambient concentrations of pollutants detected within the flow reactor for the procedural control were 46.39 ± 0.006 ppbv for NO, 70.08 ± 0.017 ppbv for NO2, and 0.486 ± 0.004 ppbv for O3 (Figure S1).

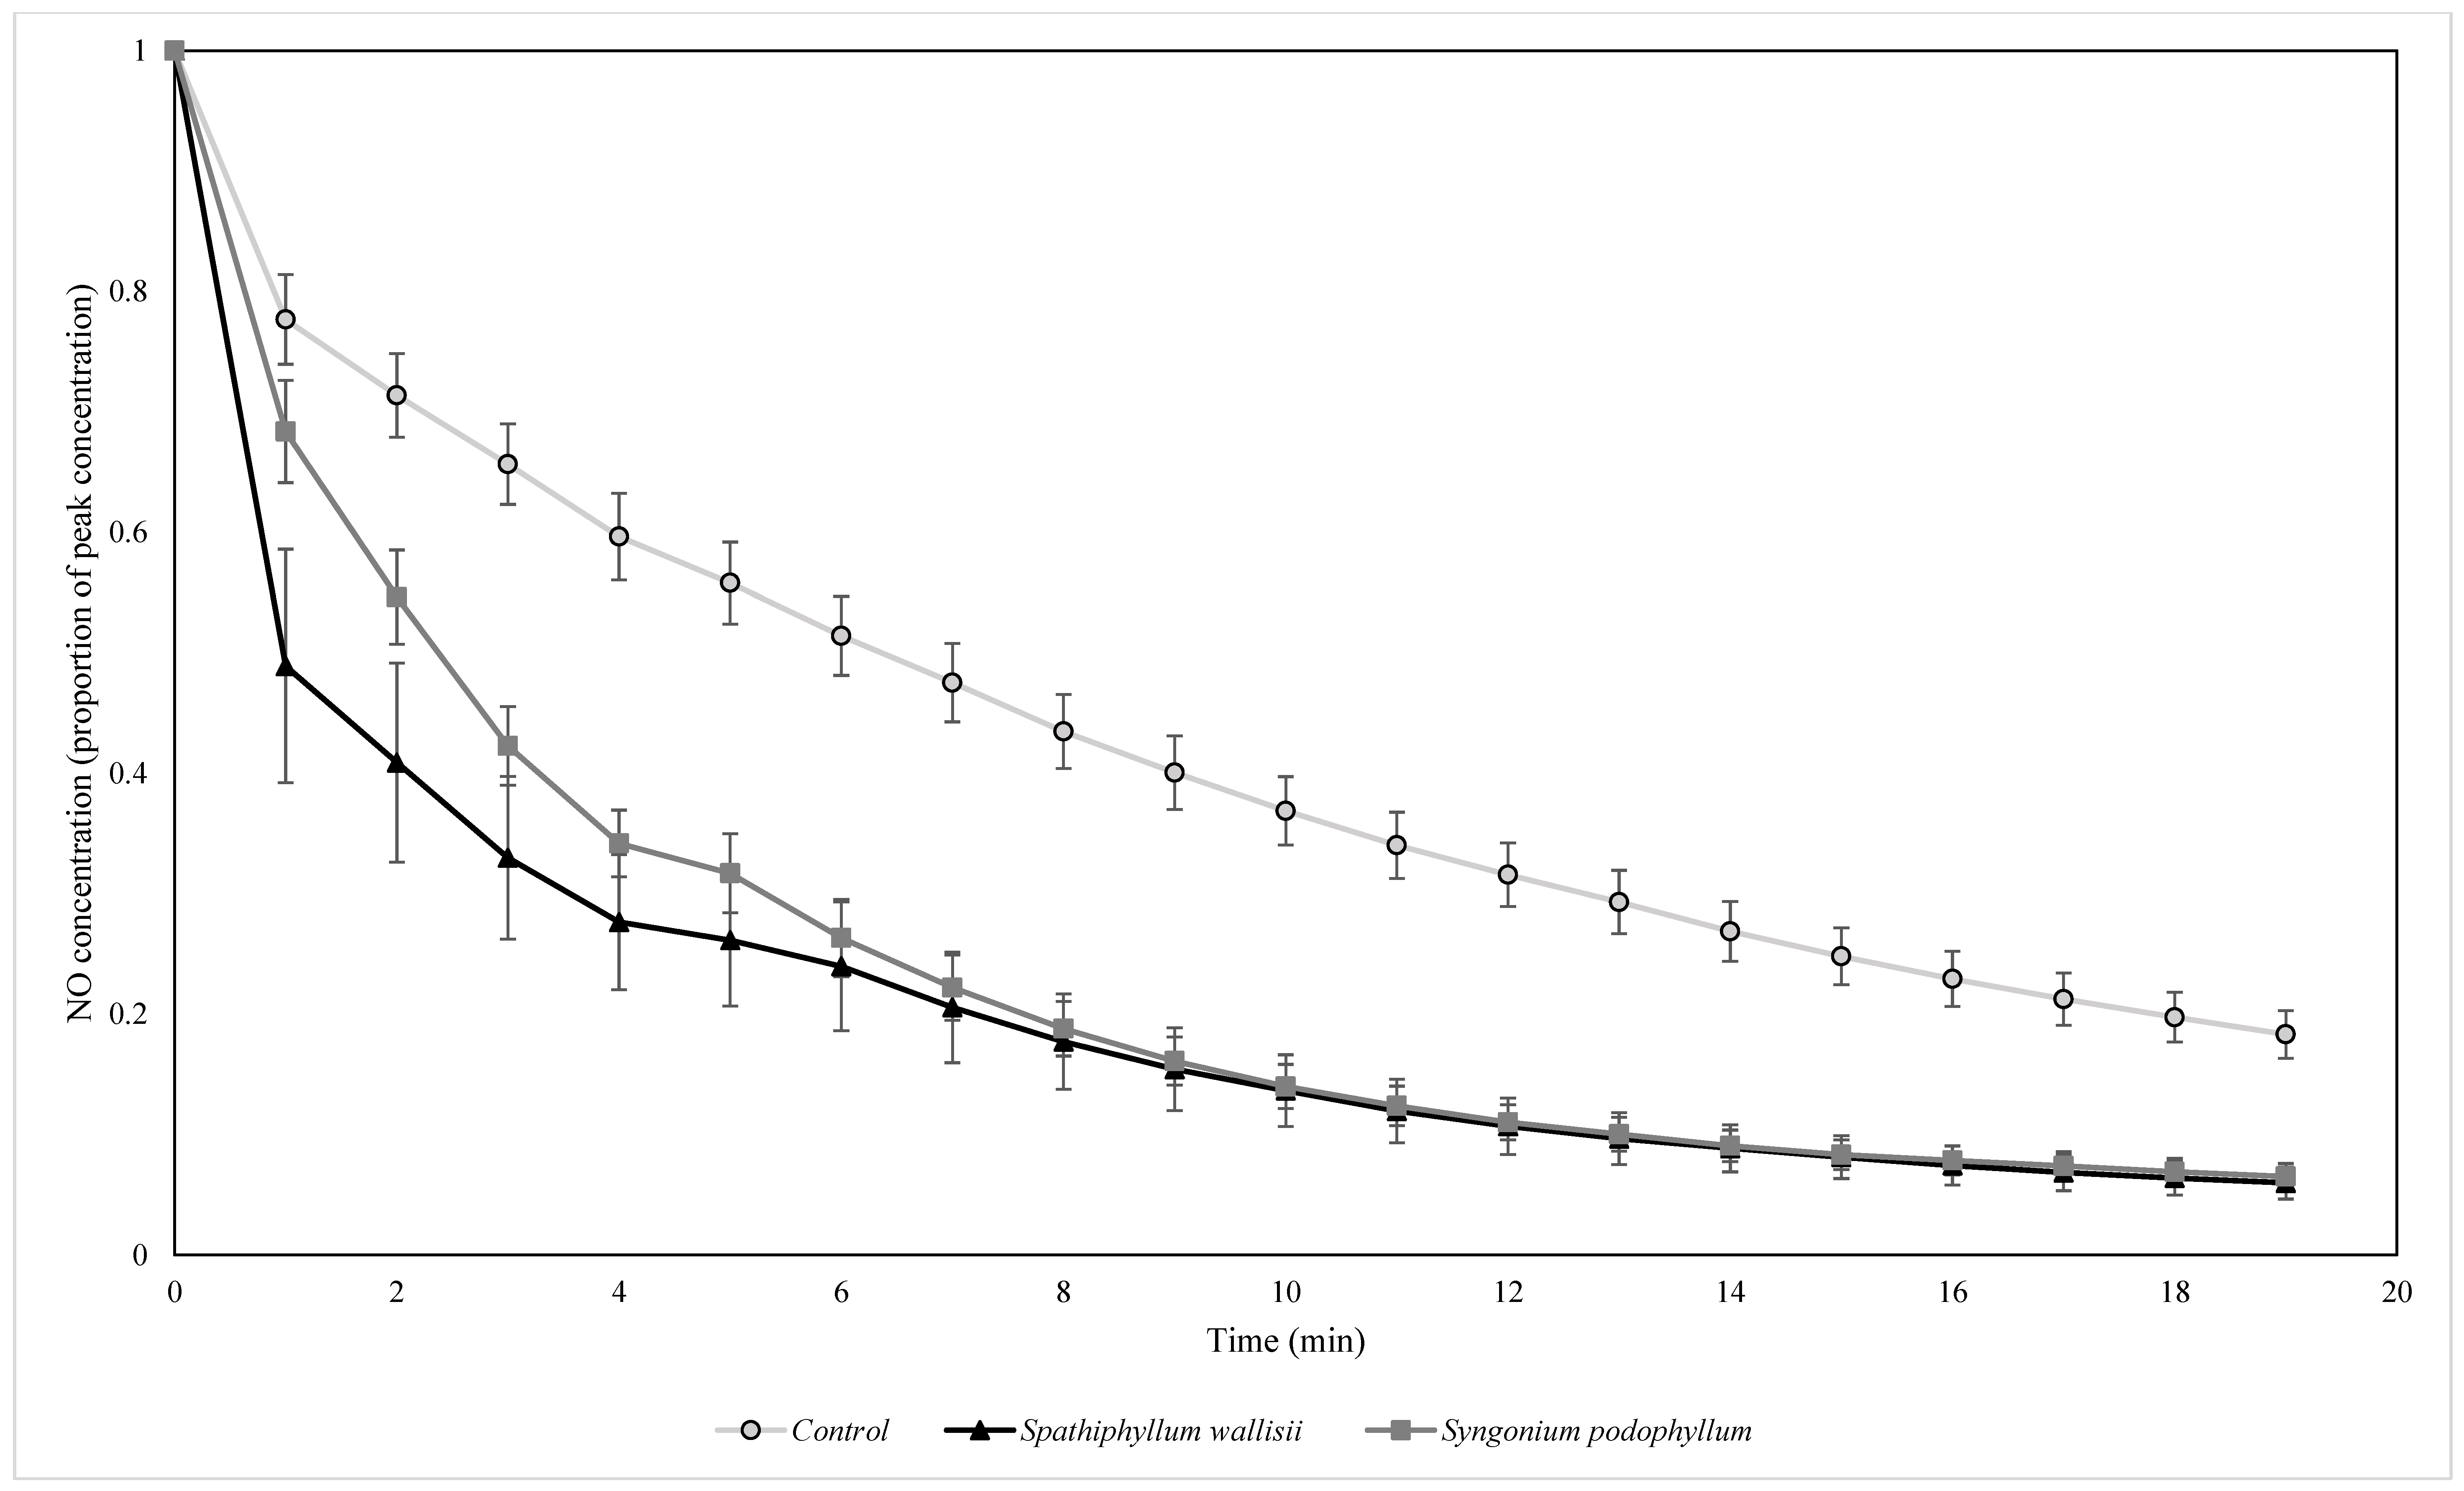
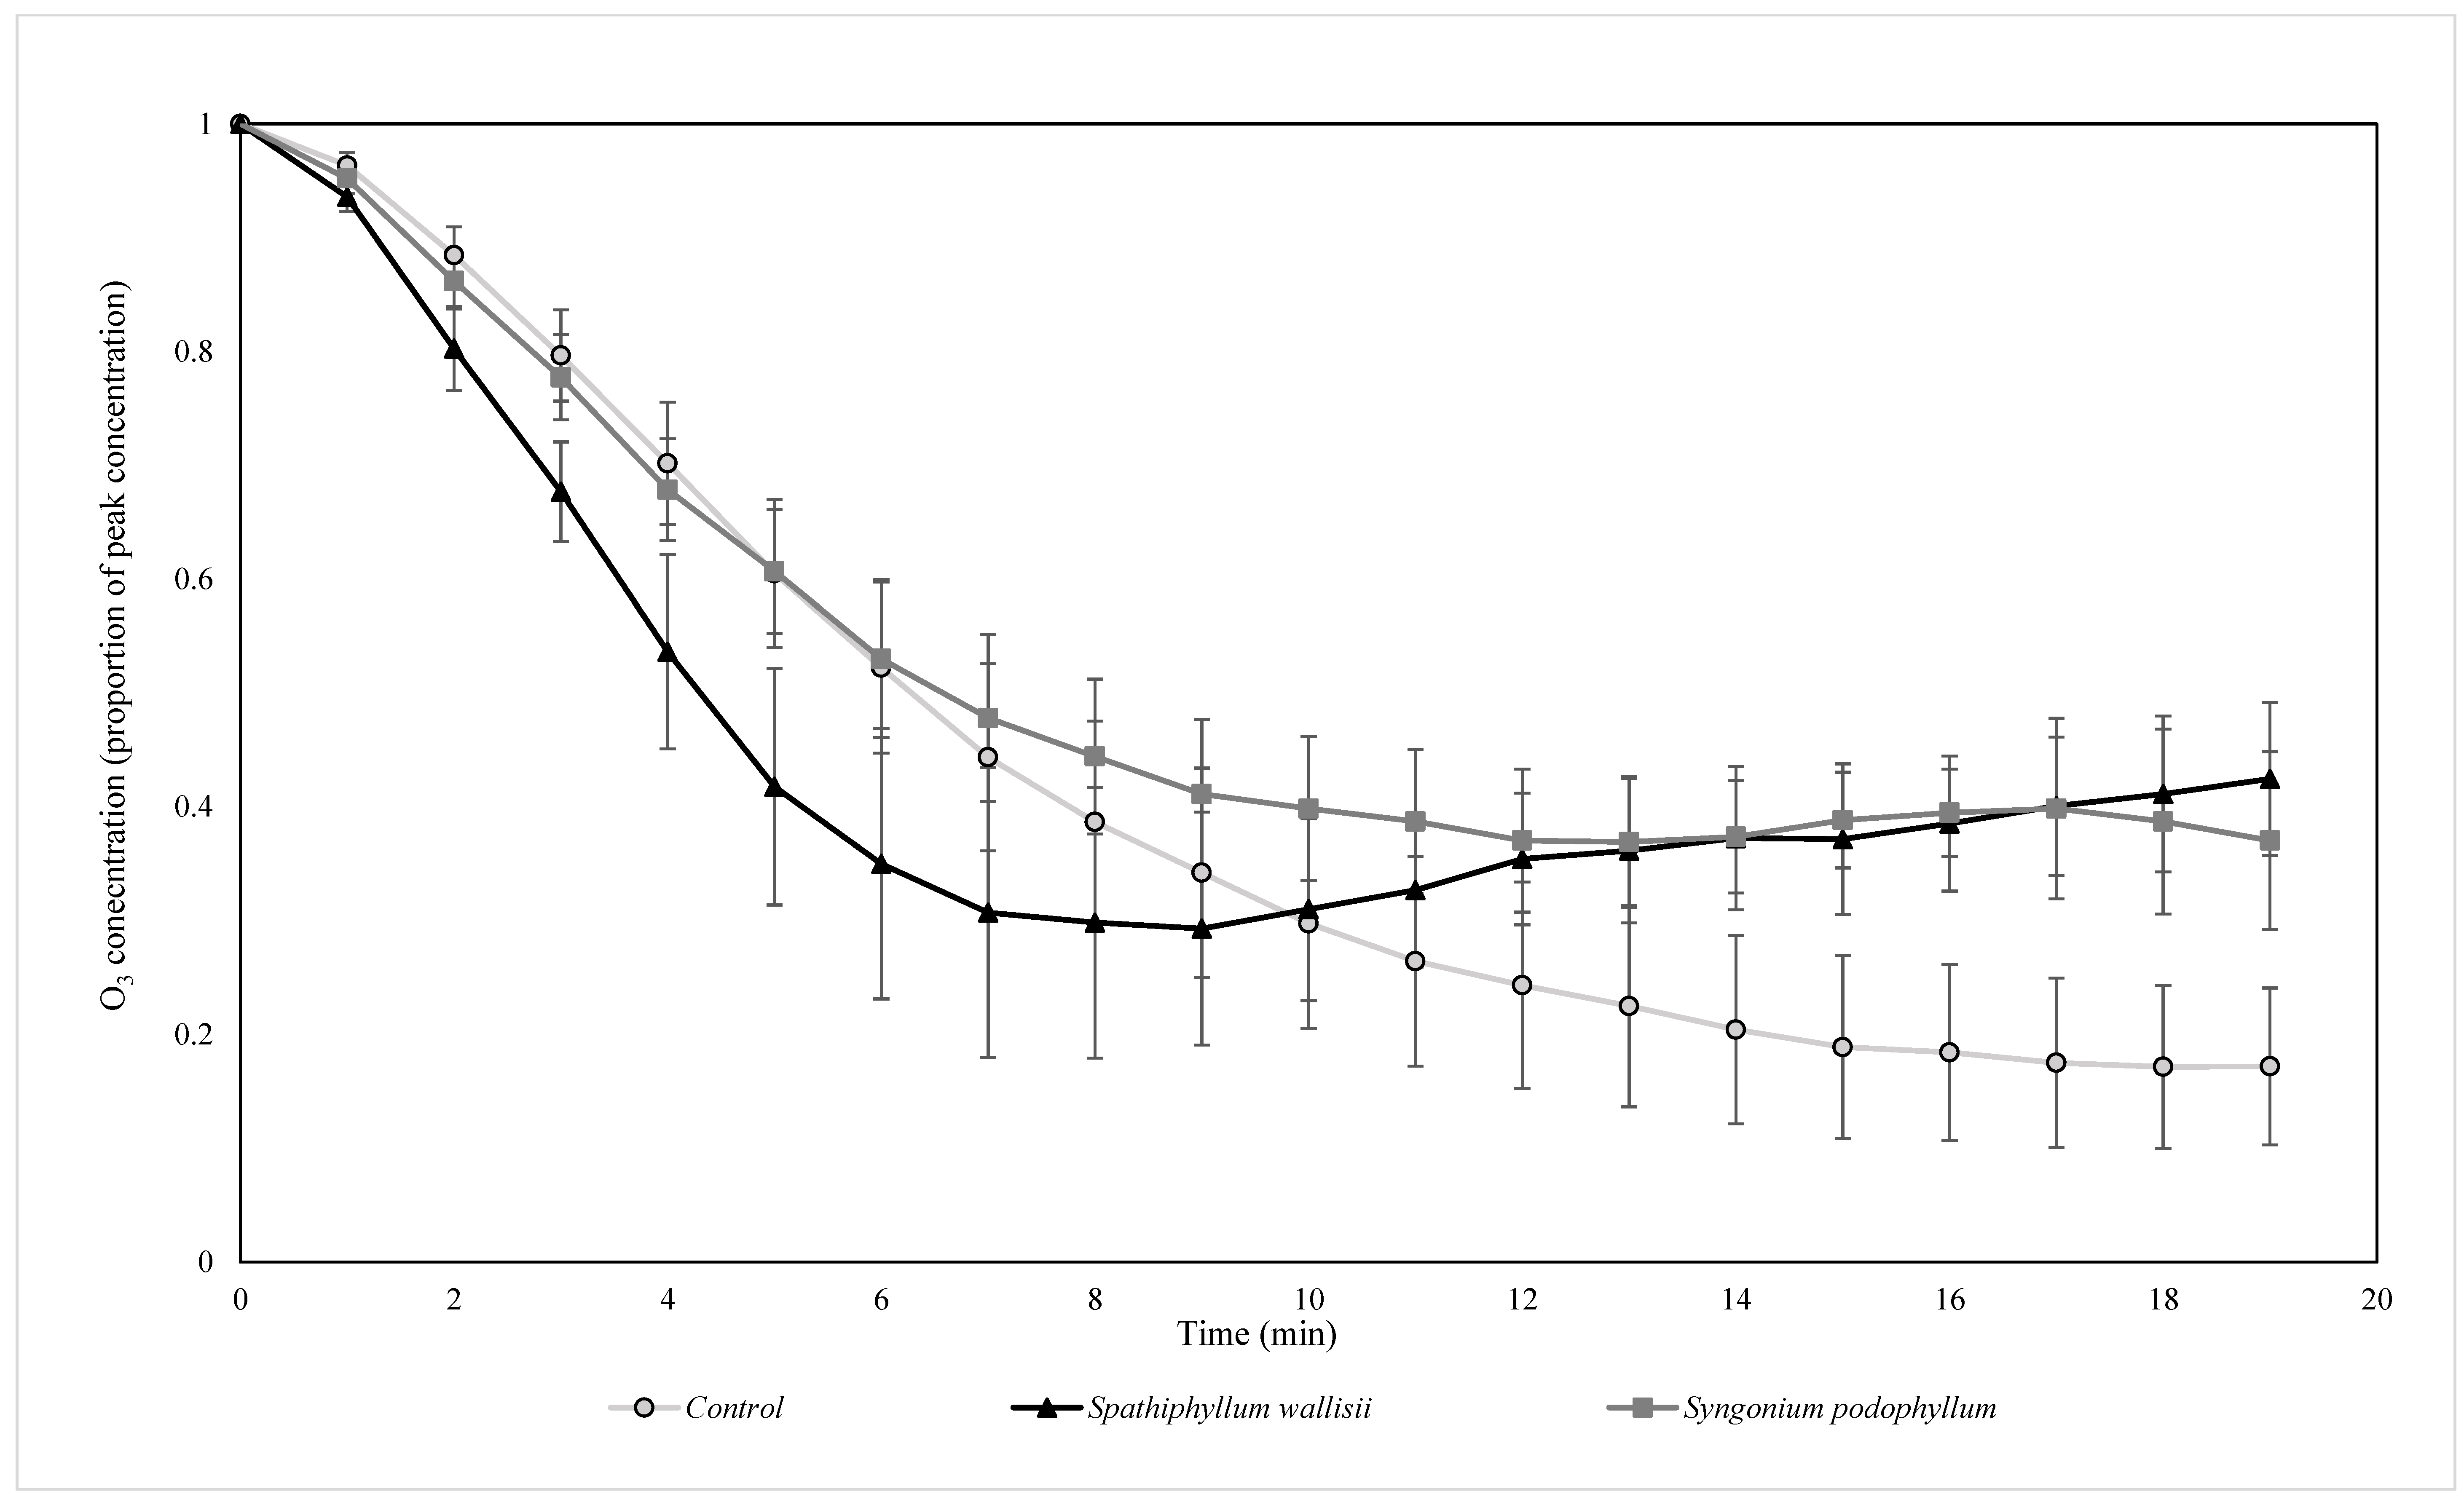
2.3.2. Biofiltration of Elevated NO2 Concentrations

As the concentrations of the trial pollutants within the ambient laboratory atmosphere were unlikely to be representative of pollutant concentrations in urban areas exposed to high traffic density, an additional series of experiments were conducted where biofilters were assessed for their capacity to remove elevated concentrations of NO2. For this experiment, pollutants were generated by placing a 1.00 cm2 × 0.06 mm thick pure copper sheet into the flow reactor between the fans and the biofilter, and beneath the septum. Once the flow reactor was sealed, 1.50 µL of nitric acid (70% AR Grade; UNIVAR Australia Pty. Ltd., Ingleburn, NSW, Austrilia) was injected through the septum onto the copper sheet, thus generating gaseous NO2 by the reaction [52]:
Cu s   +   4 HNO 3 aq     Cu NO 3 2 aq   +   2 NO 2 g   +   2 H 2 O
This produced an average peak NO2 concentration of 6.656 ± 0.607 ppm at the NO2 sensor within the flow reactor, which was similar to the values achieved in other studies assessing non-biological methods for the filtration of NO2 [52]. Additionally, peak NO concentrations of 1.124 ± 0.088 ppm and 7.280 ± 0.064 ppb for O3 were generated.
For this experiment, six biofilters containing S. wallisii and six biofilters containing S. podophyllum were tested. Additionally, 10 trials were conducted without any biofilter in the flow reactor as a procedural control to account for any effects resulting from diffusion, reaction, or adsorption to the flow reactor surfaces, as per experiment 1. All trials were conducted in a randomised order. Trials were run for 20 min, which was sufficient time for the concentration of NO2 to reach an asymptote across both biofilter treatments.

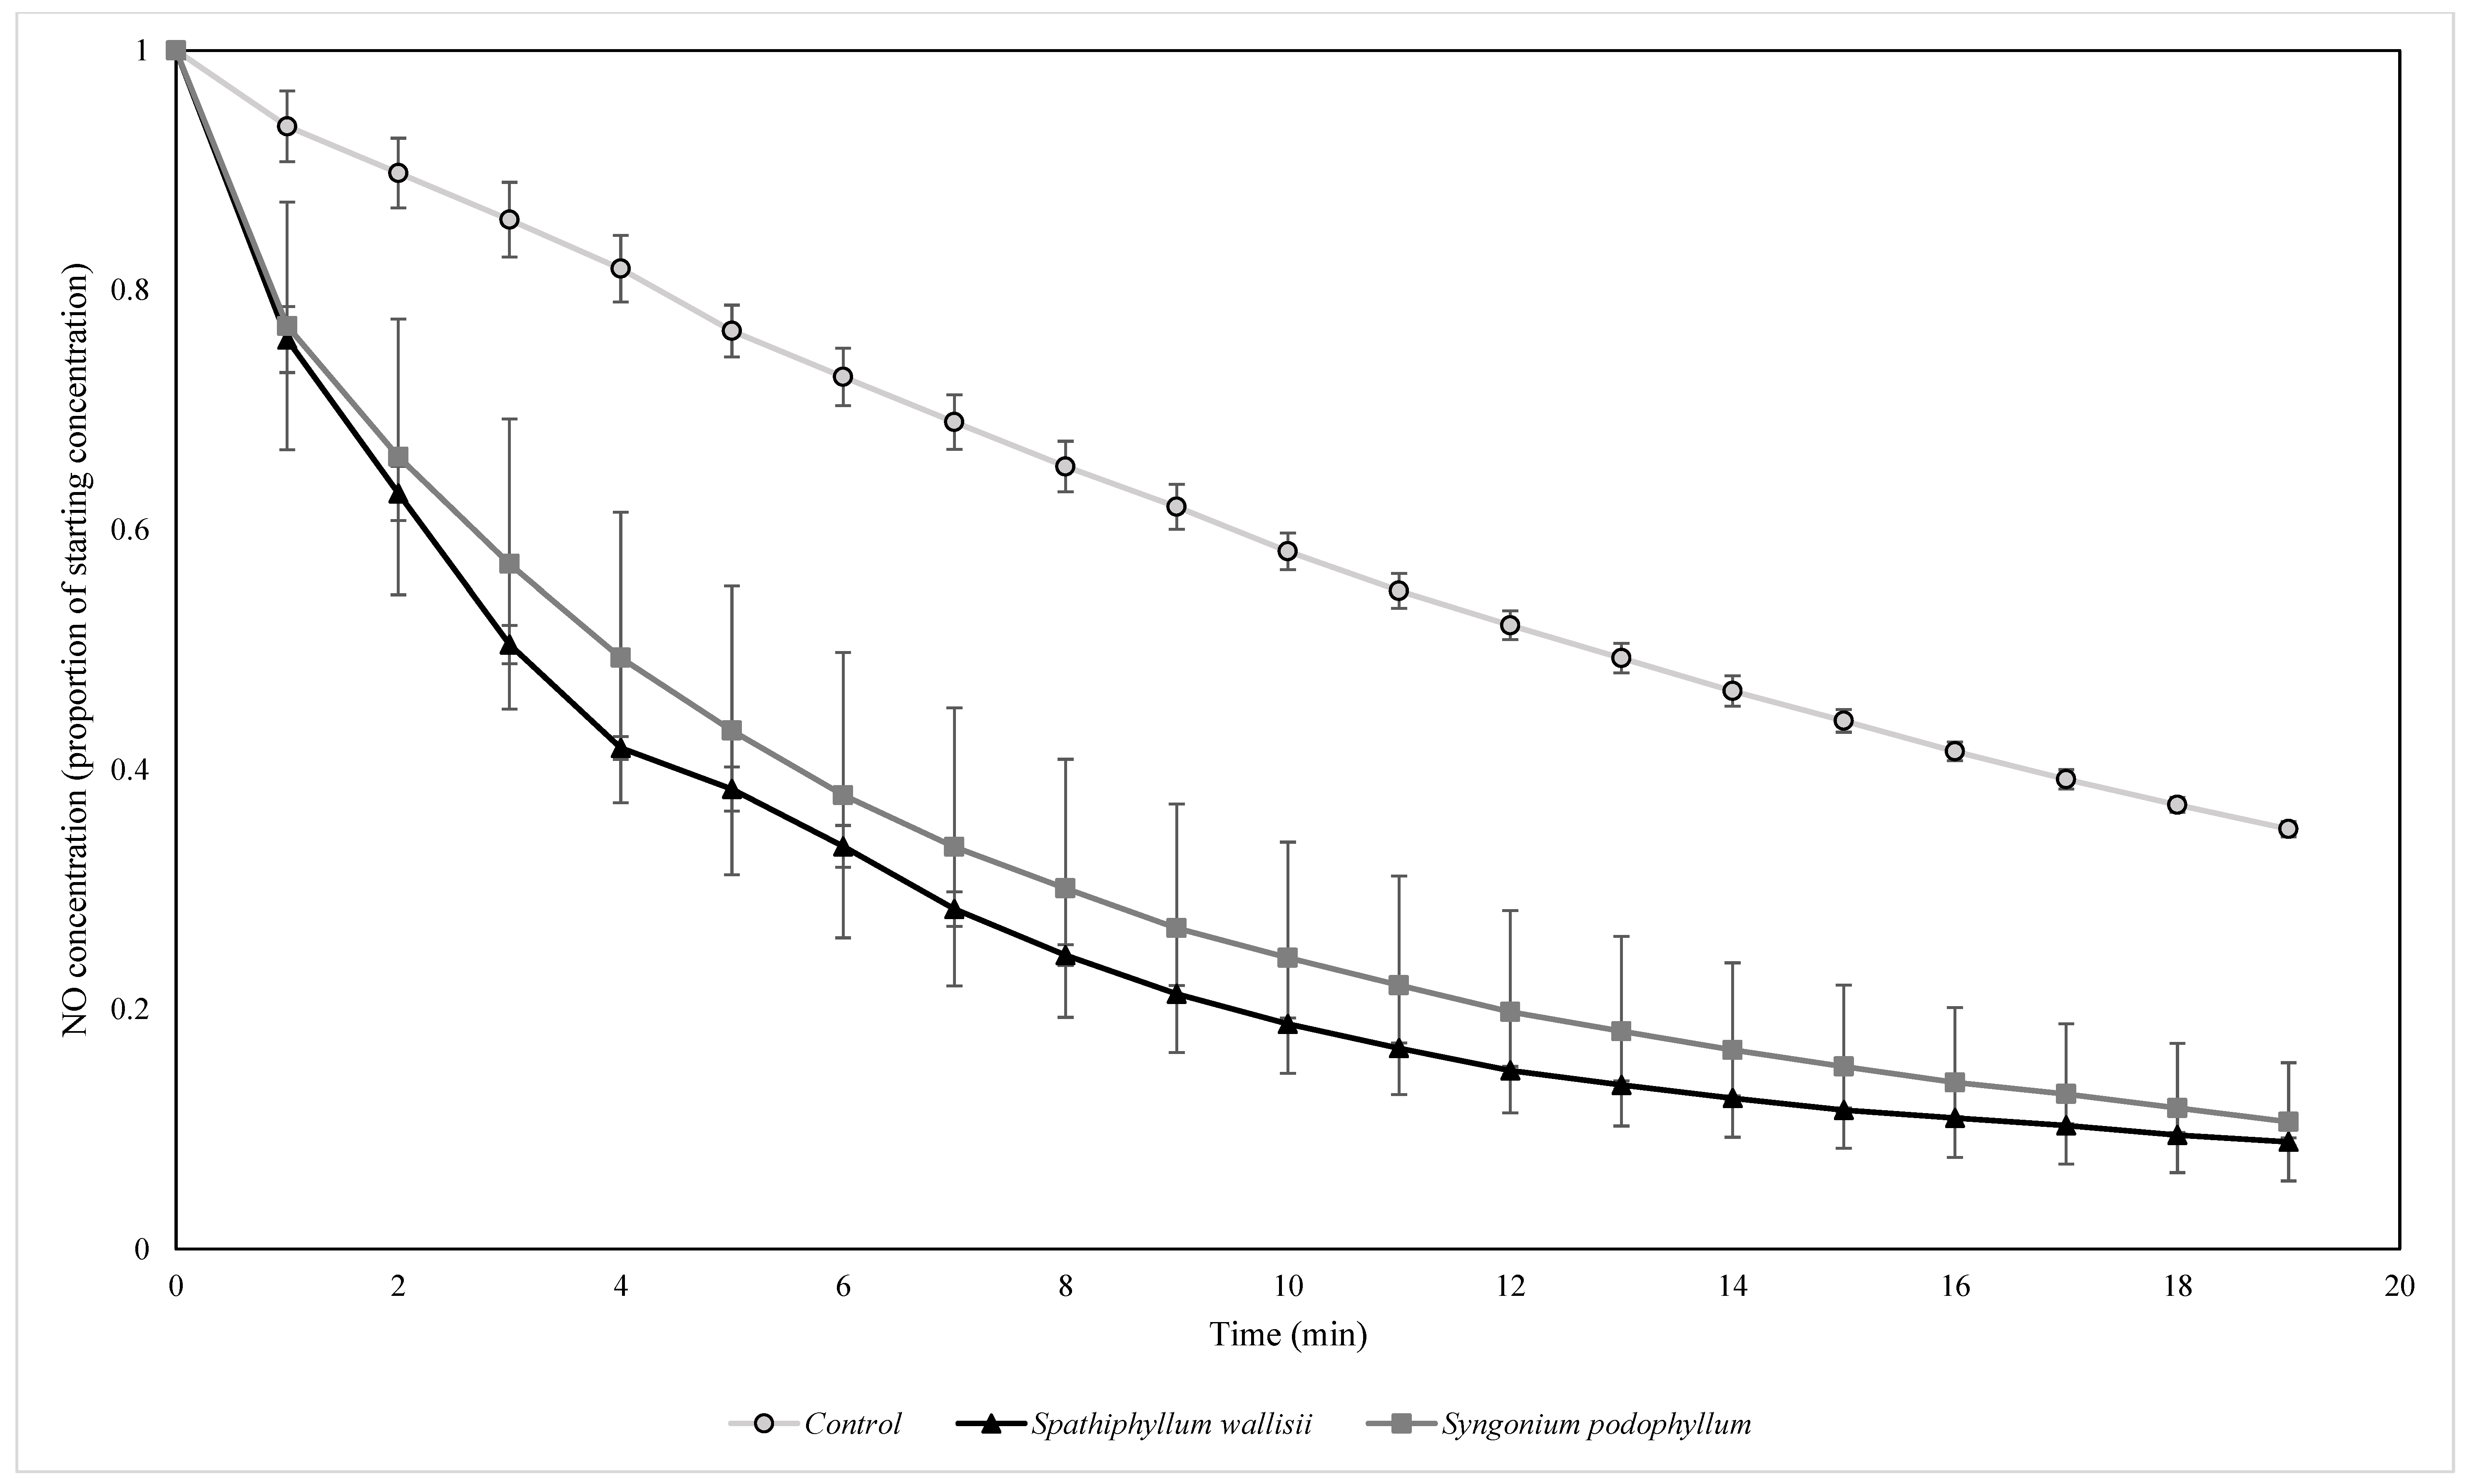
2.3.3. Removal of Elevated NO2 Concentrations with Ultraviolet (UV) Exposure

As exposure to UV can initiate chemical reactions, it is critical to test biofiltration under UV exposure to determine how botanical biofilters might perform under conditions where UV exposure is significant such as outdoors. NO2 is susceptible to photolysis [53], in other words,
NO 2   +   hv   λ     420   nm     O ( 3 P )   +   NO
Additionally, O3 can also be photolysed [54], in other words,
O 3   +   hv   λ     335   nm     O ( 1 D )   +   O 2
Thus, disassociation through photolysis, followed by a series of chemical reactions (often involving VOCs) [54], results in the potential for O3 and NO2 to influence the concentrations of each other. To explore the effects of UV exposure on the concentrations of NOx and O3, a series of experiments were conducted with the flow reactor exposed to UV light. These experiments were conducted using an identical method to that used for the second experiment, however, the closed-loop flow reactor was placed in a biosafety cabinet (Gelaire BH-EN Class II biological safety cabinet) where the system was exposed to artificially generated UV light (germicidal UV peaking at 254 nm at an intensity of 400 mW·m−2) according to Australian Standard AS1807.23, which corresponds to the peak absorption cross section for O3 (σ = 113.05 × 1019 cm2 at 295 K and λ = 253.65) [55]. Four independent replicates of this trial were run.

2.4. Statistical Analysis
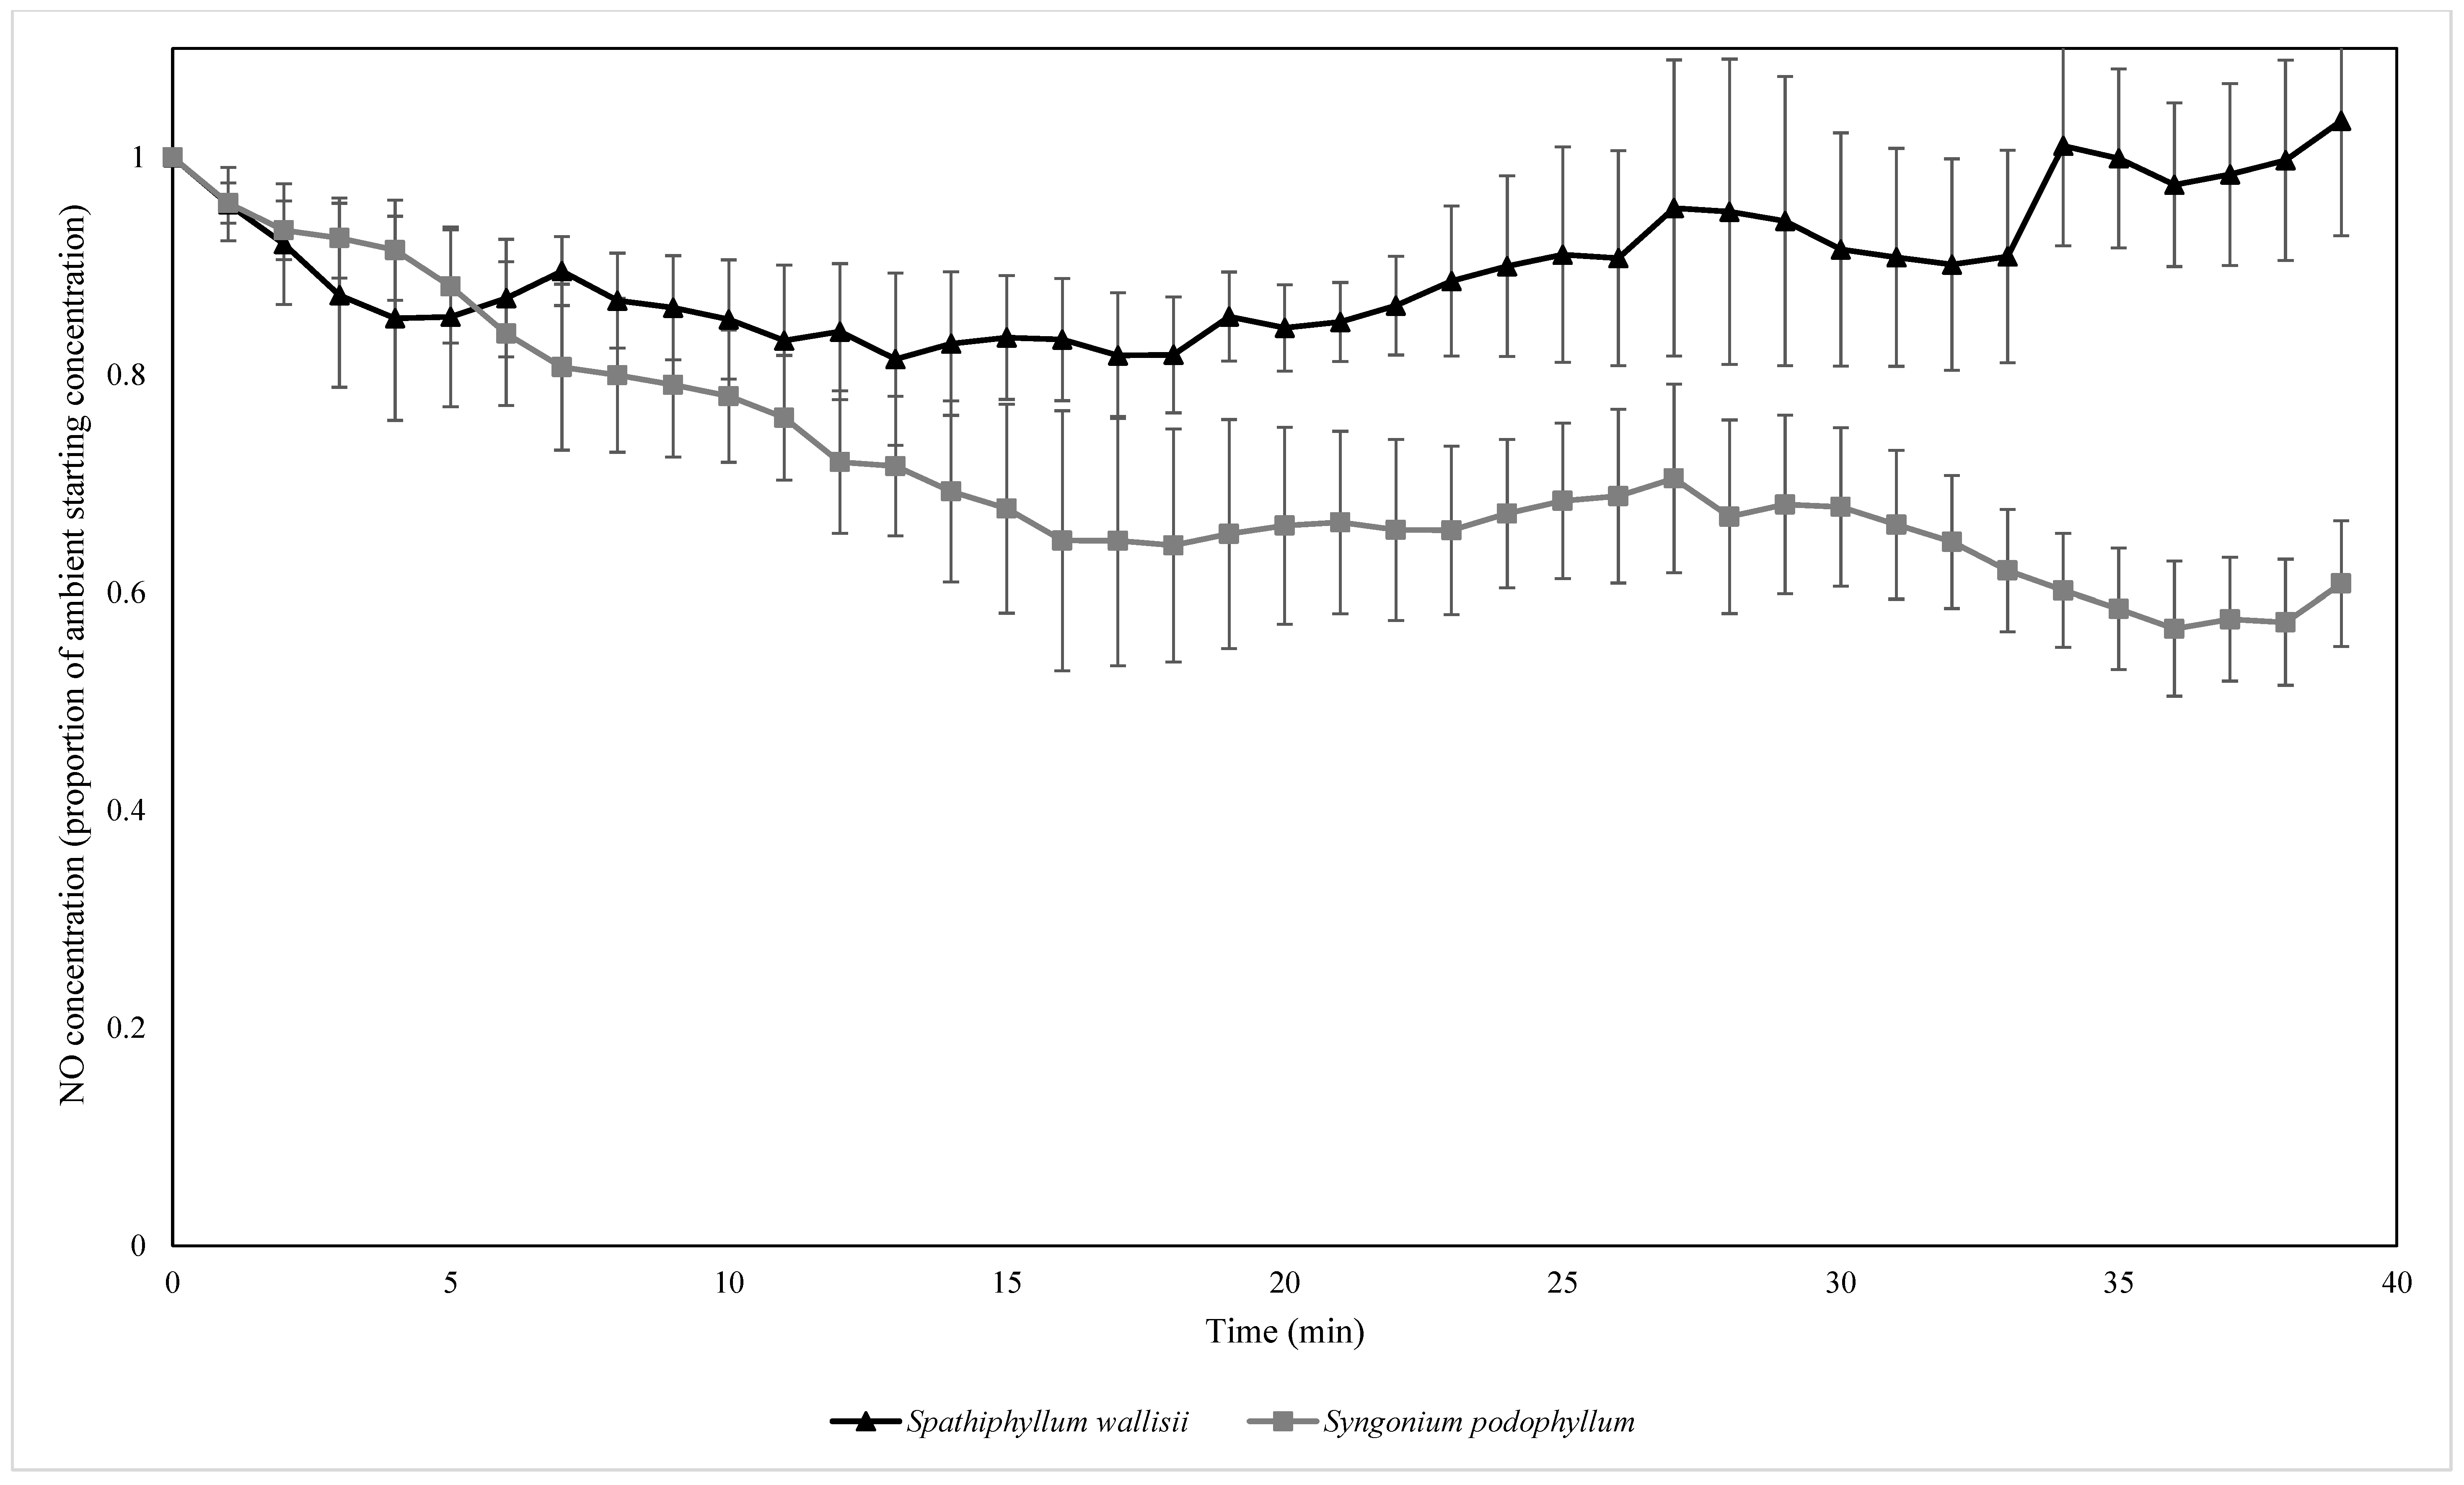
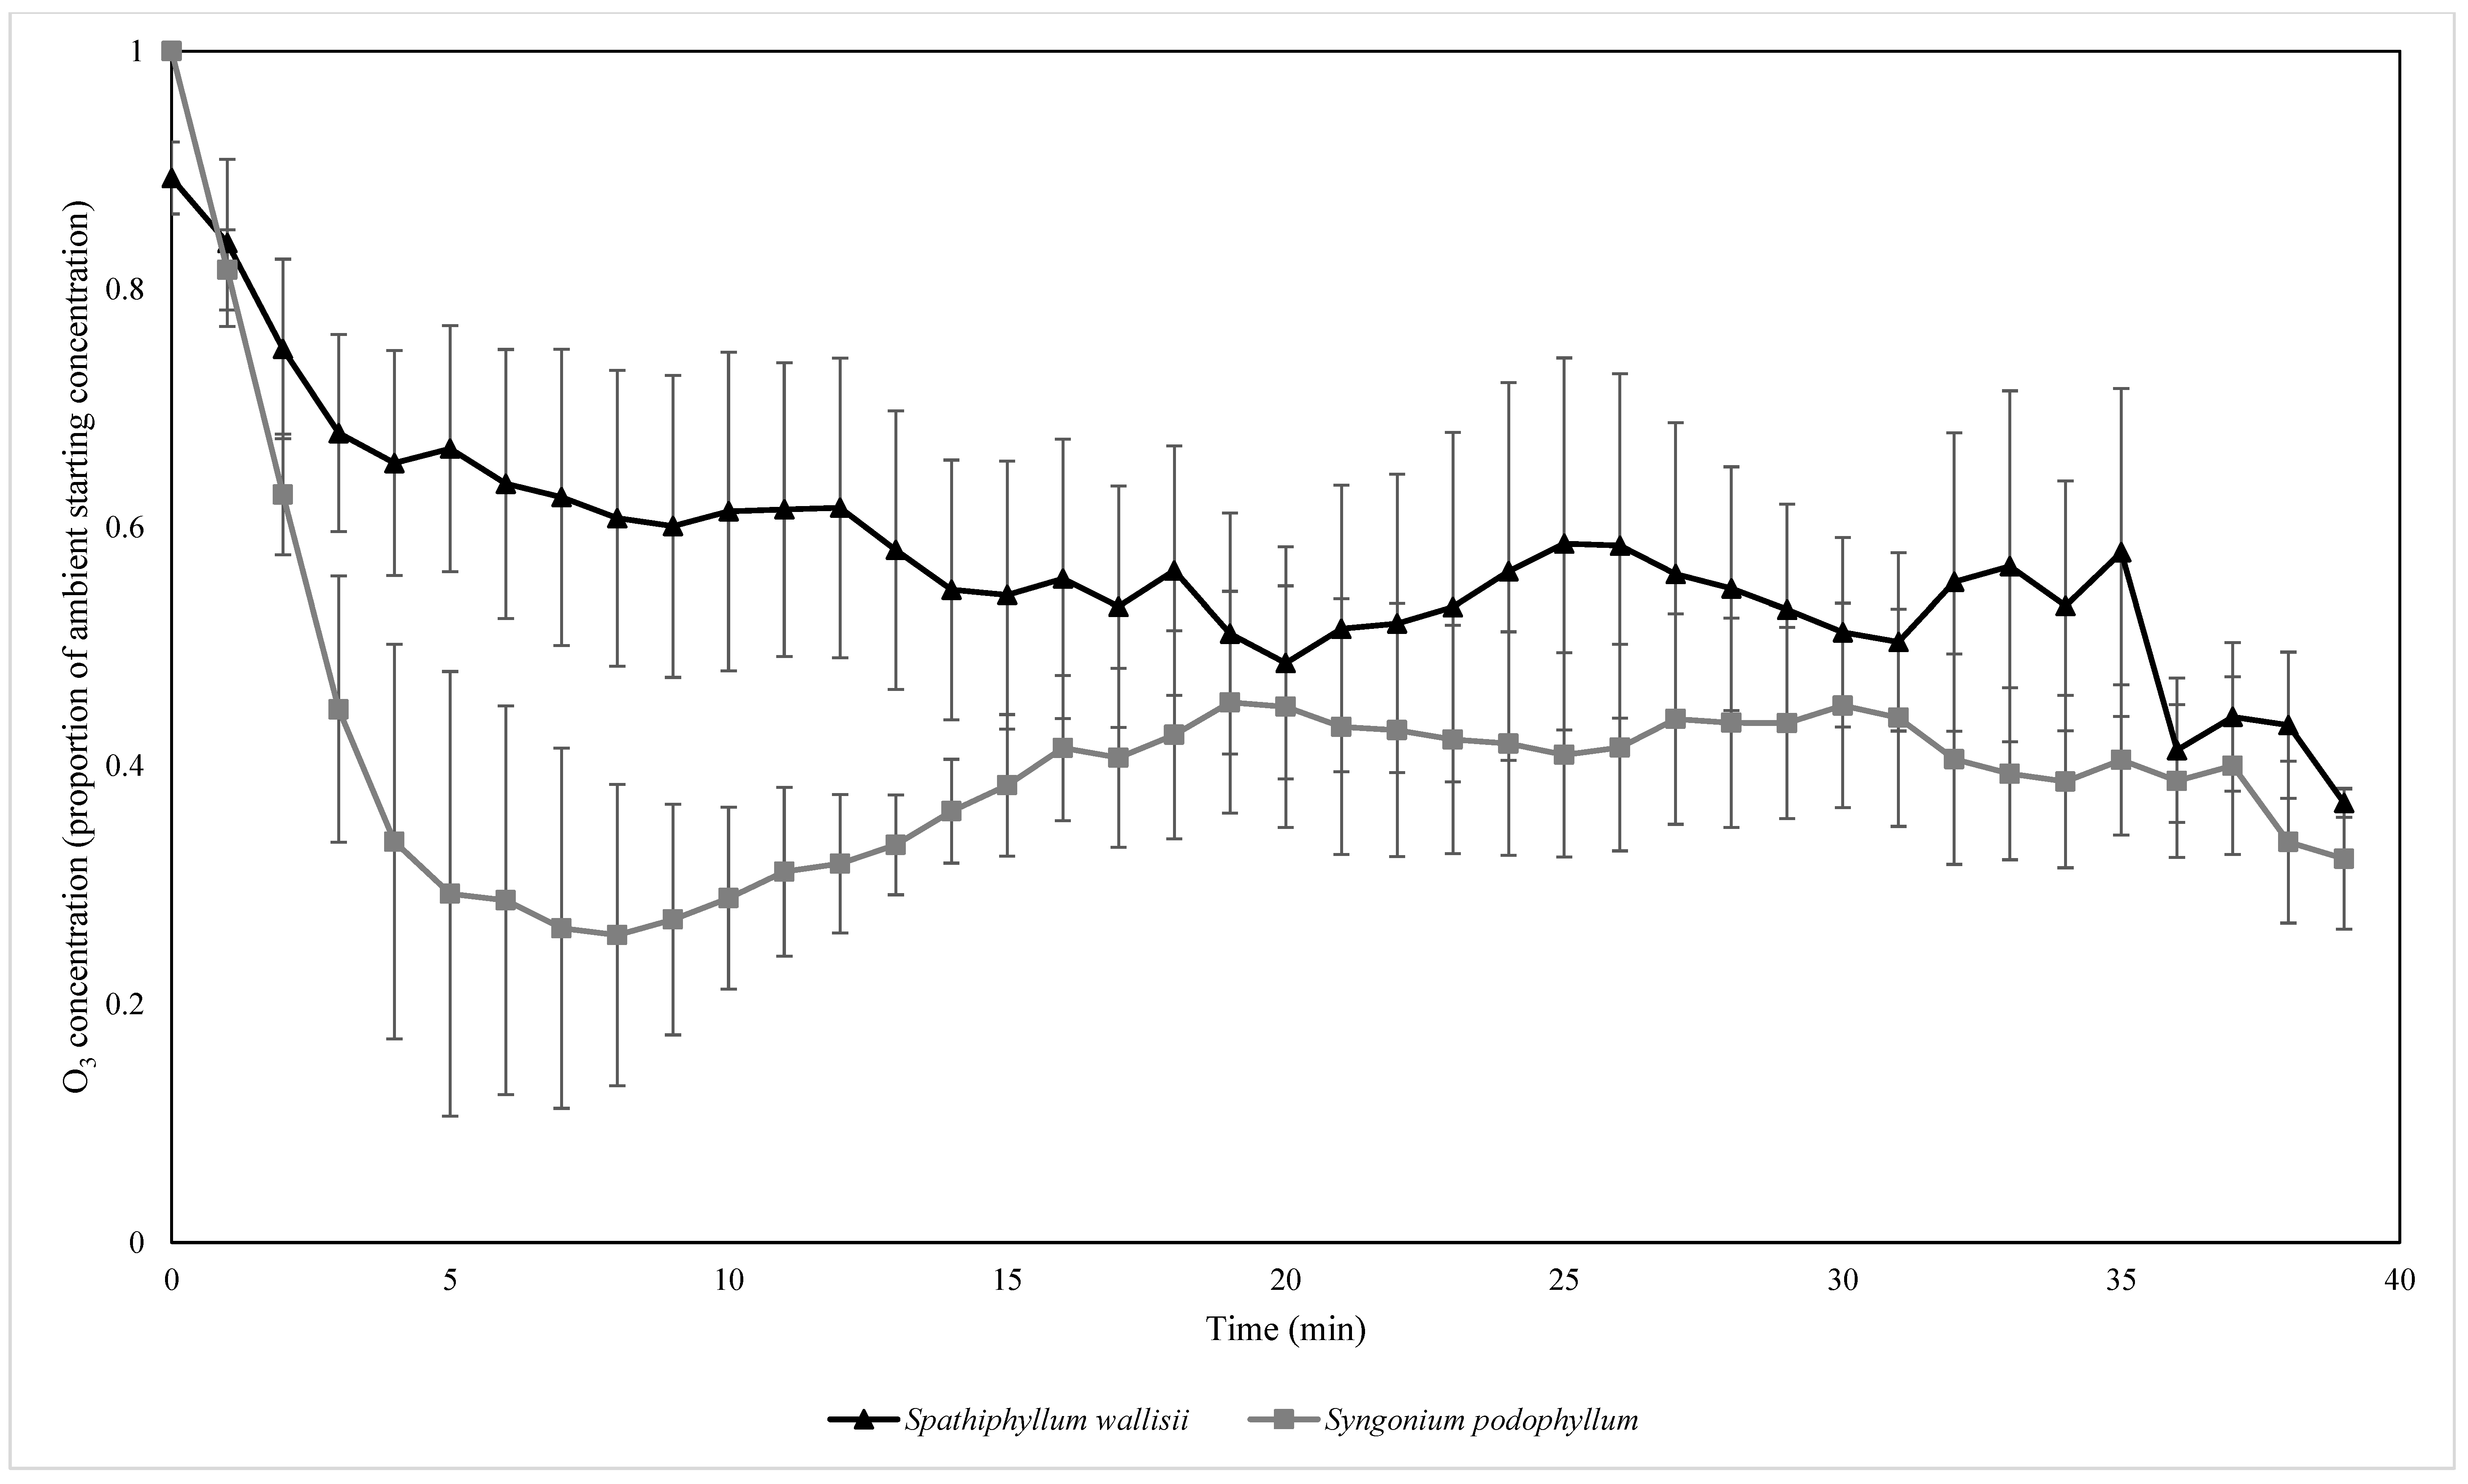
Concentrations of all pollutants within each trial were normalised by their peak concentrations. Exponential decay curves of pollutant concentration as a function of time were calculated (Microsoft Excel 2016) for each pollutant in each trial. The resulting exponential decay rates were used as response variables for subsequent statistical analyses.
First, three separate independent-samples t-tests (IBM SPSS Statistics Ver 25) were used to test for differences in the decay rates for the removal of ambient concentrations of NO, NO2, and O3 between the two plant species (Experiment 1). Statistical comparisons of the exponential decay rates between these treatments and the procedural control treatment were not conducted in this experiment, since all pollutant concentrations in the procedural control did not change in an exponential manner throughout the experimental period (Supplementary Materials, Figure S1). A series of general linear model regressions indicated that the concentration of NO did not significantly vary throughout the experimental time period for the procedural control (R2 = 0.000, F = 0.000, p = 1.000; average gradient = 1 × 10⁻⁶), nor did NO2 (R2 = 0.000, F = 0.000, p = 1.000; average gradient = 7 × 10⁻⁸) or O3 (R2 = 0.018, F = 0.238, p = 1.000; average gradient = 1 × 10⁻⁷).
Independent two factor analyses of variance (ANOVAs) were used to compare the exponential decay rates of the elevated concentrations of NO, NO2, and O3 amongst the light source (UV supplemented light or indoor light) and biofilter (S. wallisii, S. podophyllum, procedural control) treatments for experiments 2 and 3.
For each experiment, the single pass removal efficiency (SPRE) of each pollutant was estimated through a rearrangement of Dumont and Héquet’s [56] equation:
SPRE = ln ln C C 0 T c t + 1
where Tc is the pollutant residence time in the flow reactor’s empty chamber space; t = time; C0 is the initial pollutant concentration; and C is the pollutant concentration at time t.
Dumont and Héquet [56] examined the removal of VOCs by photocatalytic oxidation in a closed loop reactor, noting that the calculations for SPRE were dependent upon, amongst other factors, a perfectly mixed system. As a spiked source of a reactive pollutant was generated within the closed loop flow reactor in the current work (experiments 2 and 3) and additionally, pollutant concentrations within the flow reactor were influenced by diffusion, reaction rates, adsorption to the flow reactor surfaces, and possibly photolytic reactions, all SPRE values were corrected by subtracting the average SPRE value obtained from the corresponding procedural control treatment from the SPRE value calculated for each of the independent biofilter treatments. For all SPRE calculations, C0 was defined as the time when the peak concentration of each pollutant was reached after generation, and C was taken at t = 600 s to avoid increased discrepancies between the observed and calculated values associated with longer time periods, as discussed by Dumont and Héquet [56]. The clean air delivery rate (CADR) of the biofilters for the different pollutants was calculated by multiplying the SPRE by the volumetric flow rate through the biofilter, and standardised per unit of biofilter volume.

3. Results

Both plant species biofilter treatments exhibited exponential decay for the biofiltration of all three pollutants at ambient concentrations (Figure 3, Figure 4 and Figure 5). The average exponential decay rates for biofilters containing S. wallisii and S. podophyllum were 0.021 and 0.023 for NO2, 0.012 and 0.031 for NO, and 0.040 and 0.048 for O3, respectively. The exponential decay rates were not significantly different between the plant treatments for any of the tested pollutants (independent samples t-tests: NO2: T = 0.908, p = 0.385, Figure 3; NO: T = 1.367, p = 0.214, Figure 4; O3: T = 0.919, p = 0.380, Figure 5).
In trials with elevated pollution concentrations, all treatments effectively produced negative decay rates (Figure 6, Figure 7, Figure 8, Figure 9, Figure 10 and Figure 11). While biofilter treatments with both plant species removed NO and NO2 at greater exponential rates than their respective control treatments, this was not the case for O3, where the control treatment had the highest decay rate for O3 across both light conditions (Figure 8 and Figure 11).
Significant differences were observed for the interaction of the plant species treatment and light type (F = 30.747, p = 0.000) for the NO2 decay rate. Post hoc Tukey HSD tests indicated that the control treatment had a significantly slower NO2 decay rate constant relative to both the S. wallisii and S. podophyllum biofilters (p = 0.000 for both comparisons), while the S. wallisii and S. podophyllum biofilters had significantly different NO2 decay rates (p = 0.004), with S. podophyllum being slightly more effective for NO2 removal.
There were significant differences in the NO exponential decay rates between both light type (F = 15.760, p = 0.000) and biofilter treatment (F = 26.939, p = 0.000), however, there was no significant interaction between the two factors for the NO decay rates (F = 1.214, p = 0.312). Subsequent Tukey HSD post hoc tests showed that the control treatment lost NO at a significantly slower rate than both of the biofilter treatments (p = 0.000 for both comparisons), while the biofilters containing S. wallisii and S. podophyllum did not have significantly different NO decay rates (p = 0.104).
A two factor ANOVA comparing O3 decay rates amongst the groups showed that the O3 decay rate differed significantly amongst the biofilter types (F = 10.406, p = 0.000) with post hoc Tukey tests showing the control treatment removed O3 at a significantly faster rate than the S. wallisii and S. podophyllum biofilters (p = 0.001 and 0.000 for the respective comparisons).
The estimated CADRs for all treatments are shown in Table 1. The botanical biofilters demonstrated the capacity to produce air with reduced concentrations of all pollutants. For NO and NO2, the capacity to provide clean air appeared to be concentration dependent, with higher CADRs for these pollutants detected in the experiments that used elevated pollutant concentrations. Although highly variable, the CADR for O3 showed no clear associations with any of the test treatments.

4. Discussion

This study was the first to test the botanical biofiltration of NO2 with active airflow while simultaneously monitoring NO and O3 concentrations. Although differences in decay rates were observed amongst the different pollutants and experimental factors, all biofilters exhibited the removal of NOx. Importantly, no emissions (i.e., positive decay rate constants) of NOx were detected in any treatment. Botanical biofilters with two plant species were capable of reducing ambient NO2 to threshold concentrations specific to each treatment, however, the higher NO2 decay rates were observed under elevated NO2 concentrations, with the highest decay pattern observed for S. podophyllum biofilters when exposed to UV.
Interestingly, the influence of light type led to differences in the decay rates of both NO and NO2. Botanical biofilters with both plant species exhibited NO decay rates greater than natural decay, and the presence of botanical biofilters clearly enhanced the rate of NO removal from the flow reactor. NO was removed more rapidly under indoor light conditions, most likely because this light type favourably influenced the photochemical route that generates NO from NO2 [57].
The differences in NO2 decay rates observed between the two botanical biofilters under UV light may have been influenced by differences in the VOCs generated by the biotic components within the biofilters that were additional to ambient, anthropogenic VOCs. Biogenic VOCs can react with NO to generate NO2 [58], which can then undergo photolysis. As the mixture of VOC species and quantity of emitted VOCs varies amongst different plant species [59], it is possible that differences in biogenic VOC emissions between the S. wallisii and S. podophyllum biofilters may have contributed to the interaction between light type and botanical biofilter species, influencing the rate of NO2 decay. Additionally, botanical biofilters are also capable of filtering out a range of VOCs [33] and the degree to which various VOCs are filtered is dependent on the plant species present within the biofilter [35]. These traits may have also differentially influenced the VOC concentration profile within the flow reactor and therefore, it is possible that the VOC profile associated with each plant species may have had ramifications for the NO2 decay rate constants of each of the botanical biofilters. It is thus recommended that future work related to NOx biofiltration includes profiles of the biogenic VOCs emitted by the filters.
Additionally, during the elevated pollution trials, the O3 decay rate differed between biofilter treatments across both lighting conditions, with the O3 concentration declining more rapidly in the empty flow reactor (control) than the flow reactors with biofilters present, and it is possible that VOCs may have also had a role in forming O3 [60]. Furthermore, the botanical biofilters were able to reduce the concentration of ambient O3 when NO and NO2 concentrations were also low, however, O3 was removed more rapidly by the control treatments than the botanical biofilter treatments under both lighting conditions with elevated NO2. This may result from biogenic VOCs reacting with NOx to form O3 [54], however, it has alternatively been suggested that biogenic VOCs and NO may react to scavenge O3 [61]. Together with these effects, it is difficult to estimate the extent of this effect in situ where larger air volumes (i.e., buildings) would preclude VOCs accumulating to the degree caused by the small reactor volume used here, and the NOx concentration would generally be considerably lower. Decay of O3 in the control may have resulted from reactions with NOx and O3 forming NO2 [57], leading to the production of other species such as NO3 and N2O5 [54]. Although these experiments used an elevated concentration of NOx, the concentration of O3 was not proportionately elevated to the same extent and it is possible that the differential contribution of each contaminant to the overall air pollution load would influence the chemical transformations and thus the capacity to produce clean air.
In conjunction with substrate-mediated effects, NOx and O3 may also be removed by the aerial components of the plants such as through adsorption to leaf surfaces and uptake through the plant’s stomata [28]. This has been well documented as a pathway for the removal of gaseous pollutants by traditional forms of urban forestry [20], however, the contribution of this pathway to the overall removal process remains unknown when active airflow is used to pass an airstream through both the plant foliage and growth substrate. Determining the contribution of each pathway and assessing plant traits associated with removal is a valuable area of future research that will assist with performance optimization. The interaction between plant species and light type on NO2 decay rates may have been influenced by the plants responding differently to the different light sources (i.e., different rates of photosynthesis), so that the rate at which NO2 was taken up through stomata may have been affected.
It is further possible that the threshold for removal may be limited by saturation effects or alternatively, limited through substrate NO2 emissions. Broad scale substrate NOx emissions have been detected across agricultural areas, which are driven by soil fertilisation and precipitation, but which are subsequently suppressed due to canopy effects [62]. It is thus plausible that minor NOx emissions from the growth substrate may occur in botanical biofilters, and the NO2 concentration equilibrium between removal and emissions may lead to a threshold at which NO2 concentrations can no longer be reduced.
It is, however, likely that due to the relatively sort trial duration, the majority of the observed NO2 removal occurred through abiotic mechanisms. Amongst other reactions (see Atkinson 2000 for a discussion on the atmospheric chemistry of NOx), NO2 can react with water vapour and also substrate irrigation water [63]:
3 NO 2   +   H 2 O     2 HNO 3   +   NO
The products of such reactions may be problematic for biofilter plant health, as the accumulation of HNO3 would acidify the growth substrate, and thus affect plant health along with causing shifts in the microbial community, while the generation of NO is potentially problematic due to its toxicity to bacteria [64]. Due to the considerable variety of removal pathways and the potential for hazardous by-products, identifying the precise contribution of each removal mechanism is an important area of further research. Furthermore, longer term experiments are required to uncover the effects of NO2 exposure and removal on the health of the plants, the biofilter’s microbial community, and to establish whether pollution saturation effects will occur.
The SPRE estimation method developed by Dumont and Héquet [56] was based on calculating the removal efficiencies for VOCs by photocatalytic oxidisers, and thus the comparatively larger proportion of the flow reactor volume taken up by the biofilters in the current work (~2.5% by volume) may have led to some error in the predicted values.
Nonetheless, the botanical biofilters had a greater capacity to clean the air under elevated pollution concentrations and this is reflected in the considerably larger NO2 CADRs (550.8–741.24 m3∙h−1∙m−3 of biofilter) detected under higher NO2 loading. CADRs provide the best estimate of the air cleaning potential of botanical biofilters. Although this experiment used scaled-down model biofilters, larger botanical biofilters would by extension be capable of providing a considerable volume of NO2 cleaned air. Although this is the first work to calculate NO2 CADRs from botanical biofiltration, Wang and Zhang [65] calculated CADRs for toluene and formaldehyde through their botanical biofilter, producing estimates that were considerably larger than those found for NOx in the current work (4309 and 4690 m3∙h−1∙m−3 of the biofilter bed for formaldehyde and toluene, respectively). Interestingly, The CADR values found by Wang and Zhang [65] varied depending on the airflow rate and substrate moisture level, and these are factors that need to be explored for their effect on NO2 biofiltration.
This work represents the first work to assess the botanical biofiltration of NOx. Although higher NOx single pass removal efficiencies have been recorded for non-botanical biofilters [66,67], comparisons amongst other these studies remain difficult due to the variation in biofilter volume and airflow rates: non-botanical biofilters are usually designed to treat a limited number of target pollutants with much lower airflow rates through a substrate of greater depth. Comparatively, botanical biofilters process large volumes of air, treat a variety of air pollutants (i.e., VOCs, PM, and NOx), and generally have a limited substrate depth (i.e., reduce the space occupied and maintain aesthetic appeal). In this regard, it is important that active green walls are considered within the context of their full functionality (i.e., VOC filtration [33,43], PM filtration [30,31], CO2 reduction [40], enhanced humidity and temperature [36], biophilic benefits [68]) and not solely as phytoremediators of a limited number of pollutants.
Although the NO2 concentration in the experiment with spiked pollutant concentrations represents a level that is considerably higher (approximately by two orders of magnitude) than those commonly encountered in urban areas, the comparisons of NO2 removal between the two different pollution concentrations (ambient and elevated) indicates that removal is a concentration dependent process. Furthermore, the high NOx concentration used in this experiment was associated with compromised O3 removal, however, it is difficult to ascertain whether the biofiltration of NOx in concentrations found in urban areas along with variable environmental conditions (i.e., temperature and humidity) would be associated with O3 production.
The installation of botanical biofilters into urban design and green buildings is a promising solution to mitigating personal exposure to urban air pollution. Integrating botanical biofilters into HVAC systems using IoT (Internet of Things) technology for system monitoring is at the forefront of green technology, and may lead to enhanced management of indoor air quality by allowing real time system optimization (i.e., flow rate alterations) for target pollutants, while simultaneously monitoring and balancing HVAC energy expenditure [65]. Real time monitoring of air quality combined with pollutant mitigation using botanical biofiltration may reduce reliance on HVAC use and thus reduce the energy intensive step of temperature modulating influent ventilation air as it enters the building. For this development to be successful, however, a thorough assessment of the pressure drop across a green wall (see [69,70,71]) is needed to ensure that energy use does not become inflated.
While these results provide insight into the chemical transformations associated with the biofiltration of NO2, it is important to consider that different concentrations of these gases are likely to influence the rate of removal of each of the pollutants. This work was limited to two plant species and thus care should be taken when extrapolating these results to large green walls containing many different plant species, particularly when the green walls contain plant species that may emit considerable volumes of biogenic VOCs. The limited trial time in this experiment was unable to establish saturation points, and thus future work should focus on longer trial periods to assess whether the removal efficiency of these gases changes with time.

5. Conclusions

Botanical biofilters represent a promising technology for reducing urban air pollutants. The current research highlights that botanical biofilters have the potential to be used to reduce ambient indoor concentrations of NOx and O3. Under elevated NO2 concentrations (approximately 100 times that of urban environments), the removal efficiency of NOx increased, however, the removal of O3 was compromised. Nonetheless, in these conditions, the average NO2 clean air delivery rate was 661.32 and 550.8 m3∙h−1∙m−3 of the biofilter substrate for S. wallisii and S. podophyllum, respectively Furthermore, the lighting conditions and selection of plant species affected the degree of NOx removal. It is possible that differences in plant surface area or surface composition may have influenced the rate of pollutant deposition. In addition to these effects, the VOC emission profile and concentration associated with each plant species may have affected the chemical transformations of NOx and O3. Further research is needed to establish how these chemical transformations may play out under pollutant concentrations and conditions representative of urban environments. Long-term experiments under in situ conditions are needed to establish practical removal rates and plant health effects resulting from prolonged exposure to air pollution.

Supplementary Materials

The following are available online at https://www.mdpi.com/2073-4433/10/12/801/s1, Figure S1: The ambient pollution concentration profiles within the flow reactor procedural control treatments.

Author Contributions

Conceptualization, T.P. and F.R.T; Methodology, T.P.; Software, N.C.S.; Formal analysis, T.P.; Investigation, T.P., P.J.I., N.C.S. and F.R.T.; Resources, T.P. and N.C.S.; Data curation, T.P. and N.C.S.; Writing—original draft preparation, T.P.; Writing—review and editing, P.J.I., N.C.S. and F.R.T.; Supervision, P.J.I., N.C.S. and F.R.T.; Project administration, T.P., P.J.I., N.C.S. and F.R.T.

Funding

This research received no external funding. T. Pettit is supported by an Australian Government Research Training Program Scholarship. P.J. Irga is supported by the University of Technology Sydney (UTS) Chancellor’s Postdoctoral Research Fellowship scheme, facilitated through The Centre for Green Technology. Fraser Torpy and Nic Surawski would like to acknowledge funding support from the Australian Government via the Smart Cities and Suburbs grant program from 2017–2018.

Acknowledgments

The authors thank Sue Fenech, Gemma Armstrong, and Rachel Keeys for their technical support.

Conflicts of Interest

The authors declare no conflicts of interest.

References

  1. Beevers, S.D.; Westmoreland, E.; de Jong, M.C.; Williams, M.L.; Carslaw, D.C. Trends in NOx and NO2 emissions from road traffic in Great Britain. Atmos. Environ. 2012, 54, 107–116. [Google Scholar] [CrossRef]
  2. Wang, X.; Song, G.; Wu, Y.; Yu, L.; Zhai, Z. A NOx Emission Model Incorporating Temperature for Heavy-Duty Diesel Vehicles with Urea-SCR Systems Based on Field Operating Modes. Atmosphere 2019, 10, 337. [Google Scholar] [CrossRef] [Green Version]
  3. Carslaw, D.C.; Murrells, T.P.; Andersson, J.; Keenan, M. Have vehicle emissions of primary NO2 peaked? Faraday Discuss. 2016, 189, 439–454. [Google Scholar] [CrossRef] [PubMed]
  4. Hoek, G.; Krishnan, R.M.; Beelen, R.; Peters, A.; Ostro, B.; Brunekreef, B.; Kaufman, J.D. Long-term air pollution exposure and cardio-respiratory mortality: A review. Environ. Health 2013, 12, 43. [Google Scholar] [CrossRef] [Green Version]
  5. Kattan, M.; Gergen, P.J.; Eggleston, P.; Visness, C.M.; Mitchell, H.E. Health effects of indoor nitrogen dioxide and passive smoking on urban asthmatic children. J. Allergy Clin. Immunol. 2007, 120, 618–624. [Google Scholar] [CrossRef]
  6. World Health Organization. Air Quality Guidelines: Global Update 2005: Particulate Matter, Ozone, Nitrogen Dioxide, and Sulfur Dioxide; World Health Organization: Geneva, Switzerland, 2006. [Google Scholar]
  7. Smith, B.; Nitschke, M.; Pilotto, L.; Ruffin, R.; Pisaniello, D.; Willson, K. Health effects of daily indoor nitrogen dioxide exposure in people with asthma. Eur. Respir. J. 2000, 16, 879–885. [Google Scholar] [CrossRef]
  8. Just, J.; Segala, C.; Sahraoui, F.; Priol, G.; Grimfeld, A.; Neukirch, F. Short-term health effects of particulate and photochemical air pollution in asthmatic children. Eur. Respir. J. 2002, 20, 899–906. [Google Scholar] [CrossRef] [Green Version]
  9. Belanger, K.; Gent, J.F.; Triche, E.W.; Bracken, M.B.; Leaderer, B.P. Association of indoor nitrogen dioxide exposure with respiratory symptoms in children with asthma. Am. J. Respir. Crit. Care Med. 2006, 173, 297–303. [Google Scholar] [CrossRef] [Green Version]
  10. Andersen, Z.J.; Wahlin, P.; Raaschou-Nielsen, O.; Scheike, T.; Loft, S. Ambient particle source apportionment and daily hospital admissions among children and elderly in Copenhagen. J. Expo. Sci. Environ. Epidemiol. 2007, 17, 625. [Google Scholar] [CrossRef] [Green Version]
  11. Henschel, S.; Chan, G.; World Health Organization. Health Risks of Air Pollution in Europe-HRAPIE Project: New Emerging Risks to Health from Air Pollution-Results from the Survey of Experts; World Health Organization: Geneva, Switzerland, 2013. [Google Scholar]
  12. Lawson, S.J.; Galbally, I.E.; Powell, J.C.; Keywood, M.D.; Molloy, S.B.; Cheng, M.; Selleck, P.W. The effect of proximity to major roads on indoor air quality in typical Australian dwellings. Atmos. Environ. 2011, 45, 2252–2259. [Google Scholar] [CrossRef]
  13. Khan, M.; Schlich, B.-L.; Jenkin, M.; Shallcross, B.; Moseley, K.; Walker, C.; Morris, W.; Derwent, R.; Percival, C.; Shallcross, D. A two-decade anthropogenic and biogenic isoprene emissions study in a London urban background and a London urban traffic site. Atmosphere 2018, 9, 387. [Google Scholar] [CrossRef] [Green Version]
  14. Li, B.; Liu, B. Differences between weekday and weekend levels of ozone, NO2, NOx, and respirable suspended particulates in Hong Kong. Environ. Eng. Sci. 2012, 29, 35–41. [Google Scholar] [CrossRef]
  15. Jacob, D.J.; Winner, D.A. Effect of climate change on air quality. Atmos. Environ. 2009, 43, 51–63. [Google Scholar] [CrossRef] [Green Version]
  16. Melkonyan, A.; Kuttler, W. Long-term analysis of NO, NO2 and O3 concentrations in North Rhine-Westphalia, Germany. Atmos. Environ. 2012, 60, 316–326. [Google Scholar] [CrossRef]
  17. Leavey, A.; Fu, Y.; Sha, M.; Kutta, A.; Lu, C.; Wang, W.; Drake, B.; Chen, Y.; Biswas, P. Air quality metrics and wireless technology to maximize the energy efficiency of HVAC in a working auditorium. Build. Environ. 2015, 85, 287–297. [Google Scholar] [CrossRef]
  18. Green Building Council Australia. Summary Report on Ventilation Rates for GBCA Tenancy: Increase on AS 1668.2–1991 in GBCA Tenancy; Green Building Council Australia: Sydney, Australia, 2009. [Google Scholar]
  19. Challoner, A.; Gill, L. Indoor/outdoor air pollution relationships in ten commercial buildings: PM2.5 and NO2. Build. Environ. 2014, 80, 159–173. [Google Scholar] [CrossRef]
  20. Abhijith, K.; Kumar, P.; Gallagher, J.; McNabola, A.; Baldauf, R.; Pilla, F.; Broderick, B.; Di Sabatino, S.; Pulvirenti, B. Air pollution abatement performances of green infrastructure in open road and built-up street canyon environments—A review. Atmos. Environ. 2017, 162, 71–86. [Google Scholar] [CrossRef]
  21. Grote, R.; Samson, R.; Alonso, R.; Amorim, J.H.; Cariñanos, P.; Churkina, G.; Fares, S.; Thiec, D.L.; Niinemets, Ü.; Mikkelsen, T.N. Functional traits of urban trees: Air pollution mitigation potential. Front. Ecol. Environ. 2016, 14, 543–550. [Google Scholar] [CrossRef]
  22. Nowak, D.J.; Crane, D.E.; Stevens, J.C. Air pollution removal by urban trees and shrubs in the United States. Urban For. Urban Green. 2006, 4, 115–123. [Google Scholar] [CrossRef]
  23. Rao, M.; George, L.A.; Rosenstiel, T.N.; Shandas, V.; Dinno, A. Assessing the relationship among urban trees, nitrogen dioxide, and respiratory health. Environ. Pollut. 2014, 194, 96–104. [Google Scholar] [CrossRef]
  24. Pettit, T.; Irga, P.; Torpy, F. Towards practical indoor air phytoremediation: A review. Chemosphere 2018, 208, 960–974. [Google Scholar] [CrossRef] [PubMed]
  25. Torpy, F.R.; Irga, P.J.; Burchett, M.D. Reducing indoor air pollutants through biotechnology. In Biotechnologies and Biomimetics for Civil Engineering; Springer: Berlin, Germany, 2015; pp. 181–210. [Google Scholar]
  26. Dela Cruz, M.; Christensen, J.H.; Thomsen, J.D.; Müller, R. Can ornamental potted plants remove volatile organic compounds from indoor air?—A review. Environ. Sci. Pollut. Res. 2014, 21, 13909–13928. [Google Scholar] [CrossRef] [PubMed]
  27. Irga, P.; Pettit, T.; Torpy, F. The phytoremediation of indoor air pollution: A review on the technology development from the potted plant through to functional green wall biofilters. Rev. Environ. Sci. Bio/Technol. 2019, 17, 395–415. [Google Scholar] [CrossRef]
  28. Weyens, N.; Thijs, S.; Popek, R.; Witters, N.; Przybysz, A.; Espenshade, J.; Gawronska, H.; Vangronsveld, J.; Gawronski, S.W. The role of plant–microbe interactions and their exploitation for phytoremediation of air pollutants. Int. J. Mol. Sci. 2015, 16, 25576–25604. [Google Scholar] [CrossRef] [Green Version]
  29. Llewellyn, D.; Dixon, M. 4.26 Can plants really improve indoor air quality. In Comprehensive Biotechnology, 2nd ed.; Murray, M.-Y., Ed.; Academic Press: Burlington, VT, USA, 2011; pp. 331–338. [Google Scholar]
  30. Irga, P.; Paull, N.; Abdo, P.; Torpy, F. An assessment of the atmospheric particle removal efficiency of an in-room botanical biofilter system. Build. Environ. 2017, 115, 281–290. [Google Scholar] [CrossRef]
  31. Pettit, T.; Irga, P.; Abdo, P.; Torpy, F. Do the plants in functional green walls contribute to their ability to filter particulate matter? Build. Environ. 2017, 125, 299–307. [Google Scholar] [CrossRef]
  32. Torpy, F.; Clements, N.; Pollinger, M.; Dengel, A.; Mulvihill, I.; He, C.; Irga, P. Testing the single-pass VOC removal efficiency of an active green wall using methyl ethyl ketone (MEK). Air Qual. Atmos. Health 2018, 11, 163–170. [Google Scholar] [CrossRef] [Green Version]
  33. Pettit, T.; Bettes, M.; Chapman, A.; Hoch, L.; James, N.; Irga, P.; Torpy, F. Plants and Environmental Quality Research Group. The botanical biofiltration of VOCs with active airflow: Is removal efficiency related to chemical properties? Atmos. Environ. 2019, 214, 116839. [Google Scholar] [CrossRef]
  34. Pettit, T.; Irga, P.J.; Torpy, F.R. Functional green wall development for increasing air pollutant phytoremediation: Substrate development with coconut coir and activated carbon. J. Hazard. Mater. 2018, 360, 594–603. [Google Scholar] [CrossRef]
  35. Irga, P.J.; Pettit, T.; Irga, R.F.; Paull, N.J.; Douglas, A.N.; Torpy, F.R. Does plant species selection in functional active green walls influence VOC phytoremediation efficiency? Environ. Sci. Pollut. Res. 2019, 26, 12851–12858. [Google Scholar] [CrossRef] [Green Version]
  36. Tudiwer, D.; Korjenic, A. The effect of an indoor living wall system on humidity, mould spores and CO2-concentration. Energy Build. 2017, 146, 73–86. [Google Scholar] [CrossRef]
  37. Darlington, A.B.; Dat, J.F.; Dixon, M.A. The biofiltration of indoor air: Air flux and temperature influences the removal of toluene, ethylbenzene, and xylene. Environ. Sci. Technol. 2001, 35, 240–246. [Google Scholar] [CrossRef] [PubMed]
  38. Darlington, A.B.; Dixon, M.A. Acetone removal kinetics by an indoor biofilter. Sae Tech. Pap. 1999. [Google Scholar] [CrossRef]
  39. Llewellyn, D.J.; Darlington, A.B.; Mallany, J.; Dixon, M.A. The influence of airflow onindoor air biofiltration: Elimination of toluene and methyl ethyl ketone. In Proceedings of the 2000 USC-TRG Conference on Biofiltration, Los Angeles, CA, USA, 19–20 October 2000. [Google Scholar]
  40. Torpy, F.; Zavattaro, M.; Irga, P. Green wall technology for the phytoremediation of indoor air: A system for the reduction of high CO2 concentrations. Air Qual. Atmos. Health 2017, 10, 575–585. [Google Scholar] [CrossRef]
  41. Chaparro-Suarez, I.; Meixner, F.; Kesselmeier, J. Nitrogen dioxide (NO2) uptake by vegetation controlled by atmospheric concentrations and plant stomatal aperture. Atmos. Environ. 2011, 45, 5742–5750. [Google Scholar] [CrossRef]
  42. Sillman, S.; He, D. Some theoretical results concerning O3-NOx-VOC chemistry and NOx-VOC indicators. J. Geophys. Res. Atmos. 2002, 107, ACH 26. [Google Scholar] [CrossRef] [Green Version]
  43. Pettit, T.; Irga, P.; Torpy, F. The in situ pilot-scale phytoremediation of airborne VOCs and particulate matter with an active green wall. Air Qual. Atmos. Health 2019, 12, 33–44. [Google Scholar] [CrossRef]
  44. Irga, P.; Abdo, P.; Zavattaro, M.; Torpy, F. An assessment of the potential fungal bioaerosol production from an active living wall. Build. Environ. 2017, 111, 140–146. [Google Scholar] [CrossRef]
  45. Hörmann, V.; Brenske, K.-R.; Ulrichs, C. Suitability of Test Chambers for Analyzing Air Pollutant Removal by Plants and Assessing Potential Indoor Air Purification. Water Air Soil Pollut. 2017, 228, 402. [Google Scholar] [CrossRef]
  46. Hörmann, V.; Brenske, K.-R.; Ulrichs, C. Assessment of filtration efficiency and physiological responses of selected plant species to indoor air pollutants (toluene and 2-ethylhexanol) under chamber conditions. Environ. Sci. Pollut. Res. 2018, 25, 447–458. [Google Scholar] [CrossRef]
  47. Irga, P.; Torpy, F.; Burchett, M. Can hydroculture be used to enhance the performance of indoor plants for the removal of air pollutants? Atmos. Environ. 2013, 77, 267–271. [Google Scholar] [CrossRef]
  48. Sriprapat, W.; Thiravetyan, P. Efficacy of ornamental plants for benzene removal from contaminated air and water: Effect of plant associated bacteria. Int. Biodeterior. Biodegrad. 2016, 113, 262–268. [Google Scholar] [CrossRef]
  49. Tani, A.; Hewitt, C.N. Uptake of aldehydes and ketones at typical indoor concentrations by houseplants. Environ. Sci. Technol. 2009, 43, 8338–8343. [Google Scholar] [CrossRef] [PubMed]
  50. Torpy, F.; Irga, P.; Moldovan, D.; Tarran, J.; Burchett, M. Characterization and biostimulation of benzene biodegradation in the potting-mix of indoor plants. J. Appl. Hortic. 2013, 15, 10–15. [Google Scholar]
  51. Bureau of Meteorology. Climate Data Online. Available online: http://www.bom.gov.au/climate/data (accessed on 15 July 2019).
  52. Yoo, J.Y.; Park, C.J.; Kim, K.Y.; Son, Y.-S.; Kang, C.-M.; Wolfson, J.M.; Jung, I.-H.; Lee, S.-J.; Koutrakis, P. Development of an activated carbon filter to remove NO2 and HONO in indoor air. J. Hazard. Mater. 2015, 289, 184–189. [Google Scholar] [CrossRef] [PubMed]
  53. Bohn, B.; Rohrer, F.; Brauers, T.; Wahner, A. Actinometric measurements of NO2 photolysis frequencies in the atmosphere simulation chamber SAPHIR. Atmos. Chem. Phys. 2005, 5, 493–503. [Google Scholar] [CrossRef] [Green Version]
  54. Atkinson, R. Atmospheric chemistry of VOCs and NOx. Atmos. Environ. 2000, 34, 2063–2101. [Google Scholar] [CrossRef]
  55. Malicet, J.; Daumont, D.; Charbonnier, J.; Parisse, C.; Chakir, A.; Brion, J. Ozone UV spectroscopy. II. Absorption cross-sections and temperature dependence. J. Atmos. Chem. 1995, 21, 263–273. [Google Scholar] [CrossRef]
  56. Héquet, V.; Batault, F.; Raillard, C.; Thévenet, F.; Le Coq, L.; Dumont, É. Determination of the Clean Air Delivery Rate (CADR) of Photocatalytic Oxidation (PCO) Purifiers for Indoor Air Pollutants Using a Closed-Loop Reactor. Part I: Theoretical Considerations. Molecules 2017, 22, 407. [Google Scholar]
  57. Atkinson, R.; Carter, W.P. Kinetics and mechanisms of the gas-phase reactions of ozone with organic compounds under atmospheric conditions. Chem. Rev. 1984, 84, 437–470. [Google Scholar] [CrossRef]
  58. Atkinson, R.; Arey, J. Gas-phase tropospheric chemistry of biogenic volatile organic compounds: A review. Atmos. Environ. 2003, 37, 197–219. [Google Scholar] [CrossRef]
  59. Seco, R.; Penuelas, J.; Filella, I. Short-chain oxygenated VOCs: Emission and uptake by plants and atmospheric sources, sinks, and concentrations. Atmos. Environ. 2007, 41, 2477–2499. [Google Scholar] [CrossRef]
  60. Yao, Z.; Wu, B.; Shen, X.; Cao, X.; Jiang, X.; Ye, Y.; He, K. On-road emission characteristics of VOCs from rural vehicles and their ozone formation potential in Beijing, China. Atmos. Environ. 2015, 105, 91–96. [Google Scholar] [CrossRef]
  61. Neirynck, J.; Gielen, B.; Janssens, I.; Ceulemans, R. Insights into ozone deposition patterns from decade-long ozone flux measurements over a mixed temperate forest. J. Environ. Monit. 2012, 14, 1684–1695. [Google Scholar] [CrossRef] [PubMed]
  62. Bertram, T.H.; Heckel, A.; Richter, A.; Burrows, J.P.; Cohen, R.C. Satellite measurements of daily variations in soil NOx emissions. Geophys. Res. Lett. 2005, 32. [Google Scholar] [CrossRef] [Green Version]
  63. Zheng, M.; Li, C.; Liu, S.; Gui, M.; Ni, J. Potential application of aerobic denitrifying bacterium Pseudomonas aeruginosa PCN-2 in nitrogen oxides (NOx) removal from flue gas. J. Hazard. Mater. 2016, 318, 571–578. [Google Scholar] [CrossRef]
  64. Stern, A.M.; Liu, B.; Bakken, L.R.; Shapleigh, J.P.; Zhu, J. A novel protein protects bacterial iron-dependent metabolism from nitric oxide. J. Bacteriol. 2013, 195, 4702–4708. [Google Scholar] [CrossRef] [Green Version]
  65. Wang, Z.; Zhang, J.S. Characterization and performance evaluation of a full-scale activated carbon-based dynamic botanical air filtration system for improving indoor air quality. Build. Environ. 2011, 46, 758–768. [Google Scholar] [CrossRef]
  66. Barnes, J.M.; Apel, W.A.; Barrett, K.B. Removal of nitrogen oxides from gas streams using biofiltration. J. Hazard. Mater. 1995, 41, 315–326. [Google Scholar] [CrossRef]
  67. Jiang, R.; Huang, S.; Yang, J. Biological removal of NOx from simulated flue gas in aerobic biofilter. Glob. Nest J. 2008, 10, 241–248. [Google Scholar]
  68. Gunawardena, K.; Steemers, K. Living walls in indoor environments. Build. Environ. 2018, 148, 478–487. [Google Scholar] [CrossRef]
  69. Abdo, P.; Huynh, B.; Avakian, V. Effect of Fan Speed on Air Flow Through a Green Wall Module. In Proceedings of the ASME 2018 5th Joint US-European Fluids Engineering Division Summer Meeting, Montreal, QC, Canada, 15–20 July 2018. [Google Scholar]
  70. Abdo, P.; Huynh, B.; Avakian, V.; Nguyen, T.; Gammon, J.; Torpy, F.; Irga, P. Measurement of air flow through a green-wall module. Measurement 2016, 5, 8. [Google Scholar]
  71. Abdo, P.; Huynh, B.P.; Irga, P.J.; Torpy, F.R. Evaluation of airflow through an active green wall biofilter. Urban. For. Urban. Green. 2019, 41, 75–84. [Google Scholar] [CrossRef]
Figure 1. The replicate biofilters used in this experiment. (A) A replicate biofilter with Spathiphyllum wallisii. (B) A replicate biofilter with Syngonium podophyllum.
Atmosphere 10 00801 g001
Figure 2. The closed loop flow reactor used in this experiment.
Atmosphere 10 00801 g002
Figure 3. The biofiltration of ambient concentrations of NO2 by biofilters containing two different plant species. NO2 concentrations were normalised by the starting ambient concentration of NO2. n = 4 independent samples per treatment, error bars represent the standard error of the mean (SEM).
Atmosphere 10 00801 g003
Figure 4. The biofiltration of ambient concentrations of NO by biofilters containing two different plant species. NO concentrations were normalised by the starting ambient concentration of NO. n = 4 independent samples per treatment, error bars represent the SEM.
Atmosphere 10 00801 g004
Figure 5. The biofiltration of ambient concentrations of O3 by biofilters containing two different plant species. O3 concentrations were normalised by the starting ambient concentration of O3. n = 4 independent samples per treatment, error bars represent the SEM.
Atmosphere 10 00801 g005
Figure 6. The biofiltration of elevated concentrations of NO2 by biofilters containing two different plant species at indoor light levels. NO2 concentrations were normalised by the starting ambient concentration of NO2. n = 4 independent samples per treatment, error bars represent the SEM.
Atmosphere 10 00801 g006
Figure 7. The biofiltration of elevated concentrations of NO by biofilters containing two different plant species at indoor light levels. NO concentrations were normalised by the starting ambient concentration of NO. n = 4 independent samples per treatment, error bars represent the SEM.
Atmosphere 10 00801 g007
Figure 8. The biofiltration of elevated concentrations of O3 by biofilters containing two different plant species at indoor light levels. O3 concentrations were normalised by the starting ambient concentration of O3. n = 4 independent samples per treatment, error bars represent the SEM.
Atmosphere 10 00801 g008
Figure 9. The biofiltration of elevated concentrations of NO2 by biofilters containing two different plant species under UV light. NO2 concentrations were normalised by the starting ambient concentration of NO2. n = 4 independent samples per treatment, error bars represent the SEM.
Atmosphere 10 00801 g009
Figure 10. The biofiltration of elevated concentrations of NO by biofilters containing two different plant species under UV light. NO concentrations were normalised by the starting ambient concentration of NO. n = 4 independent samples per treatment, error bars represent the SEM.
Atmosphere 10 00801 g010
Figure 11. The biofiltration of elevated concentrations of O3 by biofilters containing two different plant species under UV light. O3 concentrations were normalised by the starting ambient concentration of O3. n = 4 independent samples per treatment, error bars represent the SEM.
Atmosphere 10 00801 g011
Table 1. Calculated clean air delivery rates (CADRs) normalised by biofilter volume (m3∙h−1∙m−3 of biofilter substrate).
Pollution TreatmentLight TypeBiofilter Plant SpeciesNONO2O3
AmbientIndoorSpathiphyllum wallisii33.48 ± 11.5279.92 ± 9.00135 ± 52.92
Syngonium podophyllum52.2 ± 15.4887.84 ± 15.84248.83 ± 29.88
ElevatedIndoorSpathiphyllum wallisii381.24 ± 90.72661.32 ± 53.2895.04 ± 34.92
Syngonium podophyllum242.64 ± 21.60550.8 ± 19.0823.04 ± 51.84
ElevatedUVSpathiphyllum wallisii277.76 ± 14.40741.24 ± 199.80228.6 ± 169.56
Syngonium podophyllum240.48 ± 77.76676.08 ± 125.64118.08 ± 137.16

