1. Introduction
As global climate conditions have changed over the decades, meteorological information service plays a key role in the human decision-making process and has pervasive effects in various sectors. With better forecast information, it can help people not only to make decisions in their daily lives, but also help keep people out of danger. It is more likely to see more rapid changes in climate and our environment, and the demand for various types of meteorological information services has been increasing significantly. The need for a weather forecast information service is more emphasized than before.
The meteorological information services in Taiwan are mainly provided by the Central Weather Bureau (CWB), which is a governmental agency. The CWB currently is the only legitimate institution authorized to announce various types of weather forecasts and warnings in Taiwan, and it provides those weather forecast information services for the general public. Due to the characteristics of public goods, most people take weather information as a necessary good for granted, but those services are always free for the public to access via many media or communication sources in Taiwan. Even though those services have become one of the most important tools in every citizen’s everyday life, there are few studies or official reports in Taiwan which can provide a sufficient methodology and valuation mechanism to elicit the economic value or benefits resulting from the public service of meteorological information services provided by the CWB.
The World Meteorology Organization (WMO) has suggested five priority areas for global concerns in its Global Framework for Climate Changes (GFCS), including agriculture and food security, disaster risk reduction, health, water, and energy [
1] (pp. 5–14). As agricultural production activities are sensitive to weather and climate conditions, meteorological information services are more important for agricultural decision-makers than those in other sectors. Agriculture is highly dependent on weather and climate conditions. There is a saying in Taiwan that what farmers can harvest and eat totally depends on the weather challenges they encounter. Needless to say, weather conditions are vital to agriculture, and most agricultural productions are exposed to the natural environment without any protective indoor facilities. Even though the request and demand from agriculture is increasing, government agencies need to identify what is in their priority to provide or improve their services. An economic assessment is always required by the central government before agencies submit their proposal or strategy.
The purpose of this study is to measure the agricultural producers’ willingness to pay (WTP) for meteorological information services, and estimate the economic value of meteorological information services for agricultural producers in Taiwan. As most meteorological information services are provided by the CWB in Taiwan and the meteorological information service is not normally treated as a commodity and cannot be obtained through market transactions, we use contingent valuation method (CVM) for assessing the value of meteorological information services, which is widely used to estimate the value of public services.
In this paper, the empirical results concerning the economic value of meteorological information services in Taiwan for agricultural producers are economically significant. Our results can serve as a valuable reference for the government and public policy makers as they formulate new policies and decide on future investments. In addition, if any private company intends to commercialize weather information, the results of this study can also serve as a reference for the pricing strategy of the relevant commodity.
The remainder of this paper is organized as follows.
Section 2 presents a literature review.
Section 3 discusses the methodology. The survey design is described in
Section 4 and
Section 5 provides an analysis of our empirical results. Some concluding comments are given in
Section 6.
2. Literature Review
The contingent valuation method (CVM) is one of the most commonly used methods to estimate non-use values. The CVM dates back to 1947, when Ciriacy-Wantrup proposed a survey technique that attempted direct elicitation of individuals’ (or households’) preferences for a good or service [
2]. Empirical implementation of the CVM to elicit market valuation for nonmarket goods was proposed by Davis [
3] where he estimated the value that hunters and tourists placed on a particular wilderness area. The approach was subsequently widely used for estimating economic values for all kinds of ecosystem services and environmental goods.
As the weather and climate services are provided by the public sector (Central Weather Bureau, CWB) in Taiwan, there are no market prices for most meteorological information services. Therefore, evaluating these outcomes will require the use of non-market valuation methods. CVM is commonly used for estimating the value of non-market goods and services, in the context of meteorological services, several studies have evaluated the sector/household/individual willingness to pay (WTP) using CVM surveys [
4] (pp. 12–13), [
5] (pp. 63–68). A summary of the literature on the application of the contingent valuation method approach to meteorological information service issues is provided below.
In the context of public meteorological information services, some studies have estimated a household’s willingness to pay by using the CVM. Lazo and Chestnut [
6] evaluated US households’ values for improved “day-to-day” weather forecasting services. The empirical results showed the households’ value for current weather forecast services was 109 US dollars per year and the value for improving weather forecast was 16 US dollars per year. In 2000 the US Census Bureau estimated about 105 million US households, the annual national value was 11.4 billion US dollars for current weather forecast services, and total national values for improving weather forecasts were estimated to be 1.73 billion US dollars per year.
Park et al. [
7] measured the economic value of the national meteorological service by the Korea Meteorological Administration in the Korean household sector. The empirical results showed the average additional WTP per household was 0.75 US dollars per month, given that the monthly expenditure for the meteorological service was 1.26 US dollars per household as of 2013. Thus, the economic value of the national meteorological service to the national population was 444.9 million US dollars per year. A related study by Anaman et al. [
8] used CVM to estimate the economic value of public weather services produced by the Ghana Meteorological Agency (GMet) to users in the Formal Services Sector in Accra. The empirical results showed that the average WTP per person per year was 51.96 US dollars. With roughly 249,144 public weather services users, the total economic value was estimated to be about 12.9 million US dollars per year, which was over four times the value of the annual budget provided by the Government of Ghana to GMet.
As agricultural production activities are sensitive to weather and climate, meteorological information services are more important for agricultural decision-makers than those in other sectors. Several studies focused on agriculture (famers’ WTP); Predicatori et al. [
9] investigated the value of meteorological information in agriculture in Italy via CVM surveys. The results presented the WTP for improved meteorological information in specific agricultural sectors, ranging from 44 to 447 US dollars per sector per year. Mabe et al. [
10] also used CVM to investigate the value of weather forecast information to farmers in the northern region of Savelugu-Nanton Municipality. The empirical results showed that the average WTP amount was 7.56 US dollars per year. The study also revealed that age (higher), sex (men), farm size (larger) and on-farm income (higher) significantly and positively affected the amount farmers were willing to pay for weather forecast information.
Ouédraogo et al. [
11] (pp. 1–4) investigated the value of using seasonal climate forecasts for farmers in cowpea and sesame sectors in climate-smart villages of Burkina Faso via a CVM survey. The empirical results showed farmers were ready to pay for climate information. The WTP was 12.51 US dollars for seasonal forecast (it represented as much as 22% of inputs cost for sesame production) and 5.82 US dollars for the daily climate information. Moreover, Ouédraogo et al. [
12] estimated farmers’ WTP for climate information within cowpea and sesame value chains in Northern Burkina Faso via a CVM survey. The empirical results showed that the predicted value for the WTP was 5.91 US dollars for seasonal climate forecast, 1.80 US dollars for decadal climate information, 3.36 US dollars for daily climate information, and 2.75 US dollars for agro-advisories. Moreover, the WTP for climate information also depended on farmers’ characteristics, such as gender, age, education, and awareness of climate information.
In order to evaluate specific weather information services, Alberini et al. [
13] used CVM to estimate the value generated by the Swiss Federal Institute for Snow and Avalanche Research (SLF) that provides hazardous weather warnings to backcountry skiers in Swaziland. The empirical results showed the respondents’ WTP for the improved services ranged between 42.70 to 46.77 US dollars per person, implying a mean value of statistical life (VSL) of 1.78 US dollars million. In addition, this study also found that WTP increases with income and was higher among Swiss nationals and those who rate the current bulletin “useful.” Lazo and Waldman [
14] investigated the value of improved hurricane forecasts to households in the US from a CVM survey. Results indicated that the total WTP for improvements in forecast attributes (landfall time and position, wind speed, and storm surge) was 13.19 US dollars per household per year. Wang et al. [
15] analyzed the value of haze management and prevention in Jiangsu Province (China) via a CVM survey. The empirical results showed the public’s WTP per person was calculated as 13.62 US dollars and the total economic value was estimated to be about 1.08 billion US dollars. Moreover, the public’s WTP was higher for those with a higher monthly family income and who experienced a greater effect on transport modality.
Another interesting study focused on meteorological information by phone; Rollins and Shaykewich [
16] used CVM to analyze the economic value of weather forecasts by an automated telephone-answering device for multiple commercial sectors in Canada. The empirical results showed the average value per call was 1.20 US dollars (agriculture sectors: 2.17 US dollars; public sectors: 0.60 US dollars), and at roughly 13,750,000 commercial calls annually, that would result in an estimate of benefits generated by the service to commercial users of 16.5 million US dollars per year.
From the research findings presented above, the assessment of the social and economic value of meteorological information services is an important research topic. We also can discover how sectors/households/individuals revealed themselves to be willing to pay for the meteorological information service. In the following content, we briefly introduce the contingent valuation method specification that will be used in the empirical analysis.
3. Methodology
Unlike most public goods, weather services are not normal tradable goods in the market, and it is therefore very difficult to evaluate their value or prices. They can be categorized as non-market goods as usual resources in the field of environmental economics. The economic value yielded by meteorological information services come from two major sources: the usage value (e.g., the value from people using the information to enhance agricultural production), and the non-usage value (e.g., the value stemming from people’s desire that those services exist). Theoretically, when we begin to evaluate the economic value of such types of goods, the aggregate price that people are willing to pay for those services can be measured as their economic value.
The contingent valuation method (CVM) is one of the methods most commonly used to value public goods. In addition to estimating the use values, the CVM can also be used to estimate the non-use values for many items, there are several successful CVM case studies on the valuation of weather information (see e.g., [
6,
7,
8,
9,
10,
11,
12,
13,
14,
15,
16]). We use the CVM in this study to estimate the value of meteorological information services for agricultural producers in Taiwan. More specifically, the double-bounded dichotomous choice model with an open-ended main question format was used.
This model has two important characteristics. First, when respondents understand and answer their maximum WTP at the final stage in the valuation questioning process, this value represents the final answer given by respondents. It is assumed that they have experienced a complete process of decision making. In this study, we assume that respondents’ minimum value is zero, even though they may perceive a negative WTP value for the provided services. Moreover, if we take the characteristics of censored data into consideration, the real WTP value for those respondents who answer zero can be a true zero WTP value or a negative WTP value. Hence, we still need to take the probability of a negative WTP value into our valuation function model in a given statistical distribution.
Second, we need to consider the starting point bias effect. When we use the dichotomous choice model, there is always a given bid price for the respondents as a reference value at each stage to induce the true WTP value of the respondents. However, it is possible that respondents will misunderstand the bid price as the average price for the good or the service. They may adjust their WTP value in reference to the given bid price, and therefore their true WTP value would be adjusted at the same time as well. This may result in a higher or lower estimated average WTP value compared to their true WTP value [
17,
18,
19,
20].
In order to get a better estimation result, we take two characteristics into consideration to build a calibration model to reduce the starting point bias effect for the censored data and calibration model (for a detailed derivation, see Liou [
20]).
The verification and correcting model developed by Herriges and Shogren [
17] was used to reduce the estimation and corrections of starting point bias. They suggest the value at the second stage (
) consists of the first bid price and the respondents’ real WTP (
) value with the adjustment by the anchoring effect coefficient, as shown in Equation (1). The anchoring effect coefficient (
) is defined in the literature as
. If
is closer to 1, it reveals that the real WTP value of the respondents is closer to the first bid price, and the anchoring effect coefficient will have a greater influence on valuation estimation. Otherwise, if
is closer to zero, the values from the respondents’ answers are very close to their true WTP values. Meanwhile, the effect of the anchoring effect coefficient on estimation is insignificant. Equation (1) is as follows:
Through Equation (1), we can estimate the anchoring effect coefficient of the starting point bias. We can then use Equation (2) to correct the to obtain the true value.
In addition, the calibration model built from this study is based on the Tobit model due to the characteristics of our censored data. Assuming the true
value of respondent
is
, when
is greater than zero, the
value given by the respondent
(
) is equal to
. Otherwise, if
is equal to or less than zero, the
value given by the respondent
(
) is assumed to be zero. Thus, if the
value given by the respondent
is greater than zero, the corresponding probability can be written as in Equation (3).
where
is the probability function of standard distribution;
is the standard deviation of
.
If the value given by the respondent is equal to zero, the probability can be written as in Equation (4).
Combining Equations (3) and (4), we have the maximum likelihood function for as it is shown in Equation (5).
If we want to consider the starting point bias, we can substitute
in Equation (5) with the
in Equation (1), as shown in Equation (6):
Then we estimate the coefficient according to the estimation process of the traditional Tobit model. Currently, the problem of censored data has been solved and even the estimated result still contains a starting point bias. Finally, we use Equation (2) to correct the starting point bias to obtain the unbiased estimation result.
4. Survey Design
The objective of this study is to evaluate how agricultural producers perceive the economic value of using meteorological information services in Taiwan. To achieve this goal, a sample of agricultural producers in Taiwan were interviewed face-to-face following the CVM survey methods. Moreover, we followed the guidelines recommended by Arrow et al. [
21] to complete the survey design and the planning of the assessment of meteorological information services value. Three parts were included in the survey. First, we focused on the “forecast accuracy” of the meteorological information services accessed in their everyday life, and asked the respondents their rating scores on the subjective accuracy of weather forecasts. Secondly, we asked respondents how they apply weather information in their agricultural activities. Finally, we asked them what their monthly WTP would be for meteorological information services provided by the CWB.
The survey was conducted from 23 August to 18 October in 2013. In order to increase the participation rate and to explain the content of the survey more clearly, the survey was conducted by trained interviewers in person. We selected farmers producing six major agricultural products (including rice, coarse grains, special crops, ornamental plants, vegetables, and fruits) in the 2010 National Agricultural Census in Taiwan as our major research population. With advice and assistance from experts at the Directorate General of Budget, Accounting and Statistics (DGBAS), we randomly selected a sample of 400 registered agricultural households. Another 2000 replacement respondents were also selected in case our interviewers could not locate the sampled farmers or the selected respondents refused to take the survey.
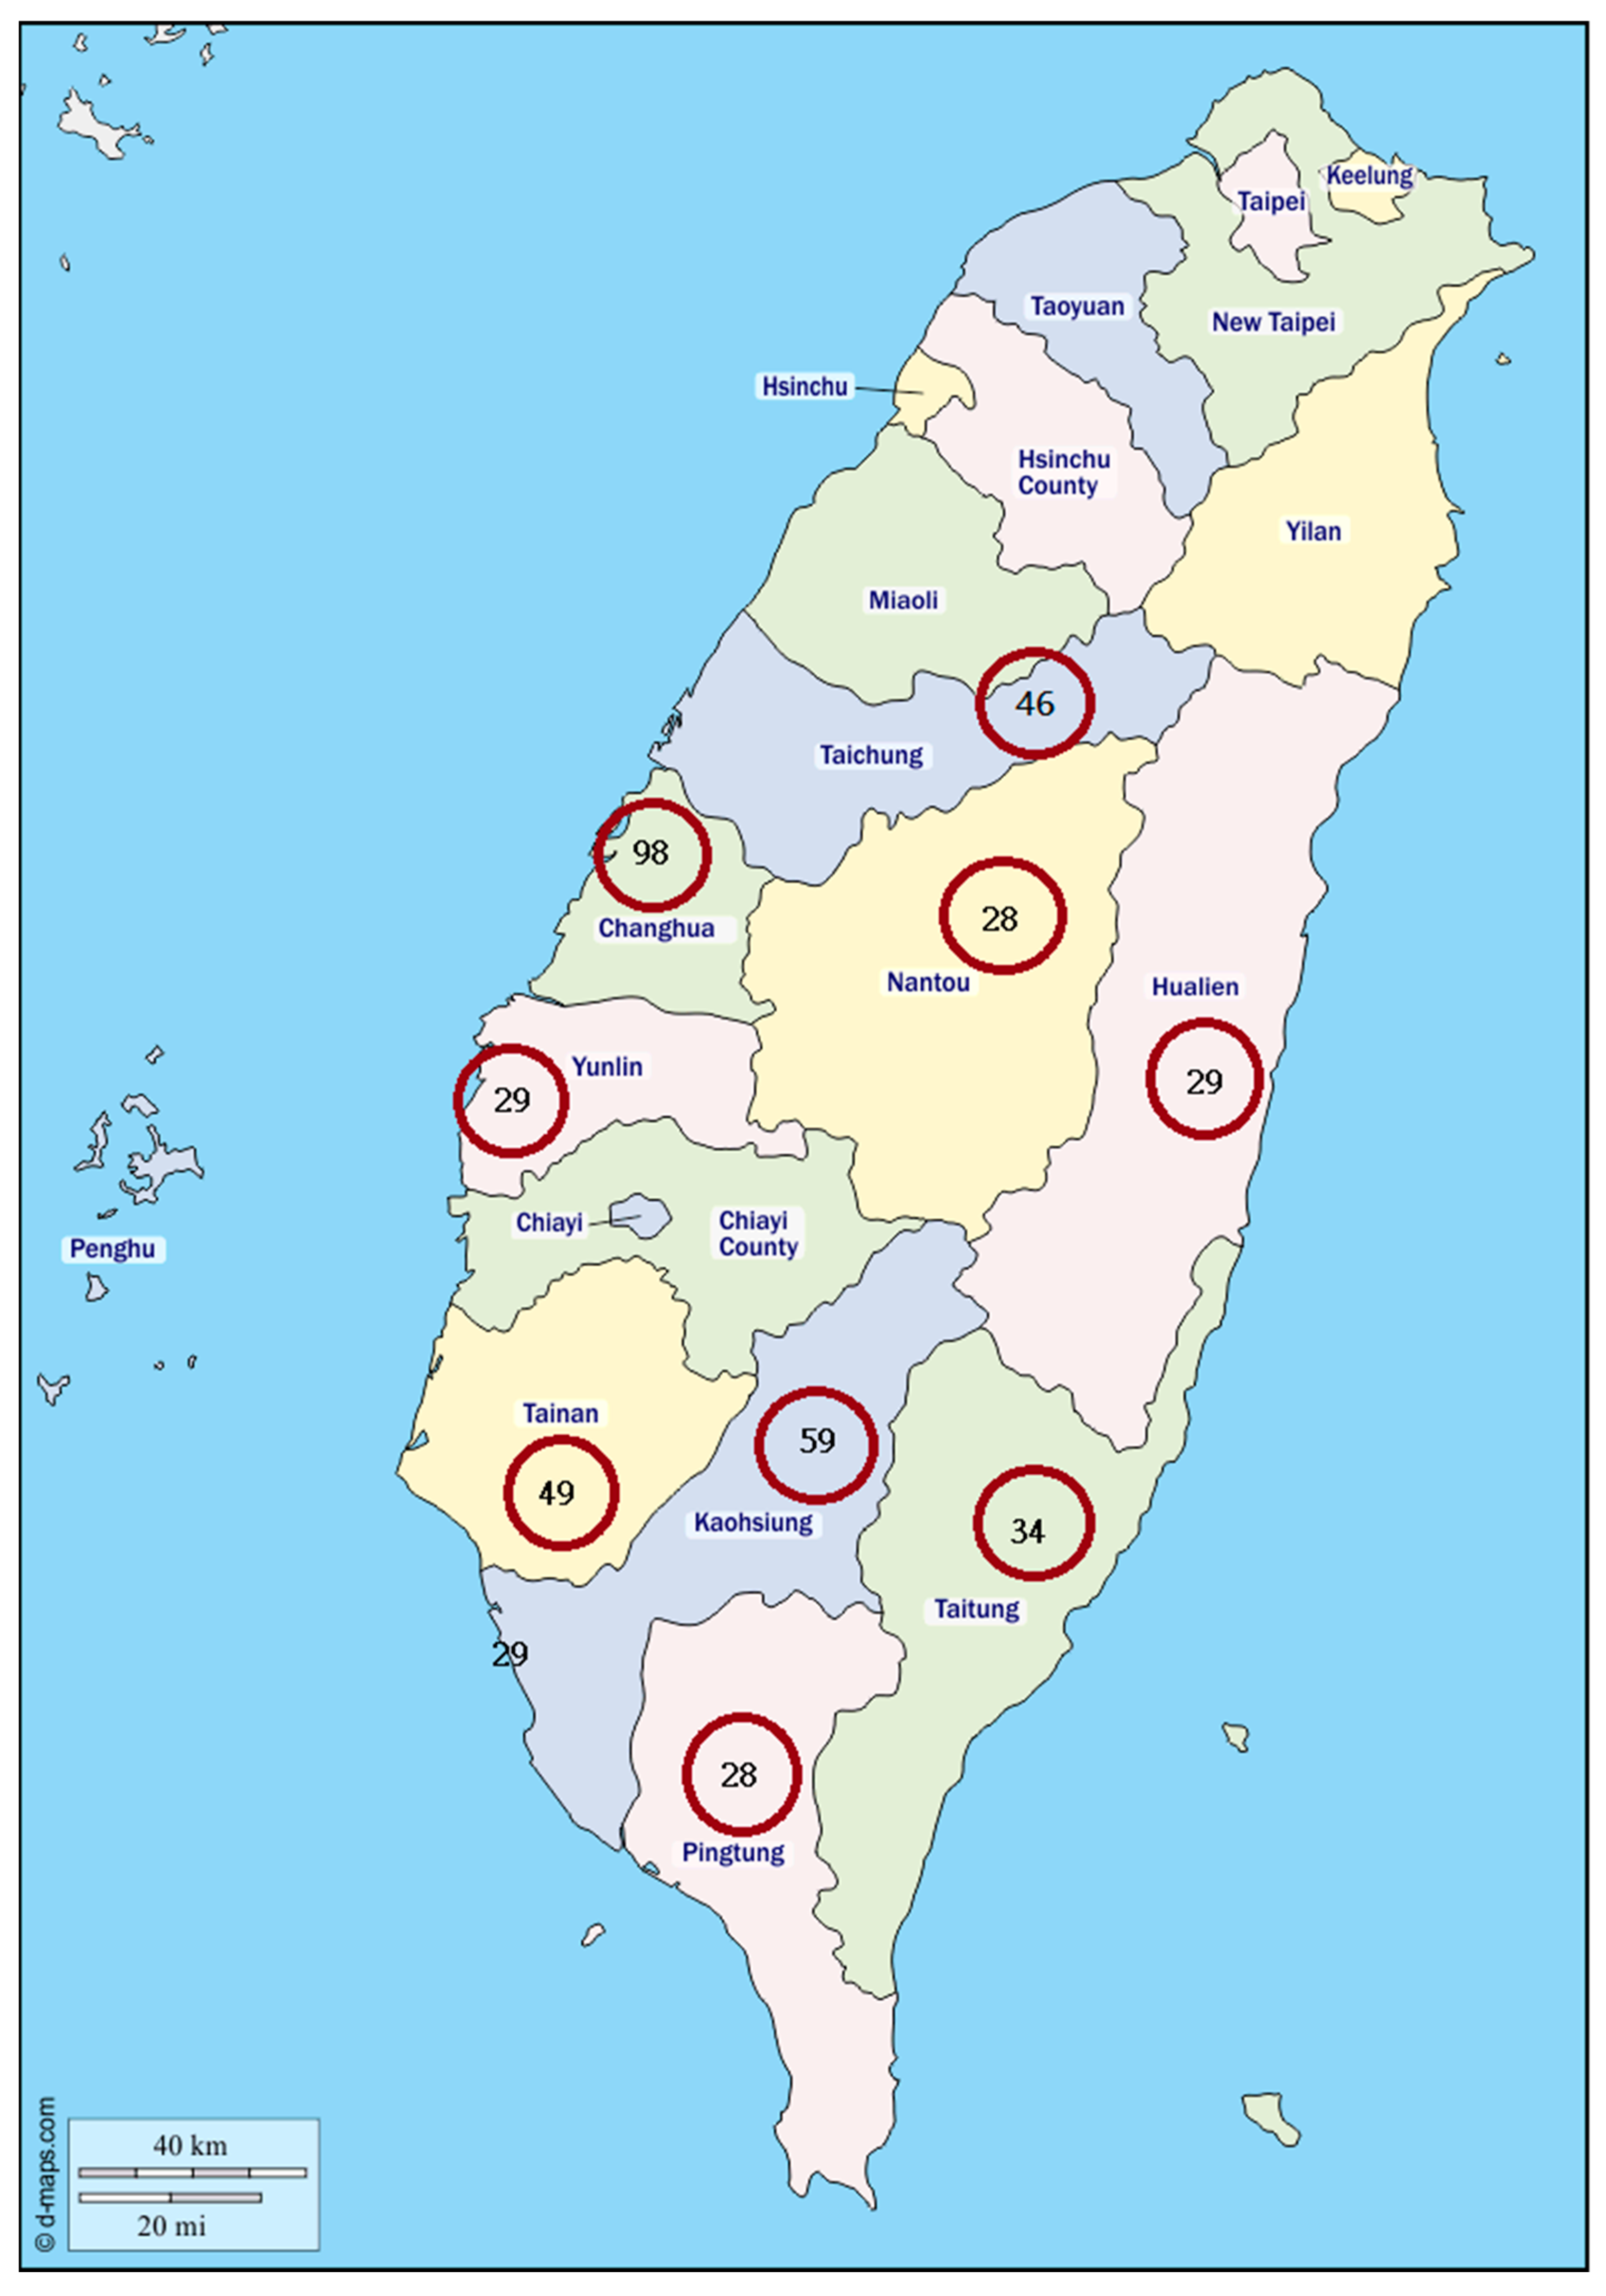
We selected the Neyman allocation sampling method, shown in Equation (7), as the sampling method for this study. Firstly, we randomly selected twenty municipalities in the top eight agricultural counties or cities and included three municipalities on the east coast under the assumption that geographical and regional differences exist. Secondly, we used annual income from agricultural production as a filtered criterion for each agricultural product type and to determine the size of the subsample in each selected municipality. The allocation for the 400 selected farmers is illustrated in
Table 1 and
Figure 1.
where
represents each stratum;
is the total sample number;
is the number of sampling units in stratum
; and
is the standard deviation in stratum
.
A pre-survey was conducted to obtain information regarding the distribution of people’s willingness to pay for meteorological information services. The people’s understanding and the acceptability of the survey questions were also tested. Respondents were asked open-ended questions in the pre-survey from 31 July to 6 August 2013, and people could freely fill out the amount of their willingness to pay. Respondents were interviewed face-to-face and there were 36 effective observations. Then, that information was used to design our official survey.
To find the most efficient WTP intervals in the questionnaire, the amount of WTP ranged from low to high based on the pre-survey data and extreme values were eliminated to reduce observation errors. Following the method suggested by Wu [
22] (p. 126), the 15th, 23th, 31th, 38th, 46th, 54th, 62th, 69th, 77th, and 85th percentiles of the pre-survey data were used as the bidding prices of the WTP asked in the first stage of the official questionnaire.
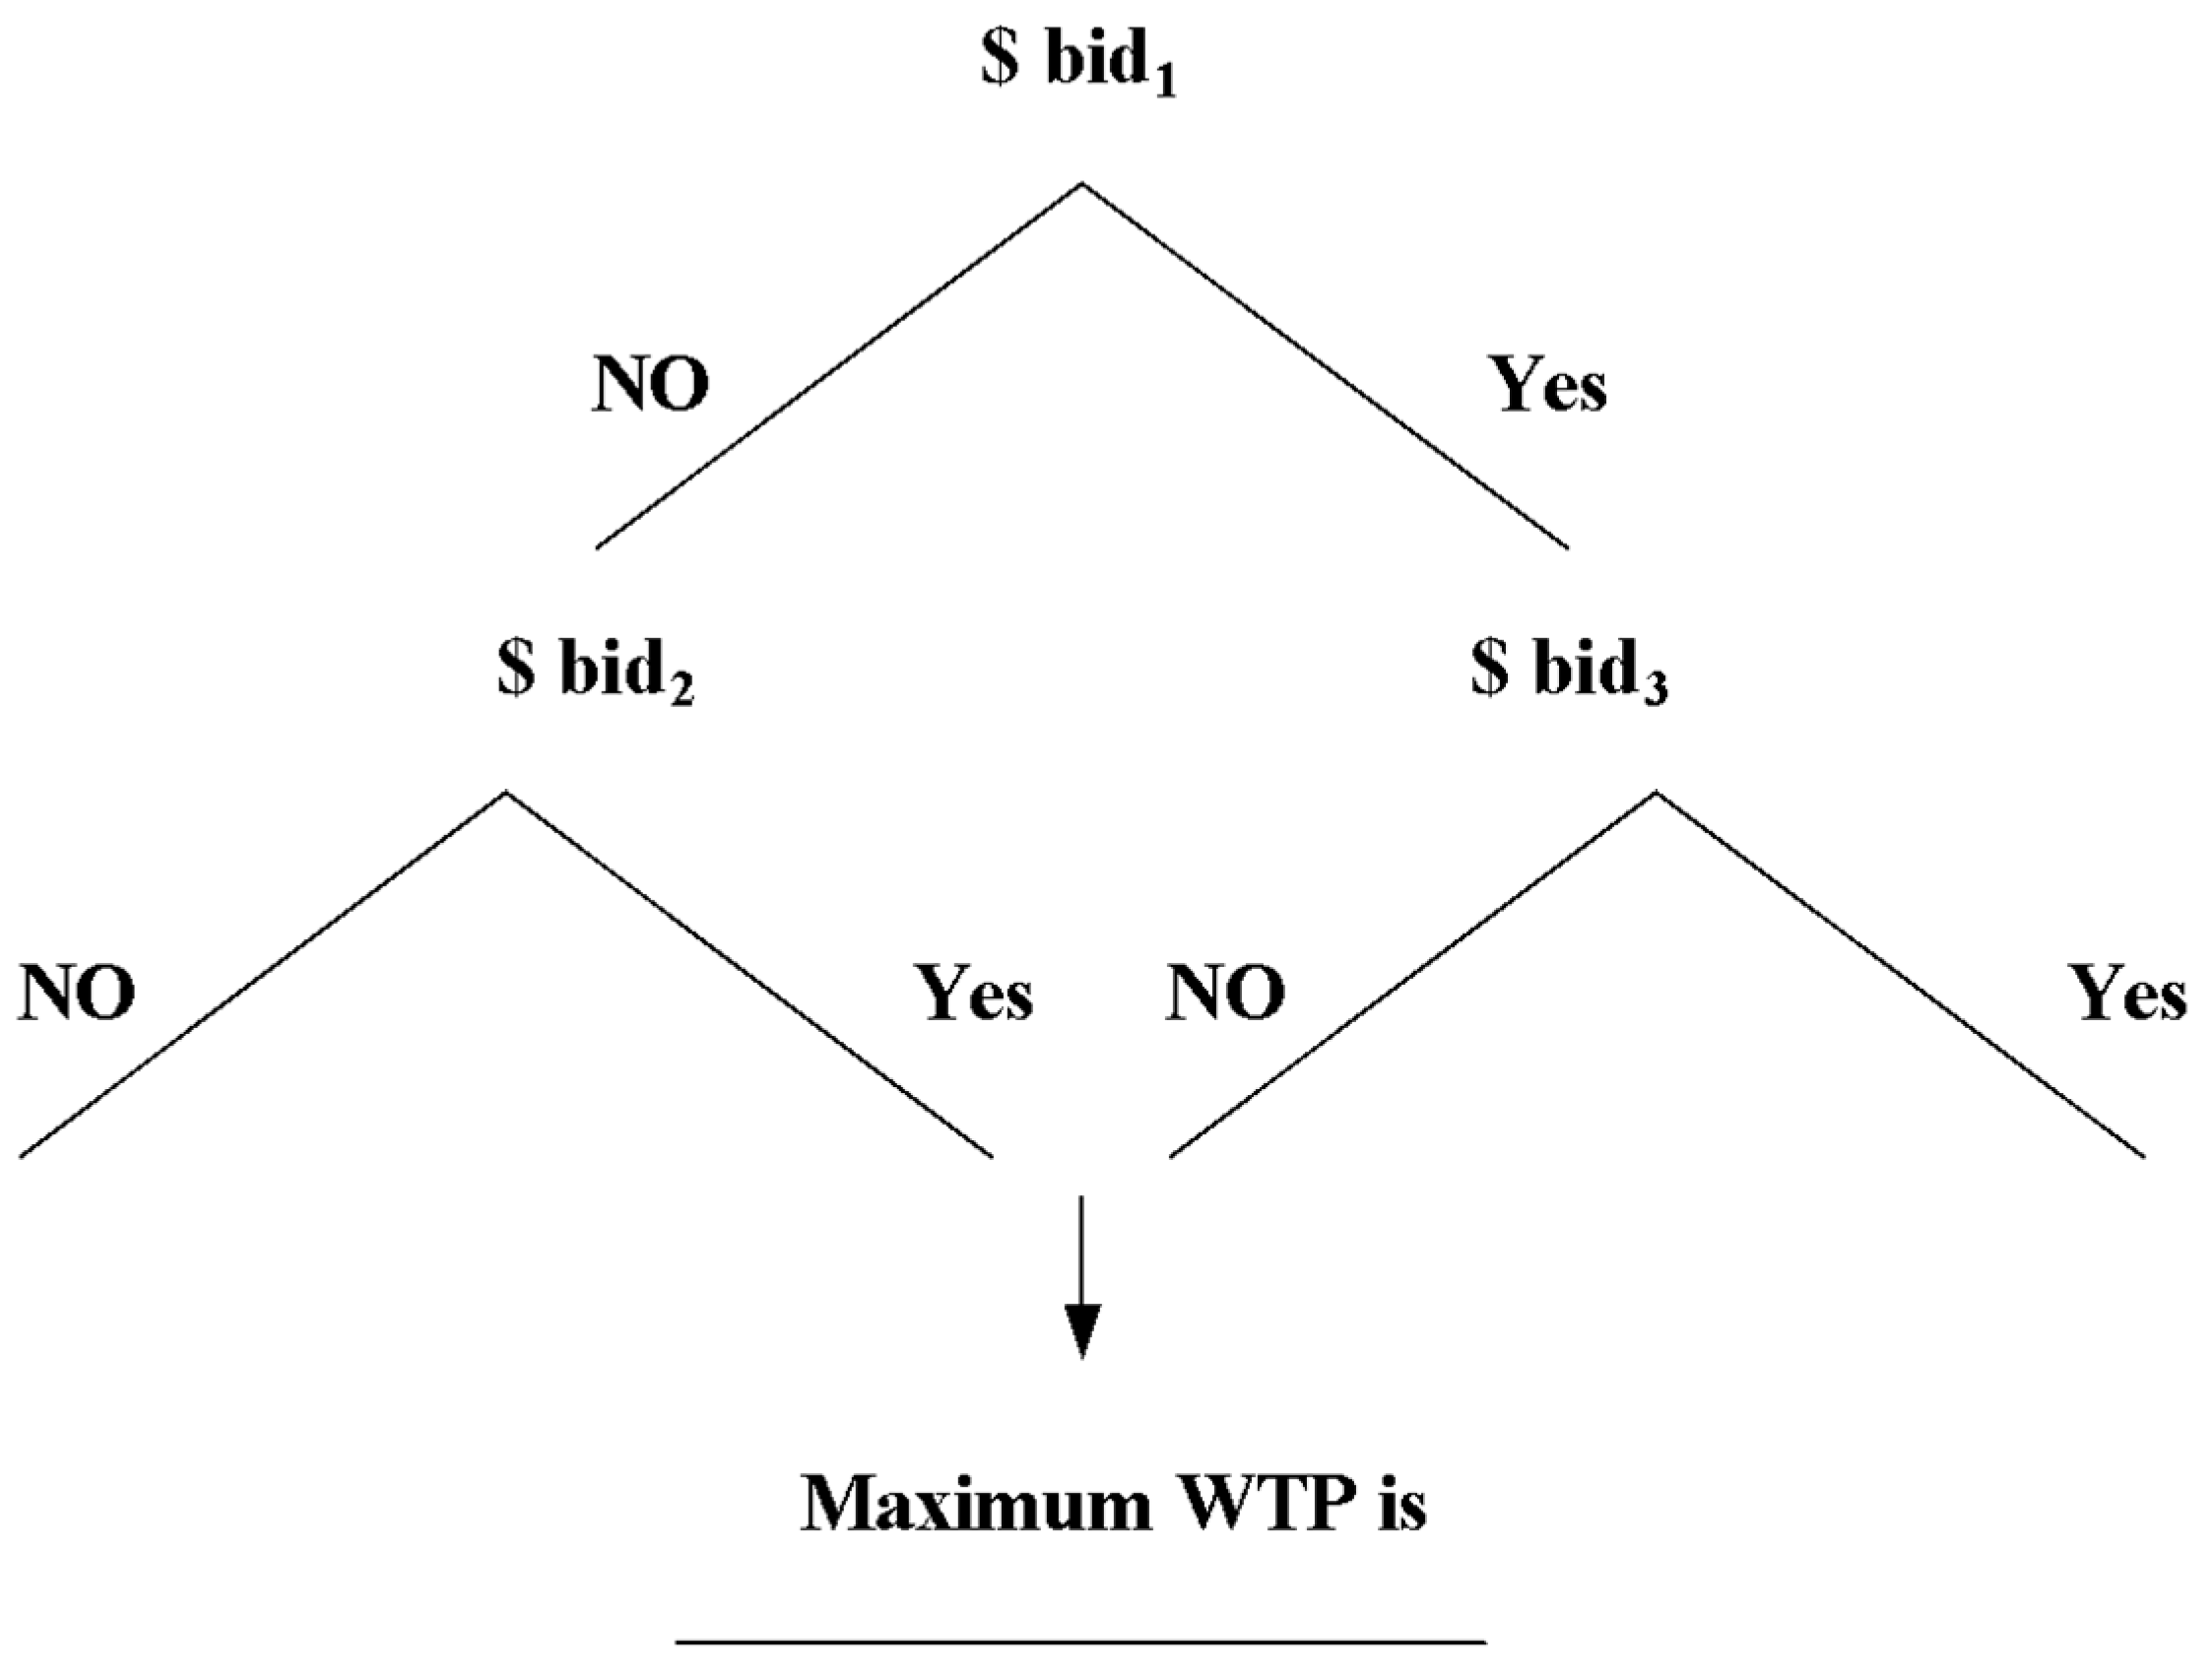
To increase the response rate, we adopted the dichotomous choice model with an open-ended question for WTP valuation. Respondents were given the first bid as “bid1” shown in
Figure 2. They needed to consider whether his/her real value was higher than the value of the first bid, and answer yes or no. Then, this process was repeated. Respondents who answered yes were given a new value (bid2) which was higher than the first bid, while those who answered no were given a new value (bid3) which was lower than the first bid. After finishing the second stage, the investigator asked the respondent what value was the maximum WTP for him or her. The advantage of using this method is to offer a bargaining process, as we usually buy a normal commodity in a traditional market. For those who may not have a certain amount of value in mind, they would be able to figure out what their perceived economic value of meteorological information services was at the end. In other words, this valuation question design makes the bidding process easier, and it is more convenient for both respondents and investigators to understand the valuation question.
More specifically, ten types of questionnaires (A–J; see
Table 2) were used in the formal survey depending on the starting amount of the bid prices asked and they were randomly chosen to give to the respondent.
The total number of official questionnaires conducted in this study was 400. In 61 of the total interviews, respondents gave a zero for their WTP and refused to pay any amount of money even though they perceived meteorological information services provided by the CWB as valuable for their agricultural activities. Moreover, they believed that meteorological information services are supposed to be provided by the public sector free of charges. In 55 interviews, respondents were not very certain about their perceived value of the meteorological information services. Therefore, 284 interviews were identified as the successful sample (the effective response rate was 71%) and were used to estimate WTP in this study.
5. Empirical Results
The empirical model attempts to explain the effects of independent variables on the people’s WTP to obtain the meteorological information services and can be expressed as follows:
where
is the willingness to pay of respondent
; and
and
are coefficients to be estimated.
There are three parts in the survey. Thus, there are three categories of explanatory variables in Equation (7). The first is the acknowledgement and using experience of the meteorological information services.
is a dummy variable that shows farm management and production increase with the help of weather information.
is a dummy variable that shows loss prevention with the help of weather information. The second group consists of the methods of payment preferred to reflect the WTP for the meteorological information services.
is first bid price; we have ten sets of different bidding combinations.
is the respondent’s subjective score for the weather forecast accuracy (0–100).
is a dummy variable for experiences of loss due to weather changes. The last group consists of the respondent’s socioeconomic characteristics, including age (
), gender (
), education (
), experience in agricultural activities (in years) (
), farm size (in hectares) (
), annual agricultural revenue (in 10,000 TWD) (
), major agricultural products (
), and geographic location (
).
Table 3 shows the summary statistics of the explanatory variables.
The empirical results generated by using the valuation function in Equation (7) are summarized in
Table 4. We found that the independent variables which are statistically significant for agricultural producers’ WTP include the respondent’s subjective score for the weather forecast accuracy (
), farm size (
), and first bid price (
). On the other hand, participants’ perception of risk, education level, age, type of agricultural product, and geographic difference are not statistically significant in our valuation function model.
There are three statistically significant variables in our model, and they are discussed below in turn. In terms of “”, its coefficient is 6.28, implying that agricultural producers who are willing to give a higher score for the accuracy of weather forecasts are more likely to have a higher WTP value. Based on the estimated result, increasing the weather forecast accuracy rating by one point may increase average WTP by 0.19 US dollars. Based on analysis of data from an effective sample of 284 respondents, the average score for grade is 74 points. That might indicate that agricultural producers believed that the accuracy of weather information could still be improved further. Taking this variable into consideration and assuming the agricultural producers’ perceived accuracy of weather information could be improved to a perfect condition (i.e., 100%), the maximum value of additional WTP value would reach 5.15 US dollars per month.
Moreover, the coefficient estimate for “” is 103.42, meaning that agricultural producers who have a greater farm size will be more likely to have a higher WTP. Based on the empirical result, if one has one additional hectare in his/her farm size, he/she will be likely to give 3.28 more US dollars for services per month. Lastly, “” is also a statistically significant variable, and the coefficient estimate is around 0.62. This is consistent with what the literature has suggested about the issue of starting point bias, as we mentioned in the previous section. This result also indicates that respondents will give their WTP value of weather information based on the given first bid price randomly in the survey. Since respondents may not reveal their true WTP values when we asked them the WTP question, we used the function in Equation (2) to calibrate and make adjustments to the estimated value of WTP to reduce the effect of the starting point bias error.
Considering all these conditions, we used Equation (3) to estimate monthly WTP for each type of agricultural household. Based on the result from our valuation function model, the adjusted monthly WTP for every agricultural household is between 4.66 million US dollars and 7.55 million US dollars at a 95% confidence interval, and 6.12 US dollars on average. Annual WTP ranges from 55.95 to 90.75 million US dollars, and is 73.34 US million dollars on average.
We tried to infer the aggregate values of meteorological information services for the six selected agricultural household types in Taiwan by using the estimated WTP above, based on the number of households of agricultural producers in the national agricultural reports, and the sample of effective responses. The formula we use is described in Equation (8).
where
is total economic value of weather information per year;
is the proportion of effective sample size (effective response rate);
is the total number of households producing each type of agricultural product; and
is the estimated mean WTP per year per agricultural household.
The annual agricultural reports in 2012 have suggested that the total number of households for six types of agricultural producers is 705,198, including 226,165 households for rice farmers, 31,274 households for coarse grain farmers, 133,424 households for special crops farmers, 132,270 households for vegetable farmers, 170,919 households for fruit farmers, and 9146 households for ornamental plant farmers, respectively. Assuming our selected sample can represent the whole population of agricultural producers in Taiwan, the inferred annual economic value of meteorological information services for agricultural producers in Taiwan is between 28.06 million US dollars and 45.51 million US dollars, including 9.07–14.69 million US dollars for rice farmers, 1.24–2.03 million US dollars for coarse grain farmers, 5.30–8.60 million US dollars for special crops farmers, 5.27–8.54 million US dollars for vegetable farmers, 6.79–11.01 million US dollars for fruit farmers, and 0.35–0.60 million US dollars for ornamental plant farmers.
6. Conclusions
This study utilized the research methodology of the contingent valuation method, and a national door-to-door survey was conducted. In total, 400 respondents were randomly selected using the Neyman allocation method, and the data were collected through door-to-door interviews. An estimate of WTP for meteorological information services for agricultural producers was computed. Based on the empirical analysis, the adjusted WTP for every agricultural household each year with a 95% confidence interval ranged from 56.06 US dollars to 90.92 US dollars. The inferred annual economic value of meteorological information services for agricultural producers in Taiwan was 28.06 million US dollars and 45.51 million US dollars. Moreover, we found the agricultural producers’ subjective assessment of weather forecast accuracy, farm size, and first bid price significantly affect the amount agricultural producers are willing to pay for meteorological information services.
This economic evaluation outcome can be discussed from two different perspectives: public sector and private sector. From the perspective of the public sector, how to improve the effectiveness of weather information and the communication with end users in the agricultural sector (i.e., farmers) will be the first priority. Nowadays, the CWB is the only institution providing climate information for the country. This research result can not only be used for conducting performance evaluations for relevant services provided by the CWB, but more importantly, can be used as a reference for policymaking in terms of resources allocation including what government projects to invest in, and how much to invest.
Moreover, from the perspective of the private sector, the result of this study is related to the development of the domestic weather information market. Globally, many different forms of weather information have been developed to meet customer needs and are sold as commercial products. This result can serve as an evaluation of the size of the domestic weather information market for agricultural use. More importantly, if the institution (CWB) or private company are considering merchandizing weather information, then this result can serve as a reference for price-setting strategies.
In addition, it is noted that the questionnaire designed by this study did not clearly define the detailed technical specifications of the meteorological information service while asking about the respondent’s WTP. Therefore, the WTP obtained in this study only represents the respondent’s evaluation of the overall meteorological information service provided by the CWB, rather than that of meteorological products for specific specifications. It is one of the limitations of this study.
As an extension of this paper, it would be useful to expand the sample size. Future research would use additional data to obtain more accurate analysis of each subsector in the field of agricultural grain production. Moreover, further research can integrate the two main dimensions of time and space into assessment considerations, which help to identify the attributes of information services. This will bring more insights into the effect of technical specification heterogeneity on the value of meteorological information services. Finally, another useful contribution to the literature would be to conduct similar assessments in agricultural areas to obtain a more complete assessment of the economic value of meteorological information services in agriculture, such as forestry, fisheries, and animal husbandry.


