Article

The Effect of Technological Progress, Demand, and Energy Policy on Agricultural and Bioenergy Markets

by
Montalee Kapilakanchana
1,* and
Bruce A. McCarl
2
1
Bank of Thailand, Bangkok 10200, Thailand
2
Department of Agricultural Economics, Texas A&M University, College Station, TX 77843, USA
*
Author to whom correspondence should be addressed.
Atmosphere 2020, 11(1), 31; https://doi.org/10.3390/atmos11010031
Submission received: 1 November 2019 / Revised: 5 December 2019 / Accepted: 6 December 2019 / Published: 27 December 2019

Abstract

:
This study investigates the consequences of agricultural technological progress, biofuel policy, and agricultural demand growth on crop, livestock, and bioenergy markets, as well as resource usage and greenhouse gas (GHG) emissions, over data in the United States. We formed scenarios for future technological progress, demand growth, and biofuel policy and carried out a dynamic simulation. The major findings are: (1) Increasing technological progress reduces cropland for biofuel and cropland pasture for livestock but increases cropland for crop production; (2) Reducing corn ethanol requirements causes more cropland to move from cropping to pasture uses for livestock, however, lowering ethanol from corn residue has minor effects on cropland use; (3) Lowering the requirement of ethanol from corn lowers the price for most of the field crops and meat commodities, especially corn, hay, sorghum, and non-fed beef; (4) Technological progress and biofuel policy have significant effects of on GHG emissions. Increasing technical progress reduces overall GHG emissions. A lower corn ethanol level results in much larger GHG emissions as compared with the control case. This implies producing corn ethanol is effective in reducing emissions; and (5) Technological improvement is a key factor in meeting growing global demand for food and energy and reducing emissions.

1. Introduction

Besides the basic roles as a food supplier for mankind, the agricultural sector is playing an important role as a source of feedstocks for bioenergy production. Production and processing of agricultural commodities for bioenergy have gained a lot of attention because bioenergy is renewable and potentially beneficial in reducing greenhouse gas (GHG) emissions [1]. In the United States, the production of bioenergy has increased with the implementation of the renewable fuel standard (RFS).
The RFS is a federal biofuel program the goals of which are to support a reduction in GHG emissions and improve U.S. energy stability and sustainability. The program sets a mandatory level of renewable fuel blended into transportation fuel. The eligible forms of renewable fuel in the program are required to have a lower level of GHG emissions compared to petroleum-based fuels. The RFS program was initially established under the Energy Policy Act (EPAct) of 2005 and then was extended by the Energy Independence and Security Act (EISA) of 2007. EISA raised the requirement for the amount of renewable fuel blended from 9 billion gallons in 2008 to 36 billion gallons by 2022 although progress toward this has been slower than anticipated. The RFS requirements for renewable fuel blending have stimulated increased biofuel production.
Up until now the main volume of biofuels used to satisfy the RFS requirement has been produced from corn which is also the primary U.S. feed grain for livestock, and, in turn, this affects human food supplies. The proportion of domestic corn used in the United States for producing alcohol for fuel use has greatly increased during the past 15 years (see Figure 1). More biofuel production as mandated under the RFS will either divert land from conventional crops, use substantial amounts of crop residues, or require substantial volumes of new sources like forestry or water materials. These factors can potentially reduce conventional crop supplies. Thus, an increase in biofuel production competes with the human food supply.
In order to satisfy demands on agriculture for food, feed, and energy feedstocks, agricultural technological progress is critical. A rapid growth of the world’s population places challenges on meeting increasing global food demand and stresses resource availability such as land and water. During 1960 to 2010, the world’s population grew from 3.0 to 6.9 billion people amounting to a 128 percent increase in the population, while global crop yield and cultivated land increased by 57 and 33 percent, respectively [3]. According to a 2012 United Nations report [4], the world’s population in mid-2013 was 7.2 billion people and is projected to reach 8.1 billion in 2025, then 9.6 billion in 2050. In order to meet the projected demand, the United Nations Food and Agriculture Organization (FAO) indicates that agricultural production will need to increase globally by 60 percent [5].
Bioenergy demand is also expected to increase due to many possible reasons such as concerns on climate change mitigation, renewable energy policy action, energy stock depletion, and energy security concerns. The International Energy Agency (IEA) projects that biofuel consumption will increase from 1.3 million barrels of oil equivalent per day (mboe/d) in 2011 to 2.1 and 4.1 mboe/d in 2020 and 2035, respectively [6]. Thus, over the next two decades, to meet the projected demand, biofuel production will have to increase by more than three times from its 2011 level.
Bioenergy production has to expand to meet expected increases in bioenergy demand, but government supports as incentives in investing in bioenergy may not result in an efficient outcome. Government supports such as credit subsidies have been criticized by some economists and political scientists [7]. Besides the government supports, the potential efficient driver for an expanded bioenergy industry is agricultural technological progress. However, the studies on bioenergy investment are limited, and they do not cover the effect of agricultural technological progress.
In addition, there has been a debate about bioenergy effects on food security. Some raise the issue of increasing food prices and food shortage possibilities due to rising demand for biofuel [8,9]. However, some argue that with technological improvements, the agricultural sector will be able to provide an adequate supply of both food and biofuel [8] and that bioenergy production has no significant impact on feedstock prices, i.e., those for corn, wheat, barley, sugarcane, soybeans, etc. [10].
Climate change is an additional complicating factor. Many studies project an altered mean and increased yield variability under climate change [11,12,13,14,15,16] with some projecting decreases in yields [17]. The interesting finding related to climate change is that under the higher crop yield growth rates, GHG emissions associated with land use change were found to be smaller than those under other scenarios [18]. These findings lay emphasis on the significance of the technological progress or crop growth rates as it influences the effects of bioenergy policy. Hence, agricultural technological progress is needed to meet the demand growth for both food and energy and overcome the negative consequences of climate change.
An ambitious and challenging question now is how to meet growing food and energy global demands, while preserving environmental quality. The suggested solutions are sound public policy, technological improvement, and global collaboration [19,20]. The technological progress coupled with biofuel policy possibility is the main focus of this paper.

2. Methodology

To carry out this analysis, the agricultural technological progress, demand growth, and biofuel policy scenarios were formed separately. Then we incorporated them together. Finally, we carried out a dynamic simulation under those integrated scenarios.

2.1. Forming Future Scenarios

2.1.1. Technological Progress Scenarios

The technological progress scenarios were formed from the years 2015 to 2100 based on the error distributions around crop yield estimation models coupled with long-term correlations of technological progress. The crop yield estimation models estimated crop yield progressed over time using historical crop yield data based on the regional level. In selecting time trend functions, the potential functional forms considered are linear and exponential functions. Additionally, a structural break point was allowed within the model to account for possible changes in yield growth rates over time.
We simulated alternative yields in the years 2015 to 2100 under stochastic yield variables ( Y ˜ k j ) based on a multivariate probability distribution, and randomly drew 50 technological progress scenarios. The stochastic yield variables were also correlated based on 10-year ratios of historical crop yield data. To randomly draw the regionally correlated technical progress scenarios, we followed the simulation of a multivariate empirical (MVE) probability distribution [21]. Each yield random variable was simulated as
Y k J ˜ = Y ^ k j + Y ^ k j * E M P j .
The forecast yield for year k and region j is represented by Y ^ k j , where j = 1, 2, 3, …, n and k = 2015, 2016, 2017, …, 2100.   E M P j represents the jth empirical distribution. Both stochastic (the error distributions around yield forecasts) and multivariate components (long-term technological correlation matrix) are embedded in the empirical distribution. Then each yield random variable was simulated for 50 iterations under the MVE distribution. Lastly, we tested whether the resultant random data exhibited the appropriate correlation coefficients. With the passing result of the correlation coefficients test, the set of 50 technological progress scenarios from the random draw of crop yield simulation under the MVE distribution was appropriate and ready to use.

2.1.2. Demand Growth Scenarios

Analysis of demand for crops and other related commodities focused on the demand in the United States. To set up the demand scenarios, first, we drew data on the commodities barley, corn, cotton, oats, rice, sorghum, soybeans, wheat, beef, broiler, and pork. The commodities were selected due to their value, incidence in U.S. crop acreage, and availability of demand data. Furthermore, much of the demand for corn, barley, oats, sorghum, and soybeans is for livestock feed, so beef, broiler, and pork were included.
In the demand analysis, the main variables examined were consumption per capita or per capita demand of each commodity (D), real GDP per capita (GDPP), and real commodity price (P). The most commonly used functional forms selected to use in this demand analysis were: (1) Linear, (2) Log-Lin, (3) Lin-Log, and (4) Double-log. For each functional form, we estimated four models containing the main variables and additional explanatory variables including a time trend variable (Tt) and quantity demanded in the previous period (Dt-1). The specifications of all demand models used in this demand analysis are presented in Table 1.
In summary, 16 different models were estimated for each commodity using Ordinary Least Squares (OLS) regression. To choose the best model for estimating quantity demanded for each commodity, we used the simple criterion of minimizing the residual root mean squared error (Root MSE) and also corrected for autocorrelation problems. Then the selected demand models were used to forecast quantity demanded for all commodities during 2000 to 2100. Then three demand scenarios were set up based on estimated demand forecast. The three demand settings are:
  • Base Demand scenario uses the mean of the estimates of quantity demanded ( x ¯ ),
  • Fast Demand scenario uses the upper boundary of a 66.67 percent confidence interval estimate ( x ¯ + z 0.833 * S D ),
  • Slow Demand scenario uses the lower boundary of a 66.67 percent confidence interval estimate ( x ¯ z 0.833 * S D ),
where z 0.833 is the value from the standard normal distribution for the 66.67 percent confidence level and SD is the standard deviation value. For each demand scenario, we calculated the ratios of demand values, using 2015 as a reference year, and these ratios were put in the dynamic simulation discussed in the next subsector.

2.1.3. Biofuel Policy Scenarios

Lastly, the biofuel policy was combined into the scenarios. We provide three biofuel policy scenarios which differed in feedstock and volume mandates. The scenarios were a control scenario that implemented the volumes foreseen in the Energy Independence and Security Act (EISA) for the RFS and then ones that altered the production of ethanol from corn and corn residue as shown in Table 2. In short, the control scenario had all the RFS requirements using corn, switchgrass, corn residue, and other ethanol, while the other scenarios decreased the ethanol volume of corn or corn residue so we could observe the marginal effects of requiring ethanol from those feedstocks. For the Corn scenario, only the volume mandate for corn ethanol produced was reduced from 15.0 to 12.4 billion gallons. And for the CornRes scenario, the volume mandate for ethanol from corn residue was reduced from 4 billion gallons to zero.

2.1.4. Main Integrated Scenarios

Finally, we set up nine main integrated scenarios by combining the three demand growth scenarios, and the three biofuel policy scenarios together that were run under all of the 50 technical progress scenarios. The nine scenarios are Base Control, Base Corn, Base CornRes, Fast Control, Fast Corn, Fast CornRes, Slow Control, Slow Corn, and Slow CornRes, described in Table 3. These scenarios were used in a dynamic simulation discussed in the next subsection.

2.2. Dynamic Simulation

The dynamic simulation model used was the Forest and Agricultural Sector Optimization Model with Greenhouse Gases (FASOMGHG) [22], which simulates markets and biofuel investment over time. It was run under the integrated scenarios of technical progress, demand growth, and biofuel policy.
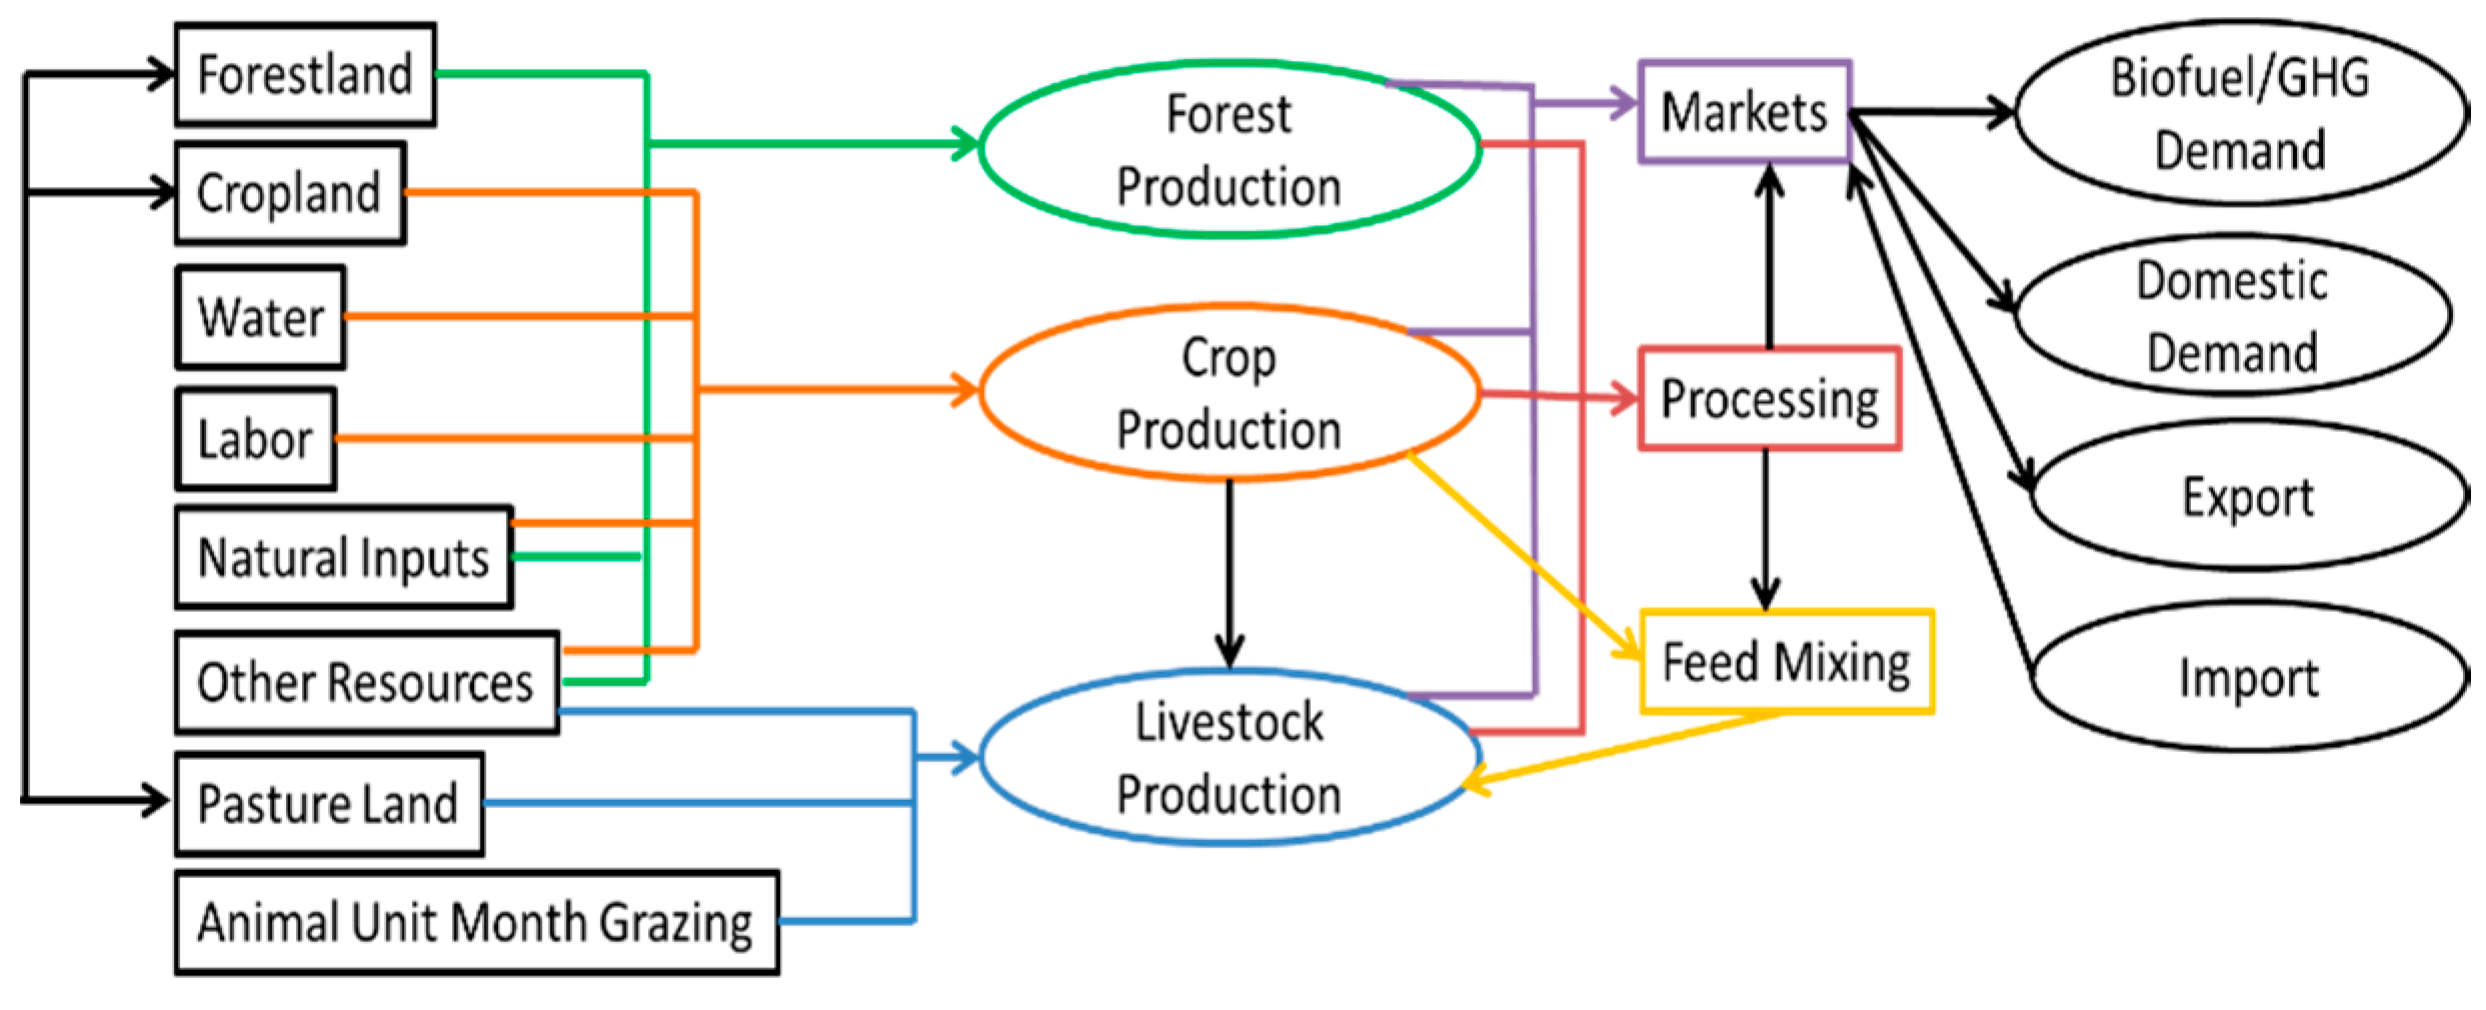
The FASOMGHG model solves a dynamic optimization problem by maximizing the inter-temporal economic welfare, in other words, the net present value of the sum of producers’ and consumers’ surplus across the U.S. forest and agricultural sectors over time [22,23]. This simulates perfectly competitive equilibria in the factor and product markets in each time period simulated. The model structure of FASOMGHG is described in Figure 2.
In FASOMGHG, the main endogenous variables are commodity and factor prices; production, consumption, and export and import quantities; land use allocation between sectors; crop mix, livestock mix, agricultural processing, management strategy adoption; resource use; economic welfare measures; producer and consumer surplus; net welfare effects; and environmental impact indicators, such as net GHG emissions [22].
We simulated nine main integrated scenarios for technical progress, demand growth, and biofuel mandate changes. Then the results of the simulation under alternative scenarios were compared and discussed regarding land use, price, and GHG emissions to examine the effects of agricultural technological progress, demand growth, and biofuel mandates.
Furthermore, we used the FASOMGHG output from the simulations for several select years to estimate a regression equation that gave the effect of technological improvement on land use, price, or environmental concerns including GHG emissions. After the function was derived, we could examine the marginal effect of alternative levels of technological improvement.

3. Data

For forming technological progress scenarios, data were gathered for six major field crops in the United States including corn, cotton, hay, sorghum, soybeans, and winter wheat. State-level yield data were drawn using the Quick Stats 2.0 tool from United States Department of Agriculture (USDA) and the National Agricultural Statistics Service (NASS) [25] from 1950 through 2014.
Agricultural demand data were obtained from other sources as follows: (1) commodity import, export, domestic consumption, price, and production data from NASS [26]; (2) crop price projections from USDA [27] long-term projections; (3) real historical gross domestic product (GDP), growth rates of GDP, and historical GDP deflators in 1969 to 2014; projected GDP, growth rates of GDP, projected GDP deflators, projected U.S. population, and growth rates of U.S. population in 2010 to 2030 from the Economic Research Service (ERS) [28]; and (4) historical GDP, GDP deflators, and U.S. population in 1950 to 2009 from Economic Research Division, Federal Reserve Bank of St. Louis [29].

4. Analysis and Results

This section is separated into two parts. The first part provides the average results from the dynamic simulation analysis, the effect on the mean. The second part presents the results of the regression analysis using the output from the simulations. The discussion and the possible reasons for the results are also provided on both parts.

4.1. Effect on the Mean

4.1.1. Cropland Mean Results

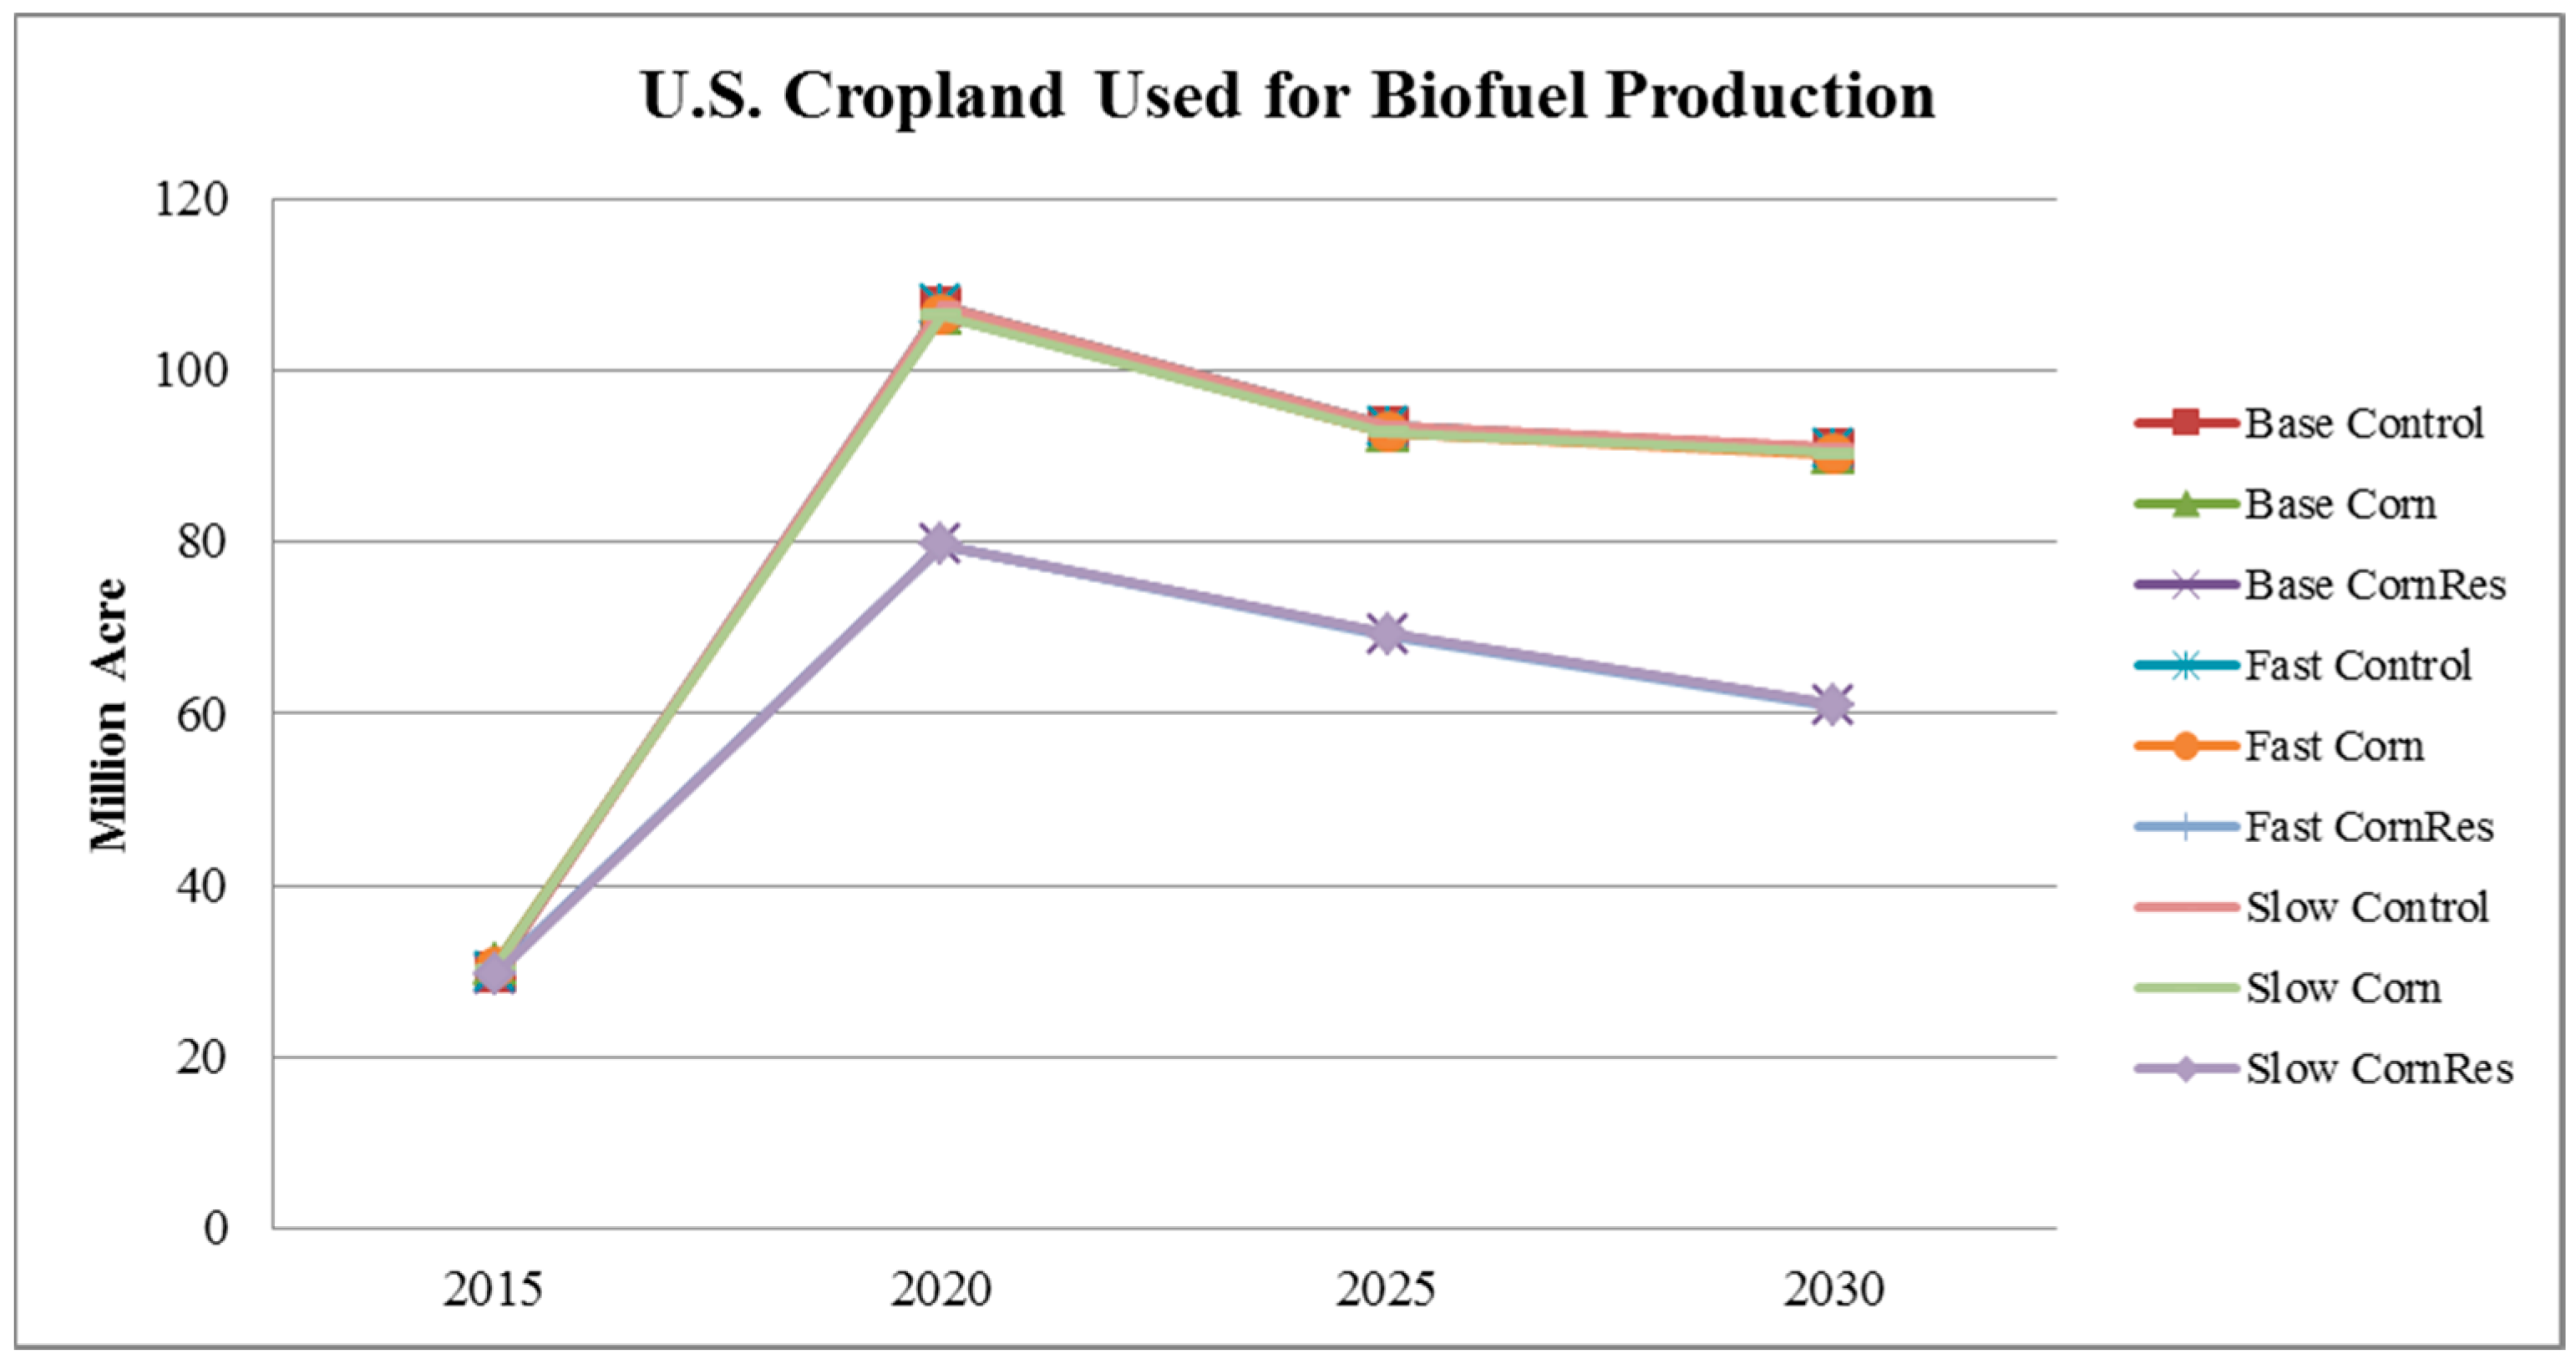
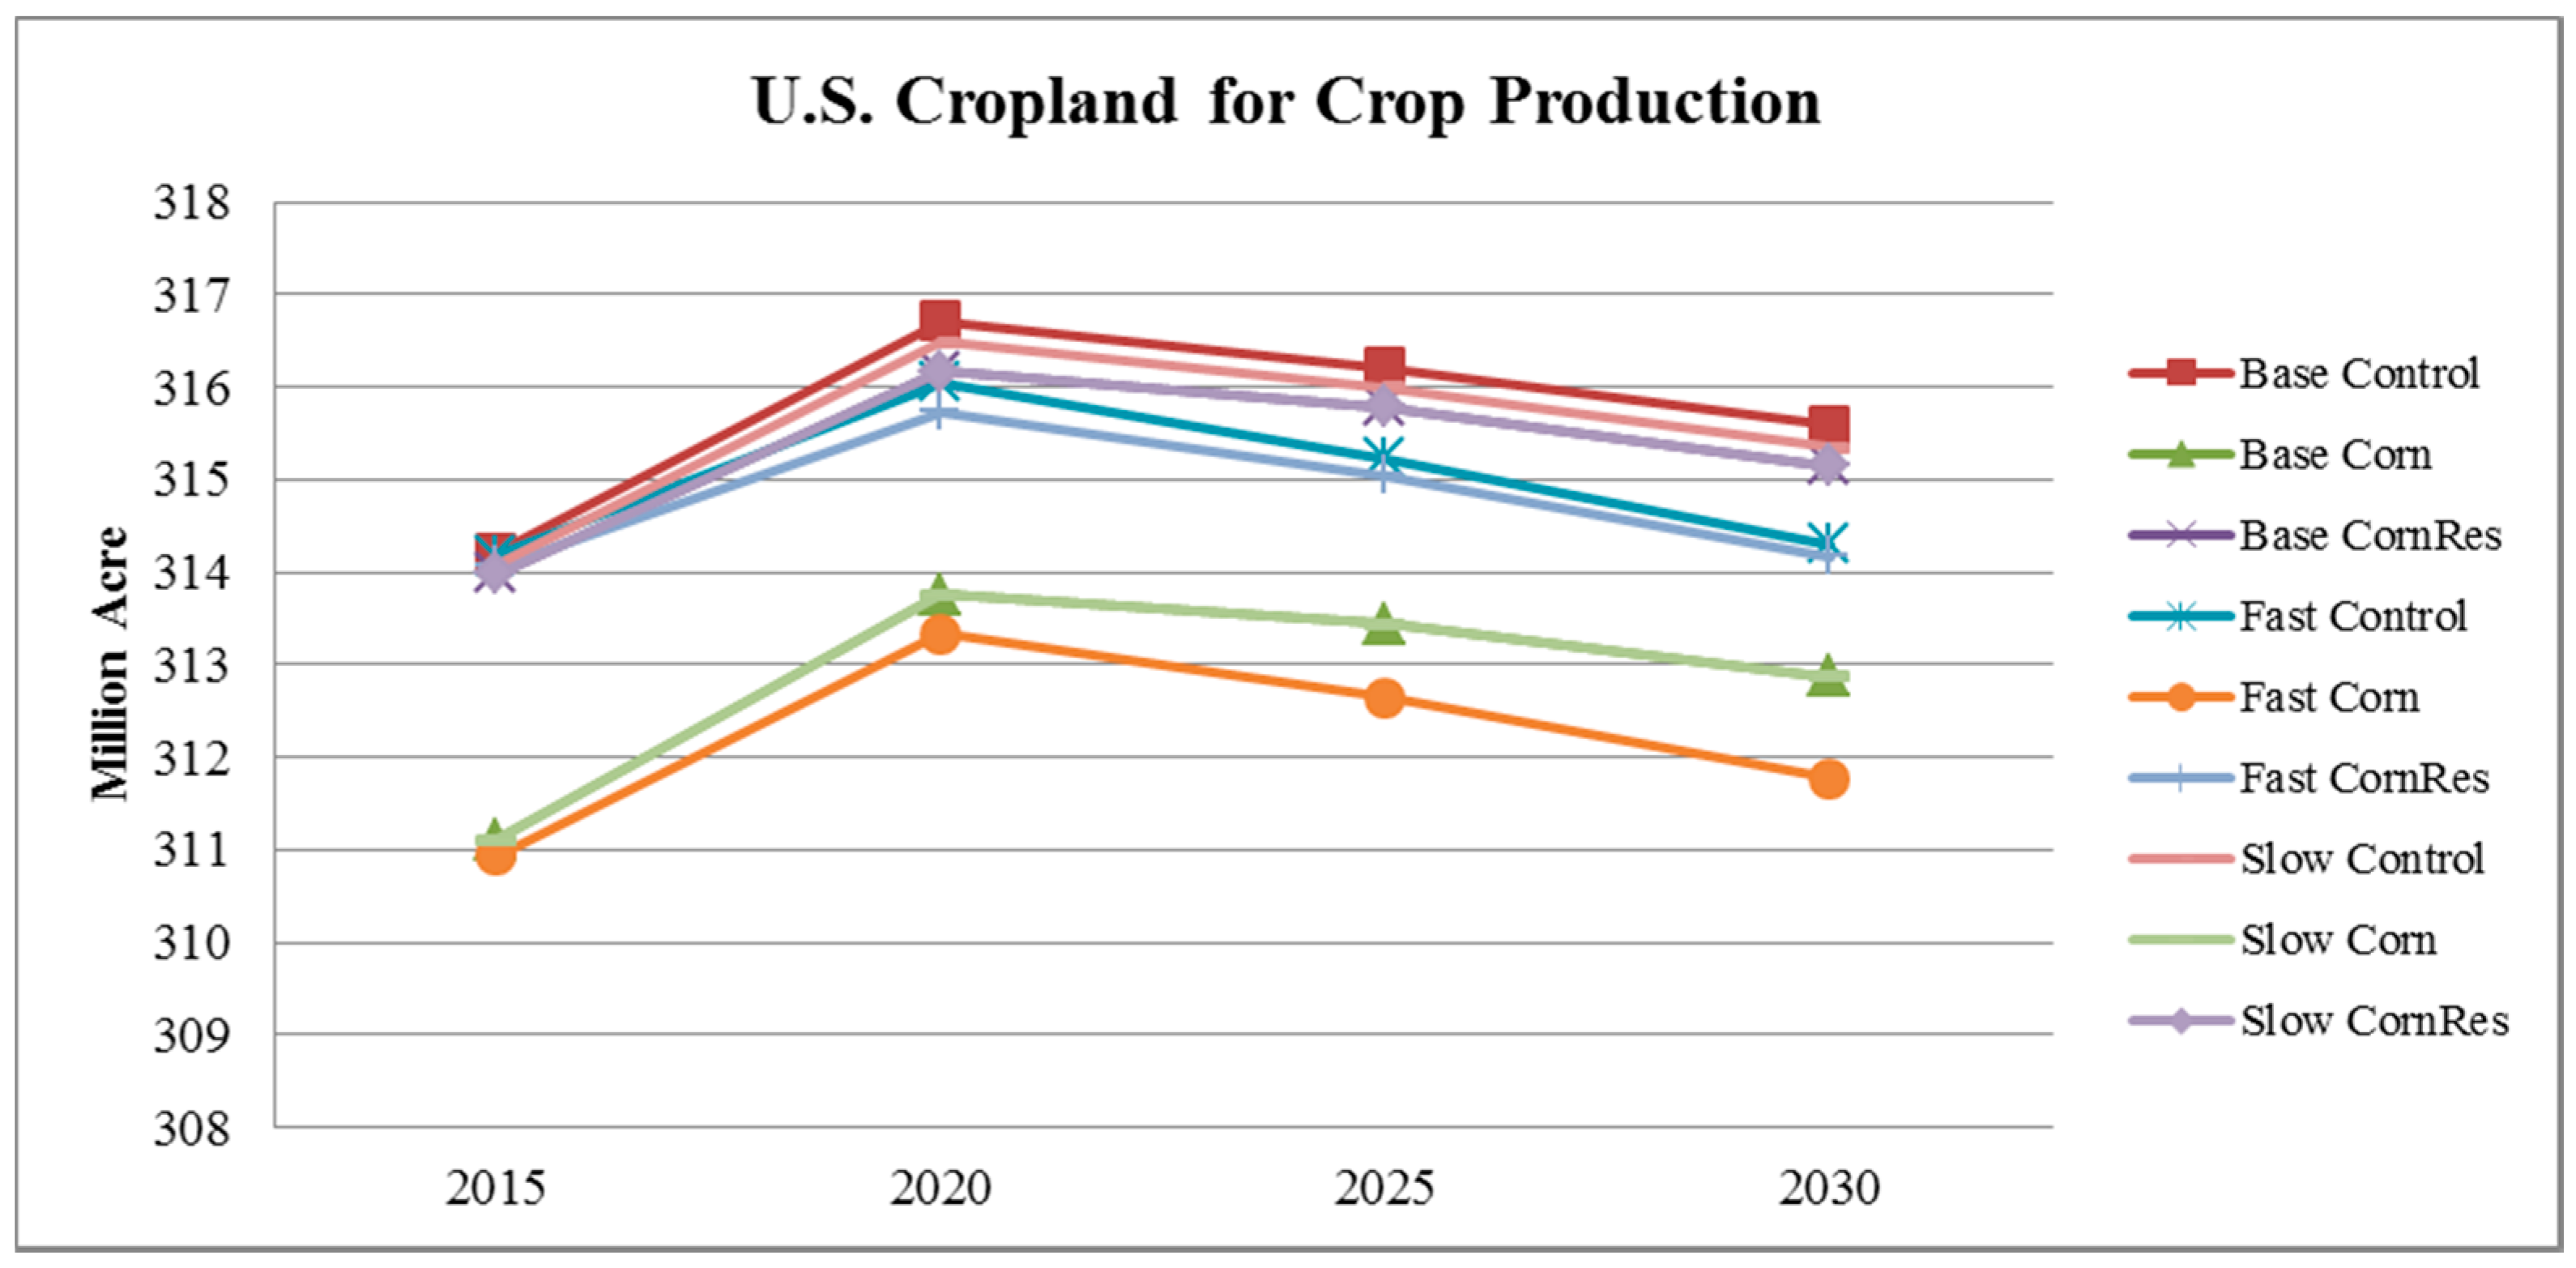
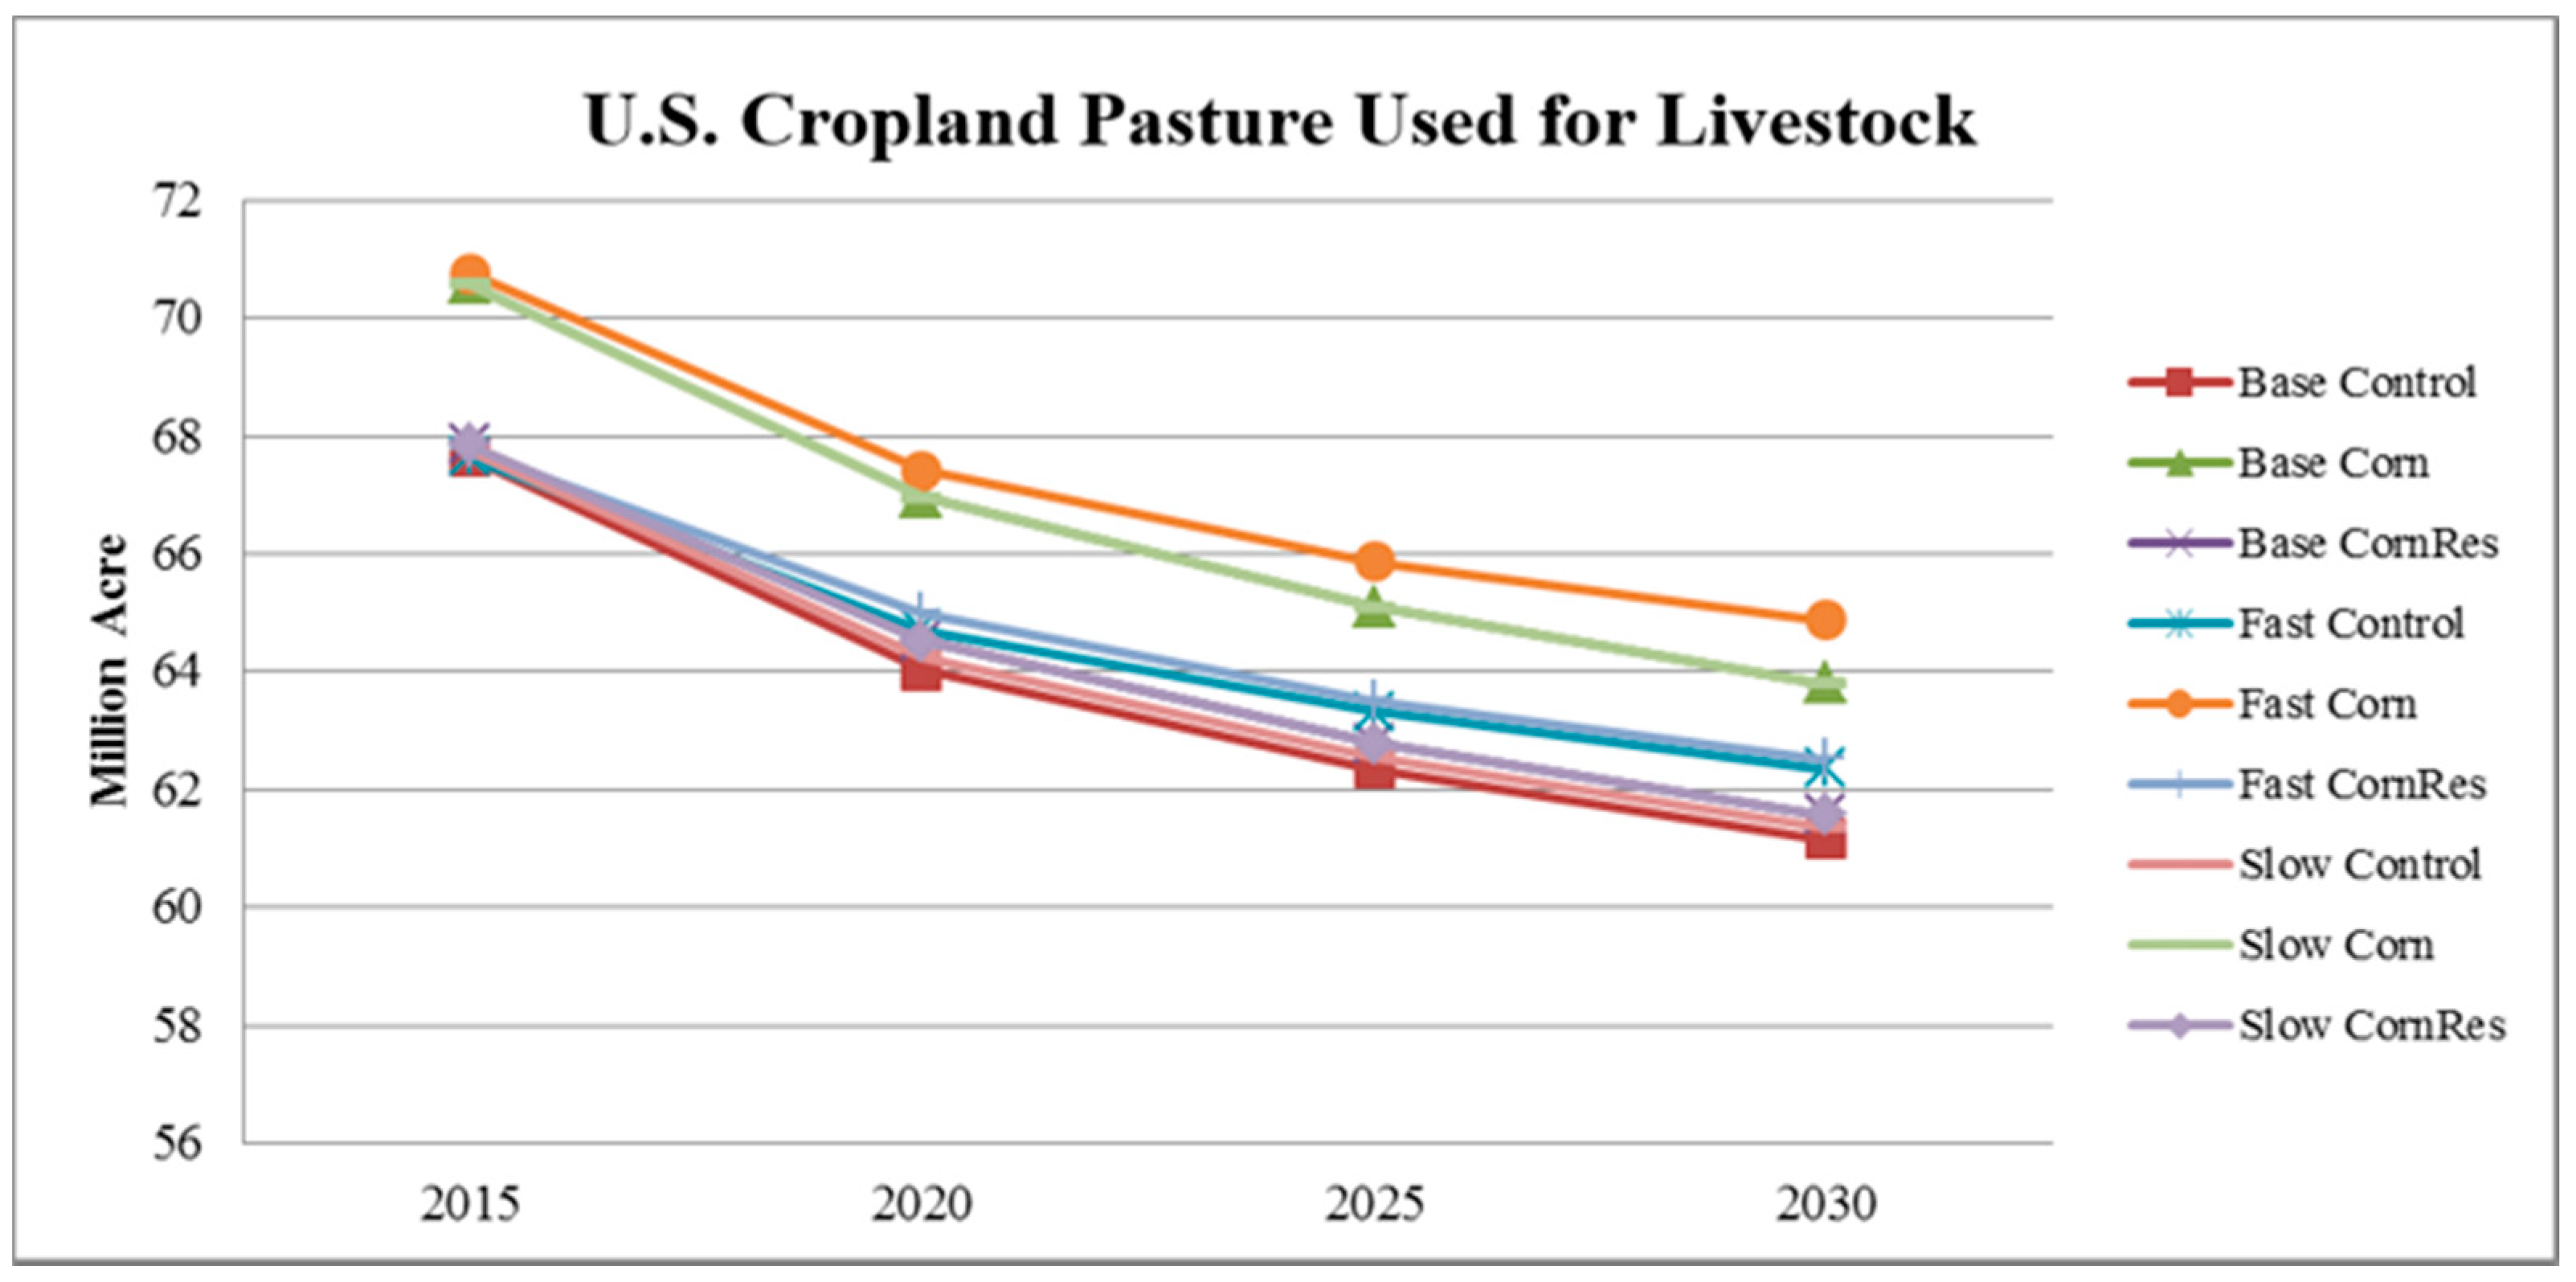
Cropland use differs based on biofuel requirements, demand growth, and technological progress; U.S. cropland for biofuel production rises substantially in 2020, then is followed by the decrease (see Figure 3). Land use for crop production also increases in 2020, and after that, it falls slowly (see Figure 4). This likely results from the increase in technological progress. Nevertheless, the area for livestock shows only a decrease until the end of the projection (see Figure 5).
Regarding Figure 5, among the biofuel policy and demand growth scenarios, the interesting finding is that the largest land use for livestock occurs under the Corn policy with Fast demand growth scenario (an orange line), while the smallest one is under the Control policy with Base demand growth scenario (a red line). This finding is opposite the result of land use for crop production as shown in Figure 4. Thus, there exists a land use change relationship between these two types of land, i.e., when cropland demands are low for crop and biofuel then land goes into the pasture and vice versa. In the case of land moving into cropland used for crop and biofuel production, livestock herd size may possibly be reduced, given the limited land resources.
The influence of biofuel policy on U.S. cropland use is significant during 2020 to 2030 for biofuel production land use (see Table 4), where the changes in the areas of land use under the Control and the Corn scenarios (with corn stover requirement) are around 30 to 50 percent larger those under the CornRes scenario (without corn stover requirement) probably due to the higher total biofuel production and also the fact that the Corn scenario reduces land demand whereas the CornRes scenario leaves basic crop demand unchanged, reducing demand for a byproduct. The effect of biofuel policy is rather minor on livestock cropland pasture use (Table 4), where the Corn scenario provides the largest movement of land out of cropland use and thus the greatest cropland pasture use. In other words, less requirement for corn for ethanol shifts more land to livestock and the lower requirement level of corn residues does not really affect the crop and use.
Besides biofuel policy, we also consider the influence of demand growth. However, the impact of demand growth on cropland for biofuel production, crop production, and livestock is small in terms of percentage changes.
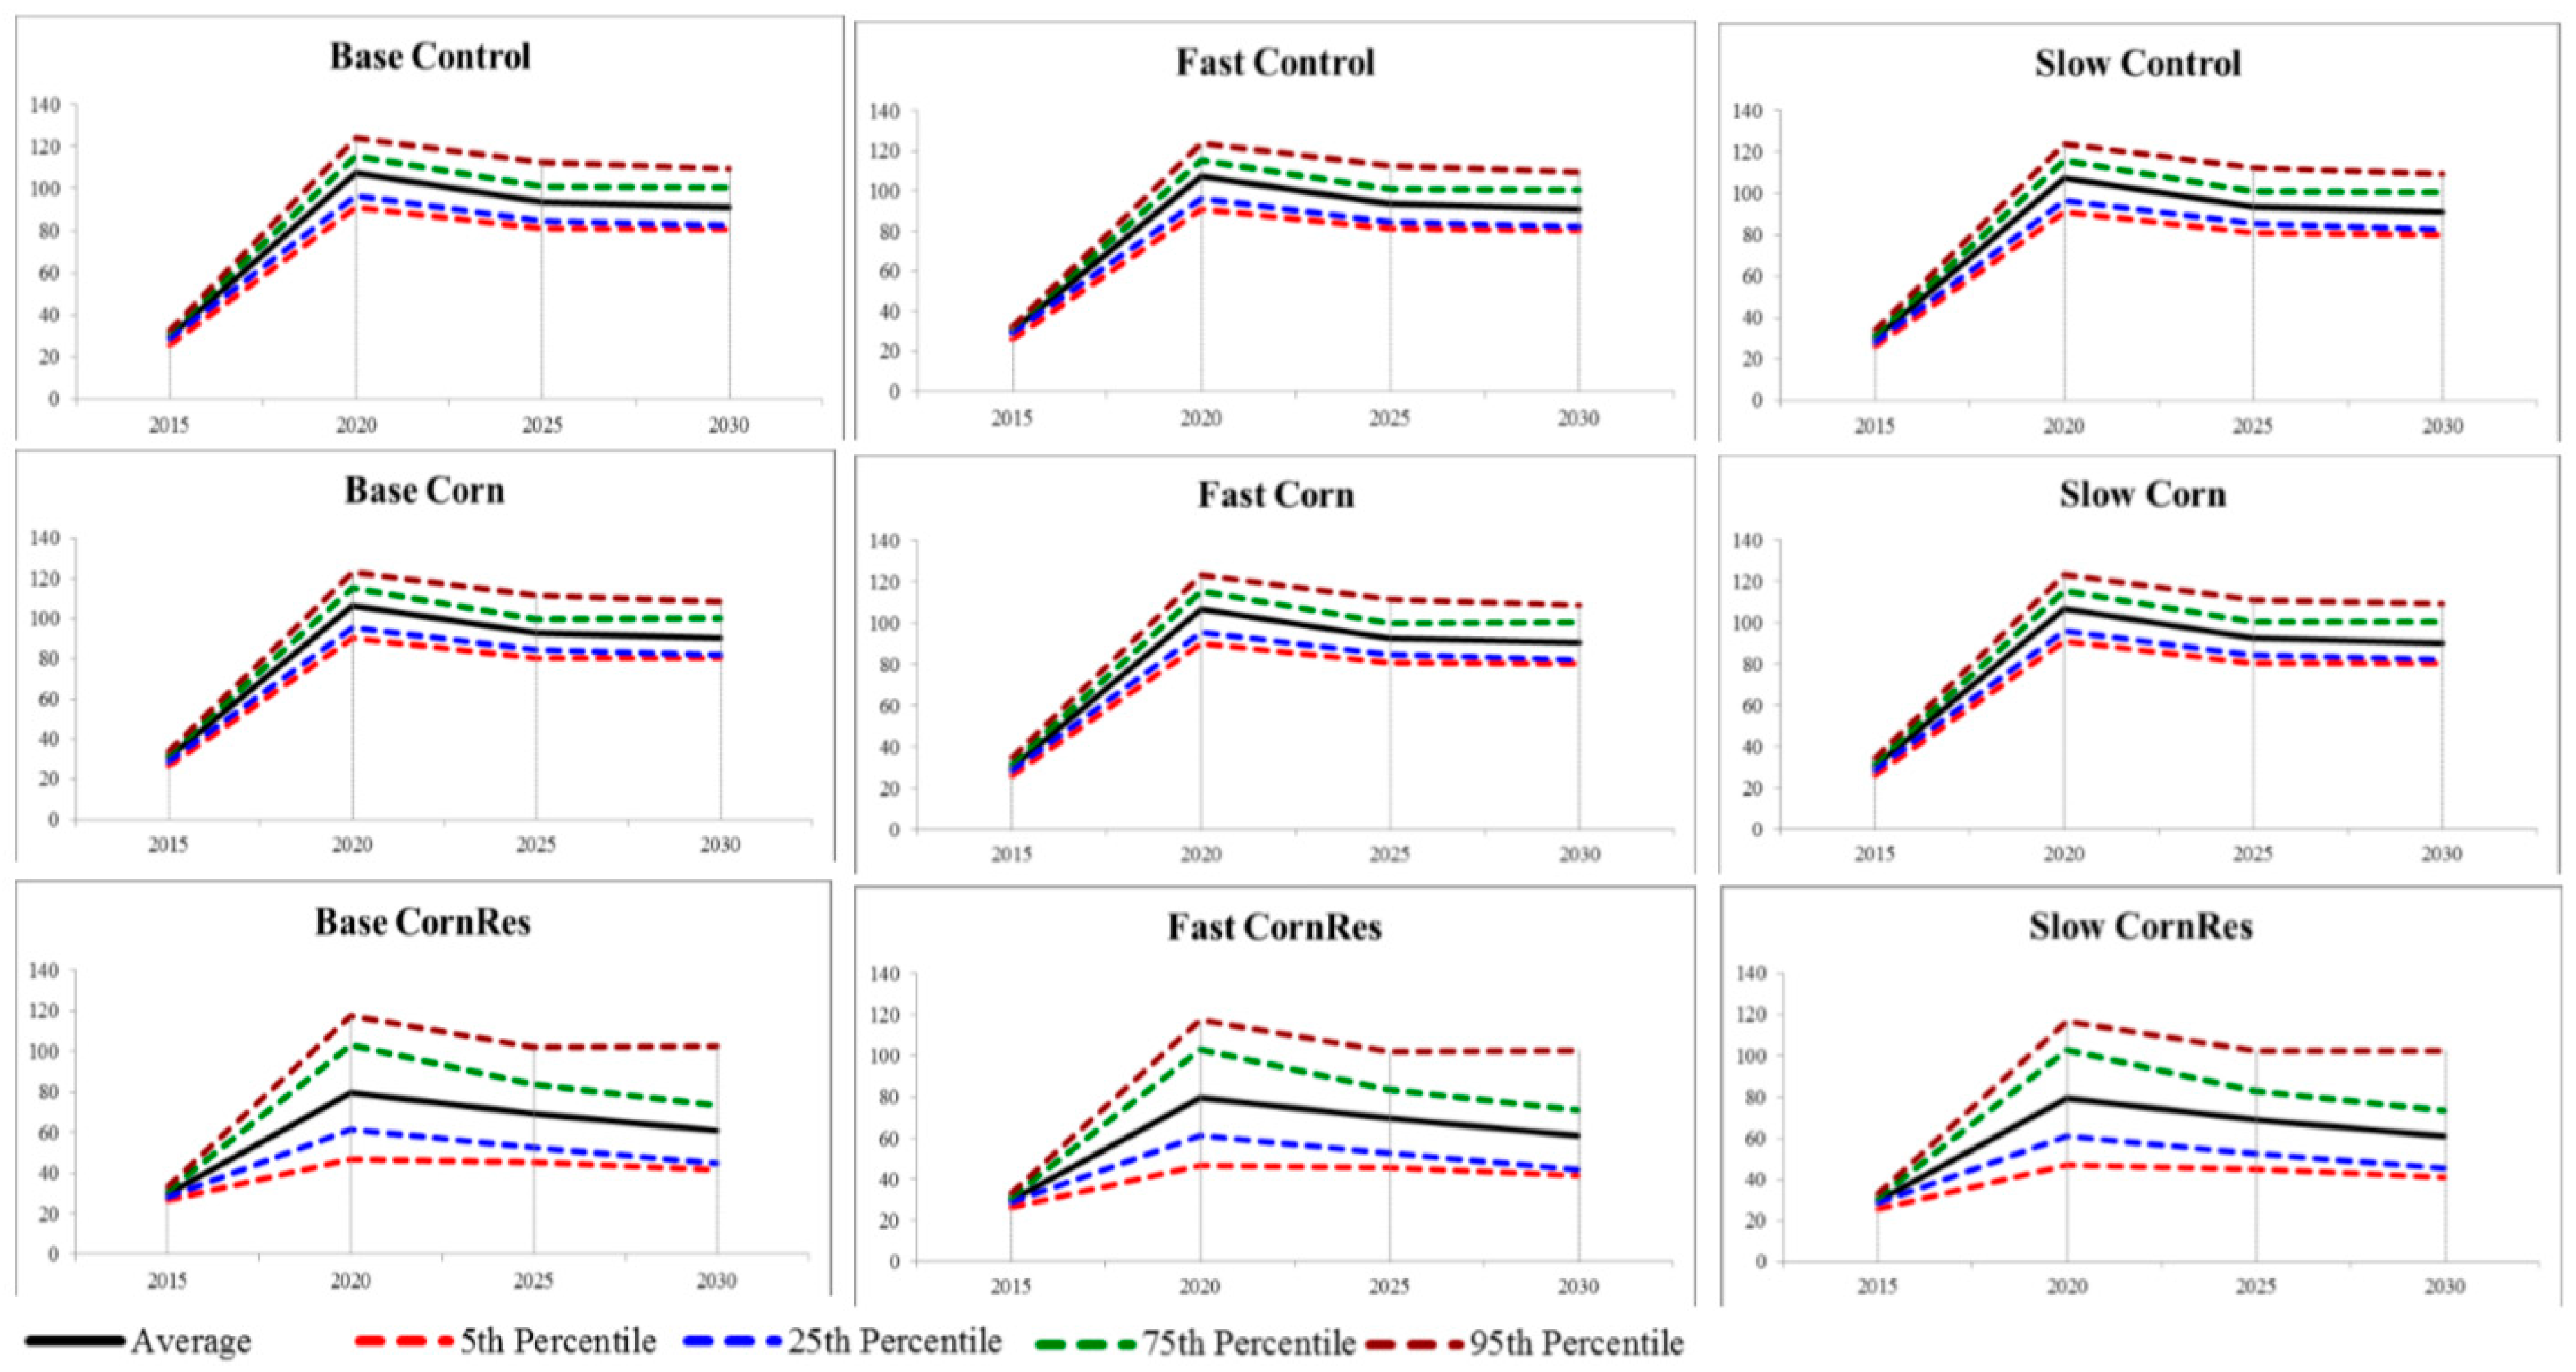
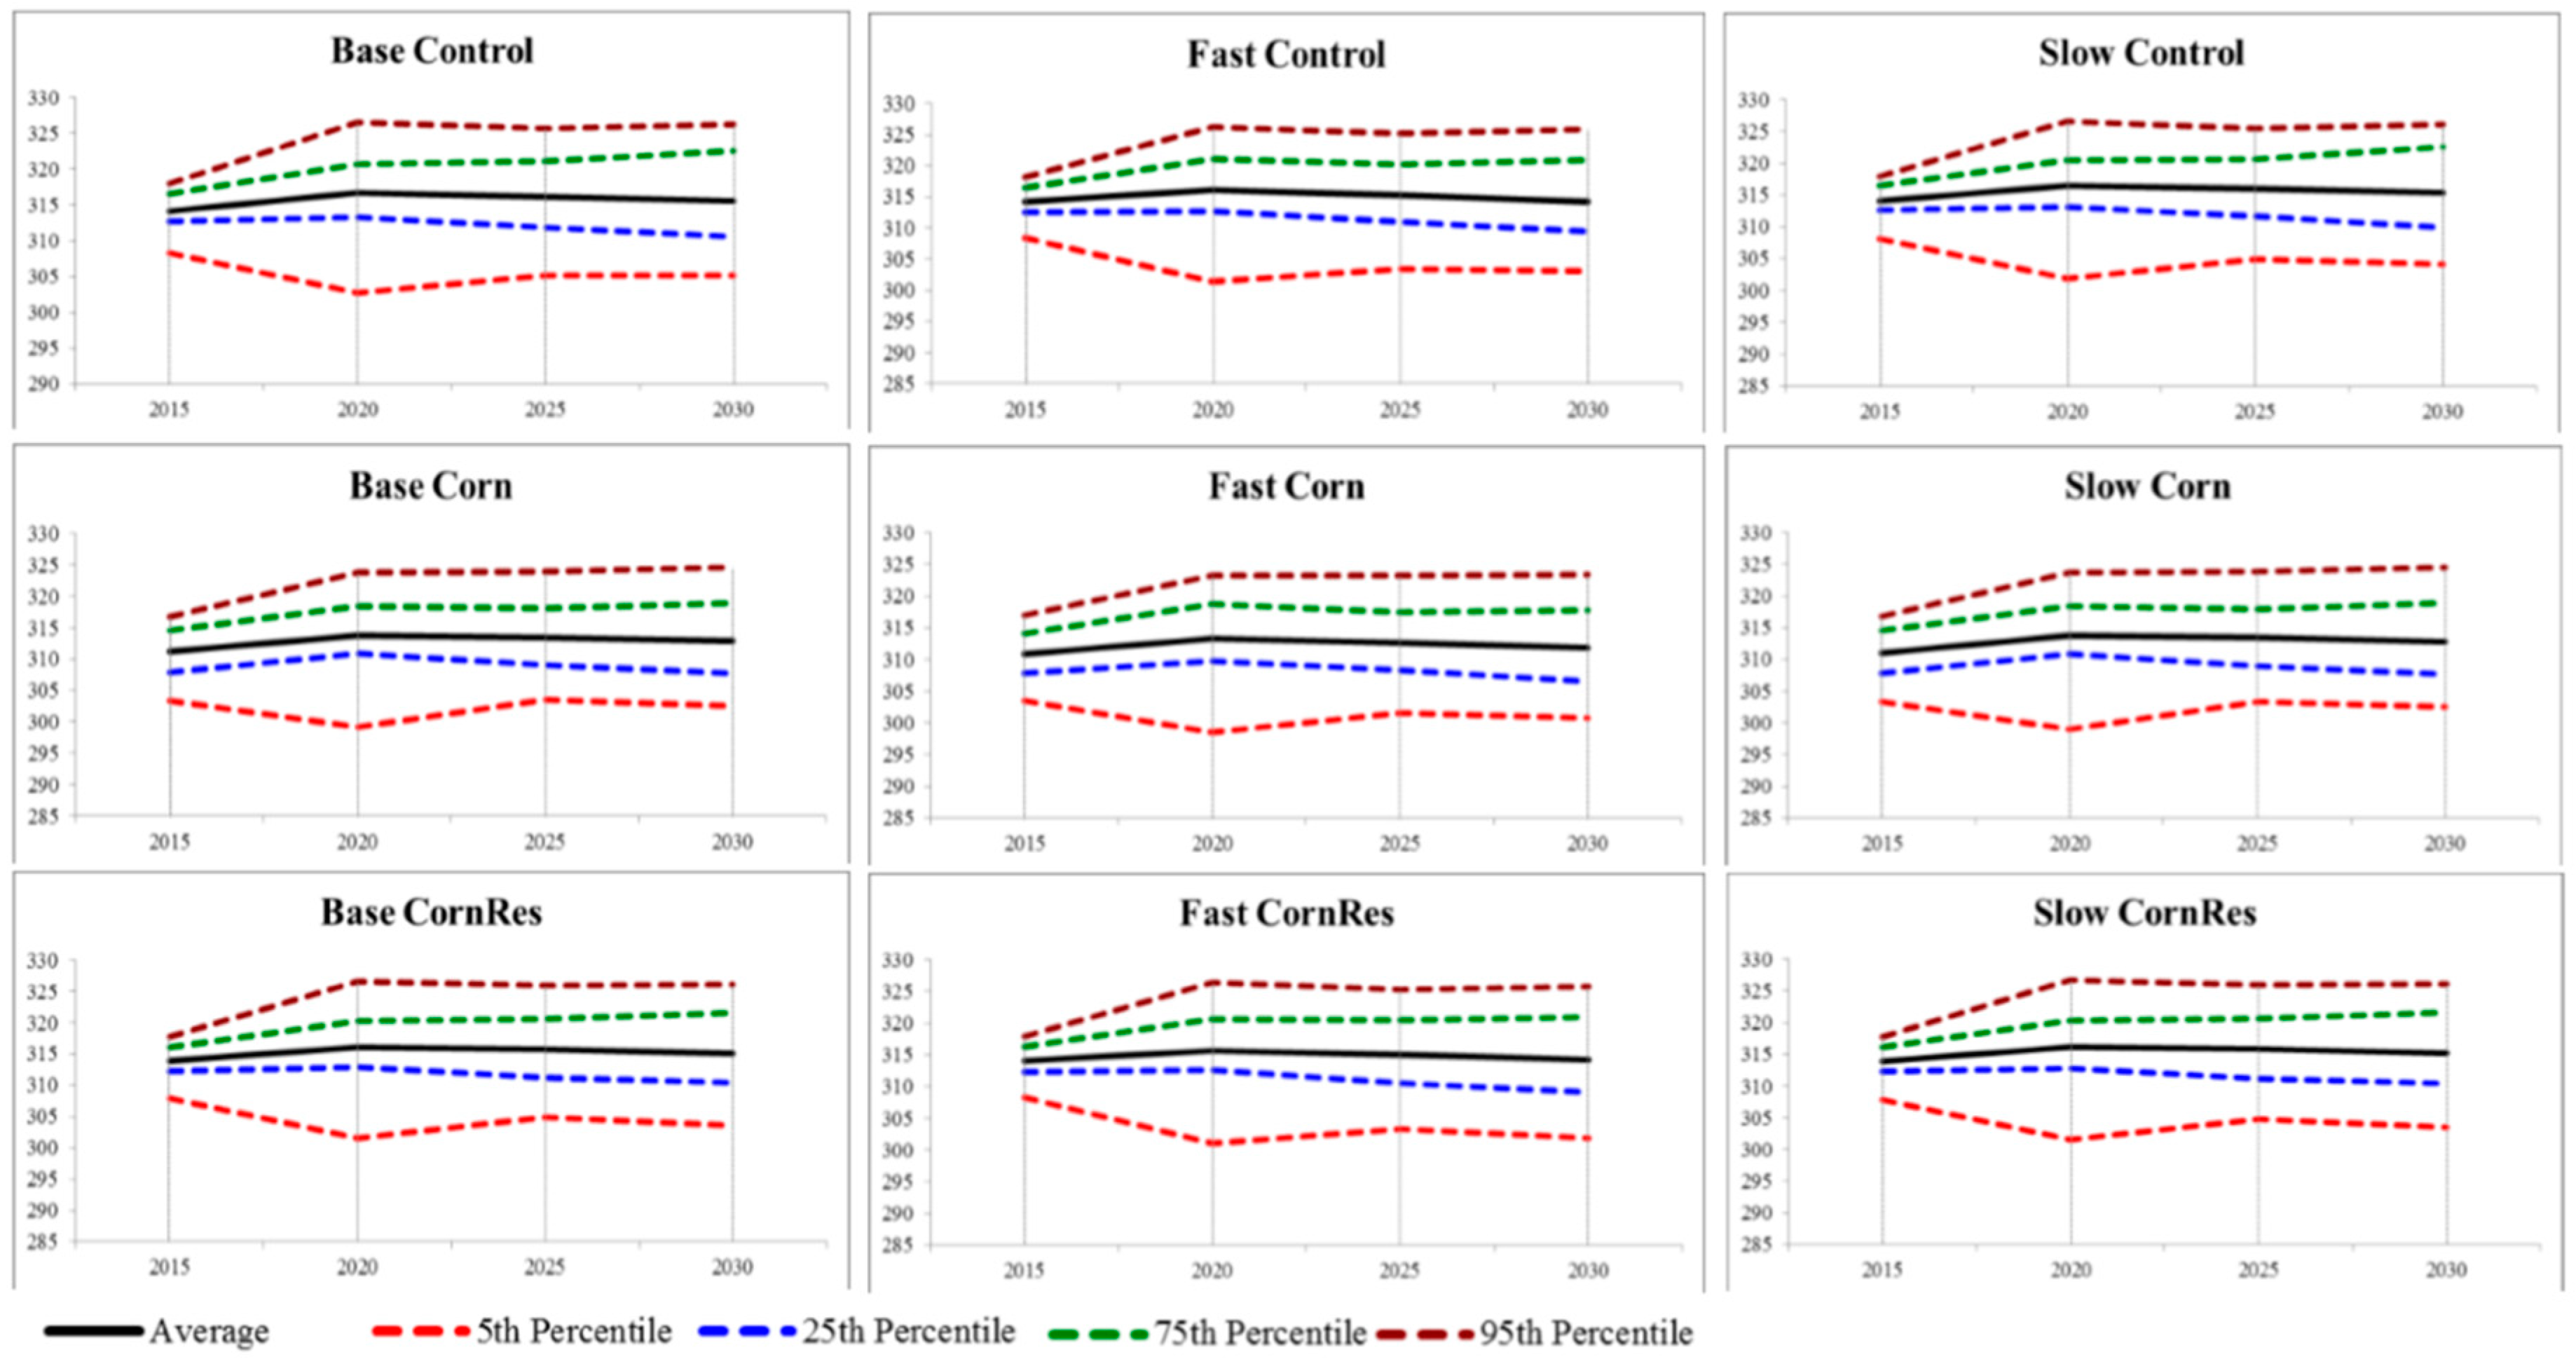
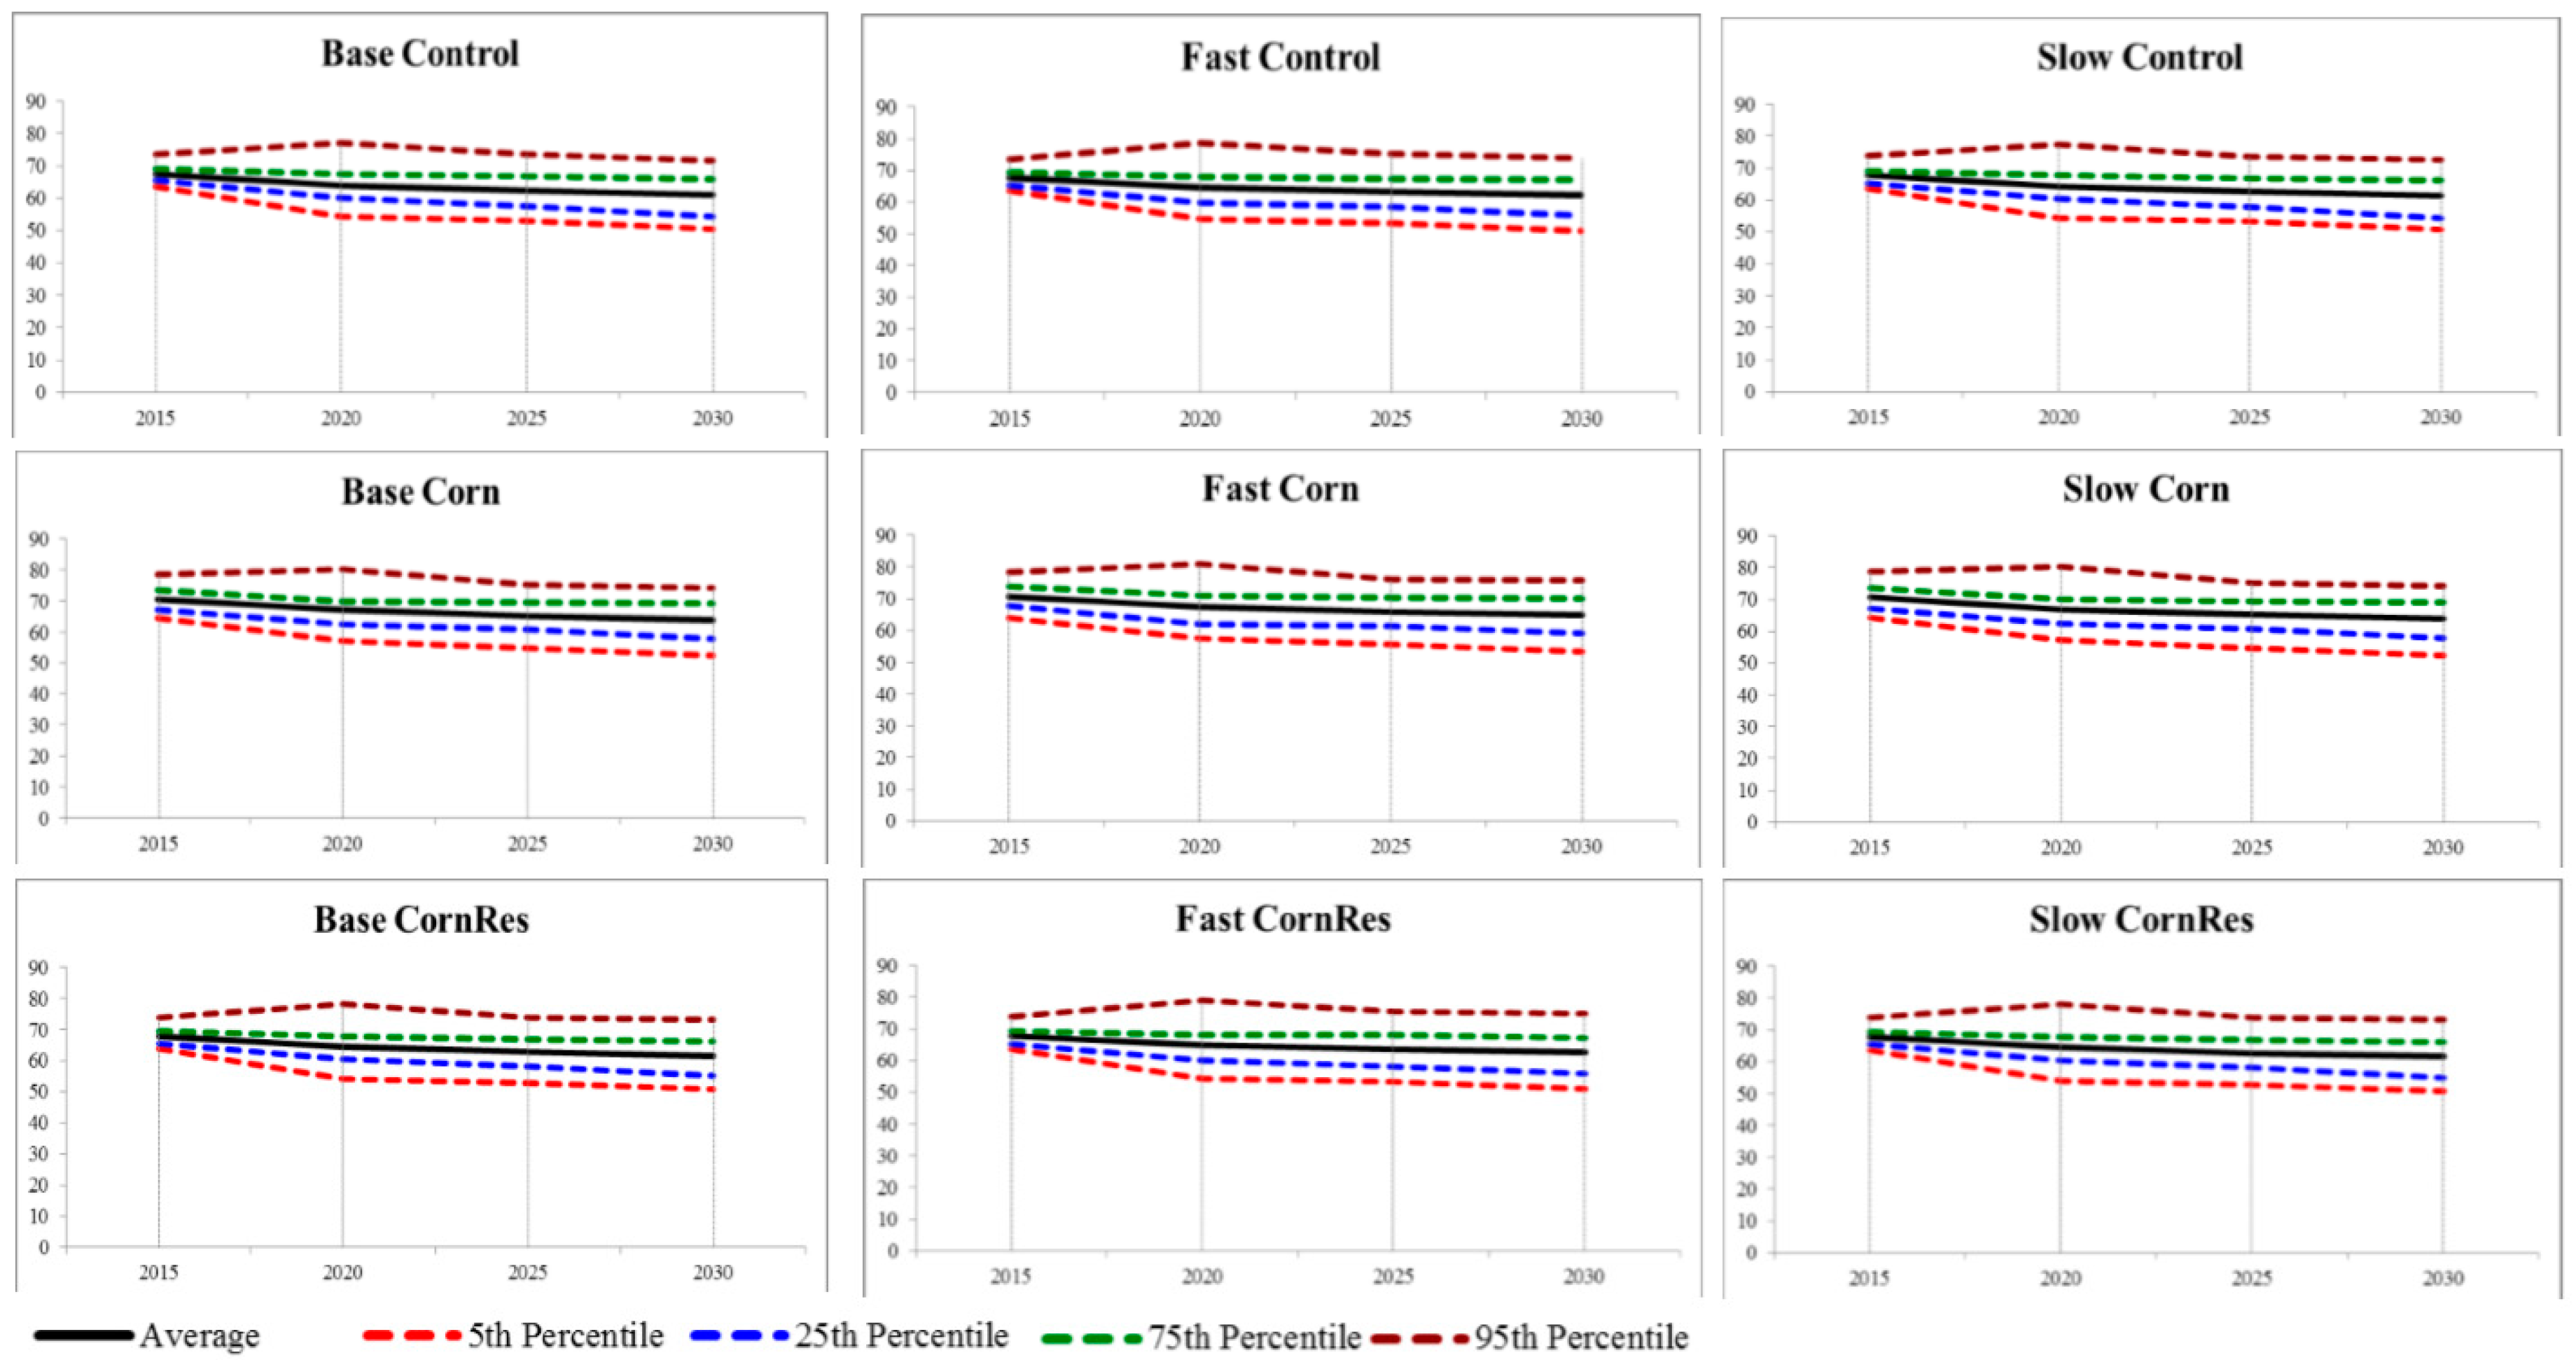
Apart from the mean effect, the variability of U.S. cropland results is also examined as shown in Figure A1, Figure A2 and Figure A3 (Appendix A). The results of cropland for all types have more variation under the CornRes scenarios, but the influence is only significant on land used for biofuel production. For the demand growth scenarios, the influence seems to be small. Less variation is found under the Slow demand scenarios for all types of cropland. Additionally, the Fast demand case creates more dispersion on both cropland for crop production and cropland pasture for livestock.

4.1.2. Price Mean Results

One of the interesting places where the results show alterations is in commodity prices. Two categories of effects will be reviewed. The first category involves the cost of meeting the biofuel requirements in terms of crop ethanol price and cellulosic ethanol price. The other category is conventional commodity prices for corn, cotton, hay, sorghum, soybean, hard red winter wheat, beef, pork, and broiler.
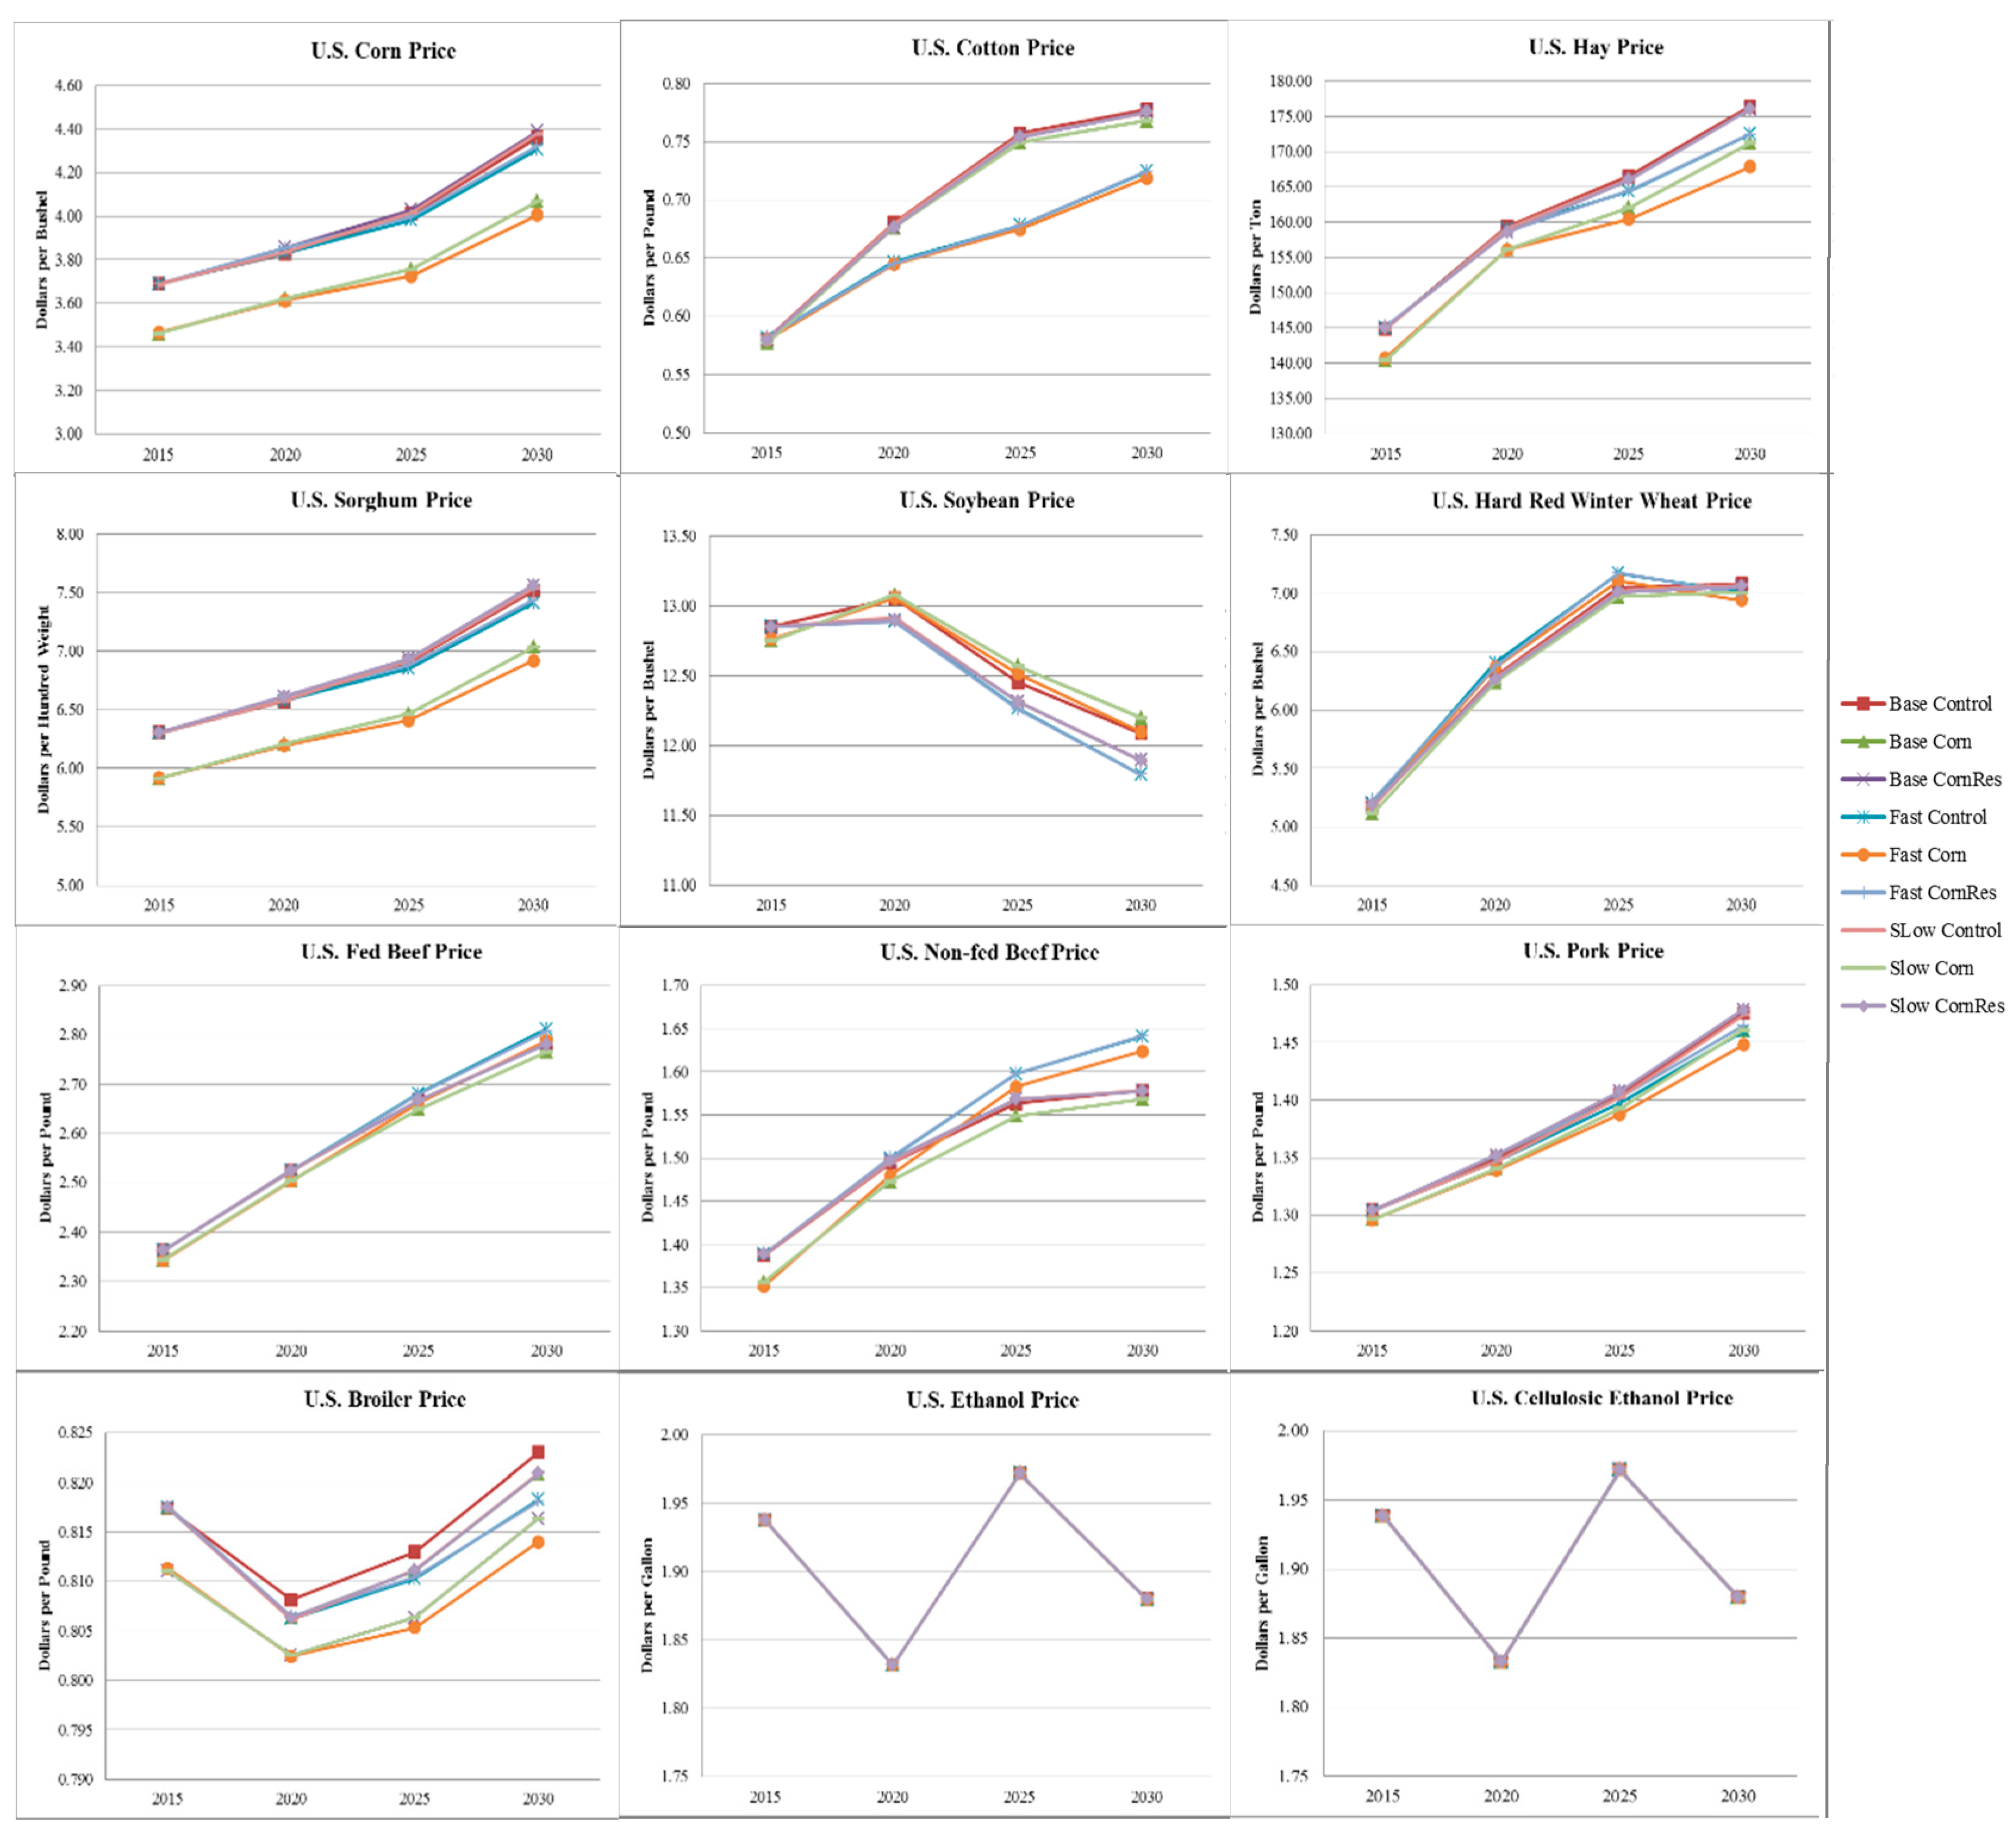
The price results (see Figure 6) show that the average prices tend to increase over time for most commodities, including corn, cotton, hay, sorghum, hard red winter wheat, beef, and pork, whereas the broiler price drops in 2020 and then quickly increases after 2020. Only the soybean price exhibits a downward price trend. Clearly, corn and sorghum have a very similar pattern price trend. The different pattern of average price trend is found in the ethanol and cellulosic ethanol prices where patterns are wavy.
To examine the influence of biofuel policy and demand on U.S. average commodity prices, we compared the average prices among various biofuel policy scenarios (Control, Corn, and CornRes scenarios) and different demand settings (Base, Fast, and Slow settings), respectively (Table 5). Surprisingly, there is little influence of biofuel policy and demand growth on ethanol and cellulosic ethanol prices. Both ethanol prices are the same for all various biofuel policy and demand growth scenarios for each projected year. Thus, it is difficult to draw a conclusion of the impacts of biofuel policy and demand growth on ethanol and cellulosic ethanol prices.
For corn, hay, sorghum, soybeans, and hard red winter wheat the influence of demand is quite small but shown in the same way. For most of the projected years, Fast demand settings provide the lowest price but in the relatively small percentage changes (mostly 1 percent or less) as compared to the others. However, these results contrast with beef and pork prices, which the Fast demand provides the largest price level with a small effect. As for the cotton price results, the demand growth impact is only noticed. Base and Slow demand growth price results are similar but clearly different from the Fast demand growth price result. The Fast demand growth scenario provides the lower cotton price as compared to other demand growth scenarios.
The influence of biofuel policy is obvious for corn, hay, sorghum, hard red winter wheat, beef, pork, and broiler. The Corn policy scenario provides the lowest price among other biofuel policy scenarios as it reduced corn demand. The relative percentage changes of other prices from the lowest price differ among agricultural commodities, i.e., 6 to 7 percent for corn and sorghum, 2 to 3 percent for hay, 1 to 4 percent for non-fed beef, 1 percent or less for hard red winter wheat, fed beef, pork, and broiler.

4.1.3. GHG Emissions Mean Results, Cropland Regression Results

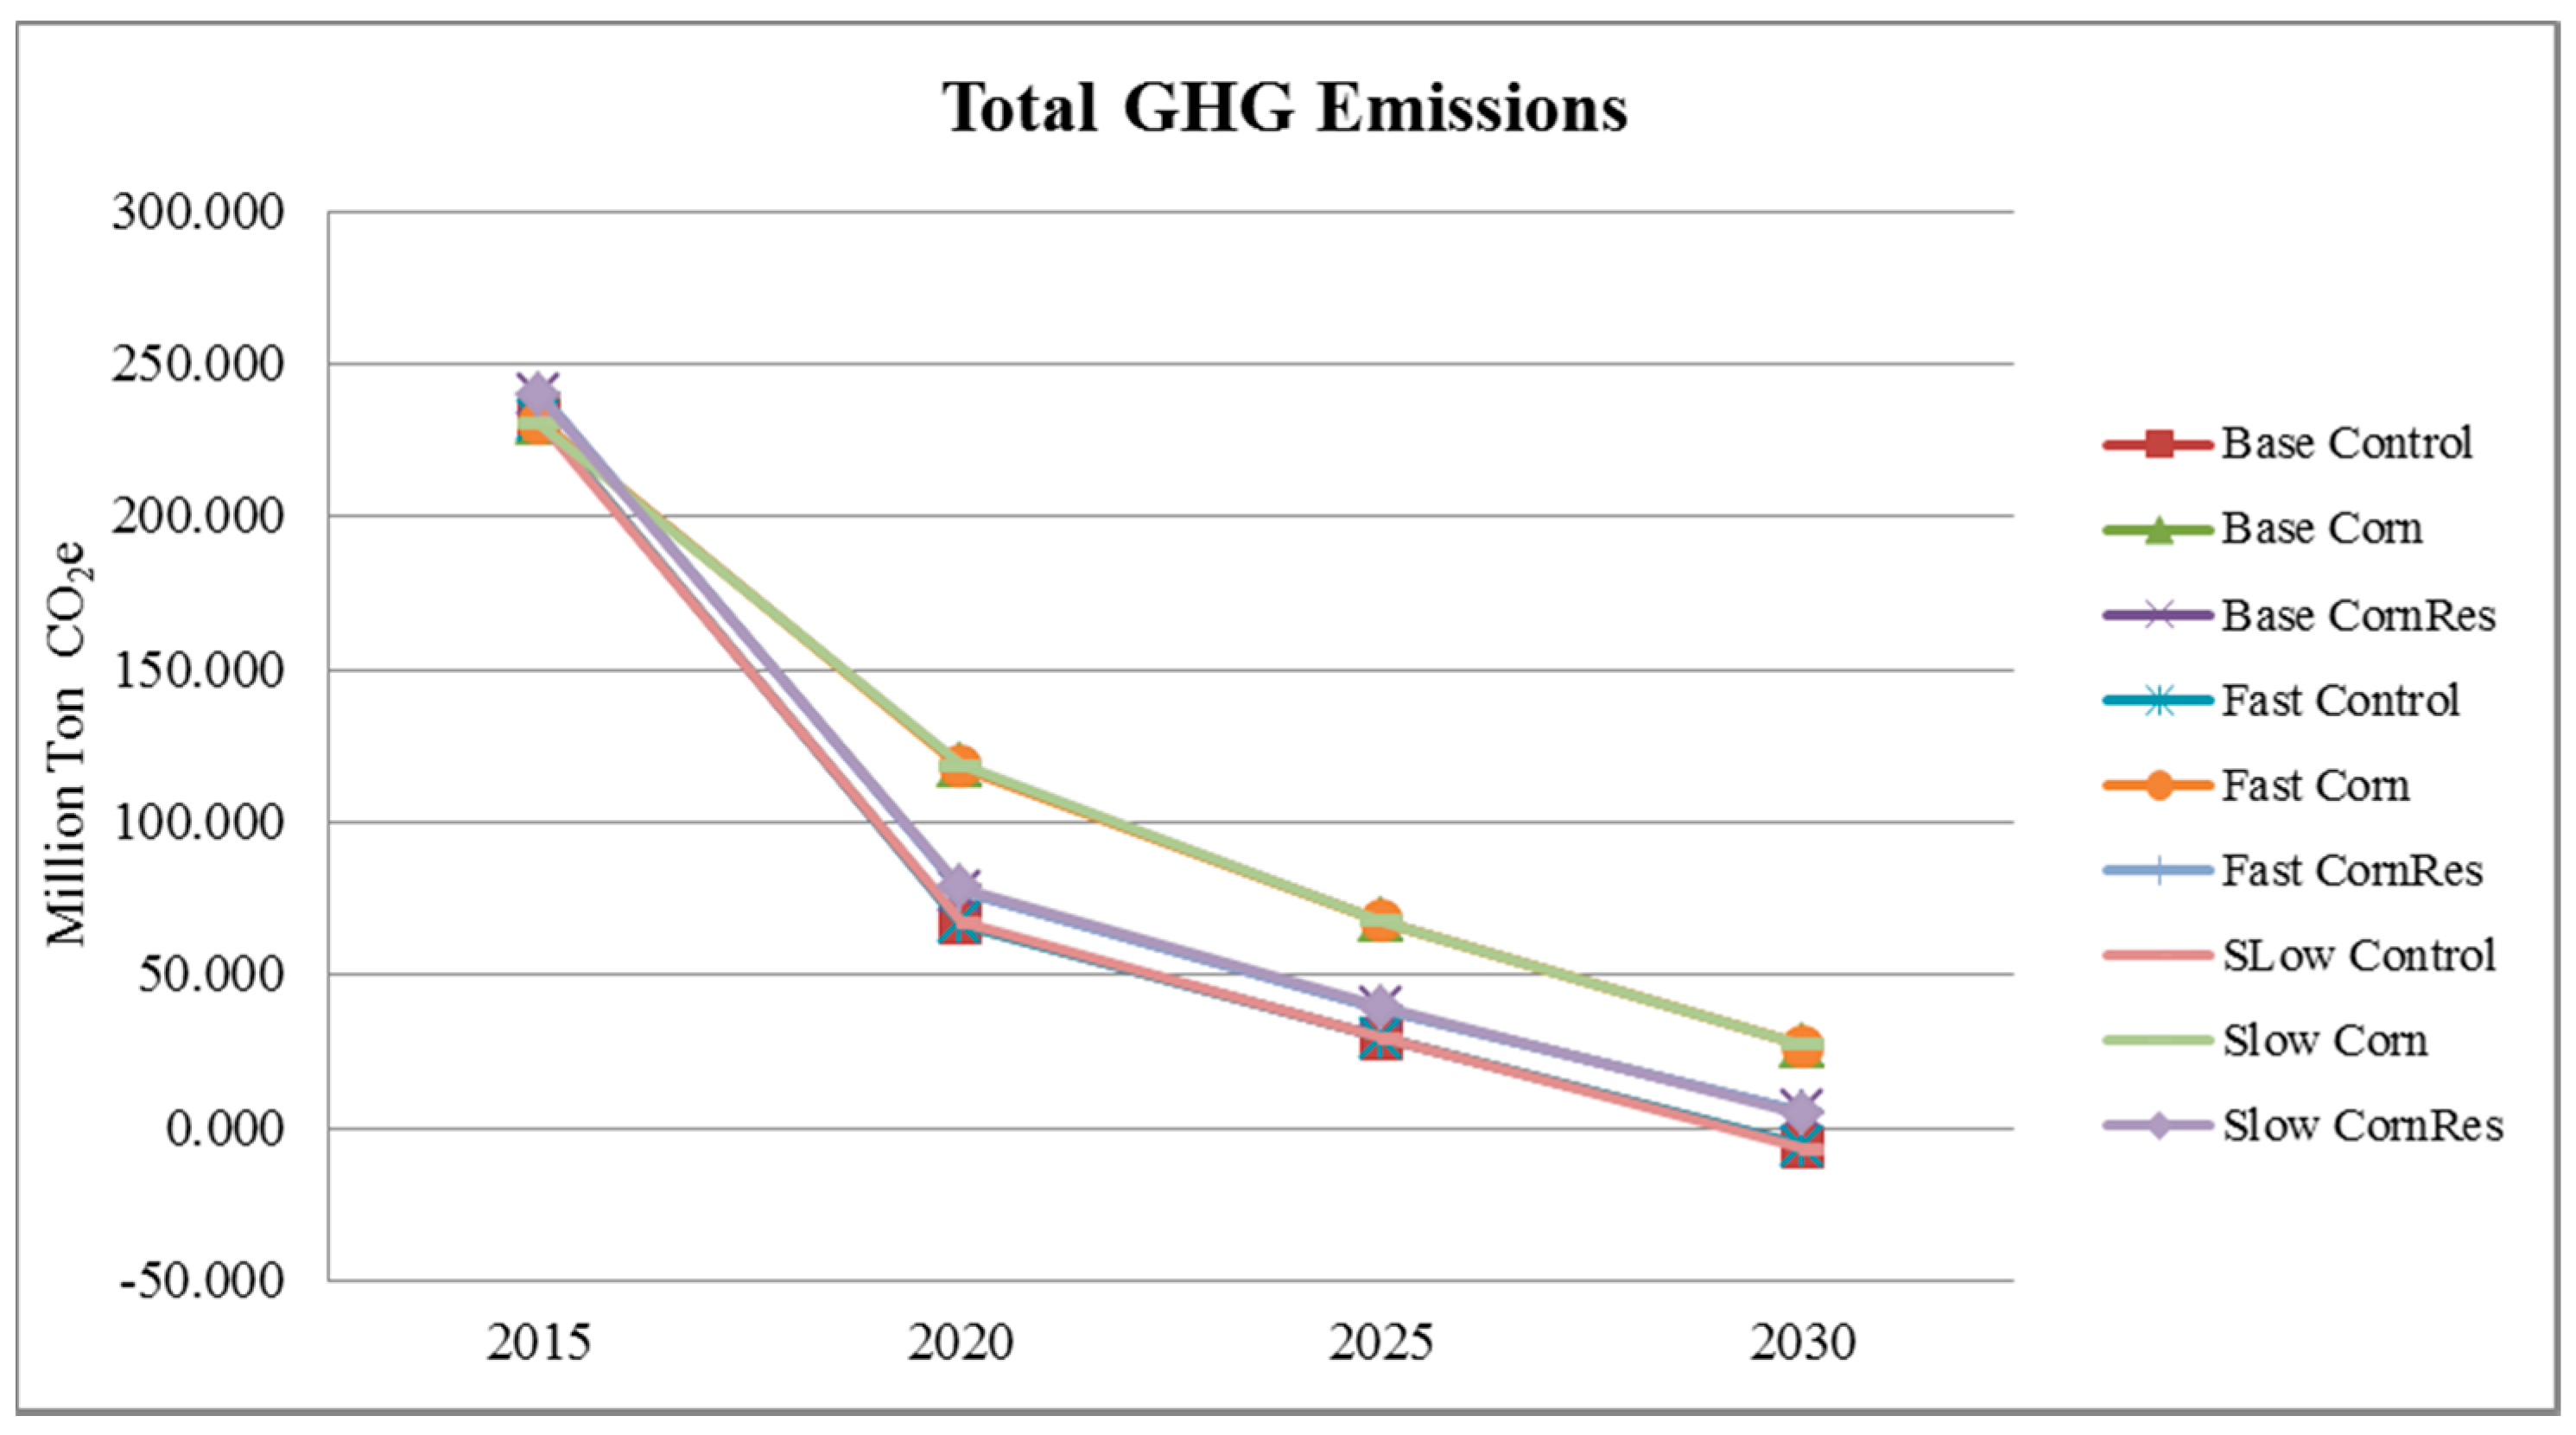
Results on the average level of total GHG emission levels are presented in Table 6. In this study, we focus on GHG emissions from the agricultural and biofuel sectors. Overall, the total level of GHG emissions indicates a decreasing trend, which is what we expect from the increasing biofuel mandates as cellulosic ethanol makes a negative net emissions contribution [30]. The influence of biofuel policy is very obvious. During 2020 to 2030, the Control scenario provides the lowest GHG emission levels, while the Corn cases give the highest levels. This result of the Control case is reasonable due to full biofuel mandates setting.
From Table 6, GHG emission levels under the CornRes scenarios are closer to the levels from the Control case, while the GHG emission levels under the Corn case are much greater than those under the Control scenario as can be noticed in Figure 7. However, we should note that these scenarios by no means are of the same size as the CornRes scenario reducing the total ethanol production by 4 billion gallons and the Corn scenario reducing it by 2.6 billion gallons. This suggests that requirement of ethanol from corn is more effective in reducing the overall GHG emissions than producing corn residue based ethanol. It may be the case that agricultural technological improvement provides more benefits to corn production for biofuel rather than corn residue.
Additionally, GHG emission levels for all scenarios drop through time, so biofuel policy seems to be a promising policy to decrease GHG emission levels in the long term. As for the demand scenarios, the effect of demand growth is not obvious. Only in 2030, we notice that the Slow demand with the Control and the CornRes policy settings provides the lowest GHG emission levels among other demand scenarios. This result agrees with what we expected because slow demand leads to fewer overall products and also fewer GHG emissions.

4.2. Regression Analysis

In this section, we analyze the results using regression to take into account the technological progress effects. In particular, we used regressions to develop estimates of the marginal effect of the technological progress of various crops.
The simple linear regression models for pooled data used are listed as follows:
y i t = β 0 + β 1 T e c h i t 1 + β 2 T e c h i t 2 + + β 6 T e c h i t 6 + ε i t ,
y i t = α 0 + γ 1 T e c h i t 1 + γ 2 T e c h i t 2 + + γ 6 T e c h i t 6 + α 1 D 25 + α 2 D 30   + ε i t ,
where y i t denotes the interested land or other values in year t; T e c h i t 1 , T e c h i t 2 , …, T e c h i t 6 are average technical progress across regions of corn, cotton, hay, sorghum, soybeans, and winter wheat, respectively in year t, derived from crop yield estimation models as we explained in the technological progress scenarios section; D25 and D30 represent dummy variables for years 2025 and 2030, respectively; i = 1, 2, …, 50 where i denotes the number of technical progress 50-random draw; t is estimated year including 2020, 2025, and 2030; αs, βs, and γs are estimated parameters; and ε i t is the error term. The two models were analyzed, but we selected only one model to present the result, considering statistics of the goodness of fit for the model and the significance of dummy variables in the model.
We examined the technological progress effects on the three aspects as follows: (1) cropland used for biofuel production, crop production, and cropland pasture used for livestock; (2) conventional commodity prices (corn, cotton, hay, sorghum, soybean, hard red winter wheat, beef, pork, and broiler); and (3) GHG emissions. However, we found the insignificant effects of technological progress of the main field crops on commodity prices mostly exhibit in the results. The effects are different depending on the crop type of technological progress and commodity prices. Hence, the regression results are mainly discussed on both cropland and GHG emission areas.

4.2.1. Cropland Regression Results

The main result from the cropland regression analysis is the significant effect of technological progress on cropland devoted to biofuel, crop production, and livestock, where the effect is negative on land devoted to biofuel and livestock (see Table 7 and Table 8) and positive on land for crop production (see Table 9). The effects on biofuel areas are strong for corn, cotton, soybeans, and winter wheat technical progress while the effects on land use for livestock and crop production are significant only for corn and cotton technical progress. There are only a few significant effects of soybean yield growth on land use.
The negative effect on biofuel land is much larger under the CornRes scenario as compared with the other biofuel policy scenarios. The marginal negative effect on pasture for livestock and the marginal positive effect on cropland are larger under the Fast demand and smaller under the Corn policy scenario. This shows the rather obvious result that demand increases lead to land use change from livestock and crops, while decreases move land in the opposite direction.

4.2.2. GHG Emissions Regression Results

The results of analyzing total GHG emissions are presented in Table 10 and show that technological progress of corn, cotton, soybeans, and winter wheat have significant negative effects on total GHG emissions. In other words, as technological progress increases, the total GHG emission level reduces. However, there is a positive effect of hay technological progress on GHG emissions perhaps due to livestock production and emission increases.
The main finding in this section suggests that growing technological progress tends to reduce the overall GHG emission. This supports the conclusion that technological progress coupled with effective bioenergy policy are crucial factors to preserve environmental quality in the long-run.

5. Conclusions

This study addresses the effects of agricultural technological progress, demand, and energy policy on both agricultural and biofuel markets. We formed scenarios reflective of the effect of technological progress, agricultural demand, and energy policy. Then we used a simulation framework over the alternative scenarios set up to investigate these effects on both agricultural and bioenergy markets plus resource usage and GHG emissions.
Several main findings emerge. The first finding is that technological progress is a significant determinant of cropland allocation between biofuel, crop production, and livestock. As technological progress increases, the biofuel land and cropland pasture for livestock decreases, whereas land for crop production increases. This finding supports the conclusion that technological improvement is an influential factor in meeting increased global demand for food and energy.
The second finding is that biofuel mandates have significant influence on land use for biofuel production with lesser effects on land used for pasture and cropland used for crop production. Land for biofuel production is larger under the basic EISA mandates, and when the corn mandate is reduced this moves land to pasture use as it is a leftward shift in the corn and cropland demand curves. On the other hand, a mandate with less corn residue based ethanol has little land use effect likely due to the fact that stover is a crop byproduct.
The third finding is that biofuel policy has a major effect on commodity prices for most of the field crops and meat commodities. Lowering the requirement level of corn for ethanol lowers corn and other prices, especially, hay, sorghum, and non-fed beef because it reduces the overall demand for corn. This finding implies that the amount of biofuel production from corn has effects on the prices of field crops and meats, which policy makers have to concern when imposing biofuel policies or mandates.
The final finding is that technical progress and biofuel policy have significant impacts on agricultural GHG emissions. Increasing technological progress on field crops reduces the overall GHG emissions, allowing less land and cropped acres to meet demand, especially for corn, cotton, soybeans, and winter wheat. As for the biofuel effect, GHG emission levels drop through time with the larger decreasing rates. Additionally, a lower corn ethanol mandate provides larger GHG emissions as compared with the control case, implying on the margin corn ethanol is emissions reducing. Nevertheless, lower corn residue from the ethanol mandate delivers a similar level of GHG emissions as compared with the control case. This implies that producing corn ethanol is effective in reducing emissions but that corn stover is not. This final finding supports the conclusion that technological improvement together with effective bioenergy policy have a key influence on climate change mitigation.
These above findings confirm that agricultural technological advances along with biofuel policy jointly influence our ability to meet growing food and energy global demands while preserving environmental quality. While the findings are relevant to both technological progress and biofuel policy influences, the effect of agricultural demand on field crops, livestock, land usage, and GHG emissions seems to be small and ambiguous. Thus, further research is needed to clarify the demand effect.
The findings from this study can have implications for policy makers and also bioenergy sectors. The policy makers should not consider only biofuel policy but also technological improvement as a greenhouse gas management approach.

Author Contributions

Conceptualization, B.A.M. and M.K.; data curation, M.K.; formal analysis, M.K.; investigation, M.K.; methodology, M.K. and B.A.M.; supervision, B.A.M.; validation, M.K.; writing—original draft, M.K.; writing—review and editing, M.K. and B.A.M. All authors have read and agreed to the published version of the manuscript.

Funding

This research was funded by the Ananda Mahidol Foundation and Exxon Mobile.

Conflicts of Interest

The authors declare no conflict of interest. The funders had no role in the design of the study; in the collection, analyses, or interpretation of data; in the writing of the manuscript, or in the decision to publish the results.

Appendix A

Figure A1. Variability of U.S. cropland used for biofuel production (in million acres) stochastic draw during 2015 to 2030 under various biofuel policy and demand growth scenarios.
Atmosphere 11 00031 g0a1
Figure A2. Variability of U.S. cropland used for crop production (in million acres) stochastic draw during 2015 to 2030 under various biofuel policy and demand growth scenarios.
Atmosphere 11 00031 g0a2
Figure A3. Variability of U.S. cropland pasture used for livestock (in million acres) stochastic draw during 2015 to 2030 under various biofuel policy and demand growth scenarios.
Atmosphere 11 00031 g0a3

References

  1. Intergovernmental Panel on Climate Change (IPCC). Climate Change 2007: Mitigation of Climate Change. Contribution of Working Group III to the Fourth Assessment Report of the Intergovernmental Panel on Climate Change; Cambridge University Press: Cambridge, UK; New York, NY, USA, 2007. [Google Scholar]
  2. United States Department of Agriculture: Economic Research Service (ERS). Domestic Corn Use. Available online: https://www.ers.usda.gov/topics/crops/corn-and-other-feedgrains/feedgrains-sector-at-a-glance/ (accessed on 11 July 2016).
  3. Garibaldi, L.A.; Aizen, M.A.; Klein, A.M.; Cunningham, S.A.; Harder, L.D. Global Growth and Stability of Agricultural Yield Decrease with Pollinator Dependence. Proc. Natl. Acad. Sci. USA 2011, 108, 5909–5914. [Google Scholar] [CrossRef] [PubMed] [Green Version]
  4. United Nations, Department of Economic and Social Affairs (UN DESA). World Population Prospects: The 2012 Revision; United Nations Publication: New York, NY, USA, 2013. [Google Scholar]
  5. Food and Agriculture Organization of the United Nations (FAO). FAO Statistical Yearbook 2013: World Food and Agriculture; FAO: Rome, Italy, 2013. [Google Scholar]
  6. International Energy Agency (IEA). World Energy Outlook 2013; International Energy Agency: Paris, France, 2013. [Google Scholar]
  7. Gonzalez, A.O.; Karali, B.; Wetzstein, M.E. A Public Policy Aid for Bioenergy Investment: Case Study of Failed Plants. Energy Policy 2012, 51, 465–473. [Google Scholar] [CrossRef]
  8. Alexander, C.; Hurt, C. Bioenergy: Biofuels and Their Impact on Food Prices. Purdue Extension. 2007. Available online: https://www.extension.purdue.edu/extmedia/id/id-346-w.pdf (accessed on 2 June 2016).
  9. Mitchell, D.A. Note on Rising Food Prices; World Bank Policy Research Working Paper Series; World Bank: Washington, DC, USA, 2008. [Google Scholar]
  10. Ajanovic, A. Biofuels Versus Food Production: Does Biofuels Production Increase Food Prices? Energy 2011, 36, 2070–2076. [Google Scholar] [CrossRef]
  11. Olesen, J.; Bindi, M. Consequences of Climate Change for European Agricultural Productivity, Land Use, and Policy. Eur. J. Agron. 2002, 16, 239–262. [Google Scholar] [CrossRef]
  12. Chen, C.; McCarl, B.A.; Schimmelpfennig, D.E. Yield Variability as Influenced by Climate: A Statistical Investigation. Clim. Chang. 2004, 66, 239–261. [Google Scholar] [CrossRef] [Green Version]
  13. Torriani, D.S.; Calanca, P.; Schmid, S.; Beniston, M.; Fuhrer, J. Potential Effects of Changes in Mean Climate and Climate Variability on the Yield of Winter and Spring Crops in Switzerland. Clim. Res. 2007, 34, 59–69. [Google Scholar] [CrossRef] [Green Version]
  14. McCarl, B.A.; Villavicencio, X.; Wu, X. Climate Change and Future Analysis: Is Stationarity Dying? Am. J. Agric. Econ. 2008, 90, 1241–1247. [Google Scholar] [CrossRef]
  15. Xiong, W.; Conway, D.; Lin, E.; Holman, I. Potential Impacts of Climate Change and Climate Variability on China’s Rice Yield and Production. Clim. Res. 2009, 40, 23–35. [Google Scholar] [CrossRef] [Green Version]
  16. Wang, J.; Wang, E.; Liu, D.L. Modelling the Impacts of Climate Change on Wheat Yield and Field Water Balance over the Murray-Darling Basin in Australia. Theor. Appl. Climatol. 2011, 104, 285–300. [Google Scholar] [CrossRef]
  17. Intergovernmental Panel on Climate Change (IPCC). Climate Change 2014: Mitigation of Climate Change. Contribution of Working Group III to the Fifth Assessment Report of the Intergovernmental Panel on Climate Change; Cambridge University Press: Cambridge, UK; New York, NY, USA, 2014. [Google Scholar]
  18. Feng, S. Three Essays on Agricultural and Forestry Offsets in Climate Change Mitigation. Ph.D. Thesis, Texas A&M University, College Station, TX, USA, 16 July 2012. [Google Scholar]
  19. Karp, A.; Richter, G.M. Meeting the Challenge of Food and Energy Security. J. Exp. Bot. 2011, 62, 3263–3271. [Google Scholar] [CrossRef] [PubMed] [Green Version]
  20. Tilman, D.; Socolow, R.; Foley, J.A.; Hill, J.; Larson, E.; Lynd, L.; Pacala, S.; Reilly, J.; Searchinger, T.; Somerville, C.; et al. Beneficial Biofuels—The Food, Energy, and Environment Trilemma. Science 2009, 325, 270–271. [Google Scholar] [CrossRef] [PubMed] [Green Version]
  21. Richardson, J.W. Simulation for Applied Risk Management; Department of Agricultural Economics, Agricultural and Food policy center, Texas A&M University: College Station, TX, USA, 2010. [Google Scholar]
  22. Beach, R.H.; Adams, D.; Alig, R.; Baker, J.; Latta, G.S.; McCarl, B.A.; Murray, B.C.; Rose, S.K.; White, E. Model Documentation for the Forest and Agricultural Sector Optimization Model with Greenhouse Gases (FASOMGHG); RTI International: Research Triangle Park, NC, USA. Available online: http://www.cof.orst.edu/cof/fr/research/tamm/FASOMGHG_Model_Documentation_Aug2010.pdf (accessed on 2 June 2016).
  23. Baker, J.S.; Murray, B.C.; McCarl, B.A.; Feng, S.; Johansson, R. Implications of Alternative Agricultural Productivity Growth Assumptions on Land Management, Greenhouse Gas Emissions, and Mitigation Potential. Am. J. Agric. Econ. 2013, 95, 435–441. [Google Scholar] [CrossRef]
  24. McCarl, B.A.; Sands, R.D. Competitiveness of Terrestrial Greenhouse Gas Offsets: Are They a Bridge to the Future? Clim. Chang. 2007, 80, 109–126. [Google Scholar] [CrossRef]
  25. National Agricultural Statistics Service (NASS) Database. USDA/NASS QuickStats Ad-hoc Query Tool. 2015. Available online: https://quickstats.nass.usda.gov/ (accessed on 1 February 2015).
  26. National Agricultural Statistics Service (NASS) Database. USDA/NASS QuickStats Ad-hoc Query Tool. 2016. Available online: https://quickstats.nass.usda.gov/ (accessed on 11 July 2016).
  27. United States Department of Agriculture (USDA). USDA Agricultural Projections to 2024; World Agricultural Outlook Board, U.S. Department of Agriculture: Washington, DC, USA, 2015. Available online: https://www.usda.gov/oce/commodity/projections/USDA_Agricultural_Projections_to_2024.pdf (accessed on 11 July 2016).
  28. United States Department of Agriculture: Economic Research Service (ERS) Database. USDA ERS-International Macroeconomic Data Set. Available online: http://www.ers.usda.gov/data-products/international-macroeconomic-data-set.aspx (accessed on 11 July 2016).
  29. Economic Research Division Federal Reserve Bank of St. Louis Database. Federal Reserve Economic Data—FRED—St. Louis Fed. Available online: https://research.stlouisfed.org/fred2 (accessed on 11 July 2016).
  30. McCarl, B.A. Bioenergy in a Greenhouse Gas Mitigating World. Choices 2008, 23, 31–33. [Google Scholar]
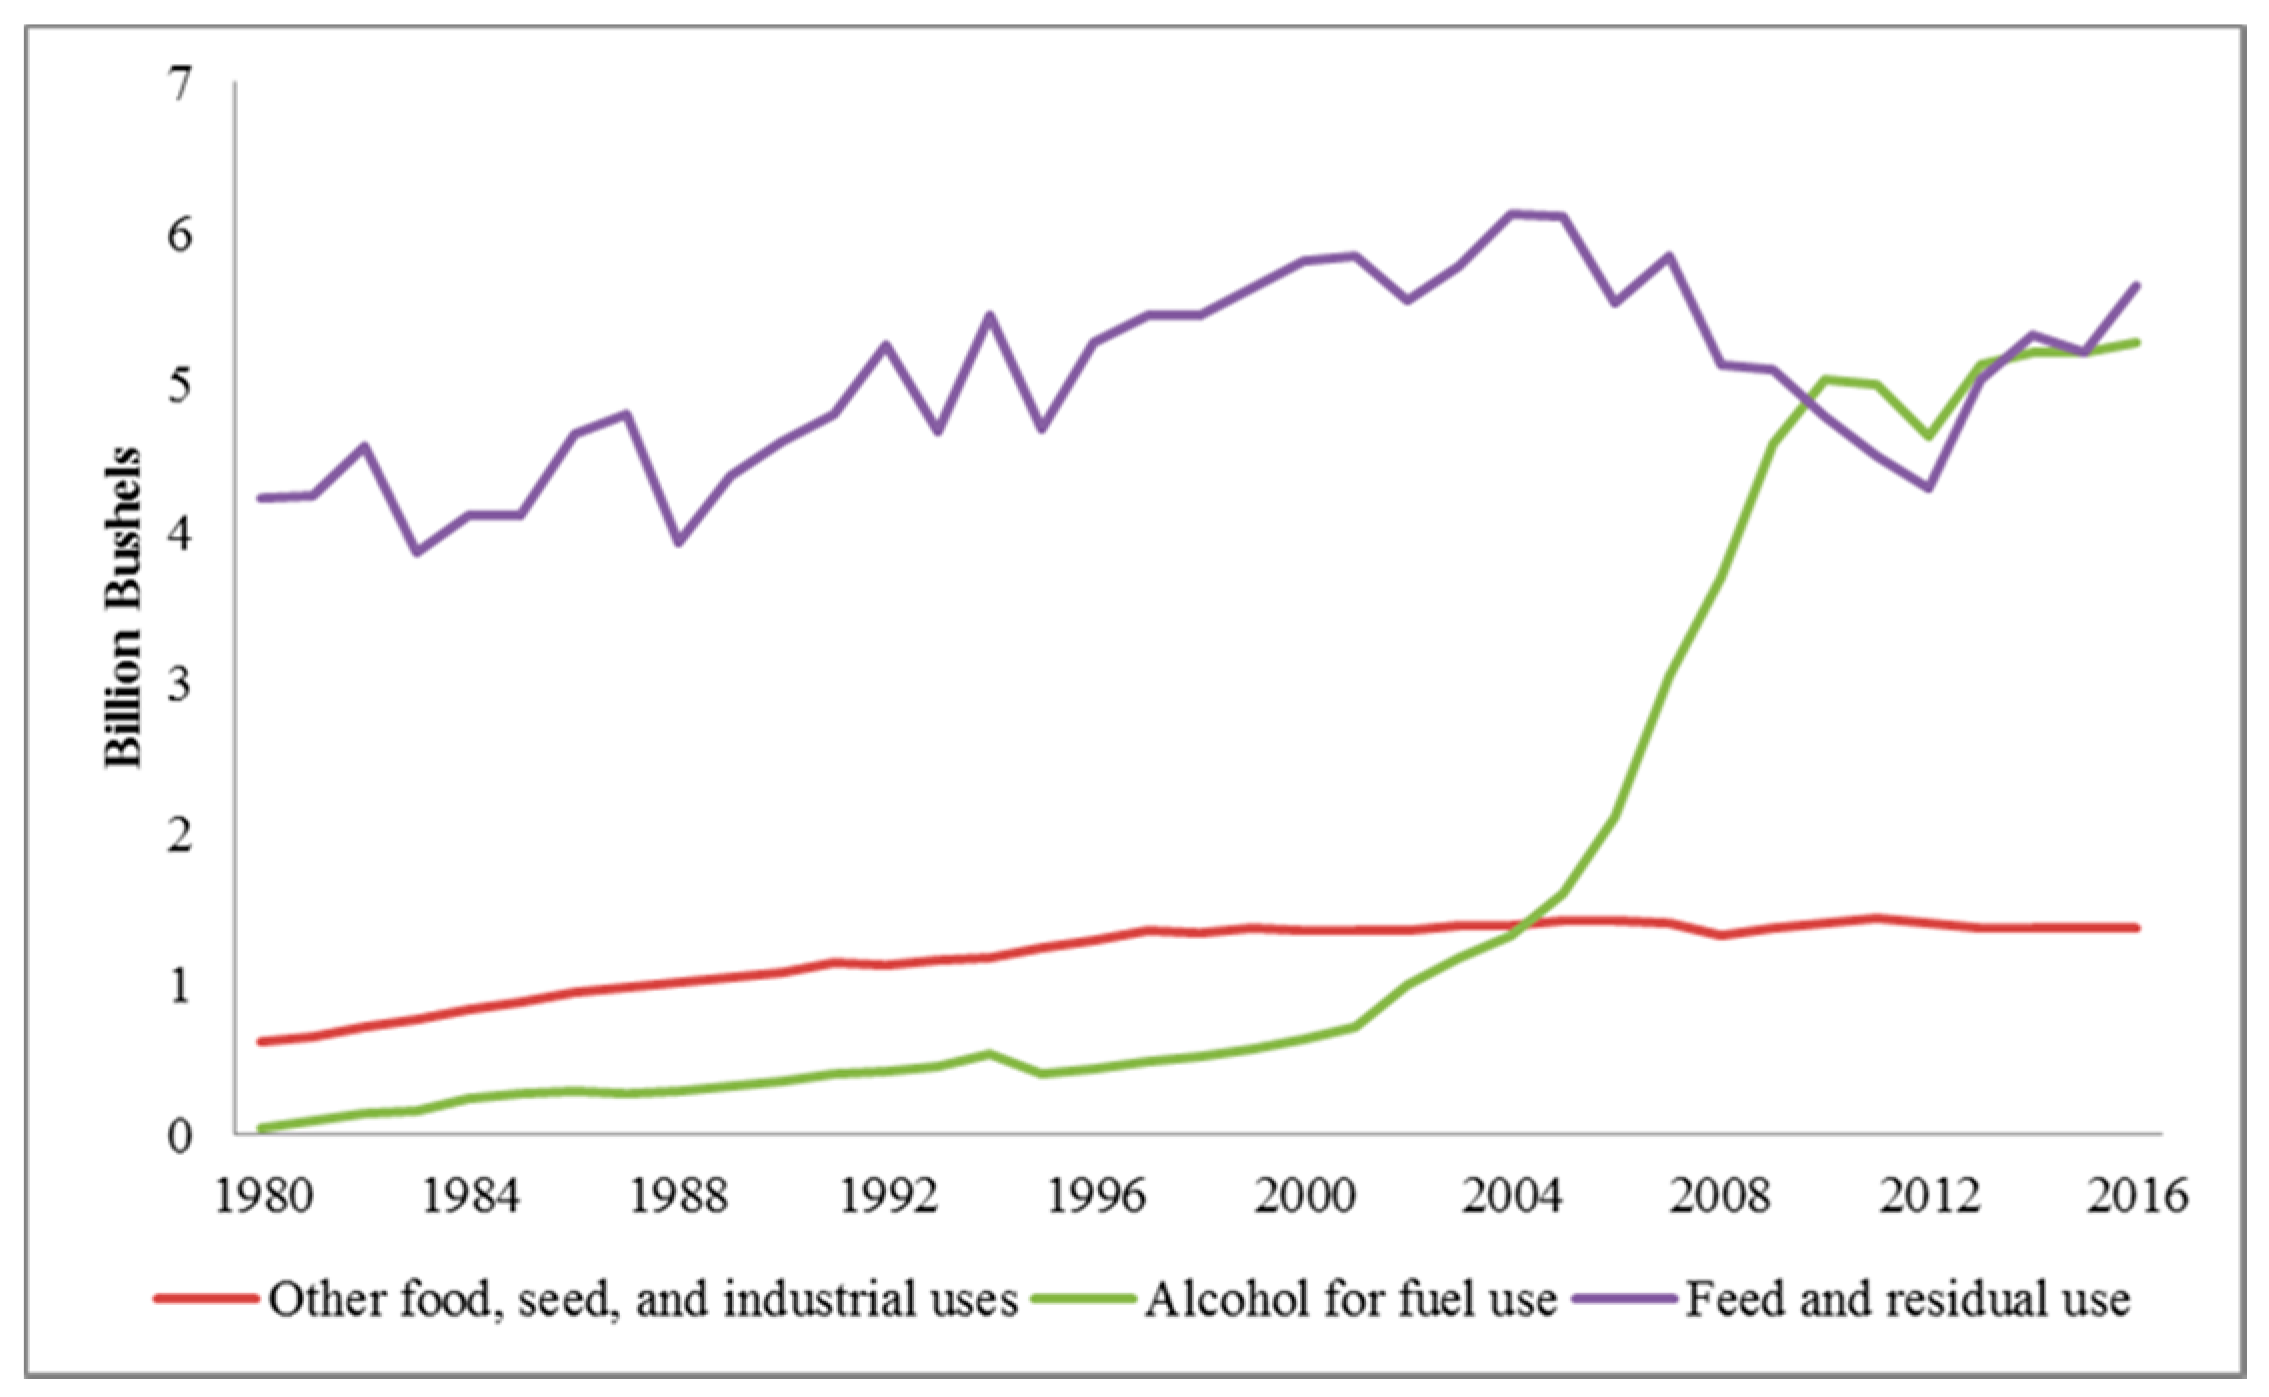
Figure 1. U.S. domestic corn use. Source: Calculated by United States Department of Agriculture (USDA) [2].
Atmosphere 11 00031 g001
Figure 2. FASOMGHG model structure. Source: Adapted from McCarl and Sands [24].
Atmosphere 11 00031 g002
Figure 3. Average U.S. cropland for biofuel production projection during 2015 to 2030.
Atmosphere 11 00031 g003
Figure 4. Average U.S. cropland for crop production projection during 2015 to 2030.
Atmosphere 11 00031 g004
Figure 5. Average U.S. cropland pasture used for livestock projection during 2015 to 2030.
Atmosphere 11 00031 g005
Figure 6. Average U.S. commodity price projection during 2015 to 2030.
Atmosphere 11 00031 g006
Figure 7. Average total GHG emissions projection during 2015 to 2030.
Atmosphere 11 00031 g007
Table 1. Demand model specifications.
Model Type and
Functional Form
Model SpecificationModel Number
1. Main Demand
  Linear D i t =   α i 0 +   α i 1 G D P P t + j = 1 n β i j P j t + ε i t 1.1
  Log-Lin ln D i t =   α i 0 +   α i 1 G D P P t + j = 1 n β i j P j t + ε i t 1.2
  Lin-Log D i t =   α i 0 +   α i 1 ln G D P P t + j = 1 n β i j ln P j t + ε i t 1.3
  Double-Log ln D i t =   α i 0 +   α i 1 ln G D P P t + j = 1 n β i j ln P j t + ε i t 1.4
2. Time Demand
  Linear D i t =   α i 0 +   α i 1 G D P P t + α i 2 T t + j = 1 n β i j P j t + ε i t 2.1
  Log-Lin ln D i t =   α i 0 +   α i 1 G D P P t + α i 2 T t + j = 1 n β i j P j t + ε i t 2.2
  Lin-Log D i t =   α i 0 +   α i 1 ln G D P P t + α i 2 T t + j = 1 n β i j ln P j t + ε i t 2.3
  Double -Log ln D i t =   α i 0 +   α i 1 ln G D P P t + α i 2 T t + j = 1 n β i j ln P j t + ε i t 2.4
3. Lag Demand
  Linear D i t =   α i 0 +   α i 1 G D P P t + α i 2 D i t 1 + j = 1 n β i j P j t + ε i t 3.1
  Log-Lin ln D i t =   α i 0 +   α i 1 G D P P t + α i 2 ln D i t 1 + j = 1 n β i j P j t + ε i t 3.2
  Lin-Log D i t =   α i 0 +   α i 1 ln G D P P t + α i 2 D i t 1 + j = 1 n β i j ln P j t + ε i t 3.3
  Double -Log ln D i t =   α i 0 +   α i 1 ln G D P P t + α i 2 α i 2 ln D i t 1 + j = 1 n β i j ln P j t + ε i t 3.4
4. Time and Lag Demand
  Linear D i t =   α i 0 +   α i 1 G D P P t + α i 2 T t + α i 3 D i t 1 + j = 1 n β i j P j t + ε i t 4.1
  Log-Lin ln D i t =   α i 0 +   α i 1 G D P P t + α i 2 T t + α i 3 ln D i t 1 + j = 1 n β i j P j t + ε i t 4.2
  Lin-Log D i t =   α i 0 +   α i 1 ln G D P P t + α i 2 T t + α i 3 D i t 1 + j = 1 n β i j ln P j t + ε i t 4.3
  Double -Log ln D i t =   α i 0 +   α i 1 ln G D P P t + α i 2 T t + α i 3 ln D i t 1 + j = 1 n β i j ln P j t + ε i t 4.4
Note: Variables are defined as follows: (1) D i t = quantity demanded or consumption per capita of a commodity i in period t; (2) D i t 1 = lagged quantity demanded or consumption per capita of a commodity i in period t − 1; (3) G D P P t = real GDP per capita in period t; (4) P j t = real price of commodity j in period t; (5) T t = time variable in period t; (6) ε i t = error or disturbance term in period t; (7) i = index for commodities; (8) j = index for commodities. If the commodity i is barley, corn, cotton, oats, rice, sorghum, soybeans, or wheat, j equals i, i.e., j includes one member. Otherwise if the commodity i is beef, broiler, or pork, j consists of three members, i.e., beef, broiler, and pork; and (9) αs and β s = estimated parameters.
Table 2. Biofuel policy scenario specifications for production in the years 2020 to 2030 with feedstock and volume mandates in billion gallons.
Ethanol Produced
from the Feedstock
Biofuel Policy Scenario
ControlCornCornRes
Corn15.012.415.0
Switchgrass8.88.88.8
Corn Residue4.04.00
Other Ethanol0.20.20.2
Total2825.424
Note: Other ethanol denotes that from wheat residue, sweet sorghum pulp, and sweet sorghum.
Table 3. Main integrated scenario specifications.
Main Integrated ScenarioScenario
Technical ProgressDemandBiofuel Policy
1. Base ControlAll (50 scenarios)BaseControl
2. Base CornAll (50 scenarios)BaseCorn
3. Base CornResAll (50 scenarios)BaseCornRes
4. Fast ControlAll (50 scenarios)FastControl
5. Fast CornAll (50 scenarios)FastCorn
6. Fast CornResAll (50 scenarios)FastCornRes
7. Slow ControlAll (50 scenarios)SlowControl
8. Slow CornAll (50 scenarios)SlowCorn
9. Slow CornResAll (50 scenarios)SlowCornRes
Table 4. Average U.S. cropland use during 2015 to 2030 under various biofuel policy and demand growth scenarios.
Cropland Use
(Million Acre)
YearBase DemandFast DemandSlow Demand
ControlCornCornResControlCornCornResControlCornCornRes
Biofuel Production201529.8030.7129.6530.0030.3729.7230.0830.2829.51
2020107.40106.5079.74107.53106.5679.64107.46106.5079.74
202593.4892.7969.3693.4692.7369.1693.5292.7969.36
203090.9390.3861.0990.8290.2960.9790.9290.3861.09
Crop Production2015314.21311.11313.98314.18310.94314.06314.08311.11313.98
2020316.71313.75316.17316.06313.33315.73316.49313.75316.17
2025316.21313.44315.78315.23312.64315.04315.99313.44315.78
2030315.58312.87315.15314.31311.77314.17315.35312.87315.15
Cropland pasture use for livestock201567.6470.5867.8667.6570.7667.7767.7570.5867.86
202064.0366.9664.5364.7167.4165.0064.2566.9764.53
202562.3565.1162.7963.3265.8663.5262.5765.1162.79
203061.1563.8161.5862.3564.8962.5261.3763.8161.58
Table 5. Average U.S. commodity price projection during 2015 to 2030 under various biofuel policy and demand growth scenarios.
Commodity PriceYearBase DemandFast DemandSlow Demand
ControlCornCornResControlCornCornResControlCornCornRes
Corn
(USD/bushel)
20153.693.463.693.693.473.693.693.463.69
20203.833.623.853.833.613.853.843.623.85
20254.013.764.033.983.734.004.023.764.03
20304.364.074.394.314.014.324.384.074.39
Cotton
(USD/pound)
20150.580.580.580.580.580.580.580.580.58
20200.680.680.680.650.650.650.680.680.68
20250.760.750.750.680.680.680.760.750.75
20300.780.770.780.720.720.720.780.770.78
Hay
(USD/ton)
2015144.86140.36145.00144.91140.66145.18144.77140.36145.00
2020159.33156.10158.56159.04156.03158.59159.05156.10158.56
2025166.52162.00165.97164.37160.37164.42166.05162.00165.97
2030176.40171.19176.07172.46167.86172.43176.04171.19176.07
Sorghum
(USD/hundred weight)
20156.315.916.306.305.926.306.305.916.30
20206.576.206.616.576.206.616.586.206.61
20256.916.466.936.856.416.886.926.466.93
20307.517.037.567.416.927.437.547.037.56
Soybeans
(USD/bushel)
201512.8512.7512.8512.8512.7612.8512.8512.7512.85
202013.0513.0812.9012.8913.0612.8912.9113.0812.90
202512.4512.5712.3212.2712.5112.2612.3212.5712.32
203012.0912.2011.8911.7912.1011.7911.8912.2011.89
Hard red winter wheat.
(USD/bushel)
20155.185.125.195.205.175.235.175.125.19
20206.296.246.266.416.366.376.276.246.26
20257.056.977.017.177.117.177.026.977.01
20307.087.007.067.016.946.997.077.017.06
Fed beef
(USD/pound)
20152.362.342.362.362.342.362.362.342.36
20202.522.512.522.522.502.522.522.512.52
20252.672.652.672.682.662.682.672.652.67
20302.782.772.782.812.792.812.782.772.78
Non-fed beef
(USD/pound)
20151.391.361.391.391.351.391.391.361.39
20201.491.471.501.501.481.501.491.471.50
20251.561.551.571.601.581.601.571.551.57
20301.581.571.581.641.621.641.581.571.58
Pork
(USD/pound)
20152.362.342.362.362.342.362.362.342.36
20202.522.512.522.522.502.522.522.512.52
20252.672.652.672.682.662.682.672.652.67
20302.782.772.782.812.792.812.782.772.78
Broiler
(USD/pound)
20150.820.820.810.820.810.820.820.810.82
20200.810.810.800.810.800.810.810.800.81
20250.810.810.810.810.810.810.810.810.81
20300.820.820.820.820.810.820.820.820.82
Ethanol
(USD/gallon)
20151.941.941.941.941.941.941.941.941.94
20201.831.831.831.831.831.831.831.831.83
20251.971.971.971.971.971.971.971.971.97
20301.881.881.881.881.881.881.881.881.88
Cellulosic Ethanol
(USD/gallon)
20151.941.941.941.941.941.941.941.941.94
20201.831.831.831.831.831.831.831.831.83
20251.971.971.971.971.971.971.971.971.97
20301.881.881.881.881.881.881.881.881.88
Table 6. Average GHG emissions projection (million ton per CO2e) during 2015 to 2030 under various biofuel policy and demand growth scenarios.
YearBase DemandFast DemandSlow Demand
ControlCornCornResControlCornCornResControlCornCornRes
2015231.89230.66240.15231.80230.66240.15231.26230.24239.54
202066.83118.3077.3766.80118.3077.3767.36118.5978.62
202529.1767.7539.1929.1767.7539.1929.3867.7539.46
2030−6.0726.895.18−6.1726.895.18−6.7327.144.68
Table 7. Biofuel production land regression results.
Crop Tech/
Variable
Base DemandFast DemandSlow Demand
ControlCornCornResControlCornCornResControlCornCornRes
Corn−13.39 *−13.55 *−32.55 **−14.64 **−13.55 *−32.67 **−13.46 *−13.56 *−32.55 **
(7.076)(6.905)(13.01)(7.055)(6.881)(13.00)(7.074)(6.905)(13.01)
Cotton−32.46 ***−29.38 **−62.81 ***−32.96 ***−30.42 ***−62.91 ***−32.54 ***−29.37 **−62.81 ***
(11.55)(11.27)(21.23)(11.51)(11.23)(21.22)(11.54)(11.27)(21.23)
Hay7.7197.47730.698.4127.24431.377.5447.47730.69
(12.24)(11.94)(22.50)(12.20)(11.90)(22.48)(12.23)(11.94)(22.50)
Sorghum5.7495.66011.065.7435.25110.795.7485.65911.06
(5.241)(5.114)(9.636)(5.226)(5.097)(9.630)(5.240)(5.115)(9.636)
Soybeans−21.14 **−22.13 ***−19.51−22.02 ***−21.54 ***−19.31−21.50 ***−22.13 ***−19.51
(8.135)(7.938)(14.96)(8.111)(7.910)(14.95)(8.132)(7.938)(14.96)
Winter Wheat−19.85 **−19.76 **8.039−18.41 **−19.74 **8.747−19.84 **−19.76 **8.041
(9.267)(9.042)(17.04)(9.239)(9.011)(17.03)(9.264)(9.043)(17.04)
Constant185.3 ***182.5 ***155.0 ***186.1 ***183.7 ***153.7 ***186.1 ***182.5 ***155.0 ***
(18.19)(17.75)(33.44)(18.13)(17.69)(33.42)(18.18)(17.75)(33.44)
N150150150150150150150150150
R20.2970.2960.2050.3050.3000.2040.3000.2960.205
Adjusted R20.2680.2670.1710.2760.2710.1710.2700.2670.171
Root MSE10.9610.9610.9610.9610.9620.1410.9610.7020.15
Note: (1) ***, **, and * are significant at the 1, 5, and 10 percent levels, respectively. (2) Numbers in parentheses are standard errors.
Table 8. Livestock pasture land regression results.
Crop Tech/
Variable
Base DemandFast DemandSlow Demand
ControlCornCornResControlCornCornResControlCornCornRes
Corn−10.87 **−10.34 **−11.34 **−11.55 **−10.99 **−11.74 **−10.99 **−10.34 **−11.34 **
(4.897)(4.904)(5.023)(5.107)(5.009)(5.161)(4.955)(4.904)(5.023)
Cotton−29.03 ***−29.18 ***−30.05 ***−30.96 ***−29.15**−31.16 ***−29.98 ***−29.17 ***−30.05 ***
(10.99)(11.00)(11.27)(11.46)(11.24)(11.58)(11.12)(11.00)(11.27)
Hay11.2010.4211.6410.1710.6610.8310.8310.4211.64
(7.933)(7.943)(8.136)(8.273)(8.114)(8.361)(8.027)(7.943)(8.136)
Sorghum2.7313.1322.8373.1493.1633.1322.8083.1322.837
(3.366)(3.370)(3.452)(3.510)(3.443)(3.547)(3.405)(3.370)(3.452)
Soybeans−9.302−9.099−9.836 *−9.721−10.38 *−9.699−9.621 *−9.097−9.837 *
(5.687)(5.695)(5.833)(5.931)(5.817)(5.994)(5.755)(5.695)(5.833)
Winter Wheat1.3603.7401.6921.6423.1441.6431.5413.7401.691
(6.119)(6.127)(6.276)(6.381)(6.258)(6.449)(6.191)(6.127)(6.276)
Constant2.6072.2132.6973.1552.7123.0912.7212.2132.697
(1.979)(1.982)(2.030)(2.064)(2.024)(2.086)(2.003)(1.982)(2.030)
D256.276 *5.540 *6.530 *7.326 **6.554 *7.282 **6.512 *5.540 *6.530 *
(3.257)(3.261)(3.341)(3.397)(3.331)(3.433)(3.296)(3.261)(3.341)
D30102.4 ***102.5 ***104.2 ***106.7 ***105.4 ***106.7 ***104.2 ***102.5 ***104.2 ***
(18.13)(18.16)(18.60)(18.91)(18.55)(19.11)(18.35)(18.16)(18.60)
N150150150150150150150150150
R20.1110.1170.1140.1050.1070.1060.1130.1170.114
Adjusted R20.0610.0660.0630.0540.0560.0550.0620.0660.063
Root MSE6.9796.9887.1587.2787.1387.3557.0616.9887.158
Note: (1) ***, **, and * are significant at the 1, 5, and 10 percent levels, respectively. (2) Numbers in parentheses are standard errors.
Table 9. Crop production land regression results.
Crop Tech/
Variable
Base DemandFast DemandSlow Demand
ControlCornCornResControlCornCornResControlCornCornRes
Corn10.26 **9.689 *10.85 **10.81 **10.32 **11.16 **10.36 **9.689 *10.85 **
(4.957)(5.002)(5.114)(5.189)(5.124)(5.258)(5.022)(5.002)(5.114)
Cotton28.93 **29.08 **29.84 **30.67 ***28.73 **30.80 **29.86 ***29.08 **29.84 **
(11.12)(11.22)(11.47)(11.64)(11.49)(11.80)(11.27)(11.22)(11.47)
Hay−11.26−10.26−11.65−9.910−10.41−10.68−10.82−10.26−11.65
(8.030)(8.102)(8.284)(8.406)(8.300)(8.517)(8.135)(8.102)(8.284)
Sorghum−2.793−3.030−2.922−3.036−3.133−3.178−2.792−3.030−2.922
(3.407)(3.437)(3.515)(3.566)(3.521)(3.614)(3.452)(3.437)(3.515)
Soybeans9.4839.42710.09 *9.94910.77 *9.9719.814 *9.42610.09 *
(5.757)(5.809)(5.939)(6.027)(5.951)(6.107)(5.833)(5.809)(5.939)
Winter Wheat−1.341−3.498−1.671−1.244−2.864−1.409−1.434−3.498−1.670
(6.194)(6.249)(6.390)(6.484)(6.402)(6.570)(6.275)(6.249)(6.390)
Constant−4.754 **−4.372 **−4.794 **−5.334 **−4.915 **−5.225 **−4.863 **−4.371 **−4.794 **
(2.004)(2.021)(2.067)(2.097)(2.071)(2.125)(2.030)(2.021)(2.067)
D25−10.18 ***−9.513 ***−10.40 ***−11.32 ***−10.51 ***−11.20 ***−10.43 ***−9.513 ***−10.40 ***
(3.297)(3.326)(3.401)(3.451)(3.408)(3.497)(3.340)(3.326)(3.401)
D30279.1 ***278.2 ***277.1 ***274.2 ***275.6 ***274.4 ***277.0 ***278.2 ***277.1 ***
(18.36)(18.52)(18.94)(19.21)(18.97)(19.47)(18.60)(18.52)(18.94)
N150150150150150150150150150
R20.0860.0840.0870.0920.0880.0900.0880.0840.087
Adjusted R20.0350.0320.0360.0400.0370.0390.0360.0320.036
Root MSE7.0647.1277.2887.3957.3027.4937.1577.1277.288
Note: (1) ***, **, and * are significant at the 1, 5, and 10 percent levels, respectively. (2) Numbers in parentheses are standard errors.
Table 10. GHG emissions regression results.
CropBase DemandFast DemandSlow Demand
ControlCornCornResControlCornCornResControlCornCornRes
Corn−47.32 ***−50.61 ***−46.16 ***−48.15 ***−50.61 ***−46.15 ***−46.83 ***−49.17 ***−47.07 ***
(16.83)(16.77)(16.88)(16.80)(16.77)(16.88)(16.90)(16.79)(16.76)
Cotton−162.4 ***−225.7 ***−163.9 ***−163.8 ***−225.7 ***−163.9 ***−170.1 ***−226.0 ***−168.9 ***
(27.47)(27.37)(27.55)(27.42)(27.37)(27.55)(27.58)(27.41)(27.36)
Hay91.54 ***84.09 ***98.01 ***91.06 ***84.09 ***98.01 ***88.16 ***81.04 ***100.6 ***
(29.11)(29.00)(29.20)(29.06)(29.00)(29.20)(29.23)(29.04)(28.99)
Sorghum−1.2641.8580.945−1.5071.8570.946−1.8810.9631.832
(12.47)(12.42)(12.51)(12.45)(12.42)(12.51)(12.52)(12.44)(12.42)
Soybeans−66.98 ***−80.26 ***−63.58 ***−64.38 ***−80.26 ***−63.59 ***−65.15 ***−82.03 ***−66.37 ***
(19.35)(19.28)(19.41)(19.32)(19.28)(19.41)(19.43)(19.31)(19.27)
Winter Wheat−39.10 *−44.83 **−33.82−38.33 *−44.82 **−33.83−38.99 *−44.32 **−33.77
(22.04)(21.96)(22.11)(22.01)(21.96)(22.11)(22.14)(21.99)(21.95)
Constant312.5 ***459.3 ***304.6 ***312.0 ***459.3 ***304.6 ***323.0 ***463.6 ***311.6 ***
(43.27)(43.10)(43.40)(43.19)(43.10)(43.40)(43.45)(43.17)(43.09)
N150150150150150150150150150
R20.5260.6430.5150.5260.6430.5150.5330.6420.533
Adjusted R20.5060.6280.4950.5060.6280.4950.5130.6270.513
Root MSE26.0725.9826.1526.0325.9826.1526.1926.0225.97
Note: (1) ***, **, and * are significant at the 1, 5, and 10 percent levels, respectively. (2) Numbers in parentheses are standard errors.