
Investigating the Sexual Dimorphism of Waist-to-Hip Ratio and Its Associations with Complex Traits


Abstract
1. Introduction
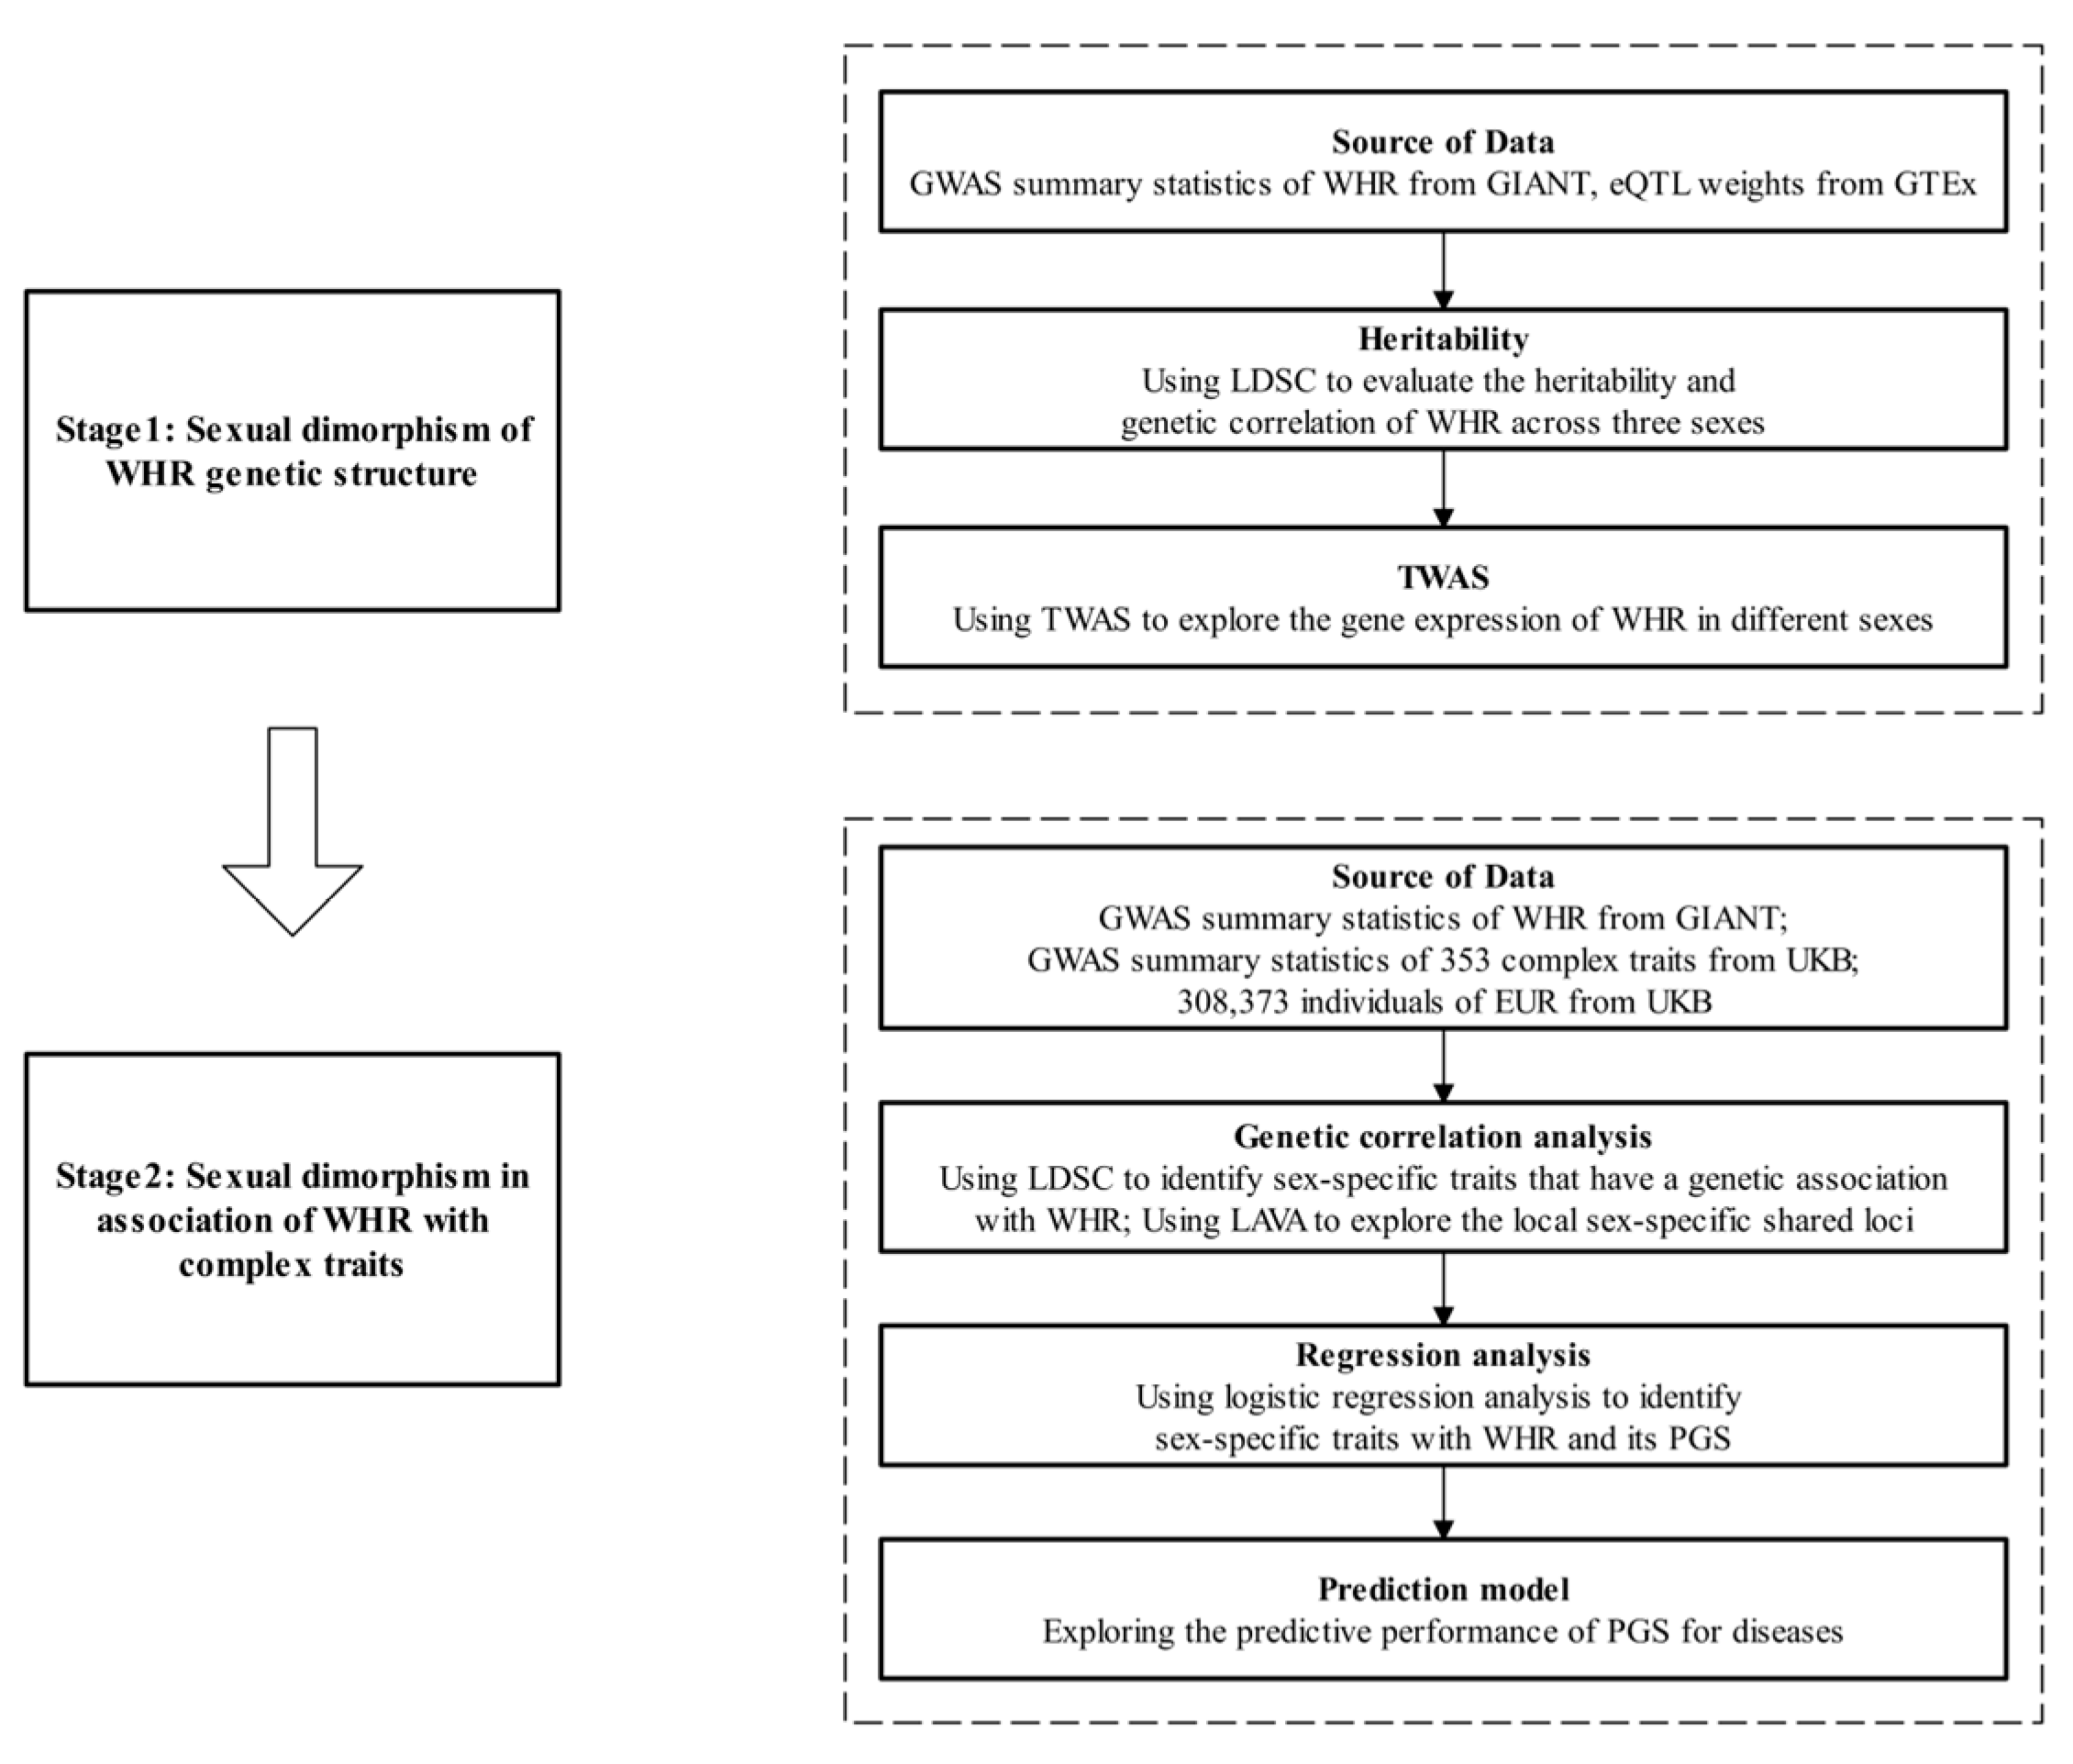
2. Methods
2.1. GWAS Summary Statistics of WHR
2.2. Study Population
2.3. Transcriptome-Wide Association Analysis
2.4. GWAS Summary Statistics for Complex Traits
2.5. Genetic Correlation Analysis
2.6. Polygenic Risk Score
2.7. Definition of Outcome
2.8. Statistical Analysis
3. Results
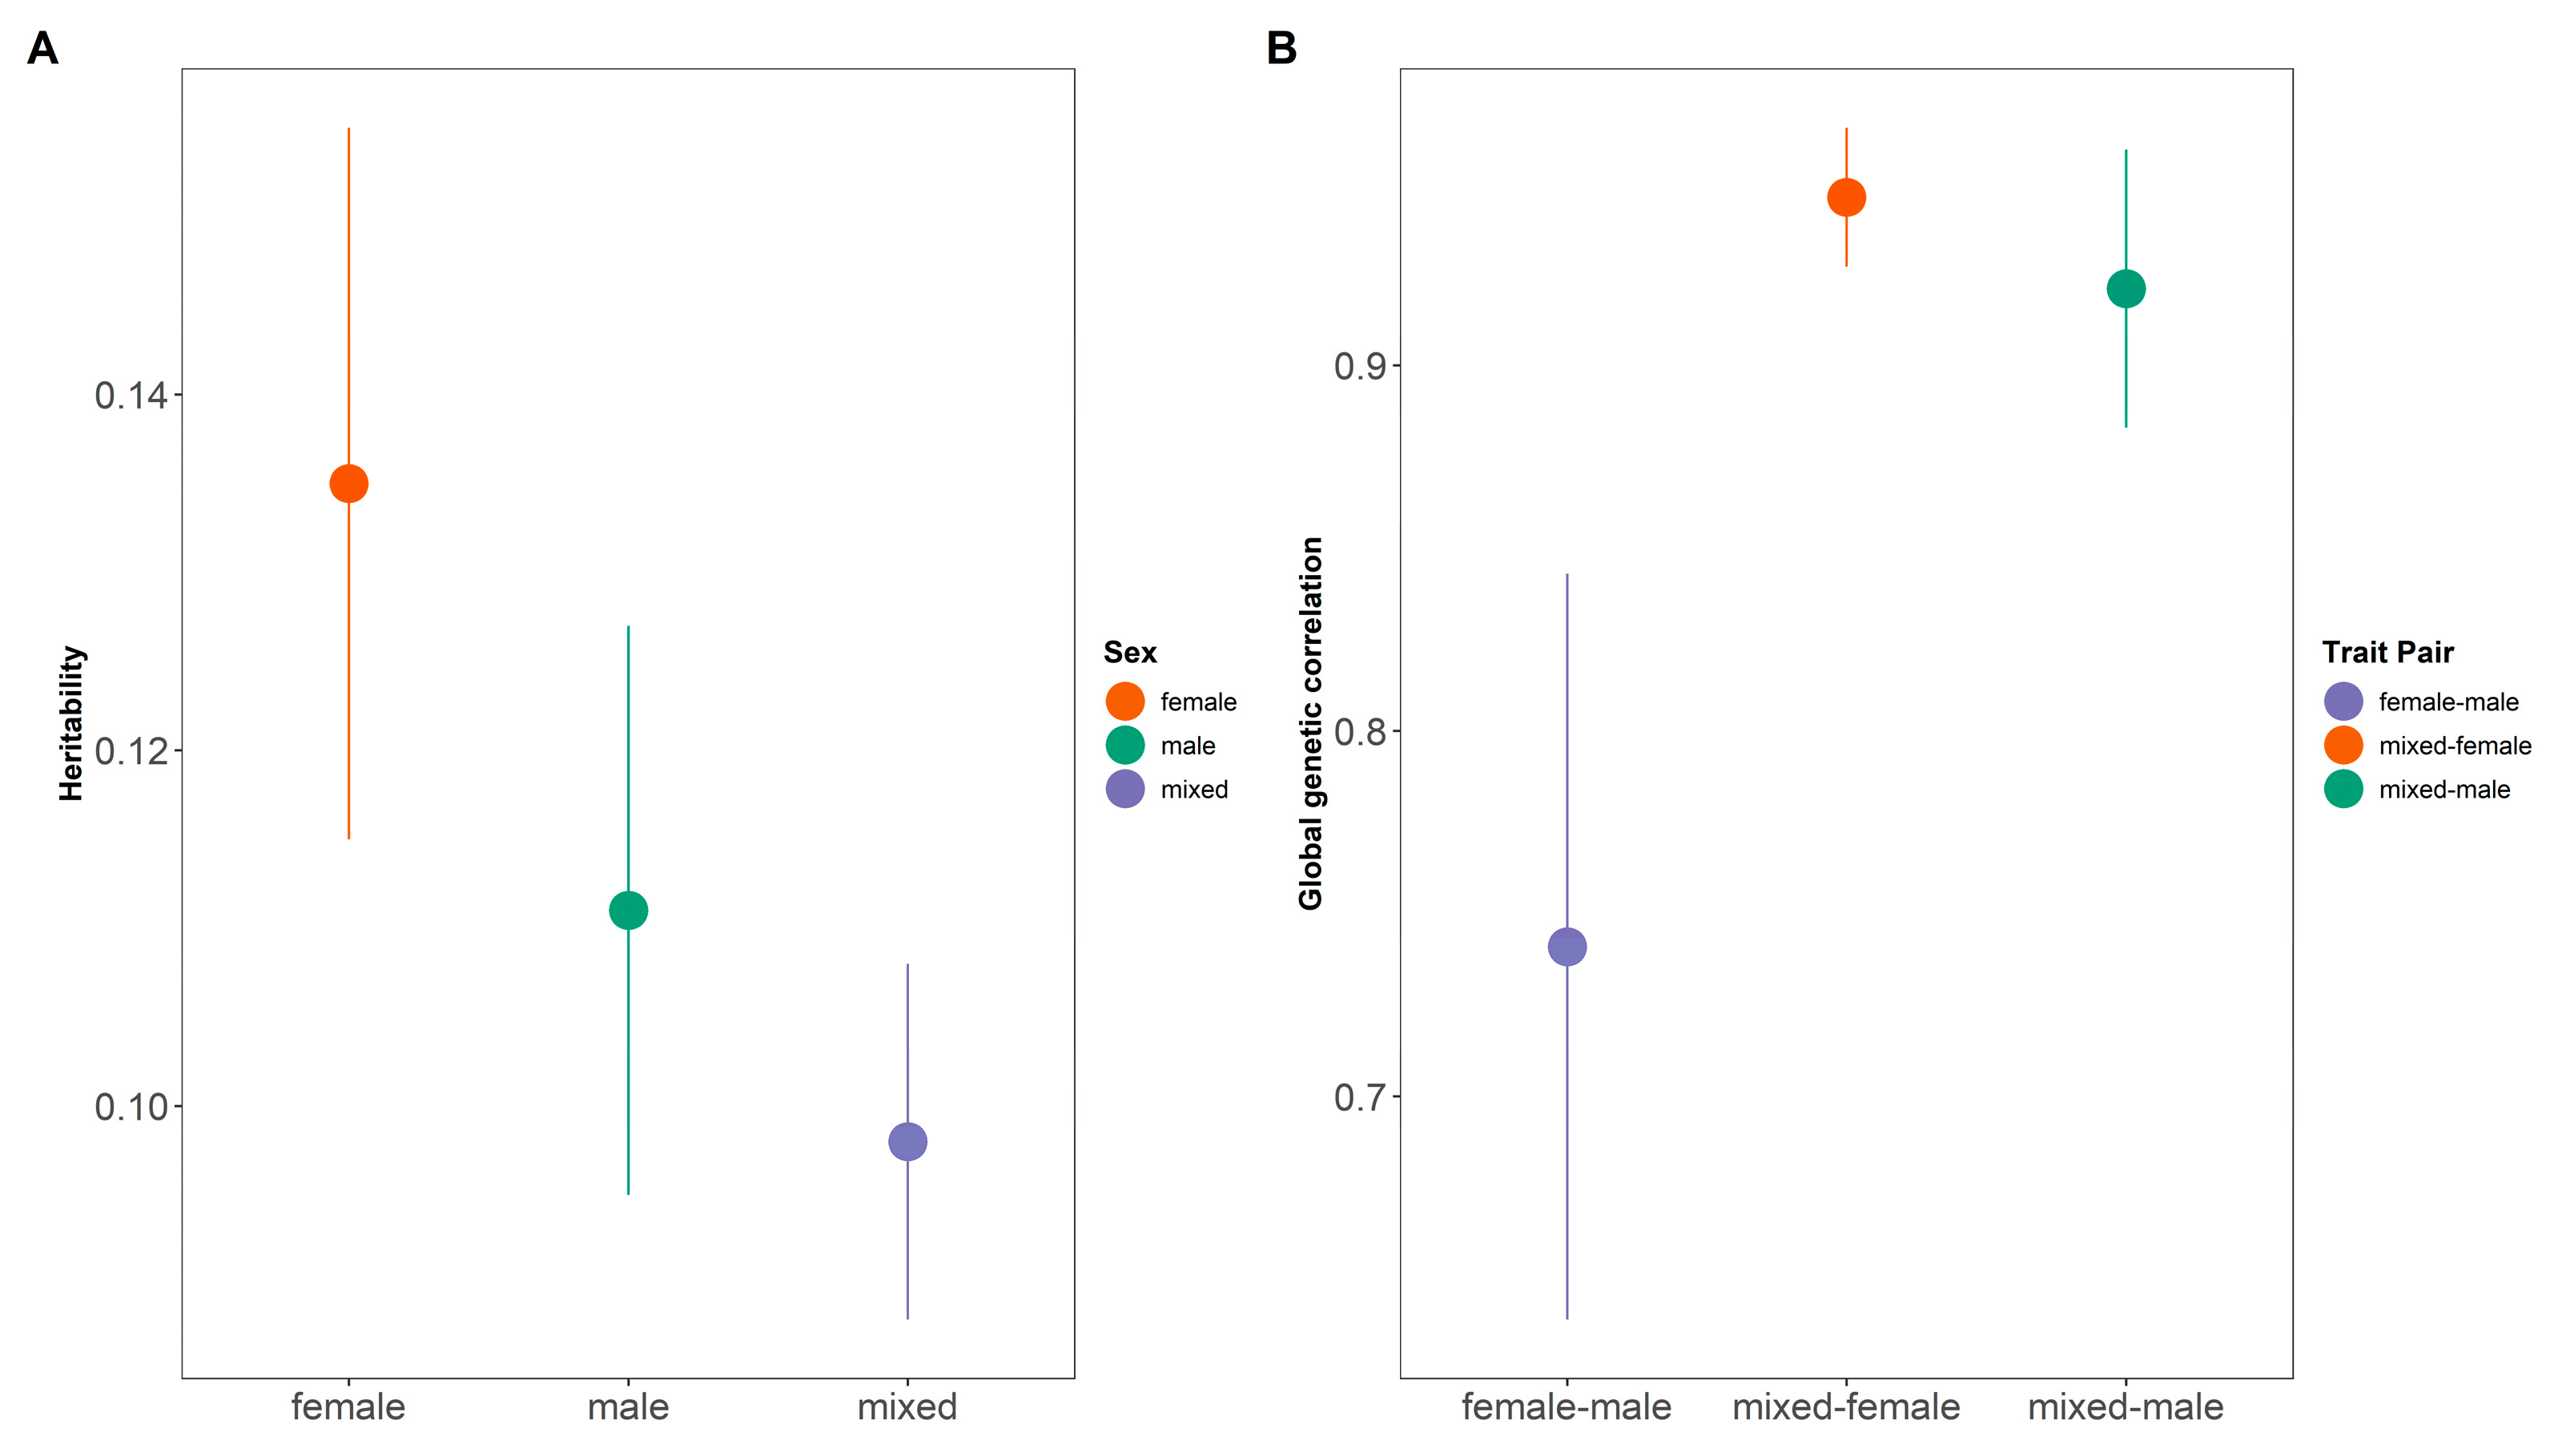
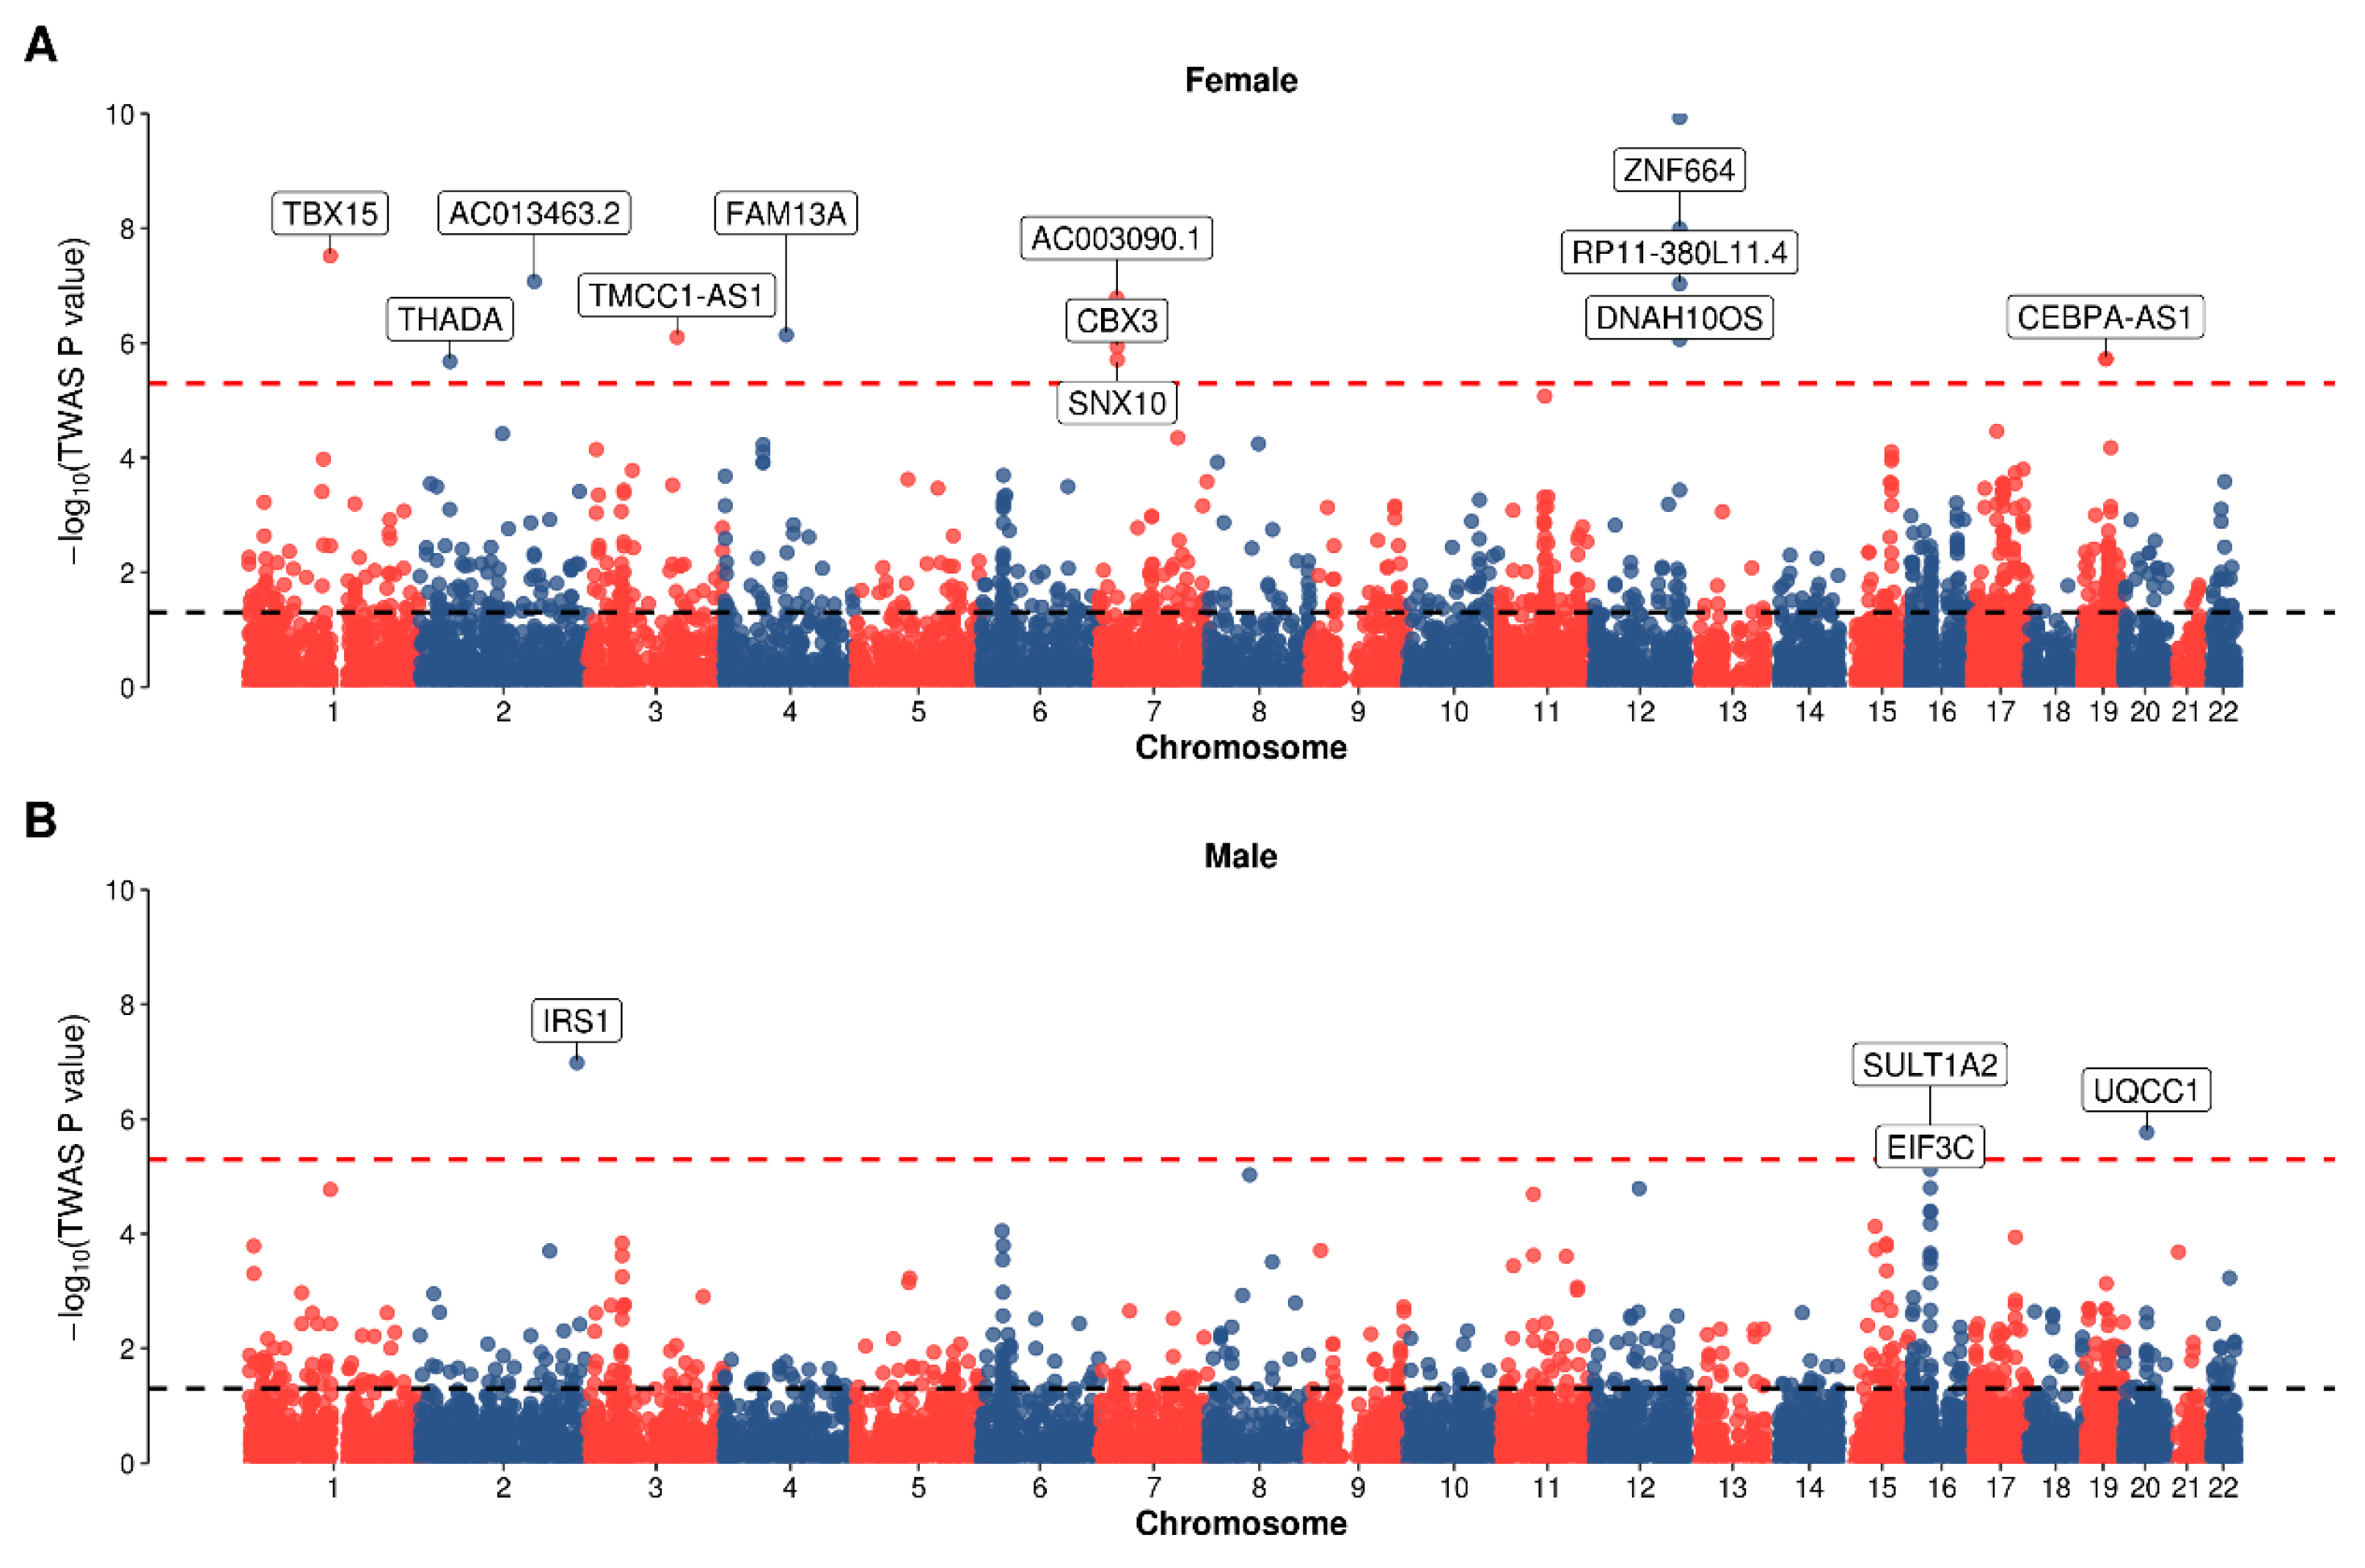
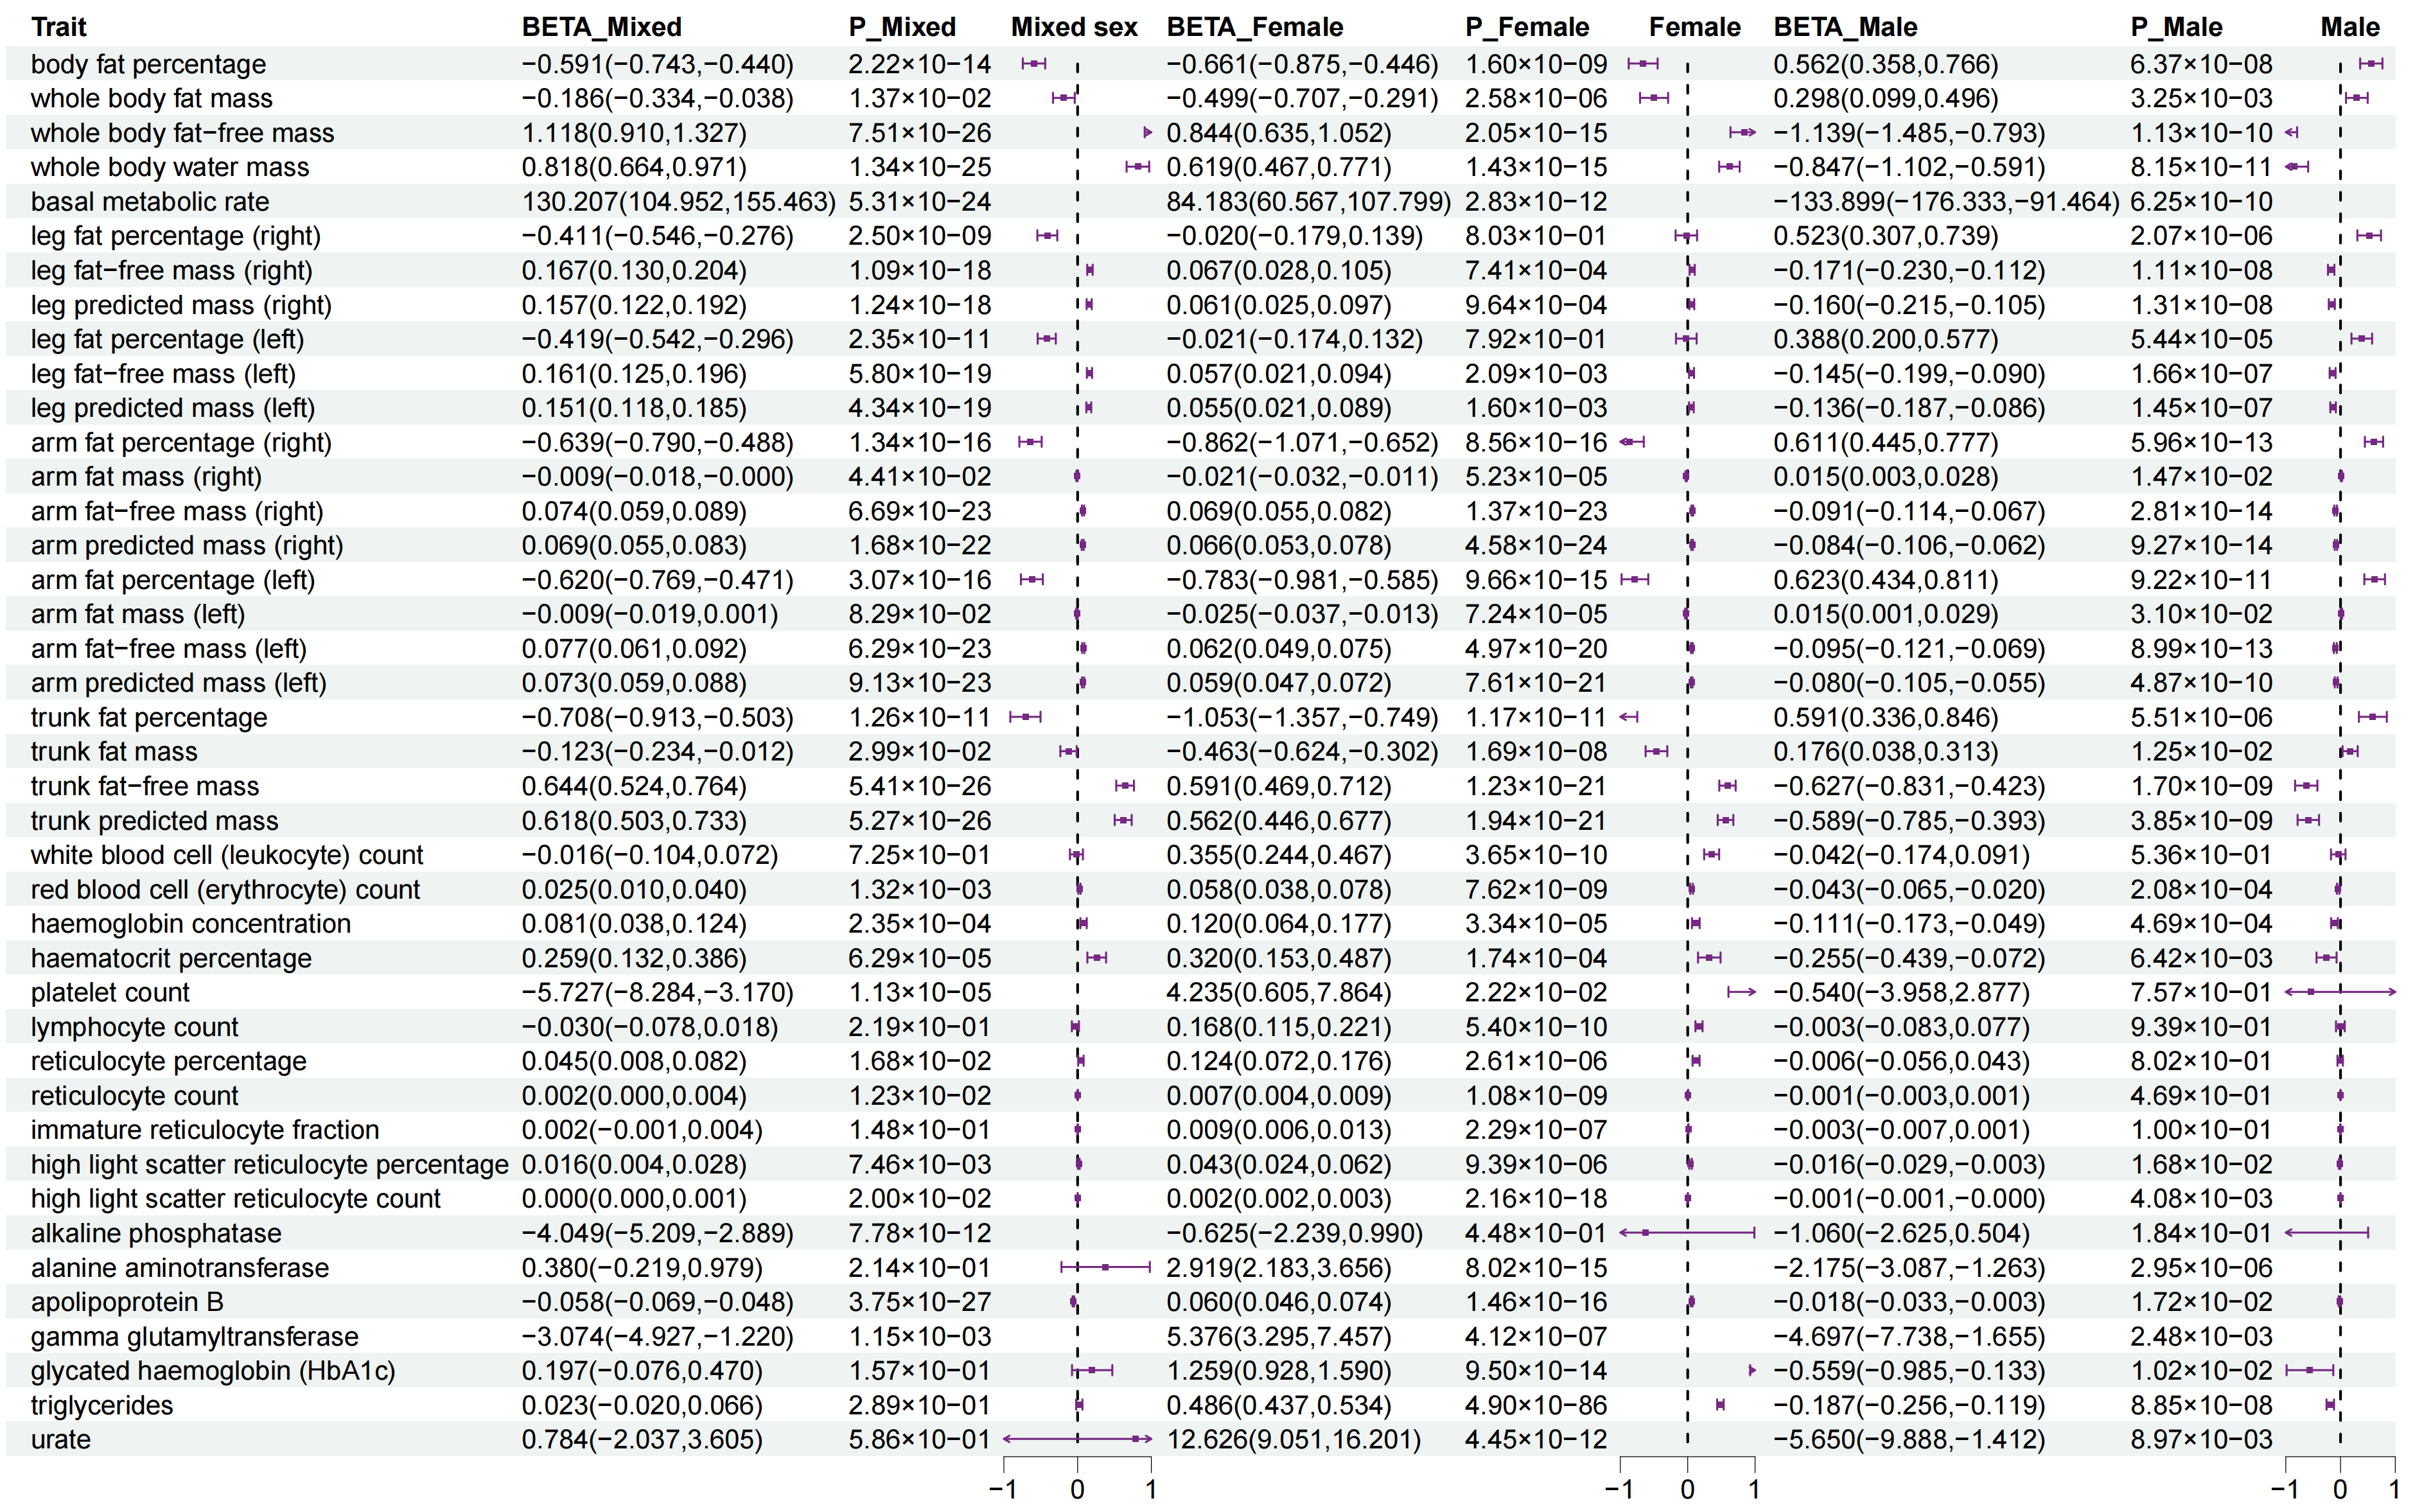
3.1. Sexual Dimorphism from Association Study
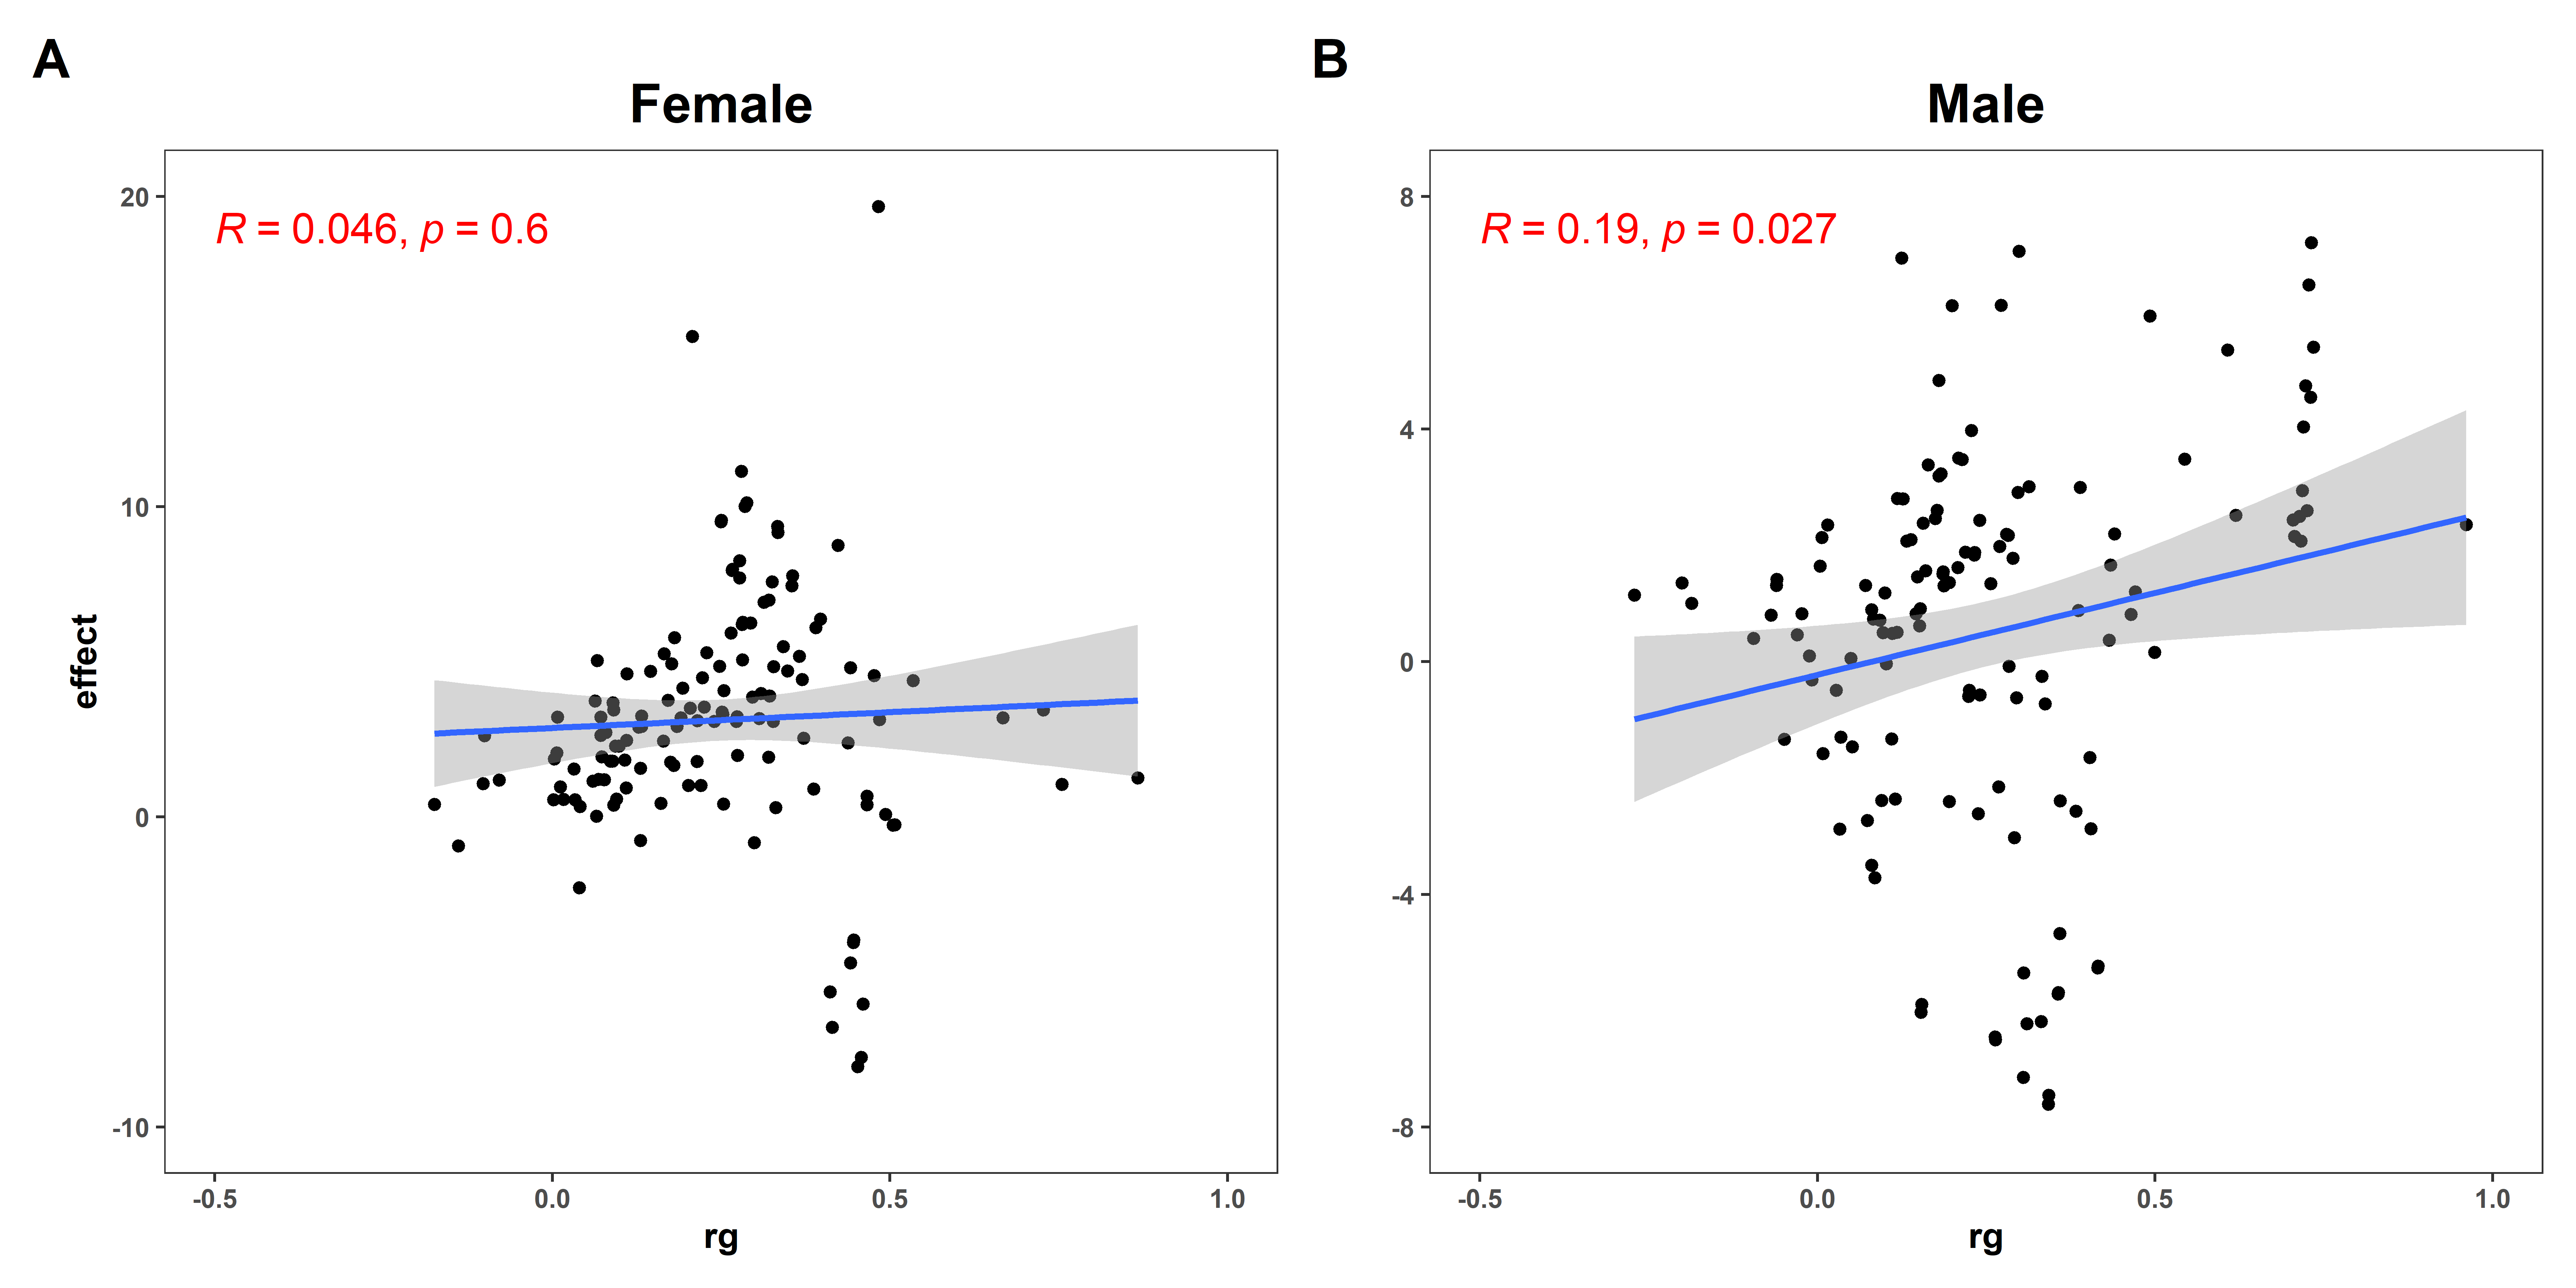
3.2. Sexual Dimorphism for WHR with 147 Complex Traits
3.3. Baseline Population Characteristics in UKB
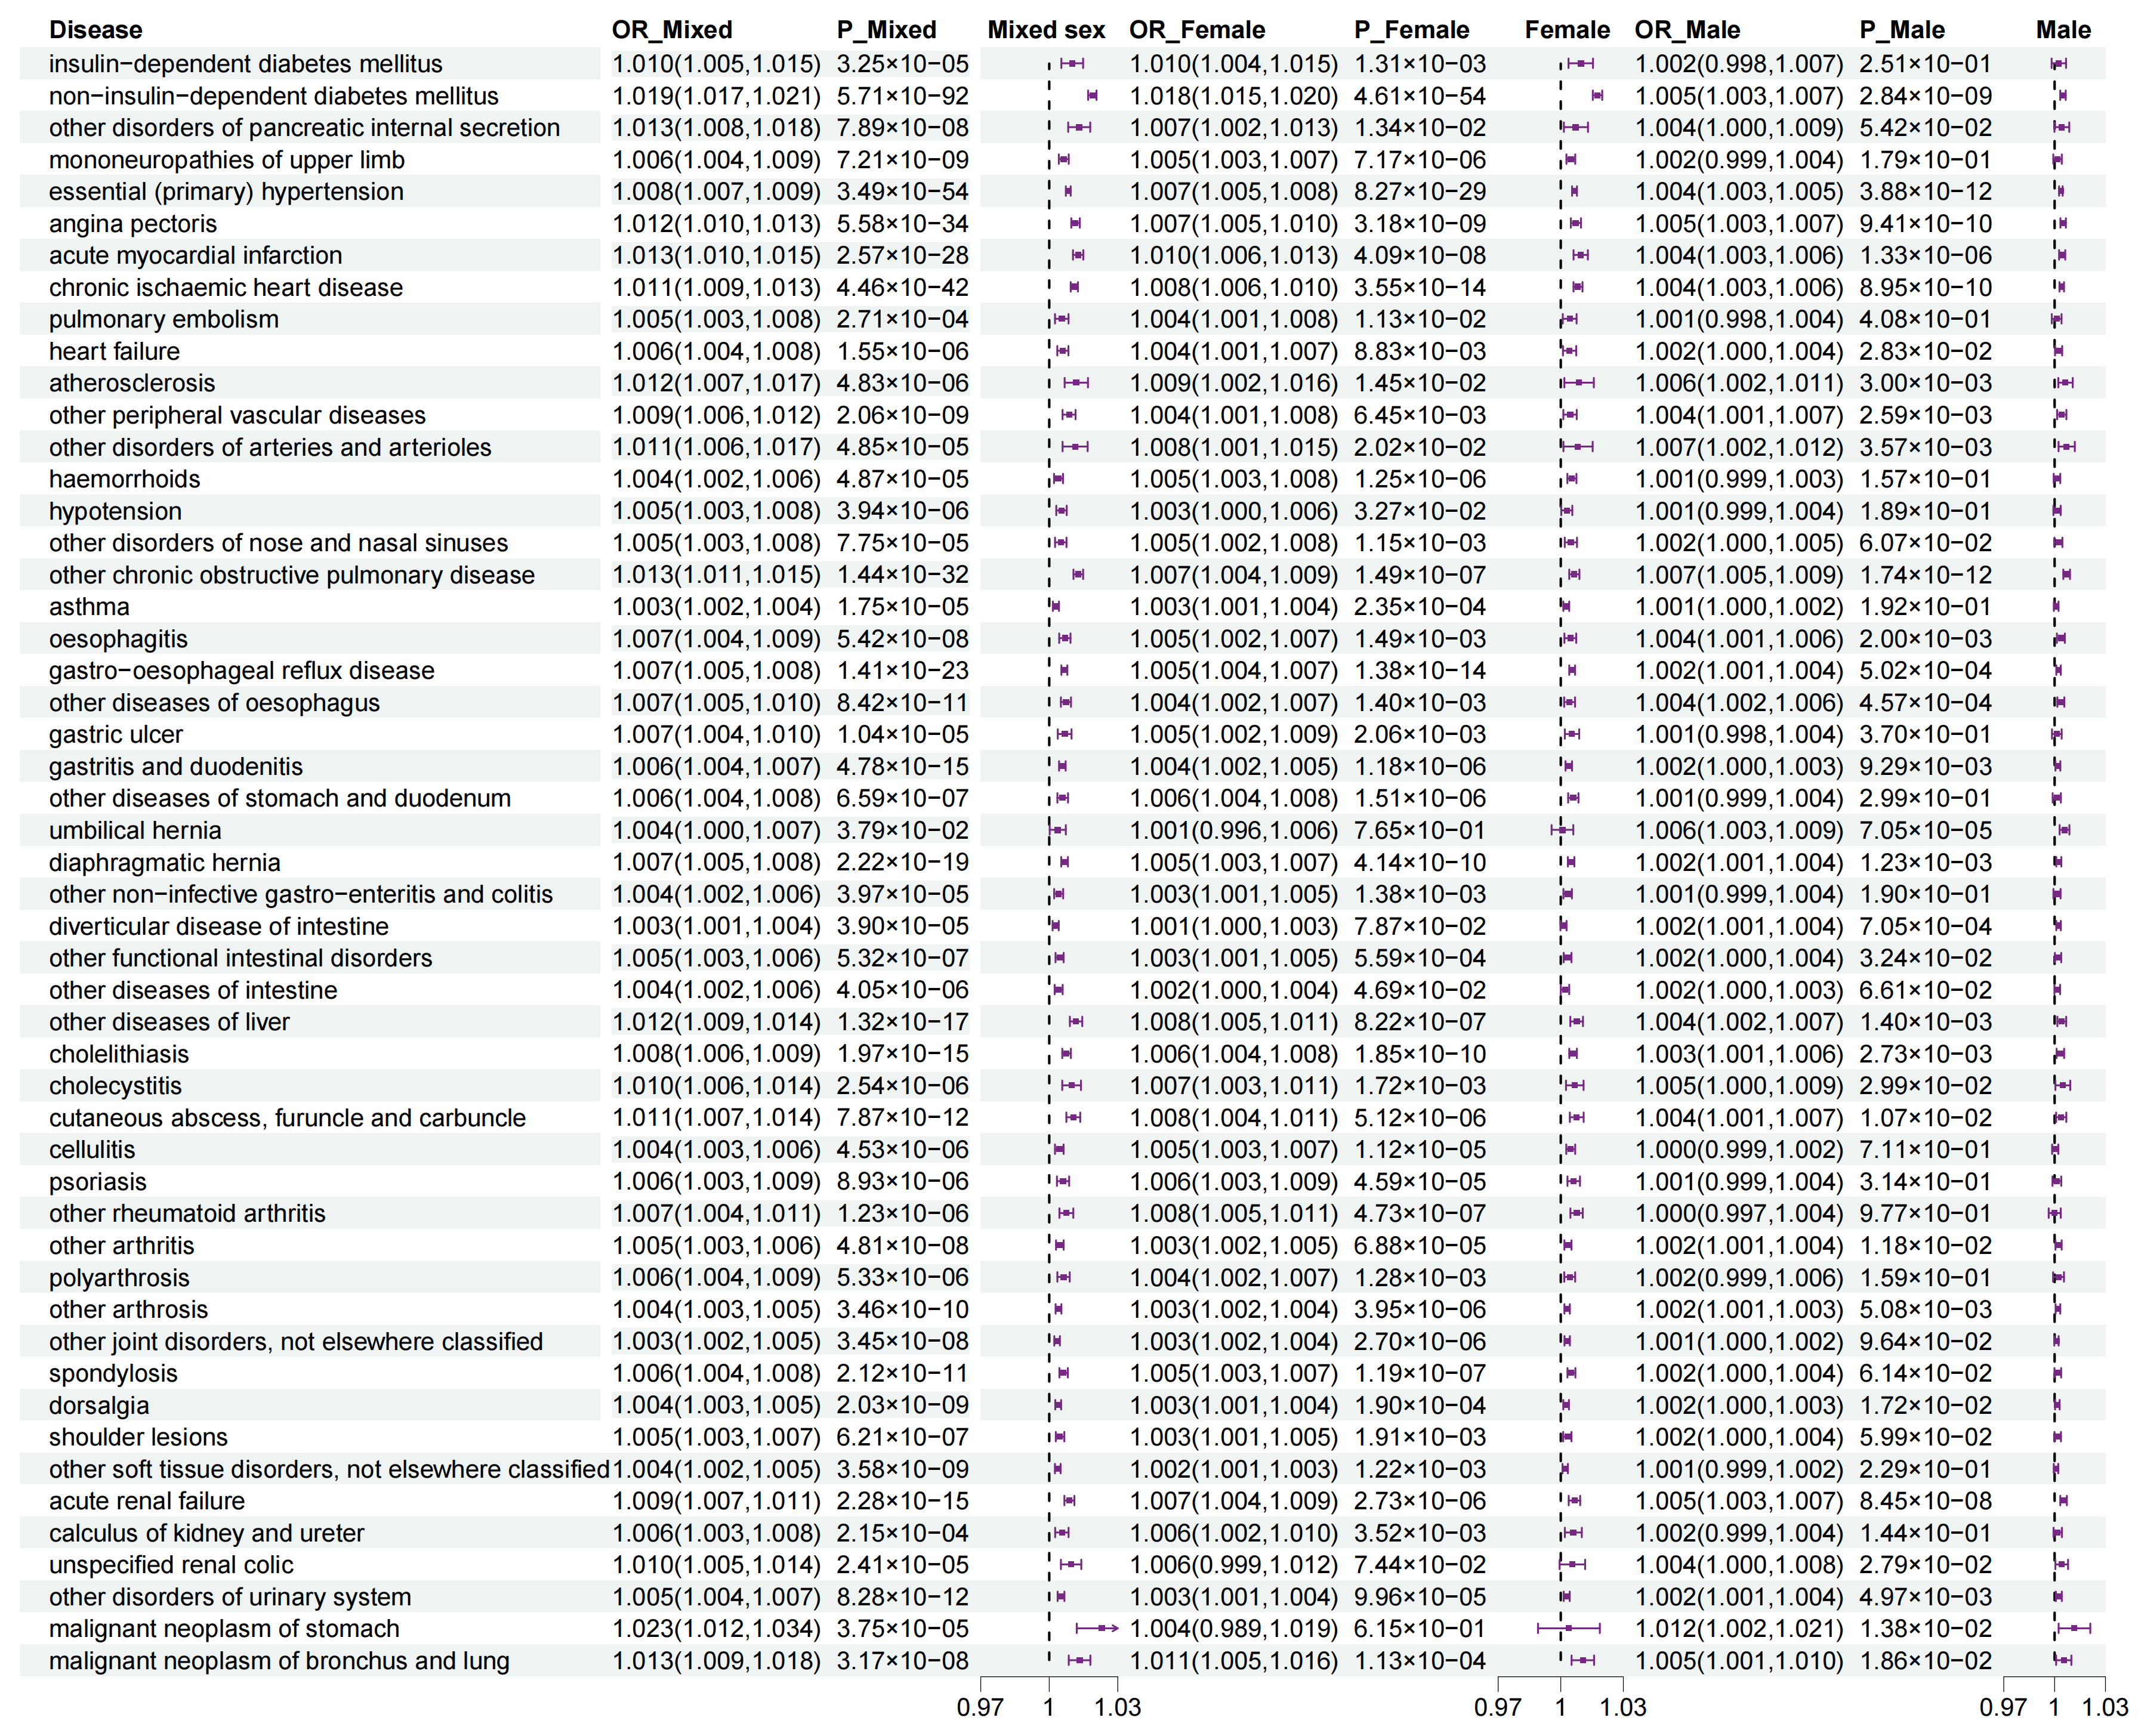
3.4. Sexual Dimorphism for Association of WHR with Outcomes
3.5. Sexual Dimorphism for Association of WHR PGS with Outcomes
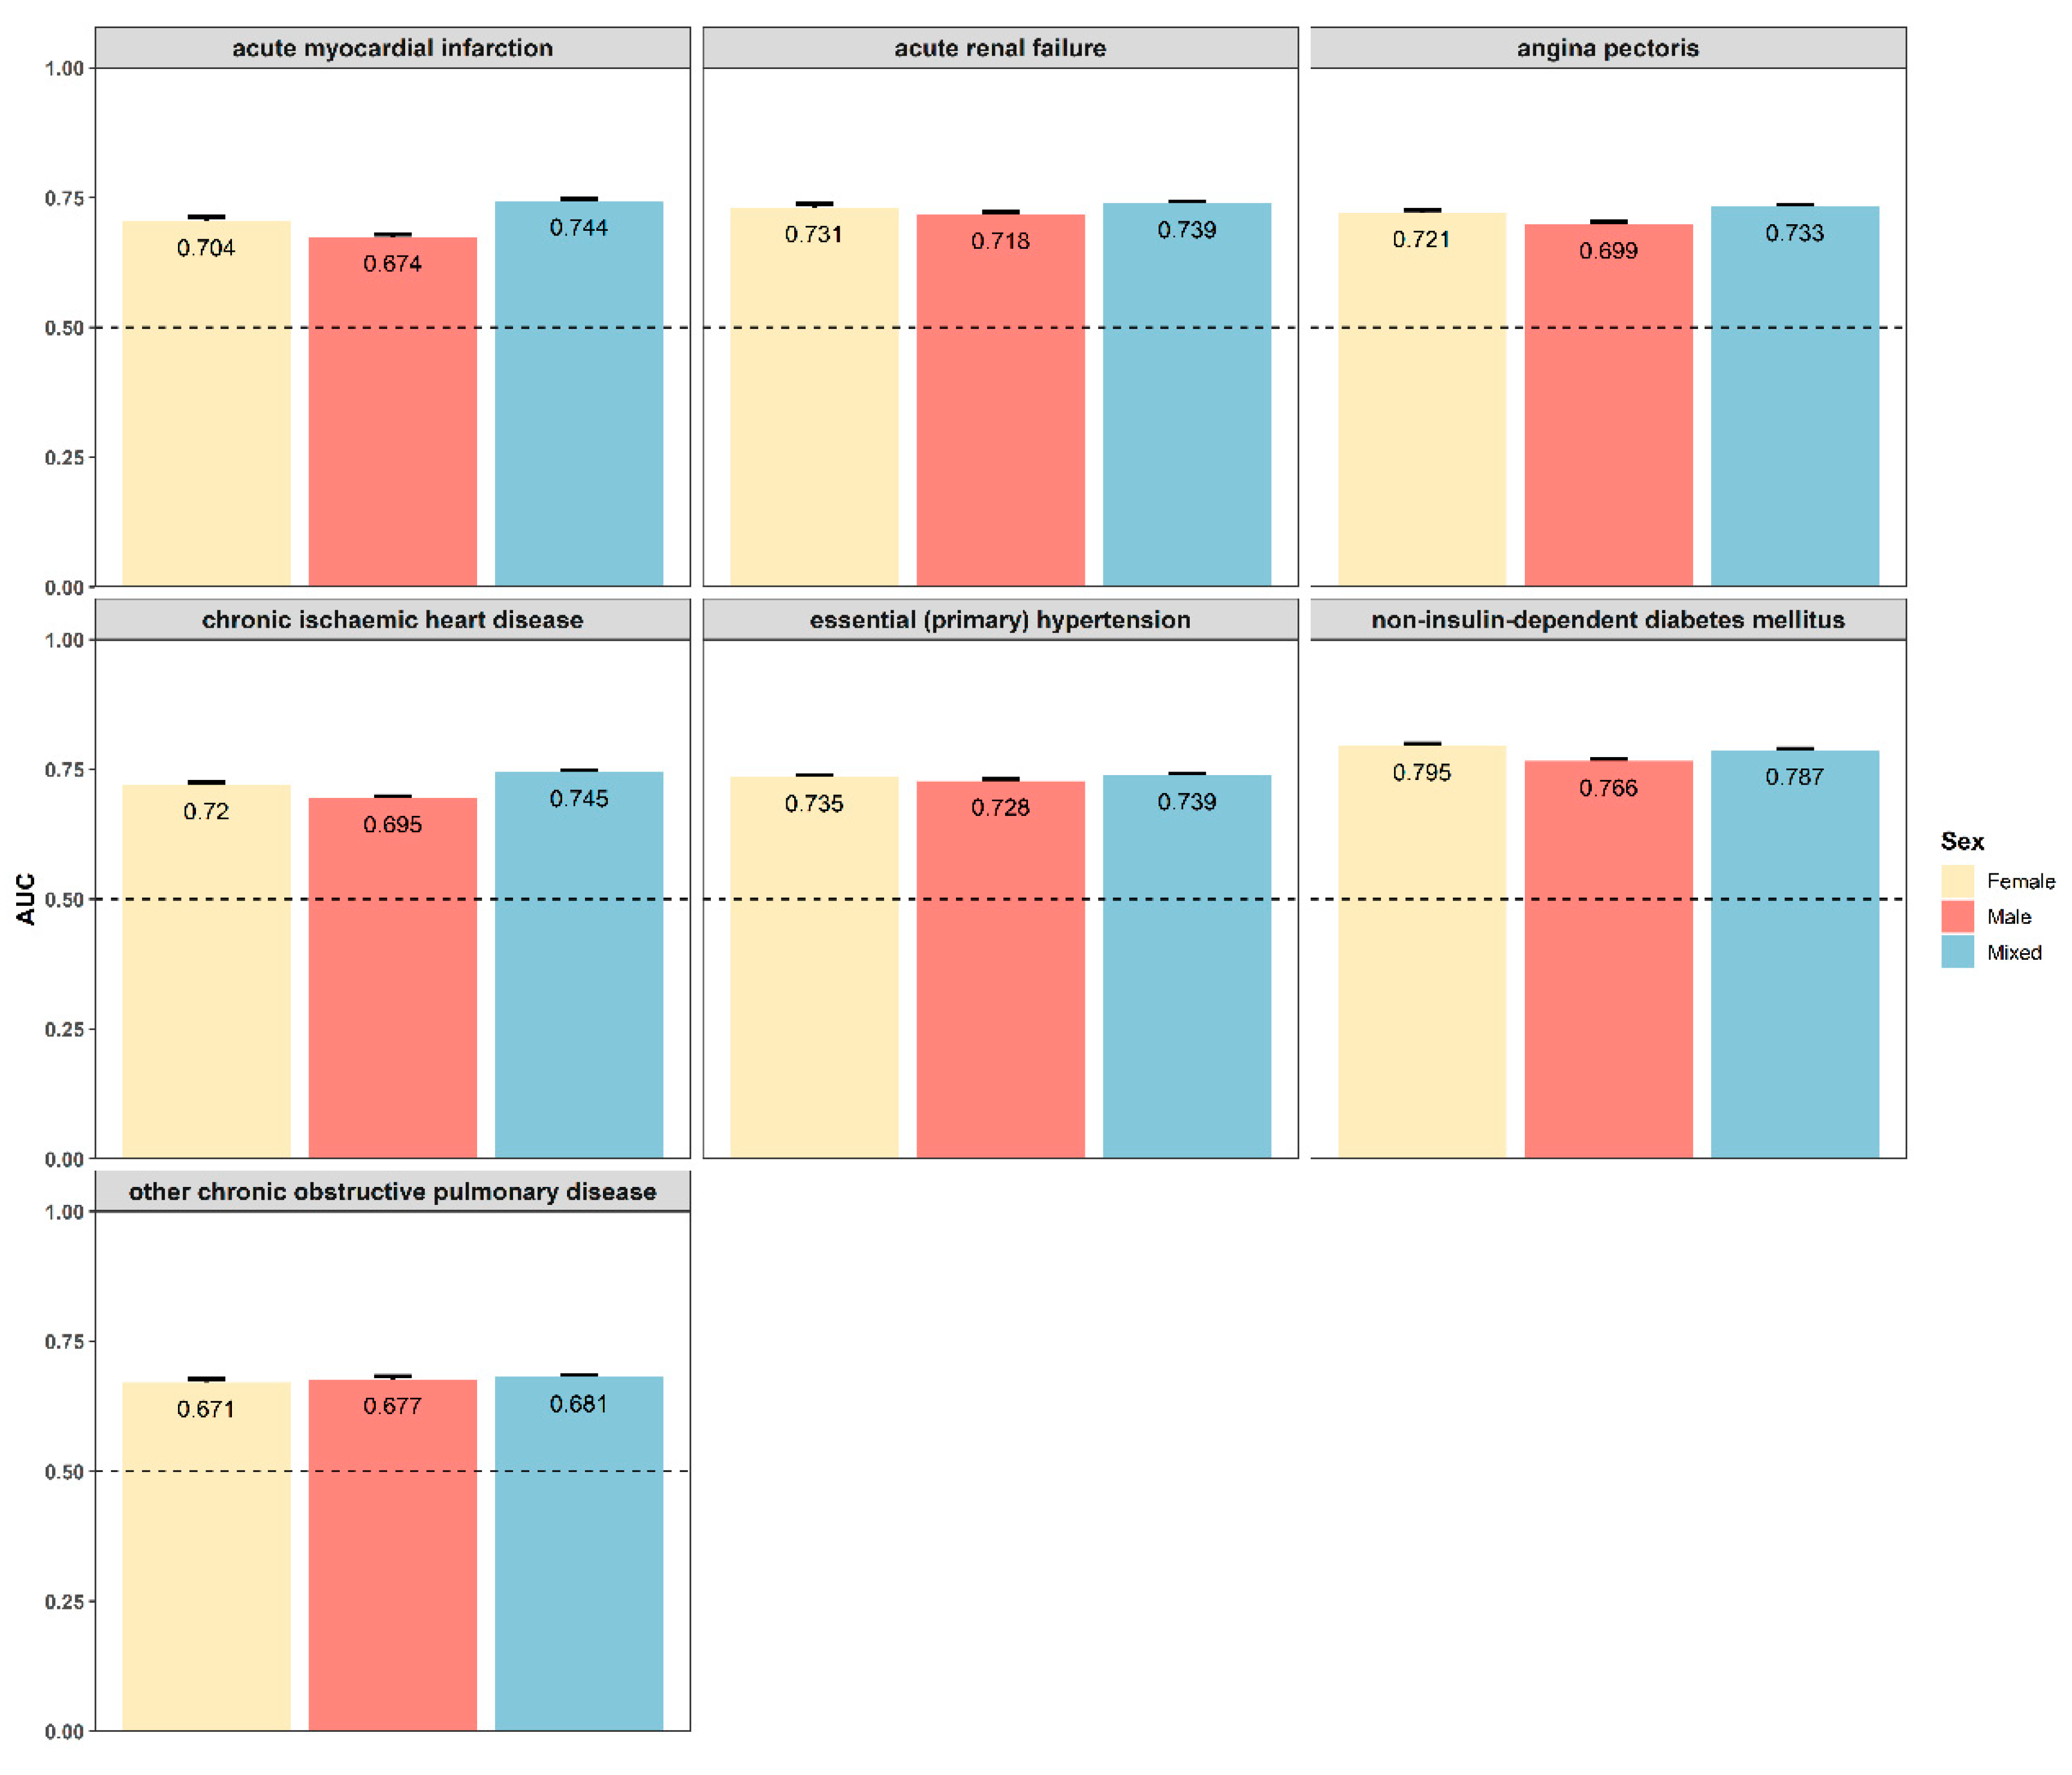
3.6. Sexual Dimorphism for Prediction Models
4. Discussion
5. Limitation
6. Conclusions
Supplementary Materials
Author Contributions
Funding
Institutional Review Board Statement
Informed Consent Statement
Data Availability Statement
Acknowledgments
Conflicts of Interest
References
- Bray, G.A.; Kim, K.K.; Wilding, J.P.H. Obesity: A chronic relapsing progressive disease process. A position statement of the World Obesity Federation. Obes. Rev. 2017, 18, 715–723. [Google Scholar] [CrossRef]
- Roberto, C.A.; Swinburn, B.; Hawkes, C.; Huang, T.T.; Costa, S.A.; Ashe, M.; Zwicker, L.; Cawley, J.H.; Brownell, K.D. Patchy progress on obesity prevention: Emerging examples, entrenched barriers, and new thinking. Lancet 2015, 385, 2400–2409. [Google Scholar] [CrossRef] [PubMed]
- Afshin, A.; Forouzanfar, M.H.; Reitsma, M.B.; Sur, P.; Estep, K.; Lee, A.; Marczak, L.; Mokdad, A.H.; Moradi-Lakeh, M.; Naghavi, M.; et al. Health Effects of Overweight and Obesity in 195 Countries over 25 Years. N. Engl. J. Med. 2017, 377, 13–27. [Google Scholar] [CrossRef] [PubMed]
- Finucane, M.M.; Stevens, G.A.; Cowan, M.J.; Danaei, G.; Lin, J.K.; Paciorek, C.J.; Singh, G.M.; Gutierrez, H.R.; Lu, Y.; Bahalim, A.N.; et al. National, regional, and global trends in body-mass index since 1980: Systematic analysis of health examination surveys and epidemiological studies with 960 country-years and 9·1 million participants. Lancet 2011, 377, 557–567. [Google Scholar] [CrossRef]
- Husain, M.J.; Datta, B.K.; Kostova, D.; Joseph, K.T.; Asma, S.; Richter, P.; Jaffe, M.G.; Kishore, S.P. Access to Cardiovascular Disease and Hypertension Medicines in Developing Countries: An Analysis of Essential Medicine Lists, Price, Availability, and Affordability. J. Am. Heart Assoc. 2020, 9, e015302. [Google Scholar] [CrossRef] [PubMed]
- Lobstein, T.; Baur, L.; Uauy, R. Obesity in children and young people: A crisis in public health. Obes. Rev. 2004, 5 (Suppl. S1), 4–104. [Google Scholar] [CrossRef]
- Dashti, H.S.; Miranda, N.; Cade, B.E.; Huang, T.; Redline, S.; Karlson, E.W.; Saxena, R. Interaction of obesity polygenic score with lifestyle risk factors in an electronic health record biobank. BMC Med. 2022, 20, 5. [Google Scholar] [CrossRef]
- Flegal, K.M.; Kit, B.K.; Orpana, H.; Graubard, B.I. Association of all-cause mortality with overweight and obesity using standard body mass index categories: A systematic review and meta-analysis. Jama 2013, 309, 71–82. [Google Scholar] [CrossRef]
- Zimmet, P.Z.; Alberti, K.G. Introduction: Globalization and the non-communicable disease epidemic. Obesity 2006, 14, 1–3. [Google Scholar] [CrossRef]
- Salmón-Gómez, L.; Catalán, V.; Frühbeck, G.; Gómez-Ambrosi, J. Relevance of body composition in phenotyping the obesities. Rev. Endocr. Metab. Disord. 2023, 24, 809–823. [Google Scholar] [CrossRef]
- Ebrahimzadeh Attari, V.; Nourmohammadi, M.; Asghari-Jafarabadi, M.; Mahluji, S.; Malek Mahdavi, A.; Esmaeili, P. Prediction the changes of anthropometric indices following a weight-loss diet in overweight and obese women by mathematical models. Sci. Rep. 2024, 14, 14491. [Google Scholar] [CrossRef] [PubMed]
- Wells, J.C. Sexual dimorphism of body composition. Best. Pract. Res. Clin. Endocrinol. Metab. 2007, 21, 415–430. [Google Scholar] [CrossRef] [PubMed]
- Pawłowski, B.; Dunbar, R.I. Waist-to-hip ratio versus body mass index as predictors of fitness in women. Hum. Nat. 2005, 16, 164–177. [Google Scholar] [CrossRef] [PubMed]
- Karastergiou, K.; Smith, S.R.; Greenberg, A.S.; Fried, S.K. Sex differences in human adipose tissues—The biology of pear shape. Biol. Sex. Differ. 2012, 3, 13. [Google Scholar] [CrossRef]
- Heid, I.M.; Jackson, A.U.; Randall, J.C.; Winkler, T.W.; Qi, L.; Steinthorsdottir, V.; Thorleifsson, G.; Zillikens, M.C.; Speliotes, E.K.; Mägi, R.; et al. Meta-analysis identifies 13 new loci associated with waist-hip ratio and reveals sexual dimorphism in the genetic basis of fat distribution. Nat. Genet. 2010, 42, 949–960. [Google Scholar] [CrossRef]
- Pulit, S.L.; Stoneman, C.; Morris, A.P.; Wood, A.R.; Glastonbury, C.A.; Tyrrell, J.; Yengo, L.; Ferreira, T.; Marouli, E.; Ji, Y.; et al. Meta-analysis of genome-wide association studies for body fat distribution in 694 649 individuals of European ancestry. Hum. Mol. Genet. 2019, 28, 166–174. [Google Scholar] [CrossRef]
- Randall, J.C.; Winkler, T.W.; Kutalik, Z.; Berndt, S.I.; Jackson, A.U.; Monda, K.L.; Kilpeläinen, T.O.; Esko, T.; Mägi, R.; Li, S.; et al. Sex-stratified genome-wide association studies including 270,000 individuals show sexual dimorphism in genetic loci for anthropometric traits. PLoS Genet. 2013, 9, e1003500. [Google Scholar] [CrossRef]
- Shungin, D.; Winkler, T.W.; Croteau-Chonka, D.C.; Ferreira, T.; Locke, A.E.; Mägi, R.; Strawbridge, R.J.; Pers, T.H.; Fischer, K.; Justice, A.E.; et al. New genetic loci link adipose and insulin biology to body fat distribution. Nature 2015, 518, 187–196. [Google Scholar] [CrossRef]
- Pedersen, S.B.; Kristensen, K.; Hermann, P.A.; Katzenellenbogen, J.A.; Richelsen, B. Estrogen controls lipolysis by up-regulating alpha2A-adrenergic receptors directly in human adipose tissue through the estrogen receptor α. Implications for the female fat distribution. J. Clin. Endocrinol. Metab. 2004, 89, 1869–1878. [Google Scholar] [CrossRef]
- Censin, J.C.; Peters, S.A.E.; Bovijn, J.; Ferreira, T.; Pulit, S.L.; Mägi, R.; Mahajan, A.; Holmes, M.V.; Lindgren, C.M. Causal relationships between obesity and the leading causes of death in women and men. PLoS Genet. 2019, 15, e1008405. [Google Scholar] [CrossRef]
- Marees, A.T.; de Kluiver, H.; Stringer, S.; Vorspan, F.; Curis, E.; Marie-Claire, C.; Derks, E.M. A tutorial on conducting genome-wide association studies: Quality control and statistical analysis. Int. J. Methods Psychiatr. Res. 2018, 27, e1608. [Google Scholar] [CrossRef] [PubMed]
- Sudlow, C.; Gallacher, J.; Allen, N.; Beral, V.; Burton, P.; Danesh, J.; Downey, P.; Elliott, P.; Green, J.; Landray, M.; et al. UK biobank: An open access resource for identifying the causes of a wide range of complex diseases of middle and old age. PLoS Med. 2015, 12, e1001779. [Google Scholar] [CrossRef] [PubMed]
- Katzmarzyk, P.T.; Lee, I.M.; Martin, C.K.; Blair, S.N. Epidemiology of Physical Activity and Exercise Training in the United States. Prog. Cardiovasc. Dis. 2017, 60, 3–10. [Google Scholar] [CrossRef]
- Yang, S.; Zhou, X. Accurate and Scalable Construction of Polygenic Scores in Large Biobank Data Sets. Am. J. Hum. Genet. 2020, 106, 679–693. [Google Scholar] [CrossRef]
- Yang, S.; Zhou, X. PGS-server: Accuracy, robustness and transferability of polygenic score methods for biobank scale studies. Brief. Bioinform. 2022, 23. [Google Scholar] [CrossRef]
- Ye, X.; Wang, Y.; Zou, Y.; Tu, J.; Tang, W.; Yu, R.; Yang, S.; Huang, P. Associations of socioeconomic status with infectious diseases mediated by lifestyle, environmental pollution and chronic comorbidities: A comprehensive evaluation based on UK Biobank. Infect. Dis. Poverty 2023, 12, 5. [Google Scholar] [CrossRef] [PubMed]
- Gusev, A.; Ko, A.; Shi, H.; Bhatia, G.; Chung, W.; Penninx, B.W.; Jansen, R.; de Geus, E.J.; Boomsma, D.I.; Wright, F.A.; et al. Integrative approaches for large-scale transcriptome-wide association studies. Nat. Genet. 2016, 48, 245–252. [Google Scholar] [CrossRef]
- Wainberg, M.; Sinnott-Armstrong, N.; Mancuso, N.; Barbeira, A.N.; Knowles, D.A.; Golan, D.; Ermel, R.; Ruusalepp, A.; Quertermous, T.; Hao, K.; et al. Opportunities and challenges for transcriptome-wide association studies. Nat. Genet. 2019, 51, 592–599. [Google Scholar] [CrossRef]
- Beaglehole, R.; Ebrahim, S.; Reddy, S.; Voûte, J.; Leeder, S. Prevention of chronic diseases: A call to action. Lancet 2007, 370, 2152–2157. [Google Scholar] [CrossRef]
- Bulik-Sullivan, B.K.; Loh, P.R.; Finucane, H.K.; Ripke, S.; Yang, J.; Patterson, N.; Daly, M.J.; Price, A.L.; Neale, B.M. LD Score regression distinguishes confounding from polygenicity in genome-wide association studies. Nat. Genet. 2015, 47, 291–295. [Google Scholar] [CrossRef]
- Auton, A.; Brooks, L.D.; Durbin, R.M.; Garrison, E.P.; Kang, H.M.; Korbel, J.O.; Marchini, J.L.; McCarthy, S.; McVean, G.A.; Abecasis, G.R. A global reference for human genetic variation. Nature 2015, 526, 68–74. [Google Scholar] [CrossRef] [PubMed]
- Werme, J.; van der Sluis, S.; Posthuma, D.; de Leeuw, C.A. An integrated framework for local genetic correlation analysis. Nat. Genet. 2022, 54, 274–282. [Google Scholar] [CrossRef]
- Bulik-Sullivan, B.; Finucane, H.K.; Anttila, V.; Gusev, A.; Day, F.R.; Loh, P.R.; Duncan, L.; Perry, J.R.; Patterson, N.; Robinson, E.B.; et al. An atlas of genetic correlations across human diseases and traits. Nat. Genet. 2015, 47, 1236–1241. [Google Scholar] [CrossRef] [PubMed]
- Gerring, Z.F.; Thorp, J.G.; Gamazon, E.R.; Derks, E.M. A Local Genetic Correlation Analysis Provides Biological Insights Into the Shared Genetic Architecture of Psychiatric and Substance Use Phenotypes. Biol. Psychiatry 2022, 92, 583–591. [Google Scholar] [CrossRef] [PubMed]
- Privé, F.; Vilhjálmsson, B.J.; Aschard, H.; Blum, M.G.B. Making the Most of Clumping and Thresholding for Polygenic Scores. Am. J. Hum. Genet. 2019, 105, 1213–1221. [Google Scholar] [CrossRef]
- Cao, C.; Zhang, S.; Wang, J.; Tian, M.; Ji, X.; Huang, D.; Yang, S.; Gu, N. PGS-Depot: A comprehensive resource for polygenic scores constructed by summary statistics based methods. Nucleic Acids Res. 2024, 52, D963–D971. [Google Scholar] [CrossRef]
- Privé, F.; Aschard, H.; Ziyatdinov, A.; Blum, M.G.B. Efficient analysis of large-scale genome-wide data with two R packages: Bigstatsr and bigsnpr. Bioinformatics 2018, 34, 2781–2787. [Google Scholar] [CrossRef]
- Zuo, F.; Wang, Y.; Xu, X.; Ding, R.; Tang, W.; Sun, Y.; Wang, X.; Zhang, Y.; Wu, J.; Xie, Y.; et al. CCDC92 deficiency ameliorates podocyte lipotoxicity in diabetic kidney disease. Metab. Clin. Exp. 2024, 150, 155724. [Google Scholar] [CrossRef]
- Tucker, E.J.; Wanschers, B.F.; Szklarczyk, R.; Mountford, H.S.; Wijeyeratne, X.W.; van den Brand, M.A.; Leenders, A.M.; Rodenburg, R.J.; Reljić, B.; Compton, A.G.; et al. Mutations in the UQCC1-interacting protein, UQCC2, cause human complex III deficiency associated with perturbed cytochrome b protein expression. PLoS Genet. 2013, 9, e1004034. [Google Scholar] [CrossRef]
- Winkler, T.W.; Justice, A.E.; Graff, M.; Barata, L.; Feitosa, M.F.; Chu, S.; Czajkowski, J.; Esko, T.; Fall, T.; Kilpeläinen, T.O.; et al. The Influence of Age and Sex on Genetic Associations with Adult Body Size and Shape: A Large-Scale Genome-Wide Interaction Study. PLoS Genet. 2015, 11, e1005378. [Google Scholar] [CrossRef] [PubMed]
- Rask-Andersen, M.; Karlsson, T.; Ek, W.E.; Johansson, Å. Genome-wide association study of body fat distribution identifies adiposity loci and sex-specific genetic effects. Nat. Commun. 2019, 10, 339. [Google Scholar] [CrossRef] [PubMed]
- Yoon, K.H.; Lee, J.H.; Kim, J.W.; Cho, J.H.; Choi, Y.H.; Ko, S.H.; Zimmet, P.; Son, H.Y. Epidemic obesity and type 2 diabetes in Asia. Lancet (Lond. Engl.) 2006, 368, 1681–1688. [Google Scholar] [CrossRef]
- Lotta, L.A.; Wittemans, L.B.L.; Zuber, V.; Stewart, I.D.; Sharp, S.J.; Luan, J.; Day, F.R.; Li, C.; Bowker, N.; Cai, L.; et al. Association of Genetic Variants Related to Gluteofemoral vs Abdominal Fat Distribution With Type 2 Diabetes, Coronary Disease, and Cardiovascular Risk Factors. Jama 2018, 320, 2553–2563. [Google Scholar] [CrossRef]
- Emdin, C.A.; Khera, A.V.; Natarajan, P.; Klarin, D.; Zekavat, S.M.; Hsiao, A.J.; Kathiresan, S. Genetic Association of Waist-to-Hip Ratio With Cardiometabolic Traits, Type 2 Diabetes, and Coronary Heart Disease. Jama 2017, 317, 626–634. [Google Scholar] [CrossRef] [PubMed]
- Karpe, F.; Pinnick, K.E. Biology of upper-body and lower-body adipose tissue--link to whole-body phenotypes. Nat. reviews. Endocrinol. 2015, 11, 90–100. [Google Scholar] [CrossRef]
- Tramunt, B.; Smati, S.; Grandgeorge, N.; Lenfant, F.; Arnal, J.F.; Montagner, A.; Gourdy, P. Sex differences in metabolic regulation and diabetes susceptibility. Diabetologia 2020, 63, 453–461. [Google Scholar] [CrossRef]
- Mauvais-Jarvis, F. Sex differences in metabolic homeostasis, diabetes, and obesity. Biol. Sex. Differ. 2015, 6, 14. [Google Scholar] [CrossRef]
- Yusuf, S.; Hawken, S.; Ounpuu, S.; Bautista, L.; Franzosi, M.G.; Commerford, P.; Lang, C.C.; Rumboldt, Z.; Onen, C.L.; Lisheng, L.; et al. Obesity and the risk of myocardial infarction in 27,000 participants from 52 countries: A case-control study. Lancet (Lond. Engl.) 2005, 366, 1640–1649. [Google Scholar] [CrossRef]
- Klarin, D.; Lynch, J.; Aragam, K.; Chaffin, M.; Assimes, T.L.; Huang, J.; Lee, K.M.; Shao, Q.; Huffman, J.E.; Natarajan, P.; et al. Genome-wide association study of peripheral artery disease in the Million Veteran Program. Nat. Med. 2019, 25, 1274–1279. [Google Scholar] [CrossRef]
- Ngo, D.T.; Farb, M.G.; Kikuchi, R.; Karki, S.; Tiwari, S.; Bigornia, S.J.; Bates, D.O.; LaValley, M.P.; Hamburg, N.M.; Vita, J.A.; et al. Antiangiogenic actions of vascular endothelial growth factor-A165b, an inhibitory isoform of vascular endothelial growth factor-A, in human obesity. Circulation 2014, 130, 1072–1080. [Google Scholar] [CrossRef]
- Kikuchi, R.; Nakamura, K.; MacLauchlan, S.; Ngo, D.T.; Shimizu, I.; Fuster, J.J.; Katanasaka, Y.; Yoshida, S.; Qiu, Y.; Yamaguchi, T.P.; et al. An antiangiogenic isoform of VEGF-A contributes to impaired vascularization in peripheral artery disease. Nat. Med. 2014, 20, 1464–1471. [Google Scholar] [CrossRef]
- He, J.; Quintana, M.T.; Sullivan, J.; Parry, T.L.; Grevengoed, J.T.; Schisler, J.C.; Hill, J.A.; Yates, C.C.; Mapanga, R.F.; Essop, M.F.; et al. MuRF2 regulates PPARγ1 activity to protect against diabetic cardiomyopathy and enhance weight gain induced by a high fat diet. Cardiovasc. Diabetol. 2015, 14, 97. [Google Scholar] [CrossRef] [PubMed]
- Ntambi, J.M.; Liu, X.; Burhans, M.S.; ALjohani, A.; Selen, E.S.; Kalyesubula, M.; Assadi-Porter, F. Hepatic oleate regulates one-carbon metabolism during high carbohydrate feeding. Biochem. Biophys. Res. Commun. 2023, 651, 62–69. [Google Scholar] [CrossRef]
- Breyer, M.K.; Spruit, M.A.; Hanson, C.K.; Franssen, F.M.; Vanfleteren, L.E.; Groenen, M.T.; Bruijnzeel, P.L.; Wouters, E.F.; Rutten, E.P. Prevalence of metabolic syndrome in COPD patients and its consequences. PLoS ONE 2014, 9, e98013. [Google Scholar] [CrossRef] [PubMed]
- Chen, Z.; Salam, M.T.; Alderete, T.L.; Habre, R.; Bastain, T.M.; Berhane, K.; Gilliland, F.D. Effects of Childhood Asthma on the Development of Obesity among School-aged Children. Am. J. Respir. Crit. Care Med. 2017, 195, 1181–1188. [Google Scholar] [CrossRef] [PubMed]
- Camp, P.G.; Coxson, H.O.; Levy, R.D.; Pillai, S.G.; Anderson, W.; Vestbo, J.; Kennedy, S.M.; Silverman, E.K.; Lomas, D.A.; Paré, P.D. Sex differences in emphysema and airway disease in smokers. Chest 2009, 136, 1480–1488. [Google Scholar] [CrossRef] [PubMed]
- Santos, F.M.D.; Viana, K.P.; Saturnino, L.T.; Lazaridis, E.; Gazzotti, M.R.; Stelmach, R.; Soares, C. Trend of self-reported asthma prevalence in Brazil from 2003 to 2013 in adults and factors associated with prevalence. J. Bras. Pneumol. Publicacao Soc. Bras. Pneumol. E Tisilogia 2018, 44, 491–497. [Google Scholar] [CrossRef]
- Sideleva, O.; Suratt, B.T.; Black, K.E.; Tharp, W.G.; Pratley, R.E.; Forgione, P.; Dienz, O.; Irvin, C.G.; Dixon, A.E. Obesity and asthma: An inflammatory disease of adipose tissue not the airway. Am. J. Respir. Crit. Care Med. 2012, 186, 598–605. [Google Scholar] [CrossRef]
- Reyes, C.; Leyland, K.M.; Peat, G.; Cooper, C.; Arden, N.K.; Prieto-Alhambra, D. Association Between Overweight and Obesity and Risk of Clinically Diagnosed Knee, Hip, and Hand Osteoarthritis: A Population-Based Cohort Study. Arthritis Rheumatol. 2016, 68, 1869–1875. [Google Scholar] [CrossRef]
- Collins, J.E.; Deshpande, B.R.; Katz, J.N.; Losina, E. Race- and Sex-Specific Incidence Rates and Predictors of Total Knee Arthroplasty: Seven-Year Data From the Osteoarthritis Initiative. Arthritis Care Res. 2016, 68, 965–973. [Google Scholar] [CrossRef] [PubMed]
- Lou, L.; Ye, X.; Xu, P.; Wang, J.; Xu, Y.; Jin, K.; Ye, J. Association of Sex With the Global Burden of Cataract. JAMA Ophthalmol. 2018, 136, 116–121. [Google Scholar] [CrossRef] [PubMed]
- Zetterberg, M.; Celojevic, D. Gender and cataract--the role of estrogen. Curr. Eye Res. 2015, 40, 176–190. [Google Scholar] [CrossRef] [PubMed]
- Nilsson, M.; Johnsen, R.; Ye, W.; Hveem, K.; Lagergren, J. Obesity and estrogen as risk factors for gastroesophageal reflux symptoms. Jama 2003, 290, 66–72. [Google Scholar] [CrossRef] [PubMed]
- Kubo, A.; Cook, M.B.; Shaheen, N.J.; Vaughan, T.L.; Whiteman, D.C.; Murray, L.; Corley, D.A. Sex-specific associations between body mass index, waist circumference and the risk of Barrett’s oesophagus: A pooled analysis from the international BEACON consortium. Gut 2013, 62, 1684–1691. [Google Scholar] [CrossRef]
- Alansari Sr, A.H.; Almalawi, A.M.; Alghamdi, A.; Alghamdi, M.S.; Hazazi, H.A.; Aljabri, A.A.; Alsulami, R.A.; Alkhoshi, A.M.; Khinaifis, F. Body Mass Index Within Multifactor Predictors of Ventral Hernia Recurrence: A Retrospective Cohort Study. Cureus 2023, 15, e41148. [Google Scholar] [CrossRef]
- Yoo, S.; Sung, M.W.; Kim, H. CT-defined visceral adipose tissue thresholds for identifying metabolic complications: A cross-sectional study in the United Arab Emirates. BMJ Open 2020, 10, e031181. [Google Scholar] [CrossRef]
- Fox, C.S.; Massaro, J.M.; Hoffmann, U.; Pou, K.M.; Maurovich-Horvat, P.; Liu, C.Y.; Vasan, R.S.; Murabito, J.M.; Meigs, J.B.; Cupples, L.A.; et al. Abdominal visceral and subcutaneous adipose tissue compartments: Association with metabolic risk factors in the Framingham Heart Study. Circulation 2007, 116, 39–48. [Google Scholar] [CrossRef]
- Furman, D.; Campisi, J.; Verdin, E.; Carrera-Bastos, P.; Targ, S.; Franceschi, C.; Ferrucci, L.; Gilroy, D.W.; Fasano, A.; Miller, G.W.; et al. Chronic inflammation in the etiology of disease across the life span. Nat. Med. 2019, 25, 1822–1832. [Google Scholar] [CrossRef]
- Ouchi, N.; Parker, J.L.; Lugus, J.J.; Walsh, K. Adipokines in inflammation and metabolic disease. Nat. Rev. Immunol. 2011, 11, 85–97. [Google Scholar] [CrossRef]
- Lonardo, A.; Nascimbeni, F.; Ballestri, S.; Fairweather, D.; Win, S.; Than, T.A.; Abdelmalek, M.F.; Suzuki, A. Sex Differences in Nonalcoholic Fatty Liver Disease: State of the Art and Identification of Research Gaps. Hepatology 2019, 70, 1457–1469. [Google Scholar] [CrossRef] [PubMed]
- Klop, B.; Elte, J.W.; Cabezas, M.C. Dyslipidemia in obesity: Mechanisms and potential targets. Nutrients 2013, 5, 1218–1240. [Google Scholar] [CrossRef] [PubMed]
- Liu, Y.; Fan, Y.; Liu, Q.; Liu, K.; Chen, F.; Tang, X.; Li, G.; Hu, D.; Song, G. Sex-specific association of serum uric acid dynamics with the incidence of metabolic syndrome in a health check-up Chinese population: A prospective cohort study. BMJ Open 2020, 10, e035289. [Google Scholar] [CrossRef] [PubMed]
- Torkamani, A.; Wineinger, N.E.; Topol, E.J. The personal and clinical utility of polygenic risk scores. Nat. Rev. Genet. 2018, 19, 581–590. [Google Scholar] [CrossRef]
- Lewis, A.C.F.; Green, R.C.; Vassy, J.L. Polygenic risk scores in the clinic: Translating risk into action. HGG Adv. 2021, 2, 100047. [Google Scholar] [CrossRef]
- Chatterjee, N.; Shi, J.; García-Closas, M. Developing and evaluating polygenic risk prediction models for stratified disease prevention. Nat. Rev. Genet. 2016, 17, 392–406. [Google Scholar] [CrossRef]

| Description | Female | Male | ||
|---|---|---|---|---|
| rg (95%CI) | FDR_P | rg (95%CI) | FDR_P | |
| mononeuropathies of upper limb | 0.234 (0.139, 0.328) | 3.63 × 10⁻⁴ | 0.269 (0.083, 0.455) | 1 |
| cholelithiasis | 0.367 (0.237, 0.497) | 7.95 × 10⁻⁶ | 0.382 (0.157, 0.608) | 0.227 |
| other disorders of urinary system | 0.316 (0.199, 0.433) | 2.97 × 10⁻⁵ | 0.039 (−0.262, 0.34) | 1 |
| body fat percentage | 0.457 (0.374, 0.54) | 1.34 × 10⁻²⁴ | 0.74 (0.675, 0.804) | 1.81 × 10−108 |
| whole body fat mass | 0.439 (0.358, 0.52) | 9.05 × 10⁻²⁴ | 0.723 (0.654, 0.792) | 1.85 × 10−91 |
| leg fat percentage (right) | 0.504 (0.43, 0.577) | 5.35 × 10−39 | 0.728 (0.663, 0.794) | 2.01 × 10−102 |
| leg fat mass (right) | 0.463 (0.385, 0.541) | 5.01 × 10⁻²⁹ | 0.732 (0.663, 0.8) | 1.27 × 10−94 |
| leg fat percentage (left) | 0.5 (0.427, 0.574) | 5.63 × 10−38 | 0.726 (0.661, 0.791) | 1.02 × 10−103 |
| leg fat mass (left) | 0.463 (0.385, 0.541) | 9.48 × 10⁻²⁹ | 0.723 (0.654, 0.792) | 4.53 × 10−92 |
| arm fat percentage (right) | 0.448 (0.367, 0.529) | 7.28 × 10⁻²⁵ | 0.735 (0.666, 0.803) | 8.20 × 10−96 |
| arm fat mass (right) | 0.444 (0.364, 0.523) | 4.21 × 10⁻²⁵ | 0.709 (0.637, 0.781) | 4.17 × 10−80 |
| arm fat percentage (left) | 0.453 (0.372, 0.534) | 1.15 × 10⁻²⁵ | 0.73 (0.661, 0.798) | 5.87 × 10−94 |
| arm fat mass (left) | 0.443 (0.363, 0.524) | 1.53 × 10⁻²⁴ | 0.71 (0.637, 0.783) | 3.65 × 10−78 |
| trunk fat percentage | 0.412 (0.325, 0.498) | 3.34 × 10⁻¹⁸ | 0.735 (0.67, 0.8) | 3.45 × 10−105 |
| trunk fat mass | 0.409 (0.326, 0.493) | 2.43 × 10⁻¹⁹ | 0.717 (0.648, 0.785) | 9.80 × 10−91 |
| trunk fat-free mass | 0.25 (0.18, 0.32) | 7.22 × 10⁻¹⁰ | 0.15 (0.068, 0.232) | 0.076 |
| trunk predicted mass | 0.25 (0.18, 0.32) | 5.74 × 10⁻¹⁰ | 0.15 (0.068, 0.232) | 0.076 |
| red blood cell (erythrocyte) count | 0.18 (0.123, 0.236) | 1.23 × 10⁻⁷ | 0.086 (0.001, 0.171) | 1 |
| haemoglobin concentration | 0.202 (0.131, 0.274) | 6.88 × 10⁻⁶ | 0.07 (−0.014, 0.155) | 1 |
| haematocrit percentage | 0.174 (0.105, 0.242) | 1.49 × 10⁻⁴ | 0.069 (−0.019, 0.156) | 1 |
| monocyte count | 0.085 (0.004, 0.167) | 1 | 0.278 (0.191, 0.366) | 1.17 × 10⁻⁷ |
| apolipoprotein B | 0.278 (0.141, 0.414) | 0.017 | 0.098 (−0.036, 0.232) | 1 |
| Variable | All (N = 258,637) | Female (N = 139,063) | Male (N = 119,574) | p |
|---|---|---|---|---|
| age | 56.64 ± 8.01 | 56.44 ± 7.91 | 56.88 ± 8.13 | <0.001 |
| WHR | 0.87 ± 0.09 | 0.82 ± 0.07 | 0.93 ± 0.07 | <0.001 |
| BMI | 27.34 ± 4.78 | 26.95 ± 5.16 | 27.80 ± 4.22 | <0.001 |
| sleep | 7.17 ± 1.08 | 7.19 ± 1.09 | 7.14 ± 1.07 | <0.001 |
| TDI | −1.47 ± 3.00 | −1.50 ± 2.95 | −1.44 ± 3.06 | <0.001 |
| smoking | <0.001 | |||
| never | 139,819 (54.1%) | 81,397 (58.8%) | 58,154 (48.6%) | |
| past | 91,773 (35.5%) | 45,050 (32.4%) | 46,792 (39.1%) | |
| current | 26,781 (10.4%) | 12,246 (8.8%) | 14,628 (12.2%) | |
| drinking | <0.001 | |||
| never | 8074 (3.1%) | 5962 (4.3%) | 2067 (1.7%) | |
| past | 8943 (3.5%) | 4989 (3.6%) | 3959 (3.3%) | |
| current | 241,356 (93.4%) | 127,742 (92.1%) | 113,548 (95.0%) | |
| activity | 109.29 ± 101.81 | 105.71 ± 92.82 | 113.45 ± 111.44 | <0.001 |
| Description | Female | Male | ||
|---|---|---|---|---|
| β (95%CI) | p | β (95%CI) | p | |
| malignant neoplasm of colon | 0.246 (−0.611, 1.103) | 0.573 | 1.762 (0.846, 2.679) | 1.63 × 10⁻⁴ |
| non-insulin-dependent diabetes mellitus | 8.98 (8.628, 9.332) | <1.00 × 10−400 | 6.156 (5.79, 6.521) | 2.82 × 10−239 |
| mononeuropathies of upper limb | 1.111 (0.766, 1.456) | 2.79 × 10⁻¹⁰ | 0.604 (0.047, 1.161) | 0.034 |
| senile cataract | 0.54 (0.214, 0.865) | 0.001 | 1.405 (0.952, 1.857) | 1.18 × 10⁻⁹ |
| other cataract | 0.363 (0.087, 0.638) | 0.010 | 1.011 (0.638, 1.385) | 1.13 × 10⁻⁷ |
| acute myocardial infarction | 3.475 (2.934, 4.016) | 2.71 × 10−36 | 2.32 (1.919, 2.722) | 1.00 × 10⁻²⁹ |
| chronic ischemic heart disease | 3.294 (2.95, 3.637) | 1.08 × 10−78 | 2.454 (2.148, 2.759) | 6.99 × 10−56 |
| other peripheral vascular diseases | 0.173 (−0.375, 0.722) | 0.535 | 2.929 (2.325, 3.532) | 1.86 × 10⁻²¹ |
| arterial embolism and thrombosis | 2.821 (1.277, 4.365) | 3.42 × 10⁻⁴ | 4.817 (3.662, 5.972) | 2.97 × 10⁻¹⁶ |
| haemorrhoids | 1.15 (0.789, 1.512) | 4.52 × 10⁻¹⁰ | 0.453 (0.008, 0.898) | 0.046 |
| nasal polyp | 1.107 (0.274, 1.939) | 0.009 | 2.343 (1.599, 3.086) | 6.53 × 10⁻¹⁰ |
| other chronic obstructive pulmonary disease | 3.65 (3.244, 4.057) | 2.59 × 10−69 | 5.301 (4.844, 5.758) | 1.81 × 10−114 |
| asthma | 2.05 (1.815, 2.285) | 1.51 × 10−65 | 3.079 (2.755, 3.402) | 1.16 × 10−77 |
| umbilical hernia | 1.329 (0.51, 2.147) | 0.001 | 7.146 (6.528, 7.764) | 1.05 × 10−113 |
| ventral hernia | 1.584 (0.894, 2.273) | 6.72 × 10⁻⁶ | 4.095 (3.33, 4.86) | 9.04 × 10⁻²⁶ |
| diverticular disease of intestine | 2.061 (1.818, 2.304) | 3.79 × 10−62 | 2.74 (2.431, 3.049) | 1.17 × 10−67 |
| other diseases of intestine | 1.678 (1.343, 2.014) | 9.64 × 10⁻²³ | 2.419 (2.042, 2.795) | 2.28 × 10−36 |
| polyarthrosis | 0.968 (0.546, 1.391) | 7.11 × 10⁻⁶ | 0.966 (0.266, 1.666) | 0.007 |
| coxarthrosis [arthrosis of hip] | 0.65 (0.307, 0.993) | 2.03 × 10⁻⁴ | −1.449 (−1.941, −0.957) | 7.76 × 10⁻⁹ |
| other arthrosis | 0.547 (0.33, 0.764) | 8.00 × 10⁻⁷ | 0.124 (−0.189, 0.437) | 0.437 |
| acquired deformities of fingers and toes | −0.778 (−1.127, −0.429) | 1.27 × 10⁻⁵ | −0.454 (−1.292, 0.385) | 0.289 |
| internal derangement of knee | −0.021 (−0.458, 0.415) | 0.924 | −1.531 (−2.008, −1.054) | 3.19 × 10⁻¹⁰ |
| other joint disorders, not elsewhere classified | 0.502 (0.285, 0.719) | 5.75 × 10⁻⁶ | 0.295 (0.001, 0.588) | 0.049 |
| spondylosis | 0.675 (0.361, 0.989) | 2.52 × 10⁻⁵ | 0.601 (0.158, 1.045) | 0.008 |
| other disorders of bladder | 0.911 (0.436, 1.385) | 1.69 × 10⁻⁴ | 0.335 (−0.133, 0.804) | 0.161 |
| body fat percentage | 7.149 (6.838, 7.459) | <1.00 × 10−400 | 17.066 (16.703, 17.43) | <1.00 × 10−400 |
| whole body fat mass | 2.15 (1.847, 2.452) | 5.16 × 10−44 | 11.007 (10.646, 11.367) | <1.00 × 10−400 |
| whole body fat-free mass | −2.031 (−2.336, −1.726) | 6.72 × 10−39 | −9.63 (−10.269, −8.992) | 1.80 × 10−191 |
| whole body water mass | −1.53 (−1.753, −1.308) | 2.65 × 10−41 | −7.281 (−7.751, −6.811) | 1.73 × 10−201 |
| basal metabolic rate | −200.554 (−235.152, −165.956) | 6.70 × 10⁻³⁰ | −1035.291 (−1113.559, −957.023) | 8.86 × 10−148 |
| leg fat percentage (right) | 7.339 (7.11, 7.567) | <1.00 × 10−400 | 15.18 (14.791, 15.569) | <1.00 × 10−400 |
| leg fat mass (right) | 0.053 (0.015, 0.09) | 0.006 | 1.431 (1.363, 1.5) | <1.00 × 10−400 |
| leg fat-free mass (right) | −0.886 (−0.943, −0.83) | 5.06 × 10−207 | −1.875 (−1.983, −1.767) | 6.44 × 10−253 |
| leg predicted mass (right) | −0.831 (−0.884, −0.778) | 3.25 × 10−207 | −1.76 (−1.861, −1.659) | 2.90 × 10−253 |
| leg fat percentage (left) | 7.088 (6.869, 7.308) | <1.00 × 10−400 | 13.018 (12.678, 13.358) | <1.00 × 10−400 |
| leg fat mass (left) | 0.049 (0.011, 0.086) | 0.010 | 1.211 (1.149, 1.273) | 1.11 × 10−308 |
| leg fat-free mass (left) | −0.801 (−0.855, −0.748) | 1.93 × 10−189 | −1.357 (−1.457, −1.257) | 1.21 × 10−155 |
| leg predicted mass (left) | −0.75 (−0.8, −0.7) | 3.26 × 10−189 | −1.271 (−1.365, −1.177) | 2.59 × 10−155 |
| arm fat percentage (right) | 5.735 (5.43, 6.039) | 8.09 × 10−297 | 9.029 (8.726, 9.331) | <1.00 × 10−400 |
| arm fat mass (right) | −0.209 (−0.224, −0.194) | 4.39 × 10−164 | 0.003 (−0.02, 0.025) | 0.824 |
| arm fat-free mass (right) | −0.001 (−0.02, 0.019) | 0.953 | −0.57 (−0.613, −0.527) | 2.49 × 10−148 |
| arm predicted mass (right) | 0.002 (−0.017, 0.02) | 0.871 | −0.535 (−0.575, −0.494) | 9.25 × 10−147 |
| arm fat percentage (left) | 5.546 (5.258, 5.833) | 1.11 × 10−308 | 10.24 (9.898, 10.582) | <1.00 × 10−400 |
| arm fat mass (left) | −0.305 (−0.323, −0.287) | 6.29 × 10−242 | −0.017 (−0.043, 0.009) | 0.192 |
| arm fat-free mass (left) | 0.004 (−0.016, 0.023) | 0.721 | −0.7 (−0.748, −0.652) | 3.59 × 10−178 |
| arm predicted mass (left) | 0.001 (−0.017, 0.019) | 0.934 | −0.655 (−0.701, −0.608) | 1.61 × 10−167 |
| trunk fat percentage | 7.784 (7.343, 8.225) | 1.64 × 10−261 | 20.262 (19.806, 20.718) | <1.00 × 10−400 |
| trunk fat mass | 2.564 (2.33, 2.798) | 3.63 × 10−102 | 8.515 (8.267, 8.764) | <1.00 × 10−400 |
| trunk fat-free mass | −0.35 (−0.527, −0.173) | 1.08 × 10⁻⁴ | −5.173 (−5.549, −4.797) | 5.02 × 10−160 |
| trunk predicted mass | −0.324 (−0.494, −0.155) | 1.75 × 10⁻⁴ | −4.928 (−5.289, −4.567) | 2.63 × 10−157 |
| white blood cell (leukocyte) count | 2.707 (2.55, 2.864) | 8.99 × 10−250 | 3.624 (3.388, 3.86) | 2.12 × 10−198 |
| red blood cell (erythrocyte) count | 0.384 (0.355, 0.413) | 3.32 × 10−152 | 0.493 (0.452, 0.534) | 2.61 × 10−121 |
| haemoglobin concentration | 1.077 (0.996, 1.159) | 9.19 × 10−147 | 1.494 (1.381, 1.608) | 4.00 × 10−147 |
| haematocrit percentage | 2.622 (2.381, 2.862) | 7.14 × 10−101 | 4.084 (3.749, 4.419) | 9.44 × 10−126 |
| mean corpuscular haemoglobin concentration | 0.425 (0.331, 0.52) | 1.22 × 10⁻¹⁸ | 0.182 (0.062, 0.303) | 0.003 |
| red blood cell (erythrocyte) distribution width | −0.19 (−0.28, −0.101) | 3.02 × 10⁻⁵ | 0.133 (0.037, 0.229) | 0.007 |
| platelet count | 66.517 (61.26, 71.774) | 1.82 × 10−135 | 51.692 (45.434, 57.949) | 6.85 × 10−59 |
| monocyte count | 0.148 (0.129, 0.167) | 3.21 × 10−53 | 0.273 (0.248, 0.299) | 1.46 × 10−99 |
| neutrophill count | 1.69 (1.572, 1.807) | 5.98 × 10−174 | 2.666 (2.51, 2.822) | 3.67 × 10−244 |
| high light scatter reticulocyte percentage | 0.532 (0.505, 0.56) | 1.11 × 10−308 | 0.471 (0.447, 0.494) | <1.00 × 10−400 |
| alanine aminotransferase | 25.952 (24.892, 27.013) | <1.00 × 10−400 | 29.995 (28.333, 31.657) | 1.36 × 10−272 |
| apolipoprotein B | 0.429 (0.408, 0.449) | <1.00 × 10−400 | 0.22 (0.193, 0.247) | 1.41 × 10−57 |
| aspartate aminotransferase | 9.516 (8.651, 10.381) | 7.50 × 10−103 | 6.946 (5.655, 8.236) | 5.21 × 10⁻²⁶ |
| urea | 0.209 (0.097, 0.32) | 2.44 × 10⁻⁴ | −0.066 (−0.227, 0.095) | 0.419 |
| calcium | 0.088 (0.079, 0.097) | 2.83 × 10−83 | 0.058 (0.047, 0.068) | 1.11 × 10⁻²⁶ |
| cystatin C | 0.08 (0.068, 0.093) | 1.51 × 10⁻³⁵ | 0.202 (0.183, 0.22) | 5.27 × 10−97 |
| γ glutamyltransferase | 57.233 (54.232, 60.235) | 4.59 × 10−304 | 88.281 (82.749, 93.812) | 6.85 × 10−214 |
| glucose | 1.496 (1.401, 1.591) | 2.13 × 10−209 | 1.794 (1.636, 1.952) | 2.51 × 10−109 |
| triglycerides | 3.538 (3.471, 3.605) | <1.00 × 10−400 | 3.076 (2.952, 3.2) | <1.00 × 10−400 |
| urate | 133.014 (127.882, 138.147) | <1.00 × 10−400 | 104.943 (97.223, 112.663) | 6.40 × 10−156 |
Disclaimer/Publisher’s Note: The statements, opinions and data contained in all publications are solely those of the individual author(s) and contributor(s) and not of MDPI and/or the editor(s). MDPI and/or the editor(s) disclaim responsibility for any injury to people or property resulting from any ideas, methods, instructions or products referred to in the content. |
© 2025 by the authors. Licensee MDPI, Basel, Switzerland. This article is an open access article distributed under the terms and conditions of the Creative Commons Attribution (CC BY) license (https://creativecommons.org/licenses/by/4.0/).
Share and Cite
Li, H.; Hui, S.; Cai, X.; He, R.; Yu, M.; Li, Y.; Yu, R.; Huang, P. Investigating the Sexual Dimorphism of Waist-to-Hip Ratio and Its Associations with Complex Traits. Genes 2025, 16, 711. https://doi.org/10.3390/genes16060711
Li H, Hui S, Cai X, He R, Yu M, Li Y, Yu R, Huang P. Investigating the Sexual Dimorphism of Waist-to-Hip Ratio and Its Associations with Complex Traits. Genes. 2025; 16(6):711. https://doi.org/10.3390/genes16060711
Chicago/Turabian StyleLi, Haochang, Shirong Hui, Xuehong Cai, Ran He, Meijie Yu, Yihao Li, Rongbin Yu, and Peng Huang. 2025. "Investigating the Sexual Dimorphism of Waist-to-Hip Ratio and Its Associations with Complex Traits" Genes 16, no. 6: 711. https://doi.org/10.3390/genes16060711
APA StyleLi, H., Hui, S., Cai, X., He, R., Yu, M., Li, Y., Yu, R., & Huang, P. (2025). Investigating the Sexual Dimorphism of Waist-to-Hip Ratio and Its Associations with Complex Traits. Genes, 16(6), 711. https://doi.org/10.3390/genes16060711