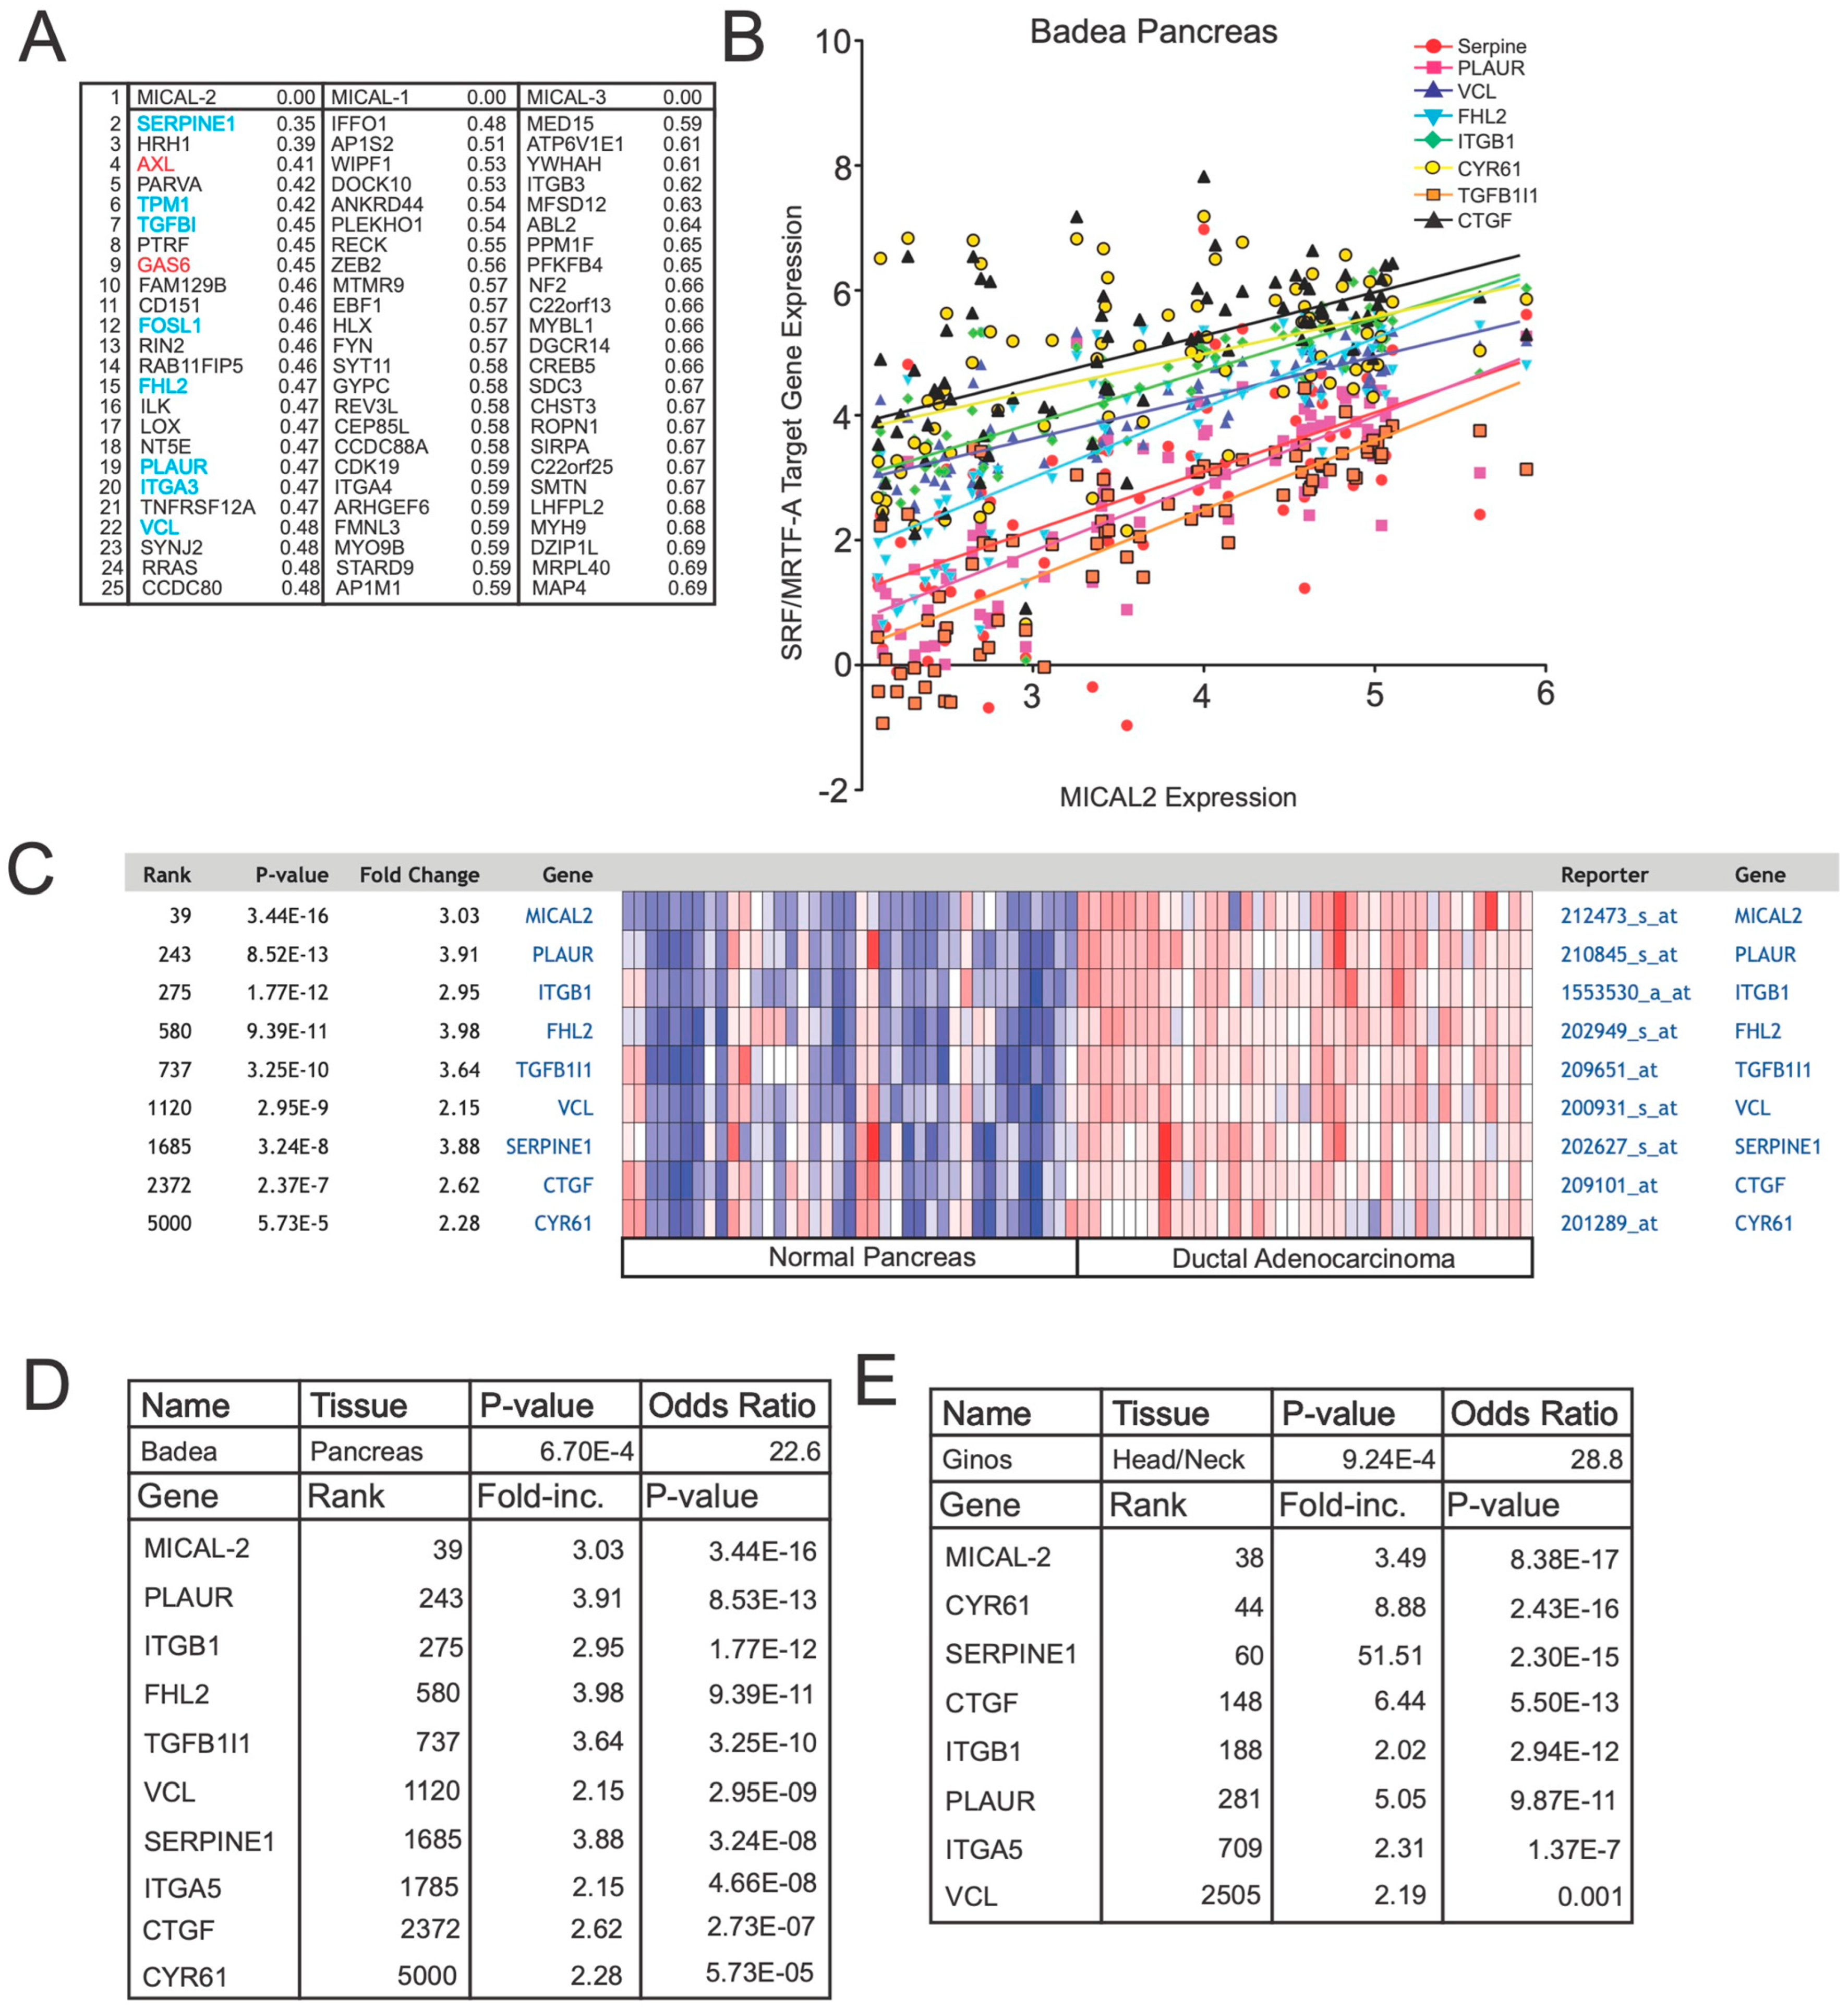
Figure 1.
Coexpression analysis reveals a correlation between MICAL2 and SRF/MRTF-A-regulated genes, AXL, and GAS6. (A) Coexpression analysis shows that MICAL2, but not MICAL1 or MICAL3, is coexpressed with SRF/MRTF-A-regulated transcripts as well as AXL and GAS6. In this analysis, the Cancer Cell Line Encyclopedia (CCLE) was screened for genes that correlated with MICAL2 expression using a nearest neighbors analysis. Shown are the top 25 genes identified as coexpressed with MICAL2. Indicated are the coexpression scores, with lower numbers indicating higher coexpression. Shown in blue are genes previously documented to be regulated by SRF/MRTF-A. Shown in red are AXL and GAS6. None of these genes are among the top 25 genes that show coexpression with MICAL1 or MICAL3. (B) MICAL2 expression levels are positively correlated with the expression levels of SRF/MRTF-A-regulated transcripts. Shown are the transcripts that show high coexpression with MICAL2. As can be seen, MICAL2 gene expression measured in the Badea pancreatic cancer gene expression dataset is positively correlated with each of the indicated SRF/MRTF-A-regulated transcripts. Expression is indicated as log2-fold expression. (C) MICAL2 expression correlates with SRF/MRTF-A-regulated genes in normal pancreas and pancreatic cancer. In normal pancreas, MICAL2 expression is low (blue) across each sample tested (each column). Overall, there is a general trend of low MICAL2 expression along with low SRF/MRTF-A-regulated gene expression in normal pancreas. In contrast, in ductal adenocarcinoma, MICAL2 expression was significantly higher, along with SRF/MRTF-A-target gene expression. “E” represents multiplication by 10 raised to the indicated power. (D) SRF/MRTF-A genes and MICAL2 are co-expressed as a group in the Badea pancreatic cancer database. (E) SRF/MRTF-A genes and MICAL2 are co-expressed as a group in the Ginos head/neck cancer database.
![Genes 14 02231 g001]()
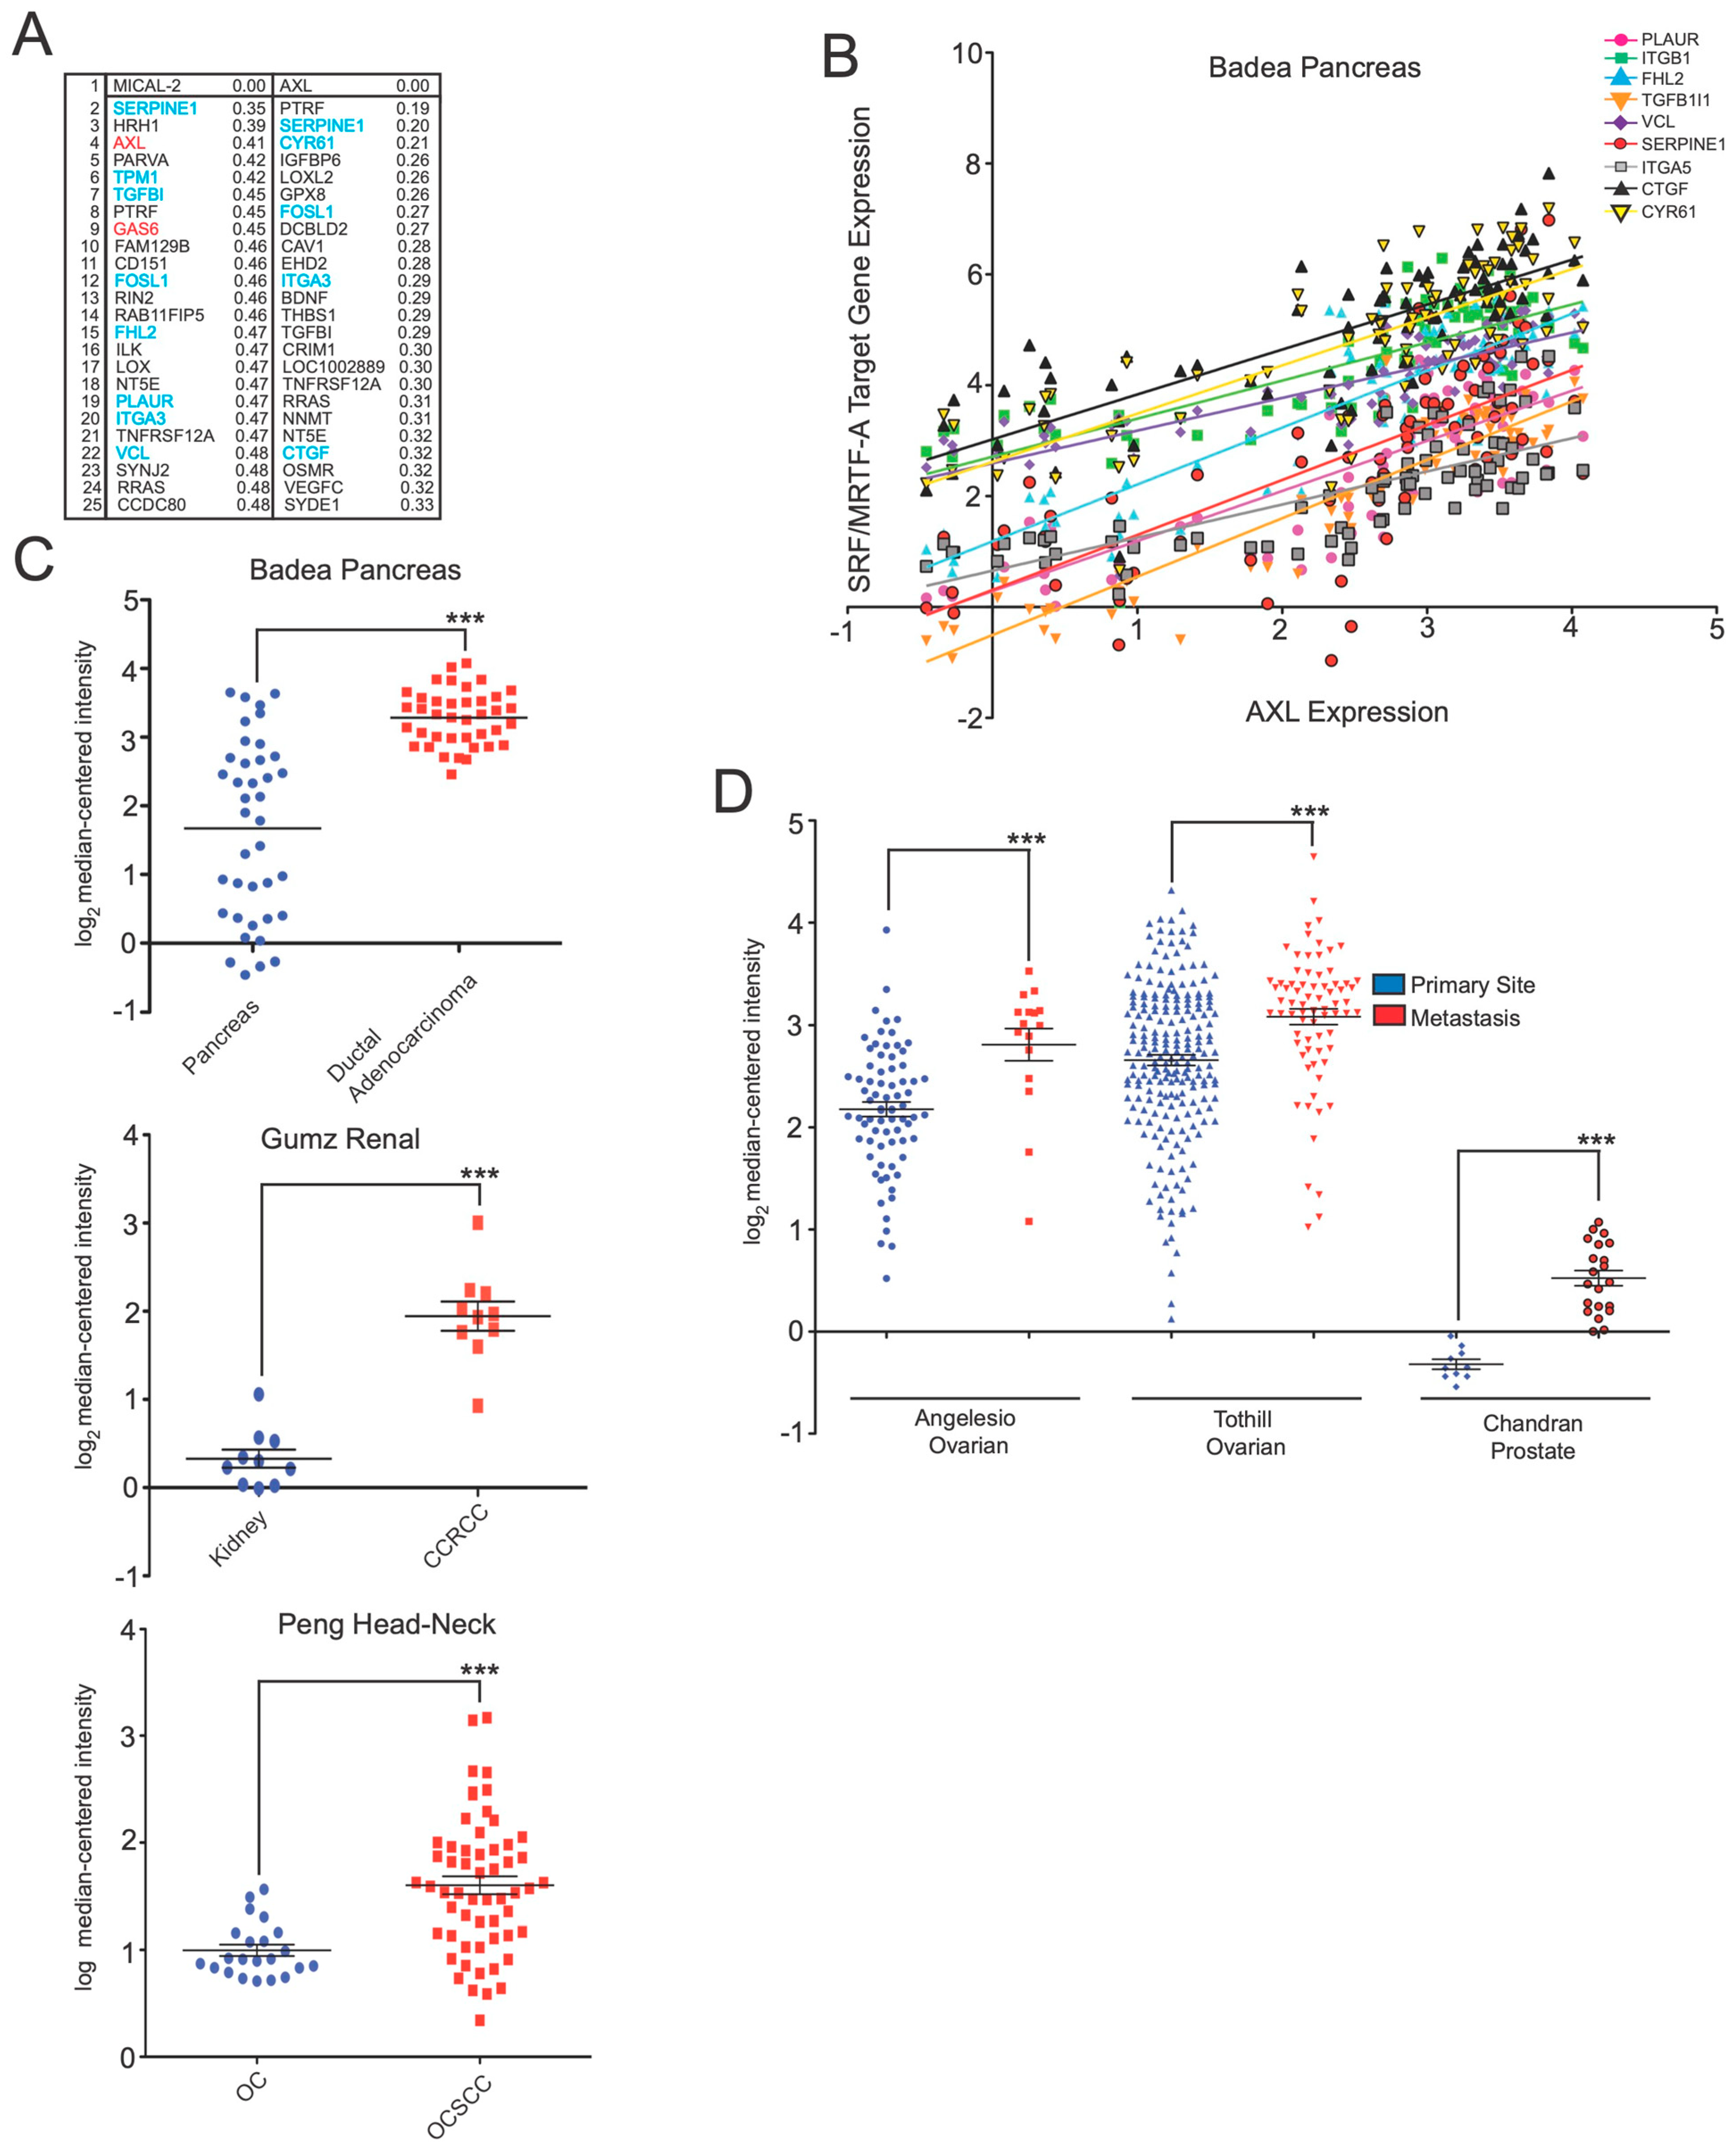
Figure 2.
AXL expression is upregulated in diverse cancers and correlates with SRF/MRTF-A target transcripts. (
A) Coexpression analysis shows that AXL is coexpressed with SRF/MRTF-A-regulated transcripts. In this analysis, the Cancer Cell Line Encyclopedia (CCLE) was screened for genes that correlated with
AXL expression using a nearest neighbors analysis. Shown are the top 25 genes identified as coexpressed with
AXL. Indicated are the coexpression scores, with lower numbers indicating higher coexpression. Shown in blue are genes previously documented to be regulated by SRF/MRTF-A. As with
MICAL2 (reproduced from
Figure 1A), several coexpressed genes are SRF/MRTF-A target transcripts. Some, such as
SERPINE1 and
ITGA3, are correlated with both
MICAL2 and
AXL. (
B)
AXL expression levels are positively correlated with the expression levels of SRF/MRTF-A-regulated transcripts. Shown are the transcripts that show high coexpression with either
AXL or
MICAL2. As can be seen,
AXL gene expression measured in the Badea pancreatic cancer gene expression dataset is positively correlated with each of the indicated SRF/MRTF-A-regulated transcripts. Expression is indicated as log
2-fold expression. (
C)
AXL expression is elevated in pancreatic adenocarcinoma, renal cancer, and head-neck cancer. Shown are the expression data from the indicated cancer gene expression datasets.
AXL expression is markedly upregulated in each of the indicated cancers. CCRCC, clear cell renal cell carcinoma; OC, oral cavity; OCSCC, oral cavity squamous cell carcinoma. ***
p < 0.0005, Student’s
t-test. (
D)
AXL expression is elevated in the indicated ovarian and prostate cancer datasets. ***
p < 0.0005, Student’s
t-test.
![Genes 14 02231 g002]()
Figure 3.
Gas6 and AXL induce the nuclear localization of MRTF-A. (A) Gas6 induces the SRF/MRTF-A transcriptional reporter in the absence of serum. To determine if Gas6 induces SRF/MRTF-A signaling, HEK293T cells were co-transfected with pGL4.34[luc2p/srf-re], a reporter construct expressing luciferase under the control of a SRF/MRTF-A-dependent CArG box-containing promoter. Serum-starved HEK293T (DMEM, 0.3% FBS) cells were cultured for 18 h and then treated with Gas6 (100 ng/mL) for 6 h. Statistical significance was determined by ANOVA (*** p < 0.005) with Dunnett multiple comparison post-test, n = 18 per condition from two biological replicates. (B) Axl inhibition reduces the effect of serum-induced SRF/MRTF-A reporter activation. HEK293T cells were cultured in 10% FBS for 18 h and subsequently treated with the indicated concentrations of R428, an Axl receptor inhibitor for 6 h. Statistical significance was determined by ANOVA (*** p < 0.005) using Dunnett multiple comparison post-test, n = 18 per condition from two biological replicates. (C) GFP-AXL expression induces nuclear localization of MRTF-A. HEK293 cells were infected with lentivirus expressing either GFP or GFP-AXL for 24 h. Dotted white lines show the outline of the nuclei, based on DAPI staining. (D) Quantification of results in (C). The average intensity of MRTF-A immunofluorescence was quantified in the nucleus and the cytoplasm. These values were used to calculate the ratio. This ratio is useful for reducing variability due to MRTF-A expression levels between cells. GFP-AXL increases the nucleus:cytoplasmic ratio of MRTF-A by ~6-fold. *** p < 0.0005, Student’s t-test, n ≥ 30 per condition from two biological replicates. (E) AXL is required for Gas6-induced nuclear localization of MRTF-A in HEK293 cells. Serum-starved A549 (DMEM, 0.3% FBS) cells were cultured for 18 h and then treated with Gas6 (100 ng/mL) for 6 h. GFP-AXL (green) expression results in increased levels of nuclear MRTF-A and this was further increased by the application of Gas6. Baseline levels of nuclear MRTF-A are determined based on the levels seen in GFP-expressing cells. Gas6 caused an increase in nuclear MRTF-A localization, which was blocked by lentiviral expression (indicated by GFP fluorescence) of either of two different Axl-specific shRNA. Nuclei are outlined by dotted white lines in the representative images shown. (F) Quantification of results in (E). *** p < 0.0005, statistical significance was determined by ANOVA (*** p < 0.0001) using Dunnett multiple comparison post-test, n ≥ 30 per condition from two biological replicates.
![Genes 14 02231 g003]()
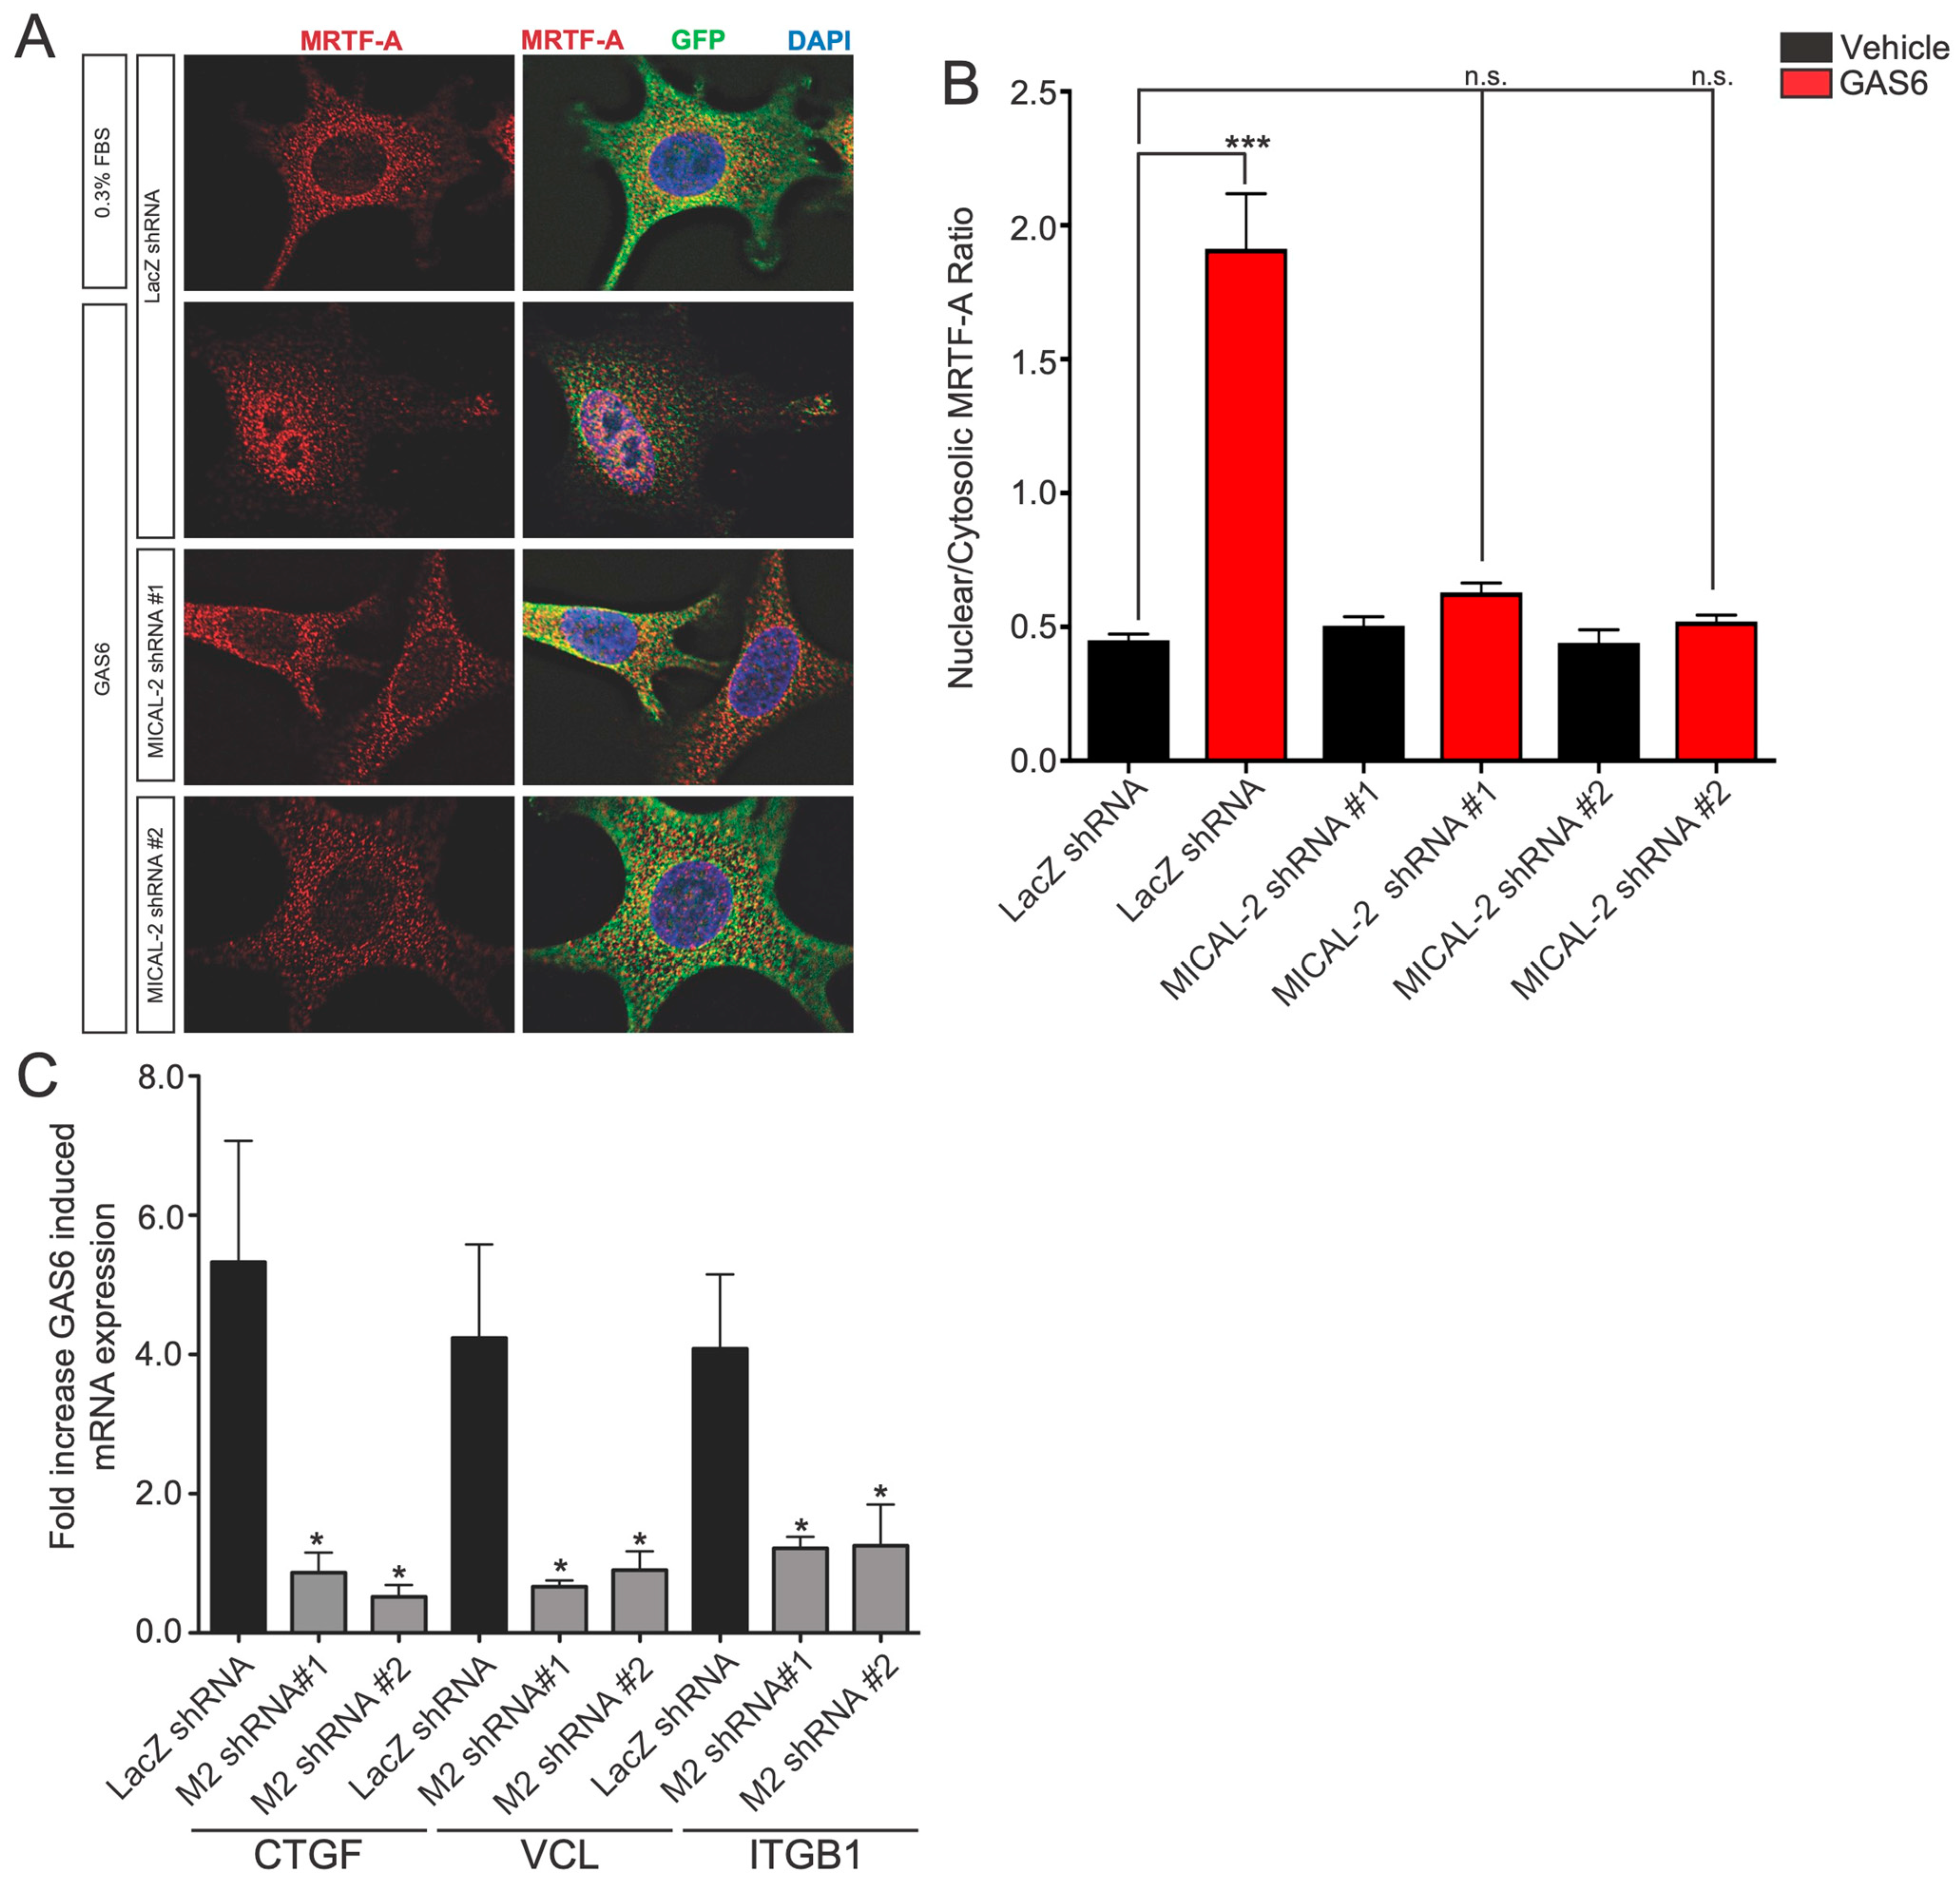
Figure 4.
Gas6-induced nuclear localization of MRTF-A and Gas6-mediated induction of SRF/MRTF-A target genes are mediated by MICAL2. (A) MICAL2 is required for Gas6-induced nuclear localization of MRTF-A in HEK293 cells. Serum-starved HEK293T (DMEM, 0.3% FBS) cells were cultured for 18 h and then treated with Gas6 (100 ng/mL) for 6 h. A549 cells infected with lentivirus expressing either control shRNA (lacZ) or MICAL2-specific shRNA. Infected cells express GFP (green). Shown are the representative cells from immunofluorescence staining experiments from two independent biological replicates with the indicated antibodies. Gas6 treatment resulted in increased levels of nuclear MRTF-A, but this effect was blocked in cells expressing either MICAL2-specific shRNA. (B) Quantification of results in (A). *** p < 0.0005, statistical significance determined by ANOVA (*** p < 0.0001) using Dunnett multiple comparison post-test, n ≥ 30 per condition from two biological replicates. n.s., not significant. (C) Gas6-mediated induction of SRF/MRTF-A-regulated transcripts is dependent on MICAL2. The indicated that SRF/MRTF-A-target transcript (CTGF, VCL, or ITGB1) was measured in A549 cells using qRT-PCR following treatment with Gas6, and the fold increase relative to vehicle-treated cells is indicated. Expression of each gene is markedly increased following Gas6 treatment. This effect is blocked in cells infected with lentivirus expressing either of the two MICAL2-specific shRNA, but not control shRNA. * p < 0.05, statistical significance was determined by ANOVA using Dunnett multiple comparison post-test, n ≥ 3 per gene.
![Genes 14 02231 g004]()
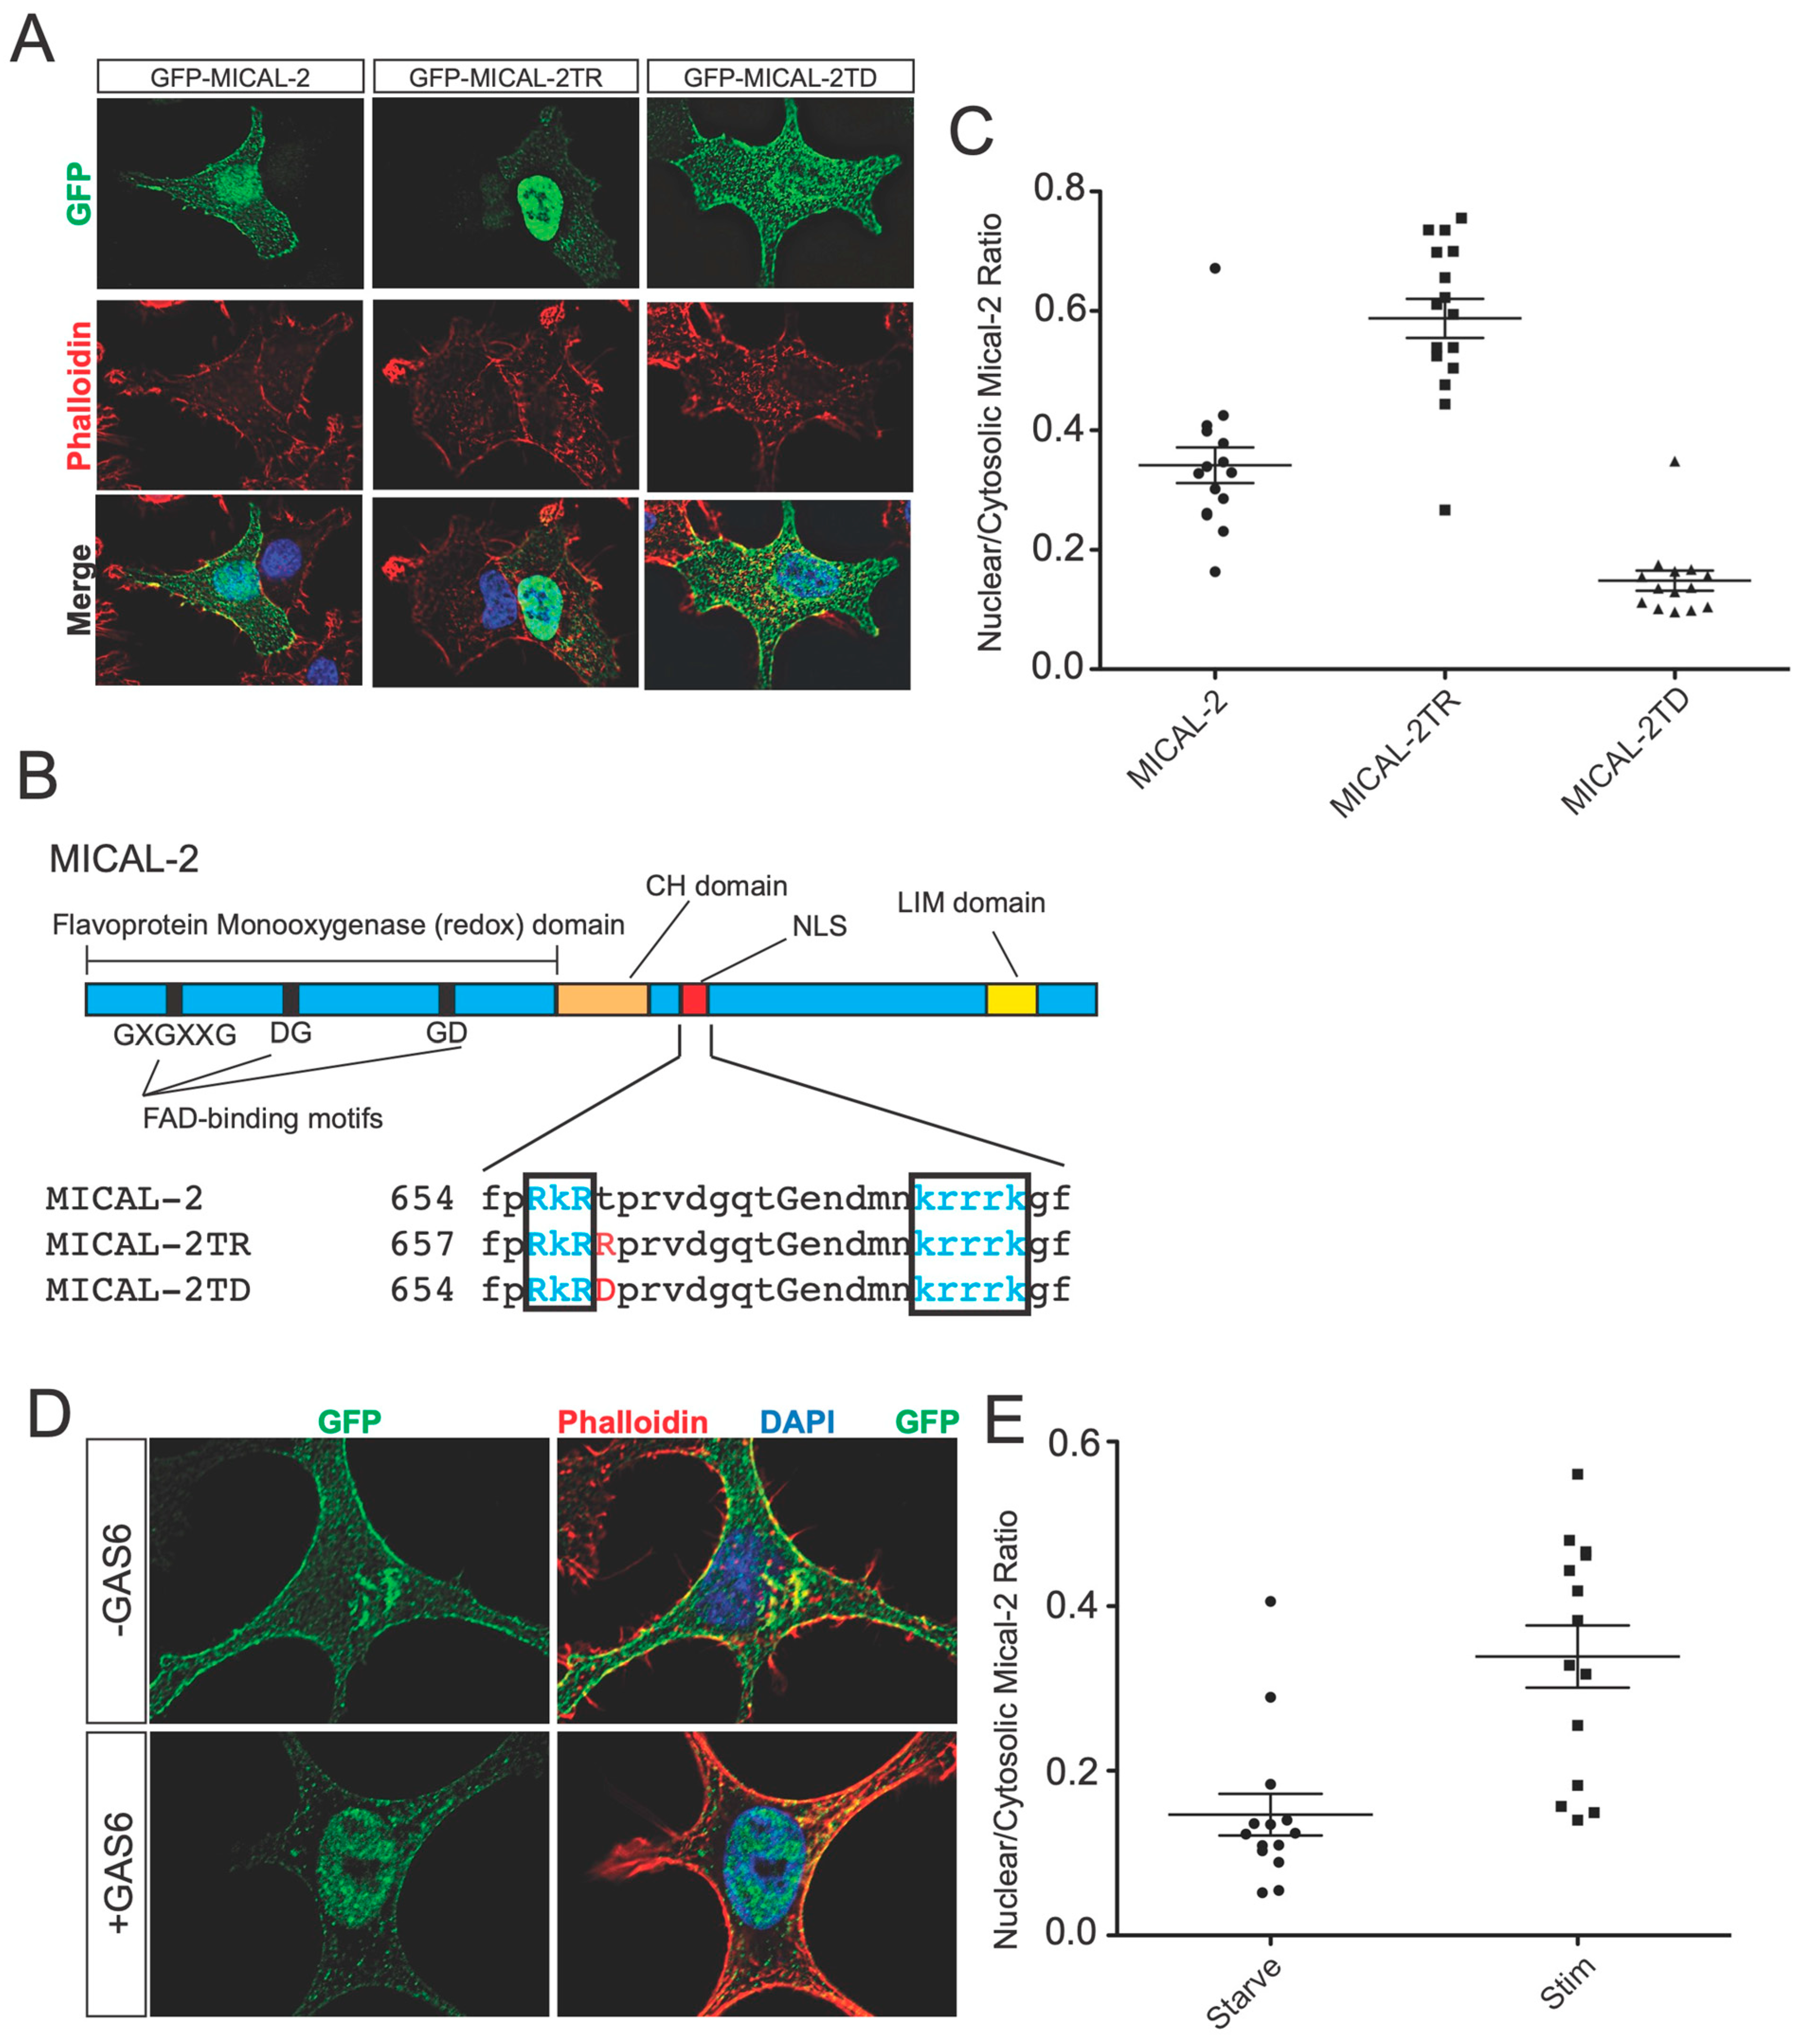
Figure 5.
Gas6 increases the nuclear localization of MICAL2. (
A) Validation of a nuclear localization element in MICAL2 and identification of mutants that affect the nuclear localization of MICAL2. GFP-MICAL2 was expressed in A549 cells, and the localization was detected by green fluorescence. F-actin was detected by staining with Phalloidin-Alexa 594. Shown are the representative cells from two independent biological experiments. In cells expressing GFP-MICAL2, localization was enriched in the nucleus with some protein readily detected in the cytosol. However, expression of a mutant in which a potentially regulated threonine (see
Figure 5B) is mutated to arginine (GFP-MICAL2TR) resulted in green fluorescence primarily restricted to the nucleus. In contrast, a phosphomimetic mutant of the same residue (GFP-MICAL2TD) shows increased cytosolic localization relative to the wild type. (
B) MICAL2 and -3 each contain a putative bipartite NLS. The domain structure of MICAL2 is indicated above. The enzymatic domain contains a GXGXXG, aspartate-glycine (DG), and a glycine-aspartate (GD) motif, which is the characteristic FAD-binding motif. The F-actin binding CH domain and structural LIM domain are indicated. The red box is the NLS domain in MICAL2. Comparison of the primary sequences of MICAL1, 2, and 3 shows a potential bipartite NLS in MICAL2 and MICAL3 that is not found in MICAL1. Shown in blue letters are the amino acids that constitute the NLS in MICAL2 and -3. Shown in red are the amino acids that are mutated in the M2NLSMut and M3NLSMut. Uppercase letters are amino acids conserved in MICAL-1, -2, and -3. (
C) Quantification of results in (
A). (
D) Gas6 induces nuclear localization of MICAL2. A549 cells were cultured in low serum (0.3% FBS) and infected with lentivirus expressing GFP-MICAL2 (green). Shown is a representative example of cells from two independent biological replicates. F-actin was labeled with phalloidin-Alexa 594 (red). Nuclei are labeled with DAPI (blue). Treatment with Gas6 (100 ng/mL, 30 min) resulted in increased levels of nuclear localized MICAL2. (
E) Quantification of results in (
D). “Starve” refers to 0.3% FBS, and “Stim” refers to 0.3% FBS plus Gas6 (100 ng/mL).
![Genes 14 02231 g005]()
Figure 6.
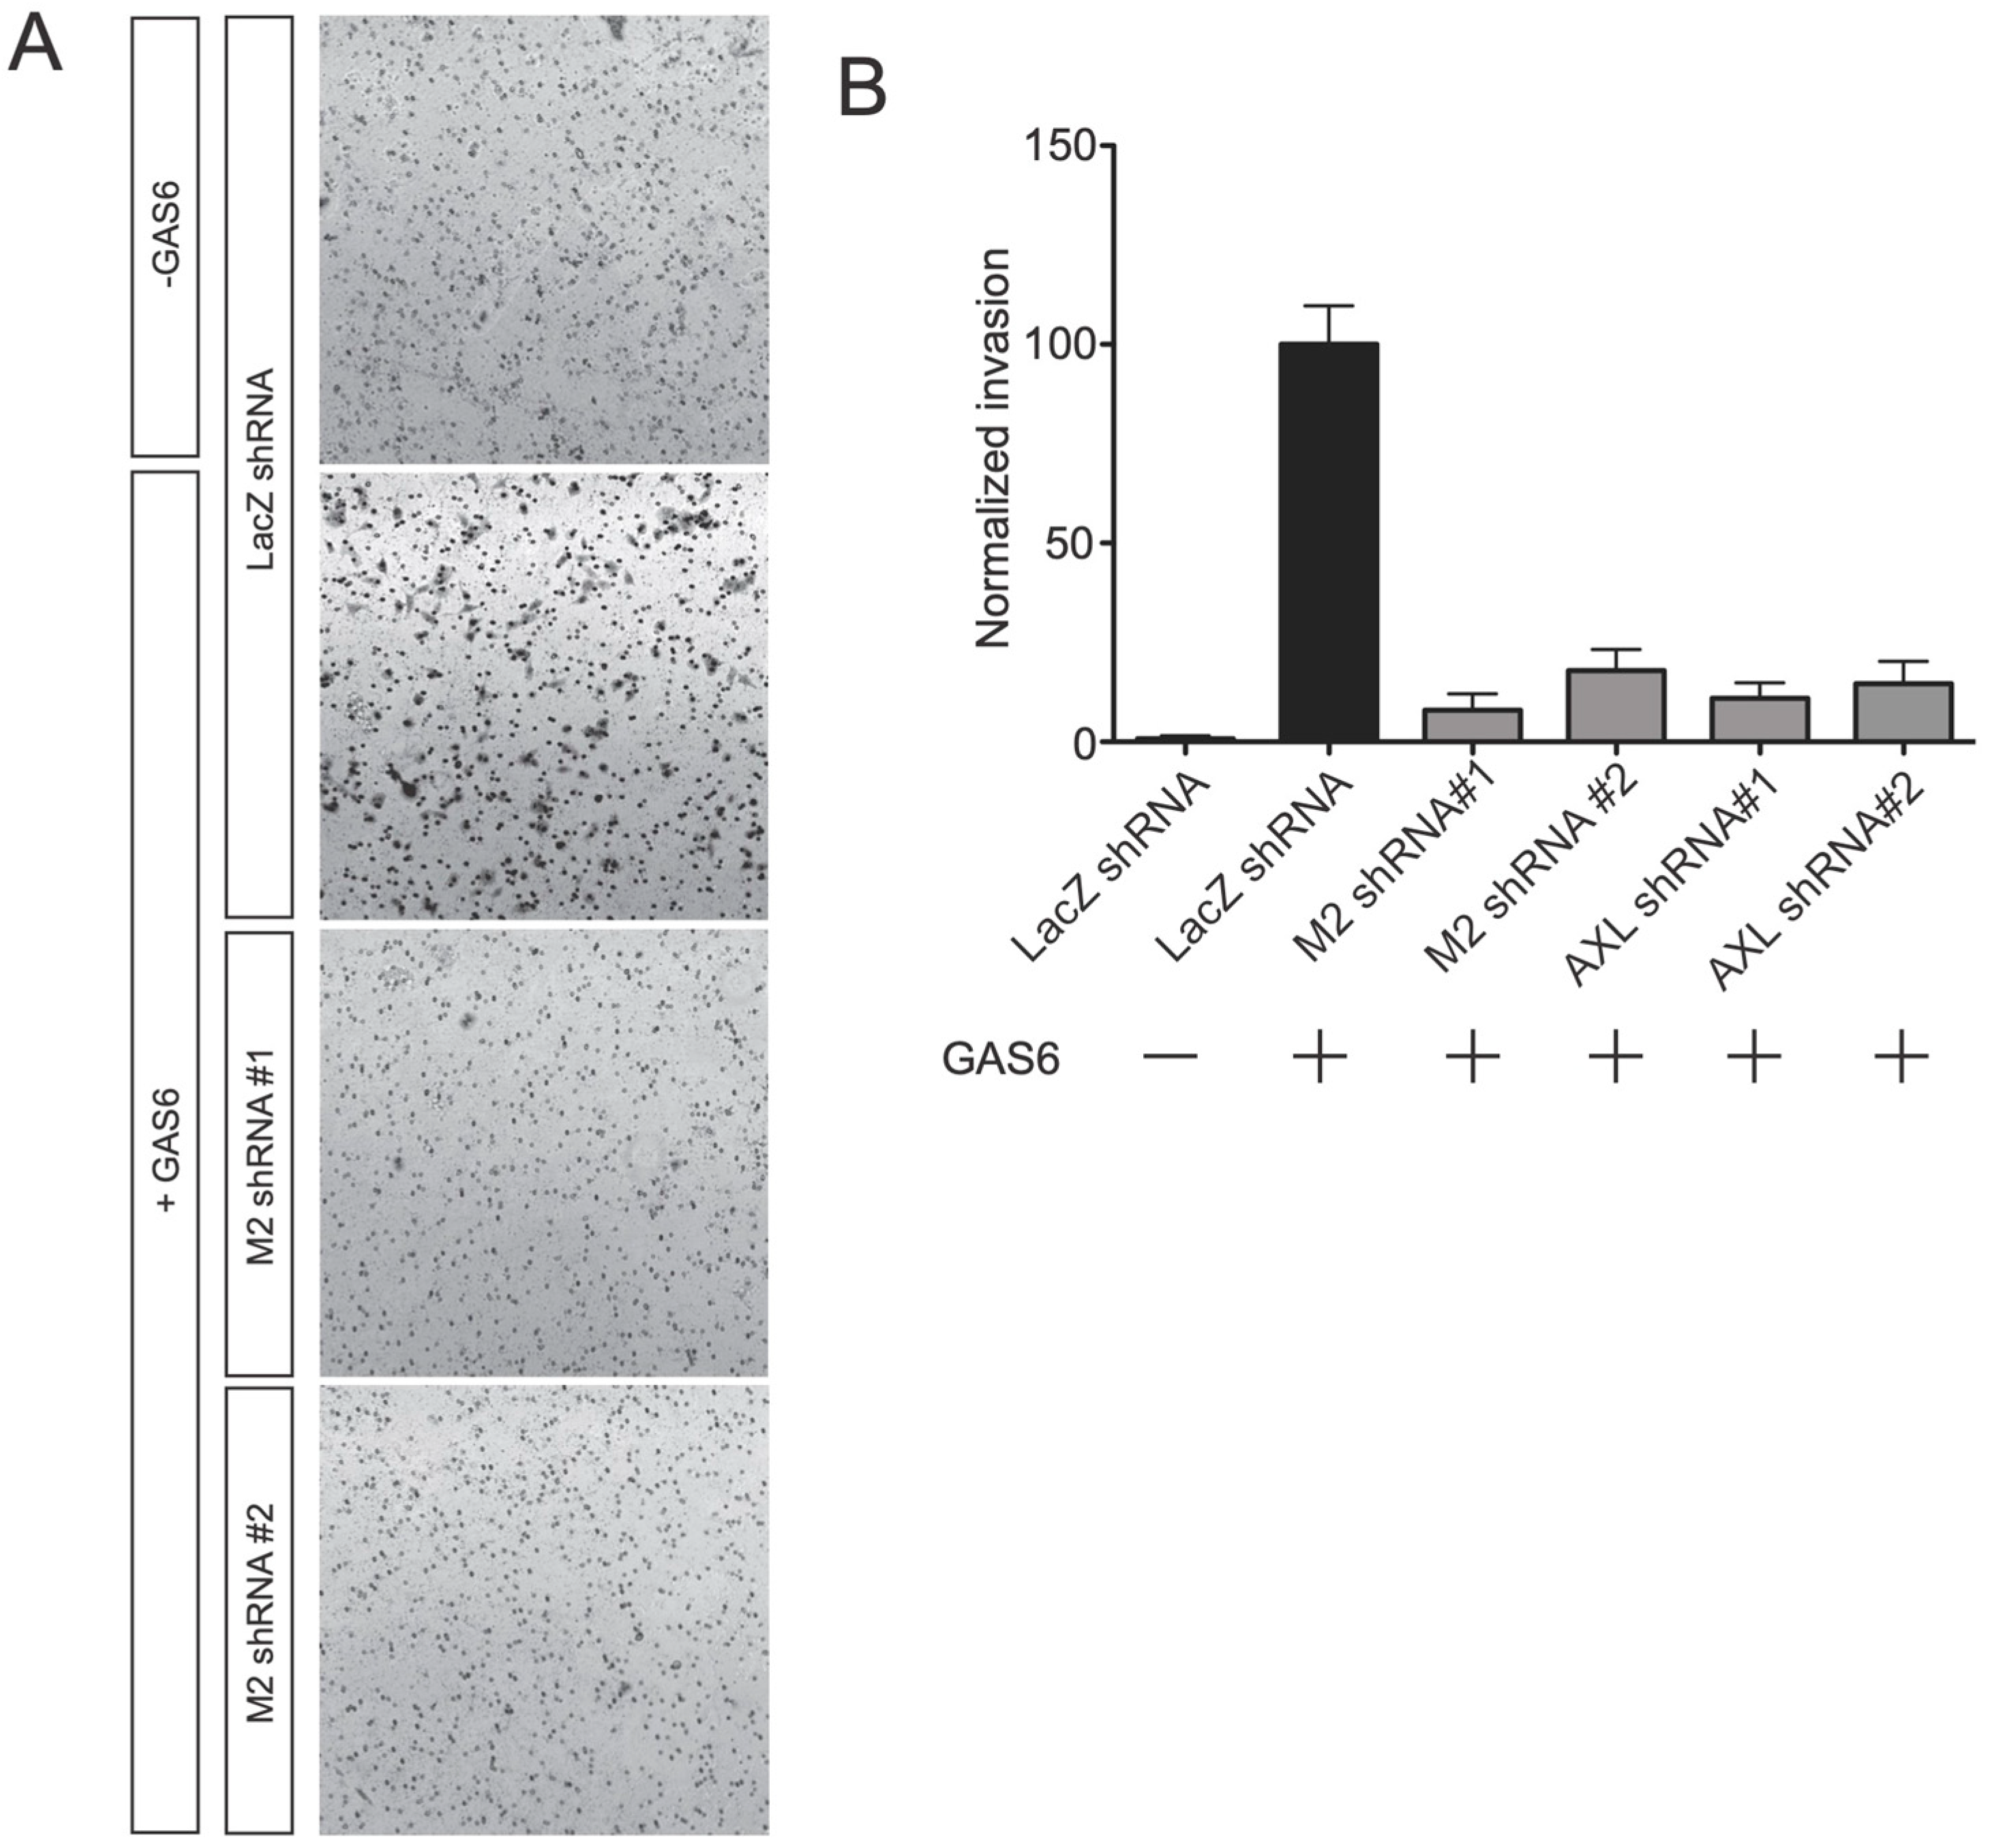
MICAL2 is required for Gas6-induced migration of A549 cells. (A) A549 cells were plated on Transwell inserts and migration through the membrane was measured 48 h after adding Gas6-containing media in the lower chamber. Cells were detected by staining with crystal violet. In cells expressing the control (LacZ) shRNA, Gas6 caused a marked increase in cell migration. However, this effect was not seen in cells expressing either of the two MICAL2-specific shRNA (M2 shRNA). Shown are representative results from three independent replicates. (B) Quantification of migration in (A). n ≥ 40 20X fields of view per condition.
Figure 6.
MICAL2 is required for Gas6-induced migration of A549 cells. (A) A549 cells were plated on Transwell inserts and migration through the membrane was measured 48 h after adding Gas6-containing media in the lower chamber. Cells were detected by staining with crystal violet. In cells expressing the control (LacZ) shRNA, Gas6 caused a marked increase in cell migration. However, this effect was not seen in cells expressing either of the two MICAL2-specific shRNA (M2 shRNA). Shown are representative results from three independent replicates. (B) Quantification of migration in (A). n ≥ 40 20X fields of view per condition.


