Article

Diversification of Transposable Elements in Arthropods and Its Impact on Genome Evolution

State Key Laboratory of Protein and Plant Gene Research, Center for Bioinformatics, School of Life Sciences, Peking University, Beijing 100871, China
*
Author to whom correspondence should be addressed.
Genes 2019, 10(5), 338; https://doi.org/10.3390/genes10050338
Submission received: 18 February 2019 / Revised: 9 April 2019 / Accepted: 26 April 2019 / Published: 6 May 2019
(This article belongs to the Special Issue Repetitive DNA Sequences)

Abstract

:
Transposable elements (TEs) are ubiquitous in arthropods. However, analyses of large-scale and long-term coevolution between TEs and host genomes remain scarce in arthropods. Here, we choose 14 representative Arthropoda species from eight orders spanning more than 500 million years of evolution. By developing an unbiased TE annotation pipeline, we obtained 87 to 2266 TE reference sequences in a species, which is a considerable improvement compared to the reference TEs previously annotated in Repbase. We find that TE loads are diversified among species and were previously underestimated. The highly species- and time-specific expansions and contractions, and intraspecific sequence diversification are the leading driver of long terminal repeat (LTR) dynamics in Lepidoptera. Terminal inverted repeats (TIRs) proliferated substantially in five species with large genomes. A phylogenetic comparison reveals that the loads of multiple TE subfamilies are positively correlated with genome sizes. We also identified a few horizontally transferred TE candidates across nine species. In addition, we set up the Arthropod Transposable Elements database (ArTEdb) to provide TE references and annotations. Collectively, our results provide high-quality TE references and uncover that TE loads and expansion histories vary greatly among arthropods, which implies that TEs are an important driving force shaping the evolution of genomes through gain and loss.

1. Introduction

Transposable elements (TEs) are DNA sequences that can jump in host genomes [1]. TEs are widespread in eukaryotic organisms and occupy more than 45% of the human genome [2]. Previous studies showed that TEs mainly adopt two mechanisms in replication: “copy and paste” and “cut and paste” [3]. The first class of TEs are mainly retrotransposable elements that require RNA intermediates, and the second class of TEs are mainly DNA transposons (terminal inverted repeats or TIRs). As TE translocation might cause genomic instabilities or waste energy of the host organisms, TEs used to be regarded as “junk DNA” [4].
The genomes of many arthropods have been sequenced in the past decades, which suggests the contents of TEs are highly variable in Arthropoda [5,6,7,8,9,10,11,12,13,14,15,16,17,18]. For instance, Locusta migratoria has a huge genome, which is larger than 6.5 Gb [17], while Tetranychus urticae has a much smaller genome which is less than 0.1 Gb [9]. As the number of genes does not differ significantly between these two species [9,17], the 65-fold genome size variation might be mainly due to the rapid evolution of TEs. Consistently, a very recent study surveyed TEs in 62 insects and 11 non-insect outgroup species and found TE contents vary considerably in insect genomes, suggesting the variation in genome size is shaped by the expansion and contraction of TEs in arthropods [19]. TE gain and loss is one of the major drivers of genome size changes, as previously shown in mammals [20], avians [21] and Drosophila [22].
Nevertheless, several unaddressed gaps remain in our understanding of the evolutionary dynamics of TEs and their impact on the evolution of arthropod genomes. First, most of the identified TE sequences in arthropods are based on the reference sequences in the Repbase database, and many species-specific TEs that are under-represented in Repbase are not well recovered. Second, many TE annotation programs such as RepeatModeler does not consider the global structure of a TE, which might identify a partial but not the full-length sequence of a TE. Third, the expansion and contraction dynamics for most TE families or subfamilies in arthropods are still not well understood. Forth, it remains unclear how frequently horizontal transfer of TEs (HTTs) occur in arthropods. Arthropods have tremendously diversified phenotypes and abundant genomic resources. Answers to the above questions might help understand the roles of TEs during the diversification of arthropods.
We explored the evolutionary dynamics of TEs in fourteen representative Arthropoda species spanning eight orders. We first built a high-quality TE reference library for each species by combining sequence homology searching and de novo TE identification. Then, we explored TE expansion and contraction in these arthropod species based on the phylogenetic tree. We found that frequent gains and losses, sequence diversification, and HTTs jointly contributed to TE load diversity in arthropods. Finally, we report the database ArTEdb (http://db.cbi.pku.edu.cn/arte), which incorporates the sequences and annotations of TEs identified in this study. The resources provided by this study will benefit future TE studies in arthropods.

2. Materials and Methods

2.1. Transposable Elements Reference Construction

The genome sequences were downloaded from the NCBI, FlyBase, and SilkBase databases (Table S1). The published TEs were downloaded from Repbase (v23.02) [23]. LTRs have several structural features, including target site repeats, long terminal repeats, primer binding sites (PBSs), polypurine tract (PPT) and multiple open reading frames (ORFs). The ORFs in long terminal repeats (LTRs) encode functional domains such as reverse transcriptase (RT), integrase (IN), and RNase H (RH). Reverse transcription of LTR requires tRNA primer that pairs with the PBS. Therefore, the domain profiles and tRNAs will help to identify and classify LTRs better. LTR domain profiles were downloaded from GypsyDB (www.gydb.org) [24]. The tRNAs were annotated using tRNAScan-SE (-G) [25]. Only high-quality tRNAs (score > 40) with clear anticodons were kept and used in the LTR annotation. TE reference libraries were built using both homology-based and de novo methods.

2.2. Identification and Annotation of Transposable Elements

Two de novo tools were used to identify full-length LTR candidates initially. LTR_Finder uses tRNAs and Pfam domain profiles (-w 2 -l 100 -L 1000 -D 12000 -d 2000) [26], and LTRharvest (-seed 80 -minlenltr 100 -maxlenltr 1000 -mindistltr 2000 -maxdistltr 12000 -overlaps no -similar 80 -mintsd4 -maxtsd 20 -longoutput) is one module of GenomicTools [27]. The tRNAs and Pfam domains profiles are used for identifying PBSs and enzyme domains respectively. LTRdigest (-pptlen 10 30 -pbsoffset 0 3) [28] was applied to refine the identifications using both tRNAs and LTR domain profiles downloaded from GypsyDB. Only LTR candidates with at least one of the five LTR domains (GAG, AP, INT, RT, and RH) were kept. All identified LTR candidates were combined and clustered with the UCLUST (id = 0.9) algorithm [29]. For TEs in each cluster, CLUSTALW2 [30] was applied to perform multiple alignments, and the cons (EMBOSS) tool was used to build consensus sequences. Singletons (only one TE in a cluster) having at least four of the five LTR domains were kept. Both singletons and consensus sequences were masked by RepeatMasker [31] with the built-in libraries of corresponding species. Sequences that overlapped with RepeatMasker libraries (more than 80% of the queries were masked) were collapsed.
Besides the LTR specific annotation programs, we also employed RepeatModeler (www.repeatmasker.org/RepeatModeler) pipeline with the default parameters to identify TEs in each species. Consensus sequences aligned to known protein-coding genes of Drosophila melanogaster were removed. Moreover, the remaining sequences that overlapped with previous annotations of Repbase or LTRs were collapsed. All annotated TE sequences by RepeatModeler were combined, and their classes and subfamilies were further determined based on both sequence similarity to known TEs (Repbase) or TE-specific domains (Pfam_v27 and GypsyDB) by PASTEClassifier [32] and de novo classifications by TEclass [33].
For each species, the TEs identified by the LTR specific tools and RepeatModeler were combined. USEARCH [29] was used to obtain the nonredundant TE libraries for each species. All the TE references for each species can be downloaded from the ArTEdb database (http://db.cbi.pku.edu.cn/arte). For each TE reference annotated in this study, we denote it with the TE class followed by the first three letters of the genus and the first three letters of the species name. For example, the homologous sequence of Gypsy-1_DSim in Drosophila melanogaster is Gypsy-1_DroMel in the ArTEdb database.

2.3. Transposable Element Loads and Expansion Analyses

Genomes were masked by RepeatMasker using TE libraries defined in this study. TE loads in each species were calculated using the script ONE_CODE_TO_FIND_THEM_ALL.PL [34]. The Kimura 2-Parameter divergence of TEs was calculated using the RepeatMasker built-in tool calcDivergenceFromAlign.pl, and the distributions of divergence were plotted using ECharts (www.echarts.baidu.com).

2.4. Reconstructing the Phylogenetic Tree

BUSCO [35] was adopted with the insect core genes to annotate single-copy orthologous genes in the fourteen species. Only single-copy genes with intact ORFs were kept. Orthologous protein multiple alignments generated by T-COFFEE [36] were then transformed into codon alignments using RevTrans [37]. A preliminary phylogeny tree for the selected species was firstly reconstructed by MEGA [38] based on the concatenated protein alignments of orthologous genes. Sites with more than 50% gaps were removed from the concatenated alignment, and the phylogeny was built using Maximum-likelihood algorithm with the JTT matrix. The topological position of L. migratoria was manually curated based on a previous study [39]. All the codon alignments were concatenated, and CODEML from PAML [40] was used to calculate the dN with the free model (runmode = 0; model = 1). The dN values of the concatenated sequences were then set as the branch length of the phylogenetic tree. The tree is provided in the Supplementary File S1.

2.5. Time-Calibrated Phylogeny

The non-parametric tool r8s [41] was used to transform the branch lengths into millions of years. Fossil evidence shows that the divergence time between Bombus terrestris and Apis mellifera is 23 to 28.4 million of years ago (Ma) [39], and the age of the root node was set as 550 to 580 Ma [39,42].

2.6. Fitting Multiple Phylogenetic Comparative Models

Both the TE loads and genomes sizes (gaps excluded) were transformed in natural log(Ln)grams. Their phylogenetic signals were estimated using the phylosig (method = “lambda”) function from phytools [43]. The adequacy of four standard phylogenetic comparative models were tested using the fitContinuous function of Geiger [44] in R. These models are Brownian motion (BM) [45], Ornstein-Uhlenbeck (OU) [46], Early-burst (EB; also named as Accelerating-Decelerating (ACDC)) [47], and white noise (non-phylogenetic and normal distribution). The AICc (corrected Akaike information criterion for small sample size) values of these models were evaluated, and the results suggest that the BM model was the most suitable model. Therefore, the BM model was used in the next phylogenetically independent contrasts and ancestral state reconstruction of TE loads.

2.7. Phylogenetically Independent Contrasts

The phylogenetically independent contrasts (PIC) of TE loads and host genome sizes (gaps excluded) were calculated using the pic function of ape [48] in R. The TE loads of all subfamilies were added to the total TE loads. For the four main classes (TIR, LTR, LINE, and SINE), the TE loads of all subfamilies belong to them were added together. Subfamilies that appeared in more than seven species were preserved for the additional subfamily-level PIC analyses. Both the TE loads and genome sizes were in natural log(Ln)grams. The correlation between TE loads and host genome sizes were calculated using Pearson’s product-moment correlation test in R. The P values of these subfamilies were corrected using the Holm-Bonferroni correction [49].

2.8. Ancestral State Reconstruction of Transposable Element Loads

The TE loads that are in natural log(Ln)grams were fitted to the Brownian motion model. The TE load states of the ancestor nodes were inferred by the phytools [43] using the maximum-likelihood analysis method [50]. The fastAnc function from phytools was used to reconstruct the ancestral state as previously reported [51]. Similar to the method used in a previous study [51], the TE load change ratio was defined as the TE load of offspring node relative to its ancestral node. The phylogenetic tree with TE load change ratios was plotted using ReproPhylo [52].

2.9. Identifying Shifts of Transposable Element Loads Change Rates in the Phylogeny

BAMM (Bayesian analysis of macroevolutionary mixtures) [53,54,55] was used to identify shifts of TE loads evolutionary rates in the time-calibrated phylogeny. The betaInitPrior and betaShiftPrior parameters were estimated by the setBAMMpriors function of BAMMtools v2.1.6 [56], and 1,000,000 generations of MCMC (Markov chain Monte Carlo) sampling were conducted. The outputs of BAMM were then post-processed by BAMMtools, and the evolutionary rates of TE loads and the best shift configuration were extracted and highlighted in the phylorate plots for four TE classes and three subfamilies (TIR/Mariner, LTR/Gypsy, and LINE/Jockey).

2.10. Transposable Element Protein Annotation

Proteins of TEs were annotated with the homology-based method. TE proteins extracted from Repbase were aligned to annotated TEs using the tblastn program [57]. For each TE, the aligned protein with the smallest E-value was selected. All preserved query-target pairs were then realigned using exonerate (--model protein2genome:bestfit) to annotated proteins [58].

2.11. The Phylogenetic Analyses of LTRs in LEPIDOPTERA

The pol-encoded proteins of LTRs were first aligned through T-COFFEE [36]. For the alignments of Gypsy and Pao, aligned sites covered by less than 70% of all TE sequences were removed. FastTree was applied to build the phylogenetic trees for Copia, Gypsy, and Pao [59]. The phylogenetic trees were plotted using FigTree (https://github.com/rambaut/figtree).

2.12. Horizontal Transposable Element Transfer

Due to the large evolutionary distances among the fourteen-selected species, we adopted the genome-wide amino acid distance instead of dS (synonymous substitutions per synonymous site) as the cutoff for identifying HTT. Protein sequences of single-copy orthologous genes that were annotated using BUSCO with core genes of Insecta lineage were aligned using CLUSTALW2 [30] between each pair of species. The amino acid distances were calculated using PAML (aaRatefile = jones.dat) and sorted in ascending order. Since the number of orthologous genes between every two arthropods might be larger than 5000 [60], and our BUSCO analyses might have captured the most conserved ones, therefore, we set the genome-wide cutoff as the 100th minimum amino acid distance between two species, which represents the top ~2% of the total orthologous genes (Table S3). TE proteins were aligned between each pair of fourteen-selected species, and only reciprocal best hits were kept. The amino acid distances of the aligned TEs were calculated as described above. TE pairs with lower amino acid distances than genome-wide cutoffs were selected as HTT candidates.

2.13. Analysis of Transposable Elements Distribution in Arthropods

Genomes of 126 extra insect species were downloaded from the InsectBase (http://insect-genome.com). For each pair of HTT candidates, we aligned them to genomes of all 140 arthropods using the fasta36 (-E 1e-5) program of FASTA [61]. All hits that are longer than 80 bp and have more than 80% similarity were kept.

2.14. The ArTEdb Database

The ArTEdb was written in HTML and PHP and hosted in Apache. All TE information was organized using MySQL in the background. Both gene and TE annotations were embedded in JBrowse. Alignment|Blast uses NCBI BLAST (v2.7.1+) [57] in the background with TE references from 14 arthropods as databases. The alignment results are post processed by xmlBLASTparser (www.github.com/AshokHub/xmlBLASTparser) for visualization. Alignment|RepeatMasker runs RepeatMasker in the background.

3. Results

3.1. Construction of Transposable Element References

Although Repbase [23] provides TE annotations for many arthropods, high-quality TE references are available for only a small subset of the 14 species investigated in this study (Table 1). To obtain high-quality and unbiased TE references, we systematically annotated TEs from genomes of all fourteen species using the pipeline described in Figure 1a. We obtained 87 to 2266 TE reference sequences in a species, which is a considerable improvement compared to the reference TEs previously annotated in Repbase (Table 1). Notably, much higher numbers of reference TEs were identified in the species that have large genomes, for instance, Acanthoscurria geniculata and Locusta migratoria, than the species that have small genomes (Table 1). Eight of the fourteen species had few TEs (≤10) annotated in Repbase, while hundreds of extra reference TEs were identified in this study (Table 1).
The new high-quality TE references inspired us to ask whether TE contents were underestimated in previous studies. To answer this question, we evaluated the repeat sizes and TE contents in the selected species with the new TE references (Figure 1b; Table S1). The results show that repeat sizes were previously underestimated in 11 of the 14 selected species, especially those with few TE references annotated in Repbase. For instance, no TE reference had been reported in A. geniculata (the original genome sequencing study reported that approximately 60% of the genome excluding N/X runs was composed of TEs, but TE references were not available [16]), and the initial repeat masking by RepeatMasker with the built-in Arthropoda library showed that the TE content was only 4.5%. However, 57.17% of the A. geniculata genome was masked using the new TE references, which is very close to the number obtained in the original study. In addition, we masked its full genome and identified extra 950 Mb TEs. Another striking species is Mesobuthus martensii. Because of the limited number of annotated TEs in Repbase, the TE size of this species was previously underestimated to be 35 Mb (3.1%) [7]. Here, we identified 1400 TE references in M. martensii and revealed that approximately half (51.03%; 455 Mb TEs and 17 Mb simple repeats) of its genome consisted of repeats (Figure 1b).
Even for D. melanogaster, whose TEs are well annotated in Repbase, our annotation results still identified another 87 TE subfamilies (8 LTRs and 79 non-LTRs). For example, although Gypsy-1_DSim is a well known LTR in Drosophila simulans, no homologs of this TE have been reported in D. melanogaster. Here we found that the Gypsy-1_DSim TE subfamily has 117 copies in the Y chromosome and another 252 copies (at least six full-length ones) in the other five chromosomes (2L/2R/3L/3R/X) of D. melanogaster (these TEs were named as Gypsy-1_DroMel in our ArTEdb database). Interestingly, the full-length Gypsy-1_DroMel was successfully identified by LTR_Finder and LTRharvest, while RepeatModeler only identified a partial sequence of this TE in D. melanogaster (Figure S1), which suggests that the approach we employ by combining multiple annotation tools is more powerful than using RepeatModeler alone.
In summary, we annotated TEs for fourteen Arthropoda species with the unbiased pipeline and identified many more novel TEs. These high-quality TE libraries might contribute to a better understanding of the evolution and genome contributions of TEs in arthropods.

3.2. Transposable Element Loads Vary Greatly in Arthropods

The huge difference in genome sizes among fourteen arthropods raises the question of how much TEs contribute to their hosts. To answer this question, we masked the genomes of arthropods using RepeatMasker with the new TE references and calculated the TE loads of each species. Hereafter, the TE load is defined as the copy number of TEs in the genome. The loads of multiple TE subfamilies from four main TE classes (TIR, LINE, LTR, and SINE) were summed. Although three (TIR, LINE, and LTR) of the classes existed in all fourteen species, the TE loads varied greatly among species (Figure 1c). The diversity of TEs in arthropods was also reported in a recent study [19]. Next, we will focus on several remarkable insights to show how TEs contribute to genome evolution.

3.2.1. Transposable Element Loss is Prevalent in Hymenoptera

The three Hymenoptera species, namely, Apis mellifera, Apis cerana, and Bombus terrestris, have the closest evolutionary relationship among the fourteen species. The TE load analysis reveals that these three species have fewer TEs than other species except for T. urticae (Figure 1b–c). Especially in the first two species, the repeat sequences account for less than 10% of the host genome, and the real TE content is even lower than 5%. Although we observed several LTRs and LINEs, none of them had coding potential. Only a few Mariner (DNA/TcMar) TEs have intact ORFs, consisting with the previous study [8]. Comparing TE loads in A. mellifera and A. cerana with those in the remaining species, we observed that the TE loss occurred rapidly in A. mellifera and A. cerana. These two evolutionarily close species had a slight difference in their TE loads, and both the subfamily numbers and the TE loads were significantly reduced (Figure 1c). However, in B. terrestris, most TE subfamilies could still be observed, and repeats occupied approximately 13.5% (simple repeat < 2%) of its genome. These results reveal that the extent of TE loss is highly diverse among Hymenoptera and somewhat weak in B. terrestris.

3.2.2. Recent LTR Expansion in T. urticae

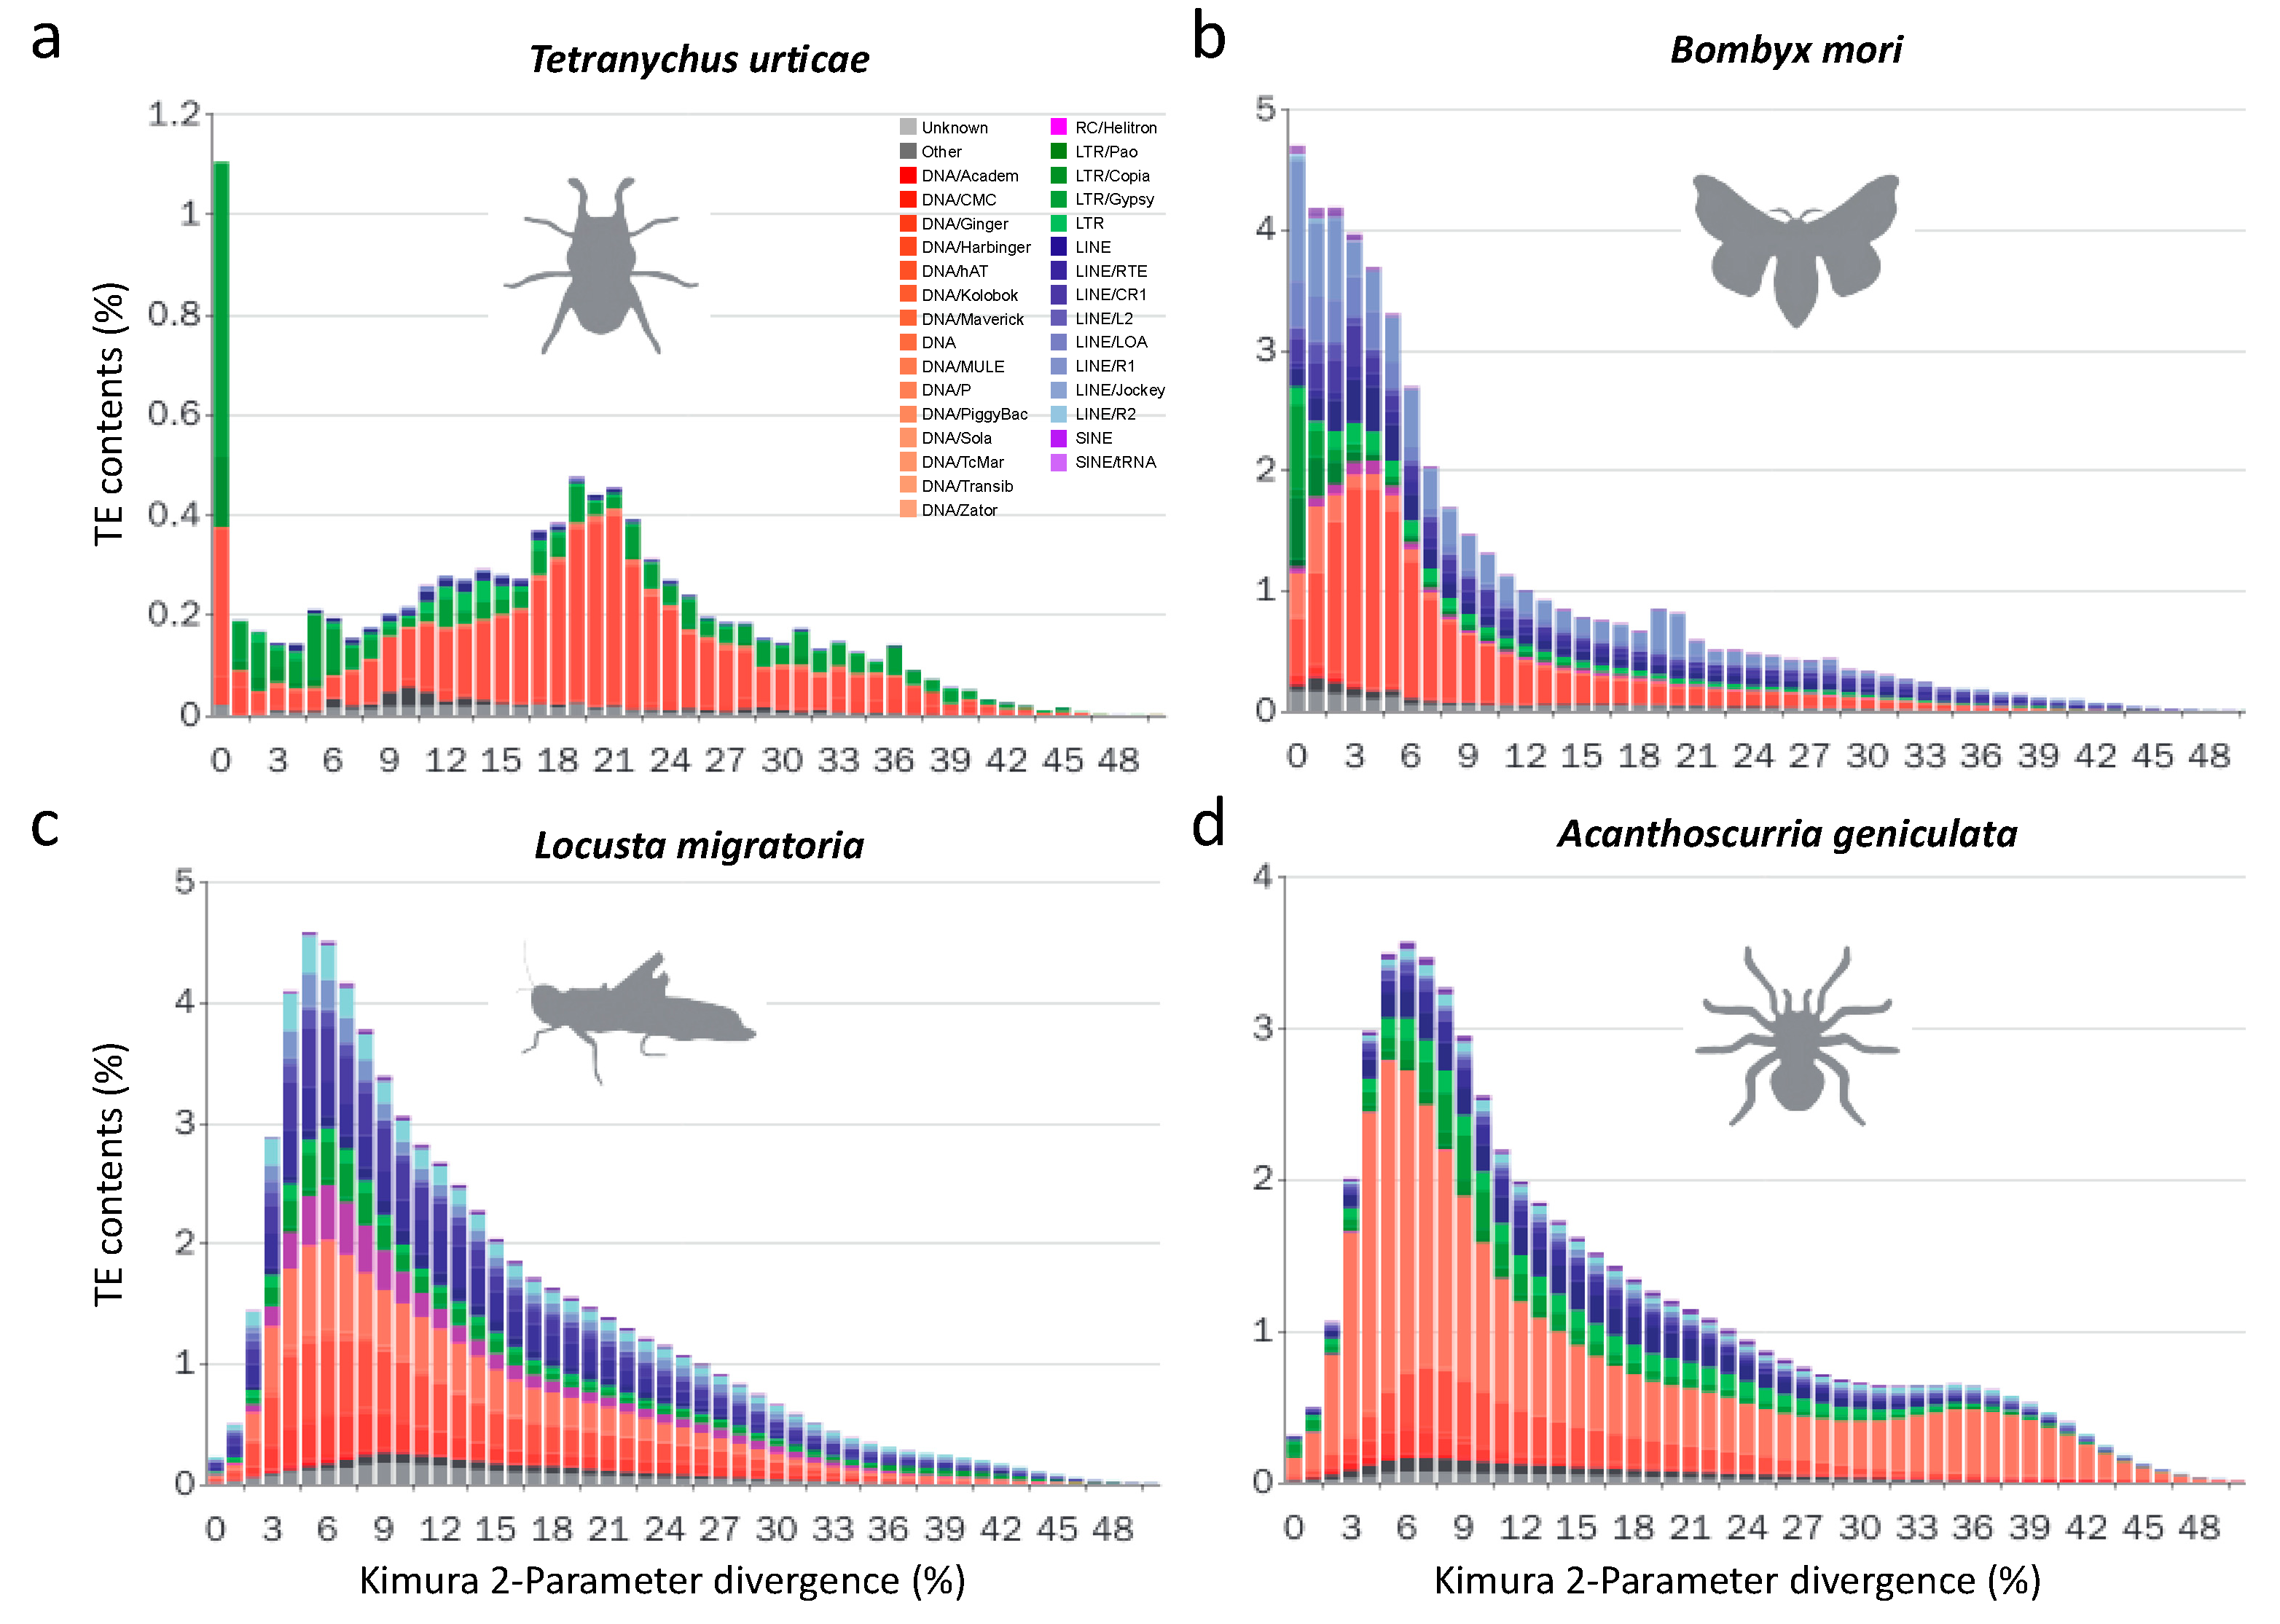
In addition to these two Hymenoptera species (A. mellifera and A. cerana), T. urticae, which has the smallest genome (90 Mb) among the fourteen species, also has fewer TE subfamilies and loads than the remaining species. In T. urticae, TIR is the most abundant class (5.8%), followed by the LTR class (2.9%), while the remaining two classes (LINE and SINE) are quite scarce (<0.5%). A total of 12.4% of the genome of this species consists of TEs (with 2% simple repeats), and the distribution of the sequence divergence presents two distinct peaks (Figure 2a), which is very different from the other species (Figure 2b–d). The first peak in T. urticae is from 0% to 1%, and the second one is from 20% to 24%. LTRs are the major component of the first peak, which implies that there is a recent expansion of LTRs in T. urticae. For instance, the Gypsy-6_TetUrt has at least eight full-length copies. In contrast, the second peak mainly consists of TIRs, which suggests that most TIRs expanded historically and might have diverged thereafter.

3.2.3. Lepidopterans Have Diversified Transposable Elements Subfamilies and Large Transposable Elements Loads

For all four Lepidoptera species (Bombyx mori, Melitaea cinxia, Papilio xuthus, and Spodoptera frugiperda), there are hundreds of TE subfamilies in their genomes. Among these species, B. mori has the most abundant TE subfamilies and the largest TE loads (Figure 1c). More than half (51.26%; Table S1) of its genome is occupied by TEs, which is consistent with a previous report [11]. Compared with the three-remaining species, B. mori also has the largest genome (Table 1). In addition, the TE divergence distributions of this species show distinct patterns. In B. mori, LTRs, TIRs, and LINEs all fall into the 1–10% range, especially the LTRs, almost all of which are located in the 1–5% range (Figure 2b). These results suggest that most LTRs are active and have expanded recently in B. mori. However, a distinct distribution is observed in S. frugiperda, the evolutionarily closest species to B. mori among the 14 selected species. The distribution resembles a classical normal distribution with a peak near 10% (Figure S2A). A similar distribution is observed in M. cinxia (Figure S2B). These results suggest that the expansion of TEs are mostly ancient in both S. frugiperda and M. cinxia. Notably, P. xuthus shows a bimodal distribution of TE divergence: one peak is caused by the recent expansion of TEs (the divergence peak is ~4%), and another peak is caused by the historic expansion of rolling circle (RC) TEs (the divergence peak is ~13%, Figure S2C). Altogether, our results suggest that the TE expansion histories in Lepidoptera are diverse.

3.2.4. The Evolutionary History of LTRs in Lepidoptera

Bombyx mori has the most abundant LTRs among the four Lepidoptera species, and the sequence divergence distribution reveals that most LTRs are accumulated due to recent expansion (Figure 2b). However, fewer LTRs are found in the three-remaining species (M. cinxia, P. xuthus, and S. frugiperda; Figure S2A–C). This finding promotes us to ask when, where and which LTRs were gained or lost in Lepidoptera. To further explore the details of the evolutionary history of LTRs, we selected intact LTRs and constructed their phylogenies. We annotated proteins of all LTRs and built phylogenetic trees for all three main LTR subfamilies (BEL/Pao, Copia, and Gypsy).
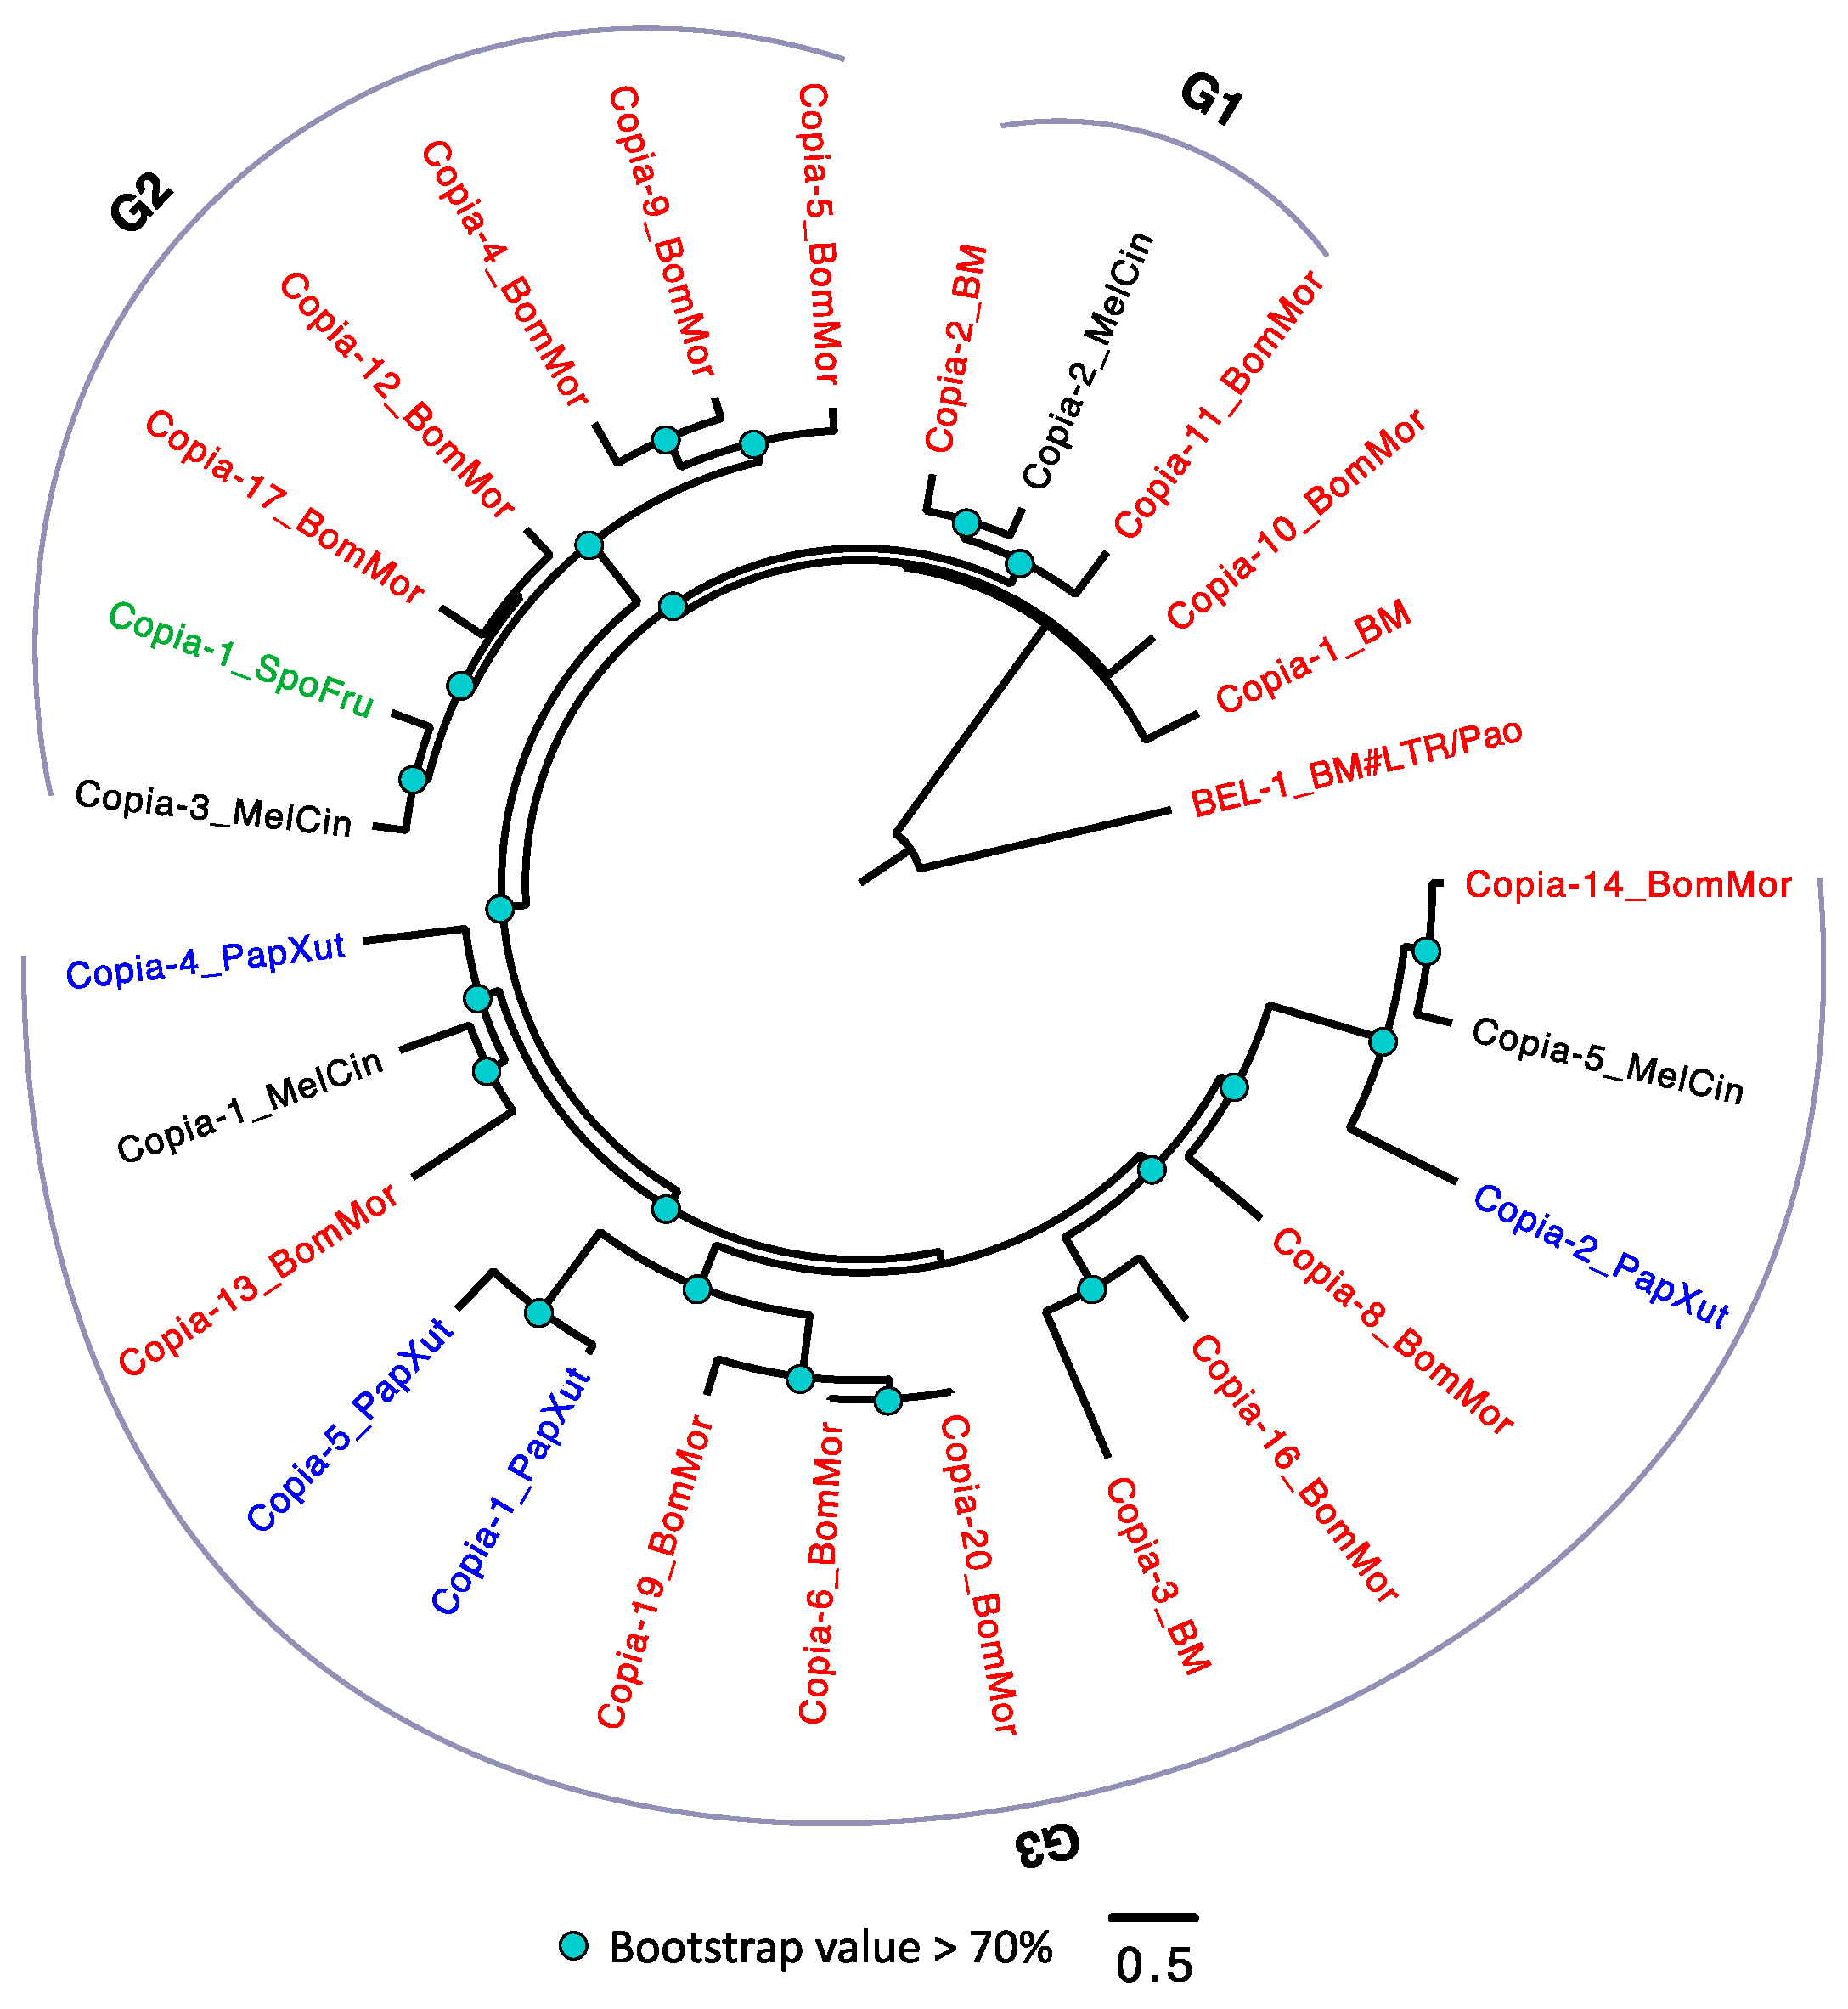
Unlike the TEs in D. melanogaster that had been well studied and classified into detailed subfamilies [62,63], the family information of LTRs in Lepidoptera are still lacking. Therefore, we arbitrarily divided the Copia into three groups (G1–3) according to the phylogeny (Figure 3). Among the four species, S. frugiperda has the smallest number of Copia (only one member in G2), while B. mori has the largest number of Copia. Within each group, we frequently detected expansion of Copia in B. mori. For example, we observed a pair of TEs (Copia-6_BomMor and Copia-20_BomMor in G3) with extremely low amino acid substitution level in B. mori, suggesting that these two could be recently duplicated. Although each of the four species has Copia in their genomes, none of the three groups has Copia detected in all the four species. A parsimonious explanation is that some Copia copies might be lost in a species-specific manner, although we cannot exclude the possibility that the phylogeny is solely caused by TE duplications followed by sequence diversifications.
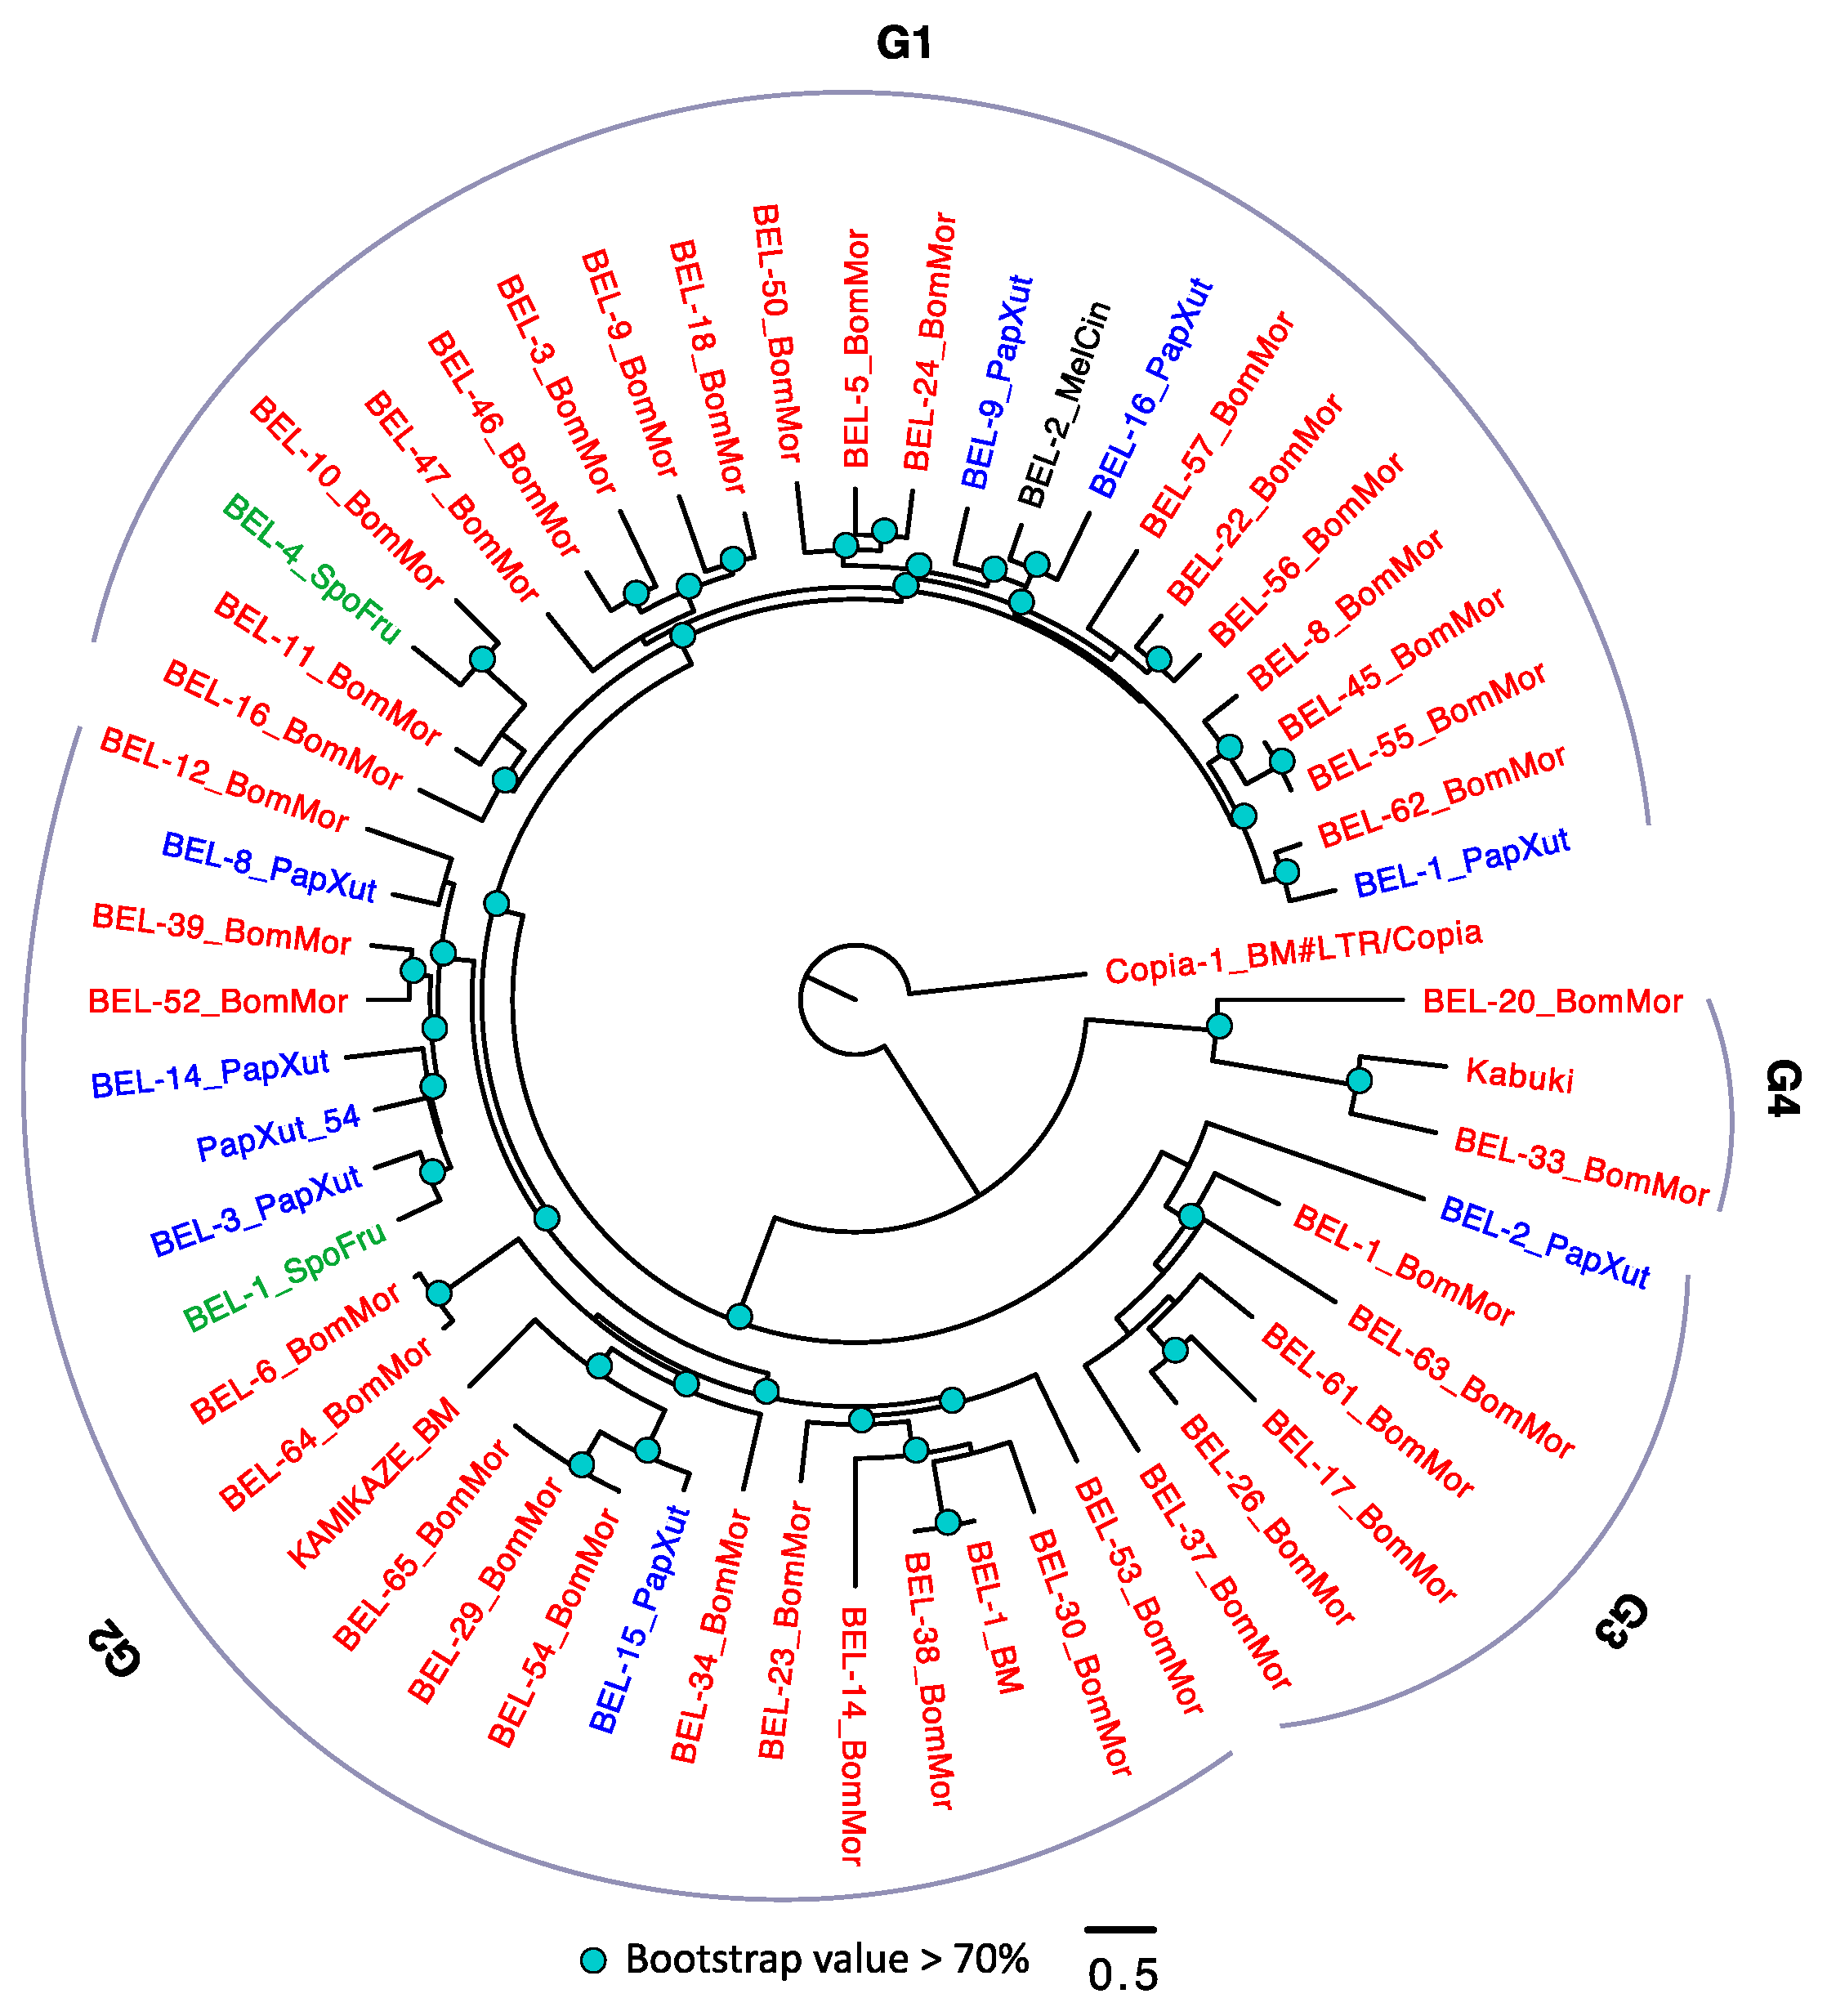
In the BEL/Pao subfamily phylogeny, there are four large groups (Figure 4). Similar to Copia, B. mori also has the largest number of TEs, followed by P. xuthus. We frequently observed intraspecific diversifications of BEL/Pao (with extremely small amino acid substitution rates) in B. mori. It is also possible that the disparity of BEL/Pao contents in the four species are caused by the loss of BEL/Pao in certain species, although further studies are required to verify this pattern.
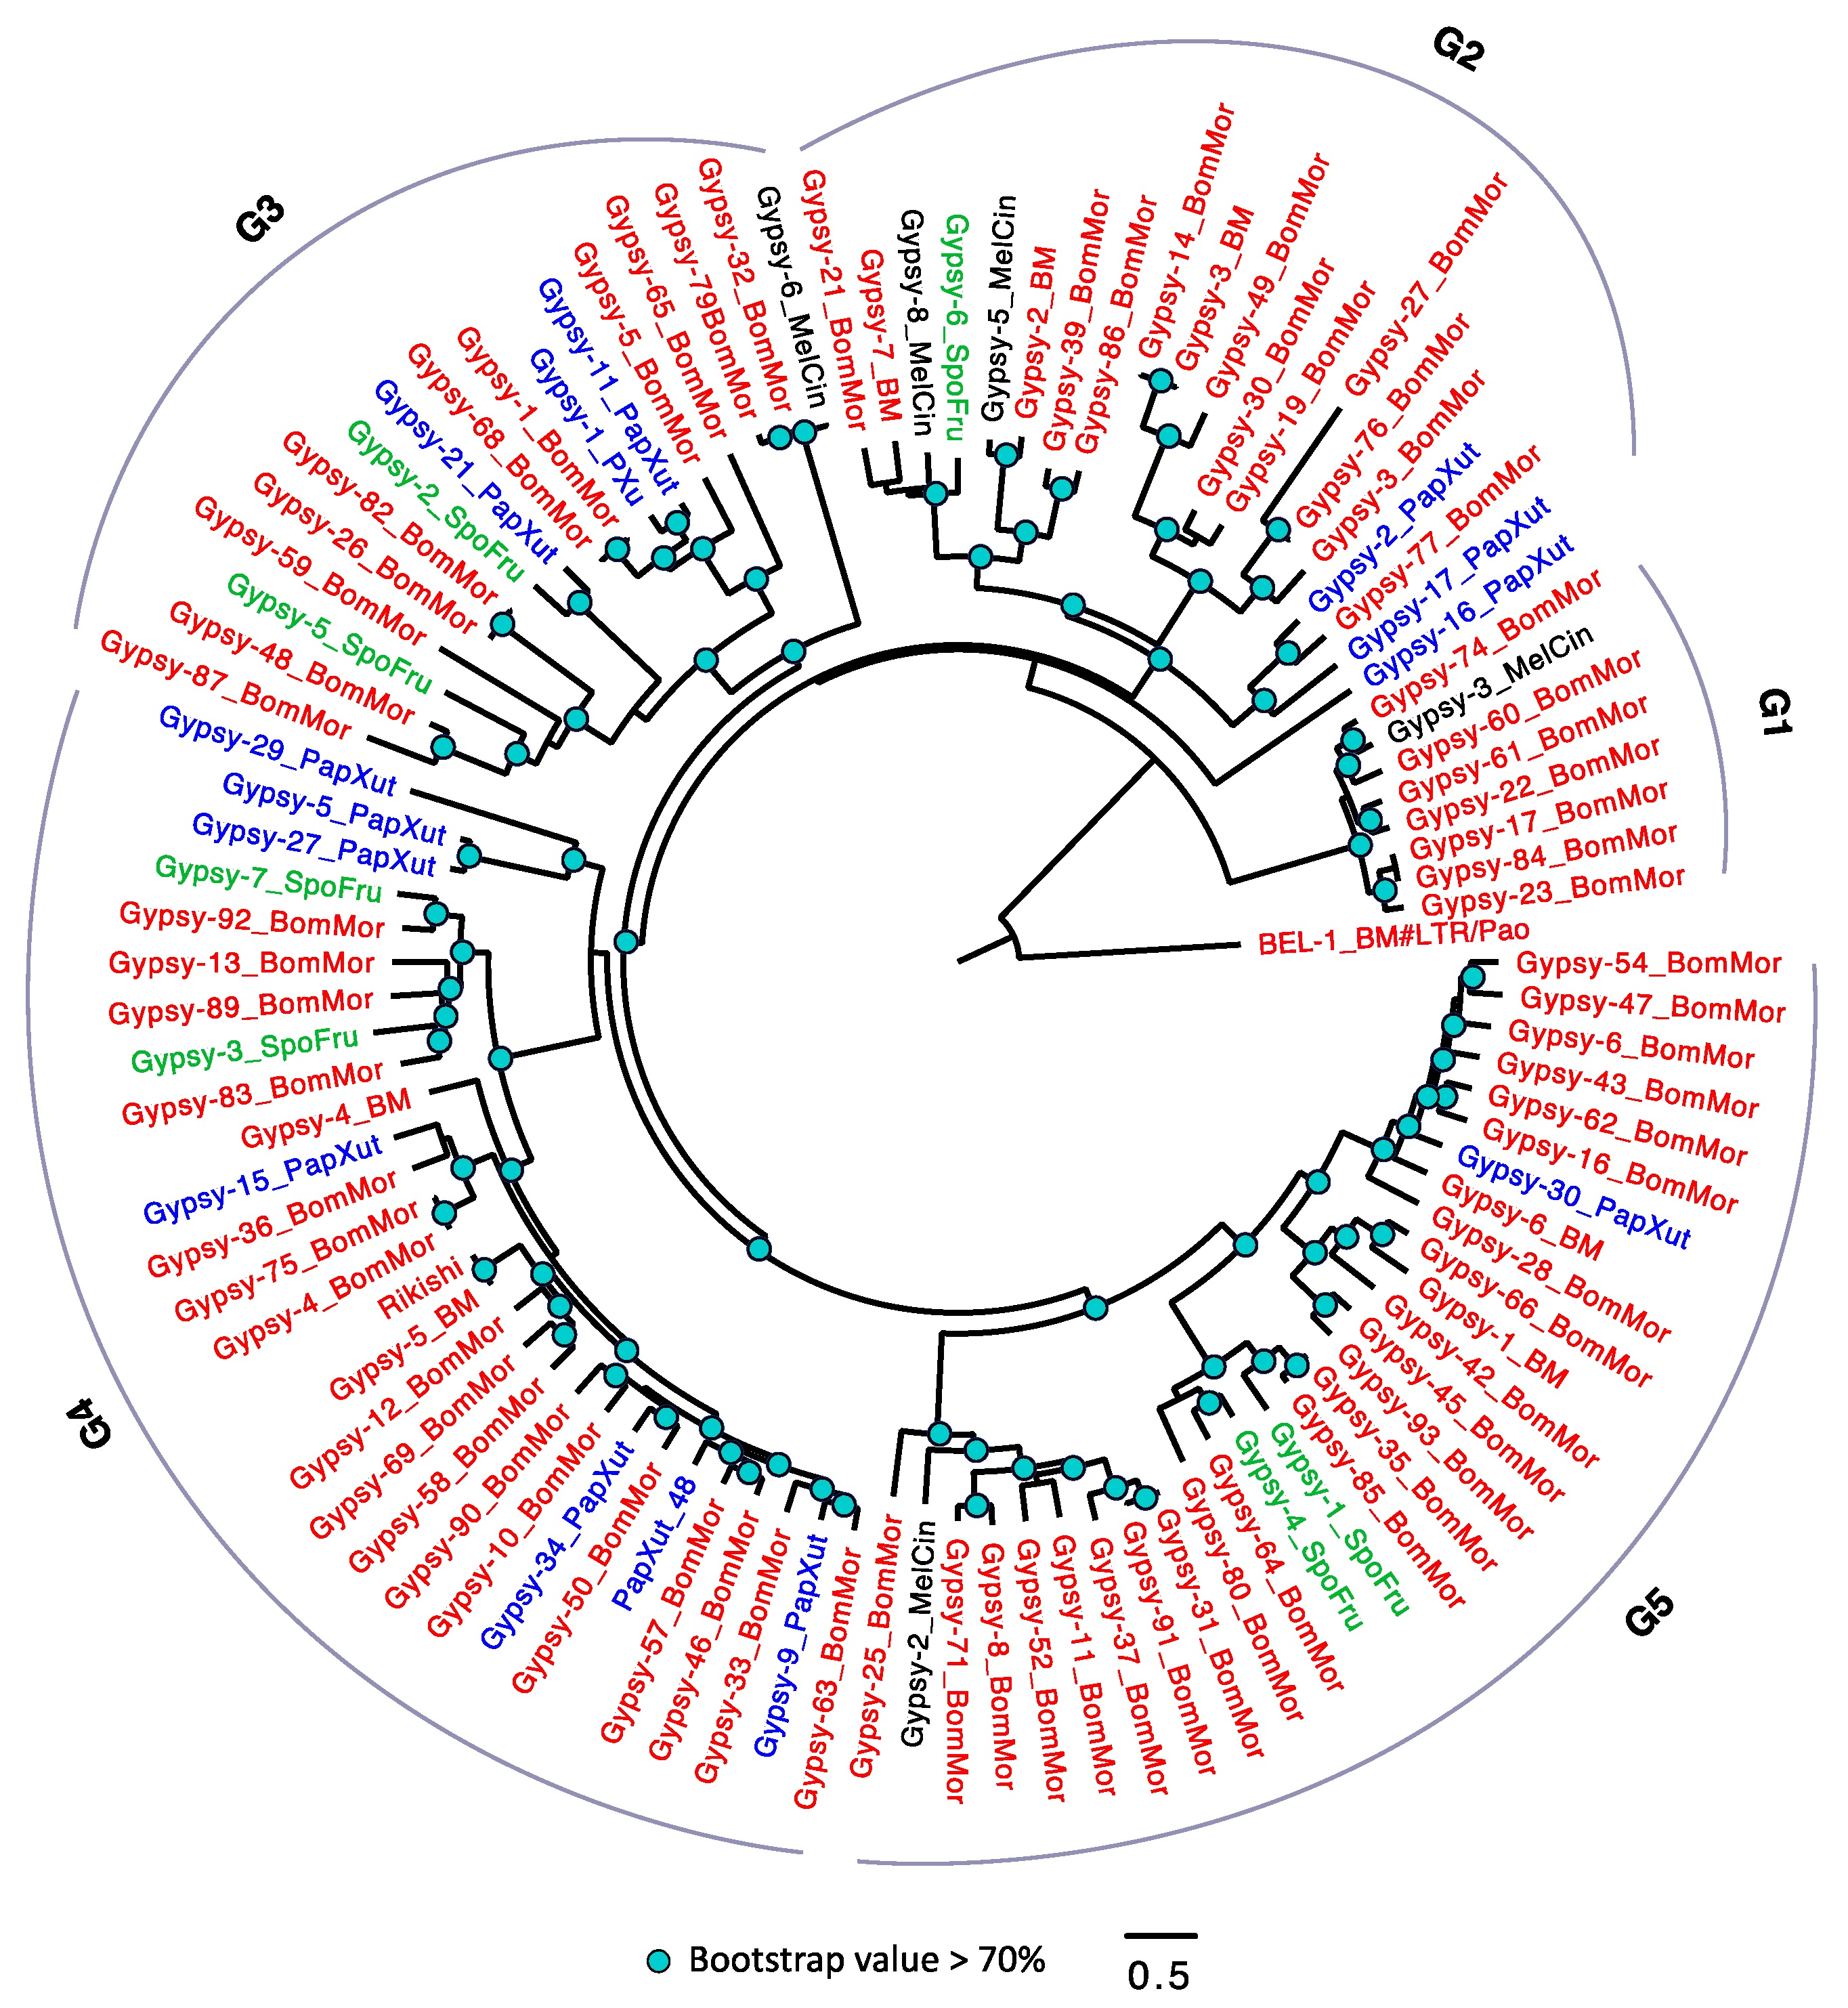
The comparison of the TE contents and loads of Lepidoptera revealed that Gypsy was most abundant among the three LTR families (Figure 1c, Figure 2b and Figure S2A–C). This family might have the most substantial effect during LTR evolution in Lepidoptera. The Gypsy phylogeny (Figure 5) reveals three major conclusions. First, B. mori has the most abundant Gypsy TEs. Second, there are extensive diversifications of Gypsy in B. mori and P. xuthus. Third, we observed one horizontal transfer event between B. mori and M. cinxia (in G3). The amino acid distance between Gypsy-6_MelCin and Gypsy-32_BomMor is small (0.052). Considering the long divergence time between B. mori and M. cinxia (the amino acid distance cutoff between these two species is 0.065; Table S3), the small amino acid distance mostly conflicts with the evolutionary history, confirming the HTTs might be bona fide.
Altogether, our results suggest that LTRs evolve expansions and contractions, or intraspecific sequence diversification. All these processes combined to form the current LTR patterns in Lepidoptera.

3.2.5. Non-LTR Transposable Elements Contribute More to Arthropods with Larger Genomes

Given that TEs exist in and occupy large sections of Arthropod genomes, we ask how the genome sizes dynamically change due to TE difference. Interestingly, we found the content of TIR (%) in one arthropod genome is positively correlated (Pearson’s product-moment correlation: 0.899, p < 0.0001) with the genome size (Table S4). In addition, the LINE superfamily shows high abundance in L. migratoria (Figure 1c), which may have resulted from the recent rapid expansion of this family (Figure 2c). When the divergence distribution is considered, in L. migratoria and A. geniculata, the peaks are all close to 6% (Figure 2c,d), suggesting that most of the identified TEs have accumulated recently during their evolutionary history. This pattern suggests that most TEs in their genomes were recently generated through rapid TE expansions.
Altogether, our results show that TE loads vary greatly among arthropods and reveal that the gain and loss of non-LTR TEs are much more prevalent in arthropods than previously thought. The very recent study reported similar conclusions [19], while the underlying causes of diversified TE and lineage-specific activity were not mentioned. Here, we analyzed the TE dynamics of species from the same orders (Hymenoptera and Lepidoptera) or with extremely large genome sizes. The results reveal that rapid extinction, intraspecific diversification, and HTT are the internal driving forces of the diversity of TEs in arthropods.

3.3. The Expansion and Contraction of Transposable Elements in Arthropods

RNAi is a critical mechanism to inhibit TEs transposition and hence reduces TE loads in metazoans [65,66]. Besides RNAi, the difference in life history, mating system, GC contents have been suggested to account for the difference in TE loads across species [51]. However, the study of long-term TE evolution in 42 nematode species suggest that genetic drift rather than life history or RNAi mainly determined the evolution of TEs [51]. In addition, the authors tested load changes of four main TE classes and found several “expansion hotspots” in the most dynamic LTR TEs [51].
Given the disparity of TE loads across the 14 arthropod species we studied, here we explore the expansion and contraction of TEs in arthropods. We first used phylogenetic comparative analysis to explain the TE diversity over long-time scales. The phylogeny of the fourteen-selected species was inferred using single-copy orthologous genes and time-calibrated using r8s [41]. We evaluated the phylogenetic signals of traits (TE loads and genome sizes transformed in natural log(Ln)grams) using the λ model with phytools [43,50]. The λ is from 0 to 1, and greater values imply stronger phylogenetic signals (trait is highly related to the phylogeny and not random). Most of the kept traits (24/27) have λ values larger than 0.5 (Table S2), indicating that they are highly associated with the phylogeny. To determine the most appropriate comparative model, we fitted four standard phylogenetic comparative models (BM, OU, EB, and white) for the above traits using Geiger. We used both AICc and the weighted AICc (AW) to assess the fitness of the four models. The results showed that the BM model was most suitable (Table S2). Therefore, TE loads of ancestor nodes were inferred using the maximum likelihood method [67] under the BM model.
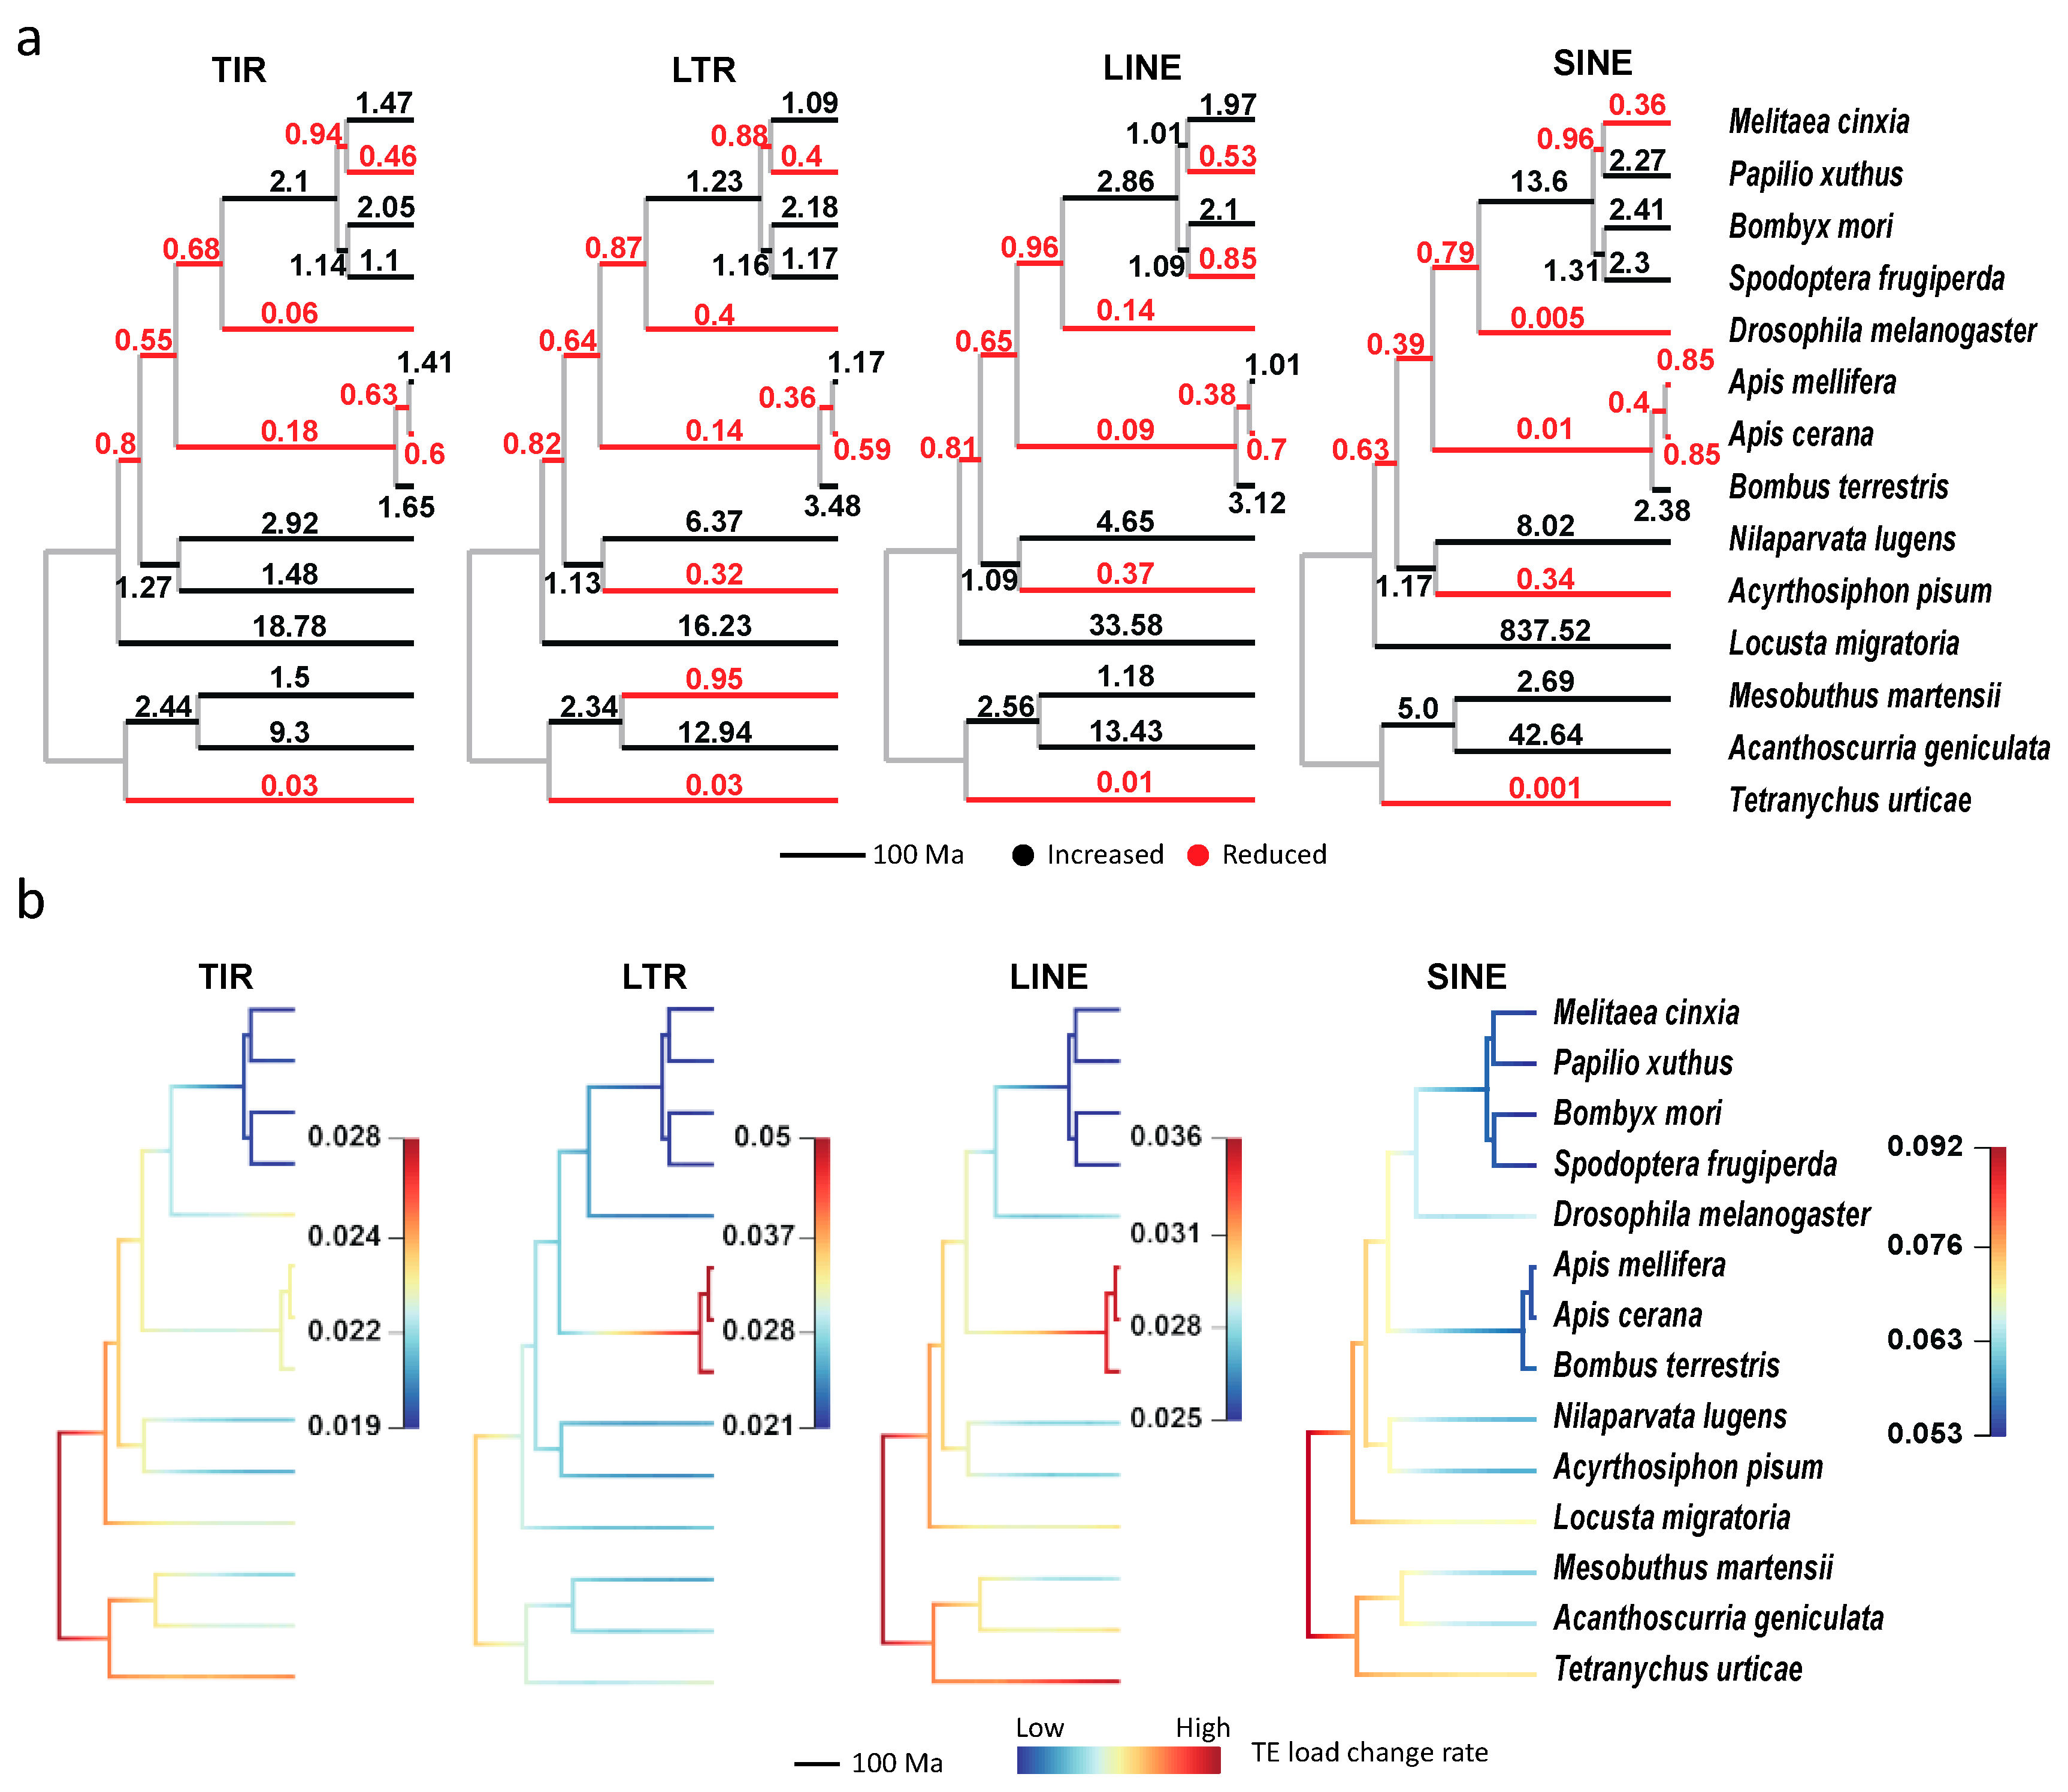
We found TE expansion (the black branches) and contraction (the red branches) hotspots in all four main TE families (Figure 6a). Although the expansion hotspots (with large change ratios) are slightly different among the four TE classes, most of them are enriched in L. migratoria, A. geniculata, N. lugens and B. mori, which is consistent with their TE divergence distributions (Figure 2b–d). Moreover, the genomes of all four species are larger than those of closely related species. Besides, the TE contraction also broadly exists in all four classes, and the most significant species are T. urticae, D. melanogaster, and the three bees.
The above results suggest that the changes of TE loads were highly variable during arthropod evolution. Therefore, we applied BAMM to analyze the dynamical change of evolutionary rates for TE loads under the phylogeny. In Figure 6b (so-called phylorate plots), although no shift of TE loads evolutionary rates is in all the four classes, the evolutionary rates are broadly variable among both TE classes and clades. Among the four classes, SINE has the highest rates, while TIR has the lowest ones, which helps to explain the largest TE loads variants of SINE (Figure 1c) in arthropods. The rates in Lepidoptera clades are broadly lower than the remaining ones, consisting with their low TE loads changes (Figure 6a) relative to ancestor nodes. Besides, three branches (the root branch, T. urticae, and Hymenoptera clades) have higher rates than the other branches in TIR, LTR, and LINE classes (the root branch and T. urticae clade are also higher in SINE). In addition, evolutionary rate dynamics of three representative subfamilies (Figure S3; Jockey, Mariner, and Gypsy) were also evaluated, and the results also supported that evolutionary rates were high in the Hymenoptera clade (shift events were identified in Jockey and Gypsy). These results reveal that the TE loads had rapidly changed at the early radiation of insects and arachnids, and the TE loads change rates could be branch-specific instead of underlying constraints.

3.4. Transposable Element Loads are Significantly Correlated with Genome Sizes

Transposable element contents have been reported positively correlated with the genome sizes in eukaryotes [20,68]. TE contents and the number of subfamilies were found to be correlated with host genome sizes in arthropods [19], indicating that the genomes with larger sizes also have greater TE contents or more TE subfamilies. However, TE contents and the subfamily numbers might be a little more variable than TE loads due to the influences of the large variation of host genome sizes in arthropods. Here, we evaluated correlations between TE loads and TE contents and genome sizes. The results showed that both of these two are positively correlated with genomes sizes and the TE loads (Pearson’s product-moment correlation: 0.92; p = 2.76 × 10⁻⁶; Figure S4A) have a greater correlation coefficient than TE contents (0.71; p = 4.92 × 10⁻³; Figure S4B).
The quantitative traits in species from a branching phylogeny are not statistically non-independent due to common ancestry, and the PICs should be conducted [69]. We evaluated the correlations between loads of TEs from multiple subfamilies and host genome sizes. As shown in Table 2, our results show that many TE subfamilies are positively correlated with host genome sizes. Especially, the most abundant Mariner (TcMar) subfamily is significantly correlated with the corrected p < 0.1. In addition, we also evaluated the correlation between the total TEs of four main families and genome sizes. All the four classes are positively correlated with host genome sizes, for which the corrected p < 0.1 (Table S5). After combining all TEs in each species, we observed that total TE loads were also significantly correlated with genome sizes (Pearson’s product-moment correlation: 0.83; p = 4.74 × 10⁻⁴; Table S5). This result is consistent with the PIC analysis in a recent study [19]. Unlike the TE contents used in the previous study, we used TE loads which might reflect TE abundance in host genomes a little better. Although only 14 species used in this study, the TE loads showed a much stronger correlation than TE contents. Our results reveal that TE expansion is one of the most critical forces driving changes in the sizes of host genomes, which is also consistent with previous reports in flies [22], birds and mammals [21].

3.5. Horizontal Transposable Element Transfer in Arthropods

TEs can be transferred by vertical inheritance or horizontal transfer. P-element is the first reported and the most famous HTT in Drosophila [70] and is the genetic basis of P-M hybrid dysgenesis in D. melanogaster [71]. HTT is associated with many phenotypic changes in plants [72]. A recent study identified thousands of HTT events in Insecta [73], and these transferred TEs might be important in driving genome evolution [74]. Here, we identified millions of TE copies from thousands of subfamilies in fourteen arthropods. We asked whether HTTs had been involved in TE evolution, especially in species with large genomes. To solve this problem, we proposed a strategy with which to identify HTTs using genome-wide amino acid distances. Amino acid distance has been widely used in phylogenetic studies, and a smaller distance implies a higher sequence similarity. We expected the amino acid substitution rate of TE (evolving mostly neutrally or being counter selected, thus being permissive to dN substitutions) to be higher than orthologous genes (more conserved with a higher rate of negative selection). Therefore, the vertically inherited TEs will have larger amino acid distances than orthologous genes. On the contrary, TEs with lower amino acid distances could be HTTs.
Considering the variable quality of gene annotations in the selected species, we used the BUSCO tool with the built-in Insecta core genes library and annotated genes in all selected species. Using the single-copy homologous genes, we inferred the genome-wide amino acid distance cutoffs (Table S3; see details in Materials and Methods) for each pair of fourteen species. Annotated TE proteins were aligned between each pair of species. The amino acid distances of aligned TE pairs were calculated and compared with the genome-wide cutoff, which was defined as the 100th minimum amino acid distance between two species. According to the recent study in 76 arthropods, the number of genes that present in more than 75% Metazoans are all larger than 5000 [60], which implies that the number of orthologous genes between most arthropods might be larger than 5000. In this study, we set the genome-wide cutoff as the 100th minimum amino acid distance between two species, which equals to at most 2% of the total orthologous genes.
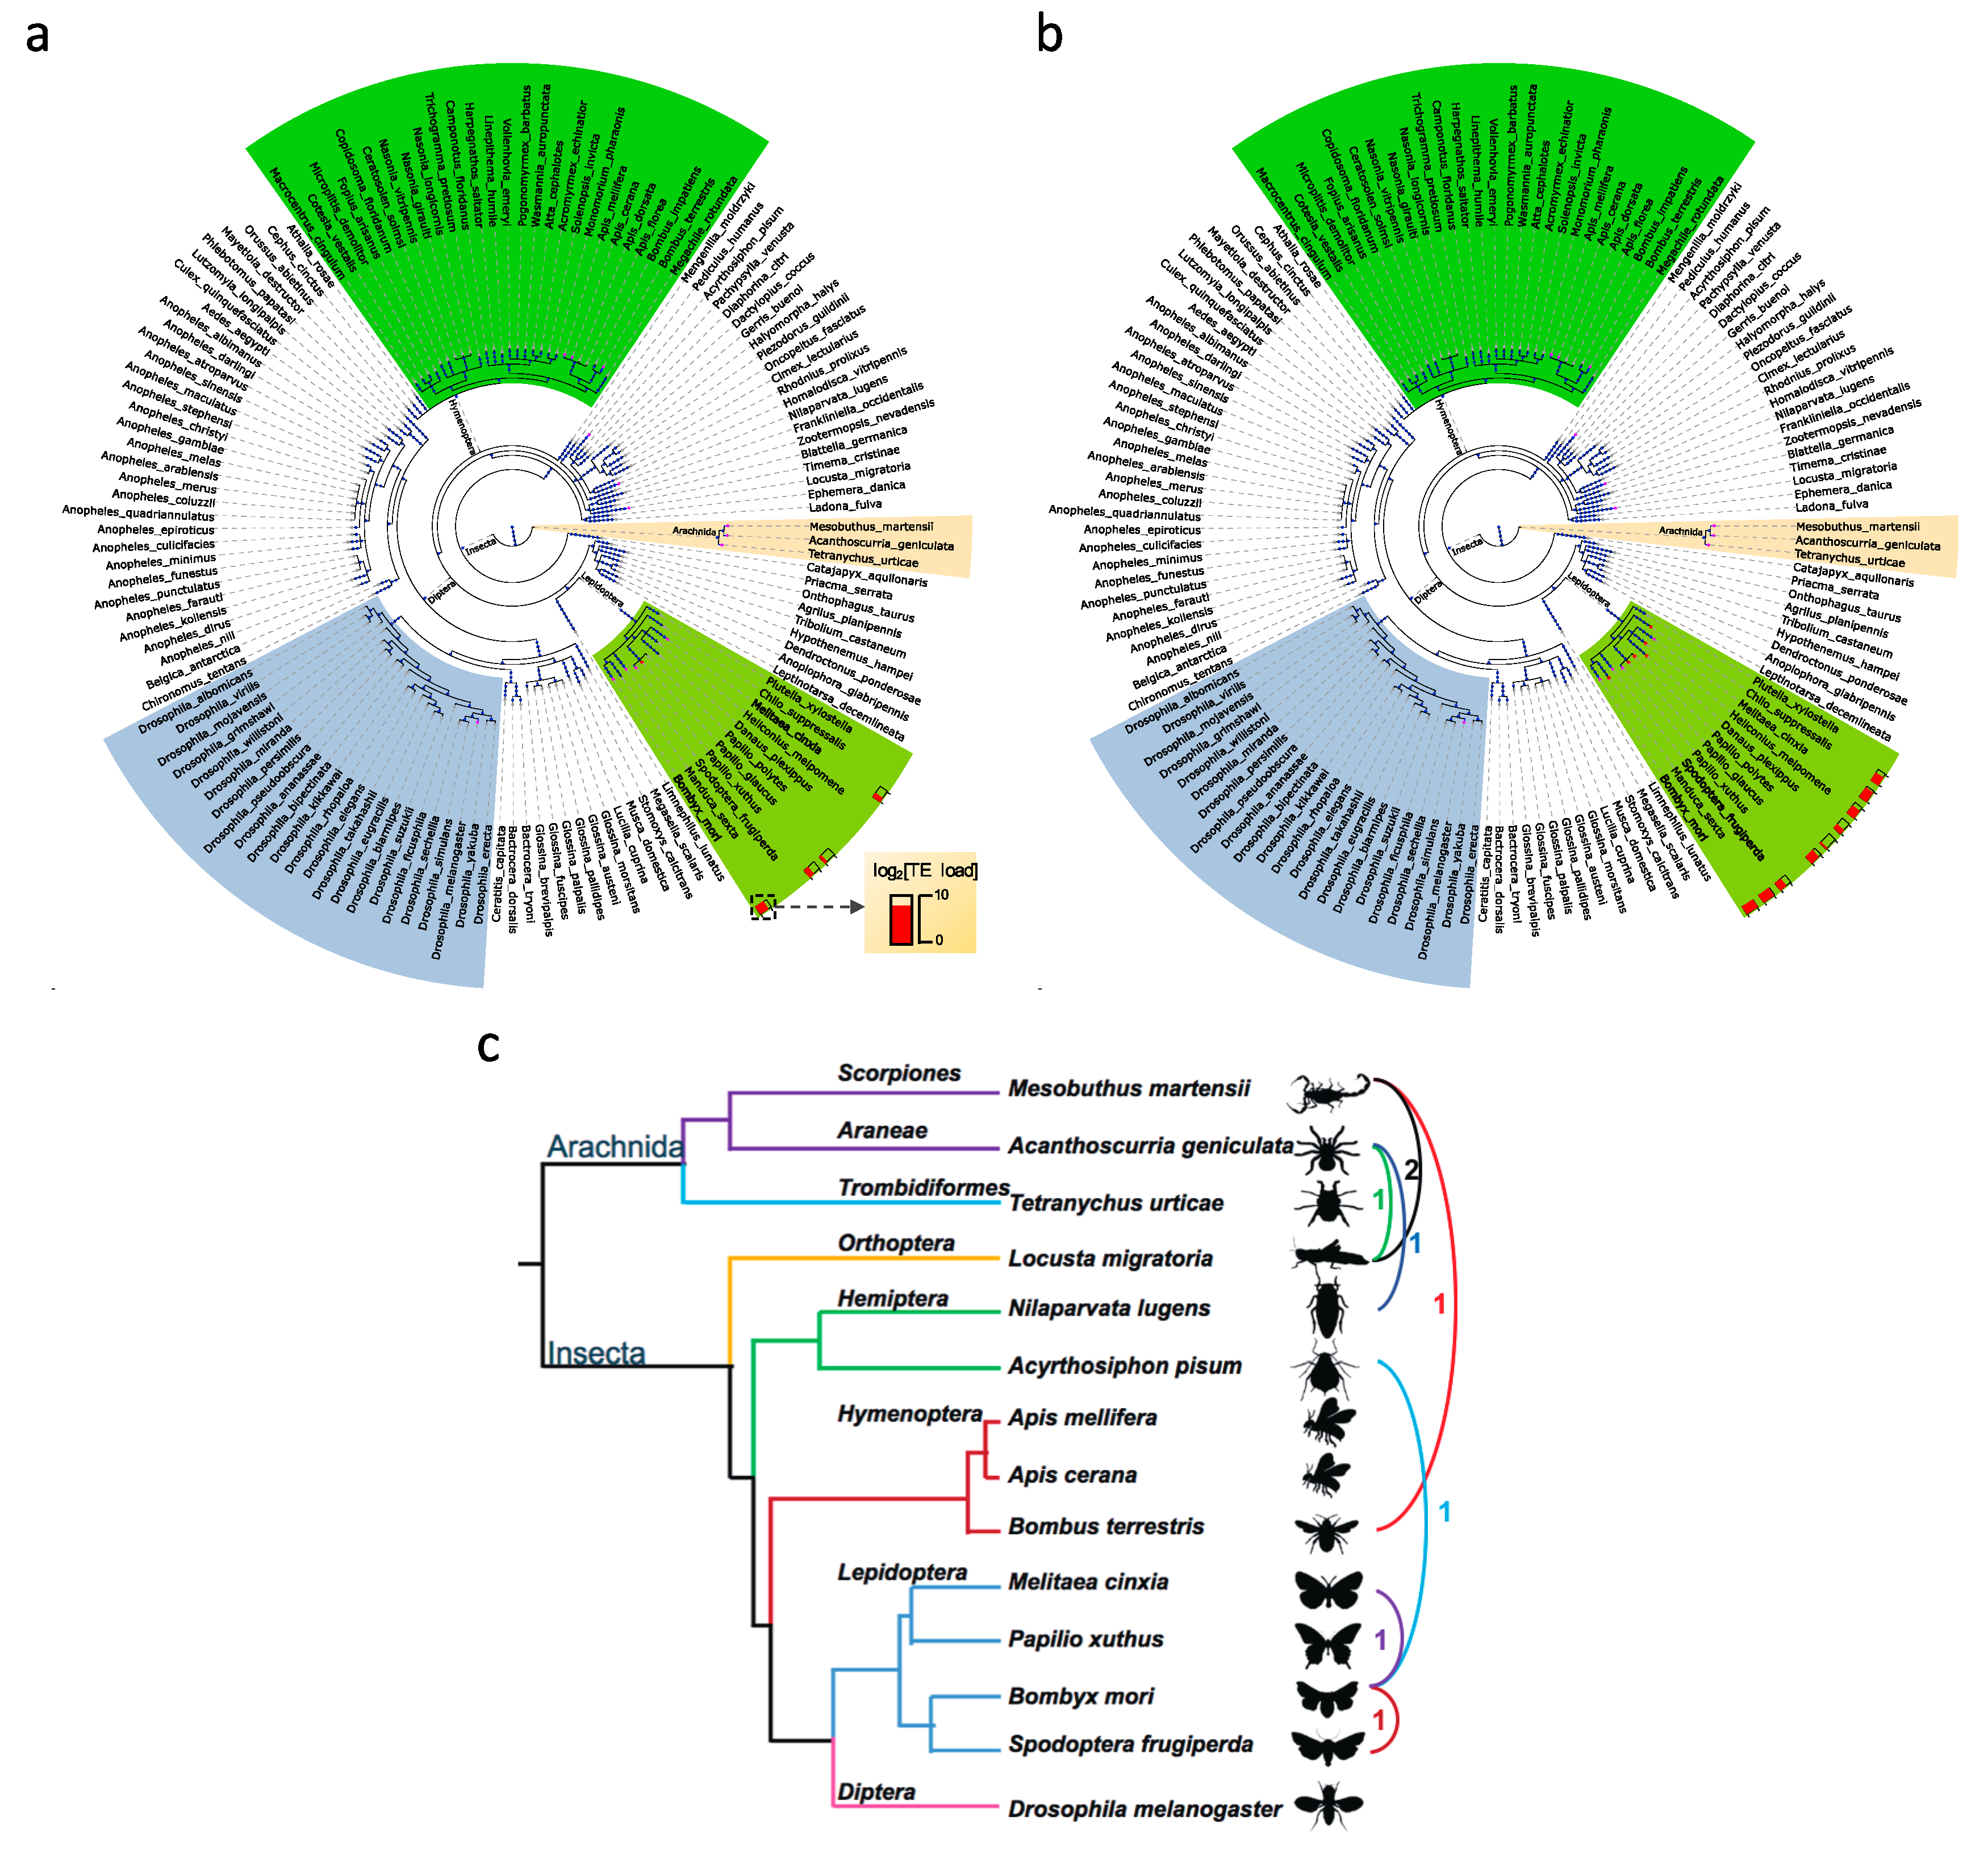
We obtained eight candidate HTTs among nine species (Figure 7a,b and Figure S5; Table S6), and their protein alignments are in Supplementary File S2. All of them are best reciprocal hits between corresponding species. Two of them are from the Gypsy subfamily. Six of them are TIRs from the hAT-Tip100 (n = 1) and Mariner (n = 5) subfamilies. The Class II (TIR) TEs are the most frequent HTTs, consisting with previous reports in arthropods [73,75]. The Class II TEs tend to be shorter than Class I TEs, besides their transpositions have weak host dependence [76]. These might help to explain why the Class II (especially the Mariner subfamily) have the most abundant HTTs.
In Figure S6A–C, two HTT examples are depicted. These two HTTs all have amino acid distances (the blue line) lower than the genome-wide cutoffs (the gray line). The horizontal transfer event between Gypsy-6_MelCin and Gypsy-32_BomMor is confirmed because the amino acid distance between them is 0.054, which is lower than the cutoff (0.065) between B. mori and M. cinxia, which is consistent with the phylogenetic analysis of Gypsy in Lepidoptera (Figure 5). Besides, these two TEs only appear in four of 140 arthropods (Figure 7a), which implies that the high sequence similarity between them are resulted by horizontal transfer instead of vertical inheritance. Another example is the Mariner HTT between B. mori and S. frugiperda (Figure 7b). The amino distance between TEs is 0.034 which is lower than the genome-wide cutoff 0.047 (Figure S6C; Table S3).
The exact number of HTTs between these species might be underestimated (i) because several TEs were not annotated due to the methodological limitations and low-quality genome assemblies and (ii) because of the strict cutoffs used in HTT identification. Besides, six HTTs were identified in five species (A. pisum, A. geniculata, L. migratoria, M. martensii, and N. lugens) with genomes larger than 500 Mb (Figure 7c). Considering the large genomes and the TE loads in these species and other arthropods, our and previous results [73,75] both support that HTTs played important roles during their genome expansions and might be another important driving force of genome evolution.

3.6. The ArTEdb

Database technology has been widely used in biological data sharing, especially in the field of TE research (recently reviewed [77]). Several databases provide TE annotations or repeat-masking results [23,24]. Here, to make new TE references and annotations easy to use and contribute to TE studies in arthropods, we set up the ArTEdb. It consists of four main categories: (1) TE landscapes in 14 arthropods, (2) TE references, annotations and downloading of premasked genomes, (3) TE querying based on keywords and sequence similarity, and (4) an online repeat-masking service.
We summarized TE annotations and generated an overview of TE contents for each species. The TE contents were organized by both subfamilies and sequence divergence between each TE copy and TE reference. We provide two methods for querying TEs. People can look up TEs by name, subfamily, and class. Alternatively, one can also use a sequence to search the TE database directly with BLAST. The genome browser helps visualize genomic features more intuitively. We integrated the JBrowse genomic feature visualization tool into the ArTEdb. Using this tool, people can focus on genes or other genomic loci rather than masking repeats by themselves. In addition, we provide an online repeat-masking service, which is very useful for people who want to scan TEs from just a small number of sequences quickly. Finally, all TE annotations and premasked genomes can be downloaded from the ArTEdb directly. We hope that the ArTEdb will benefit future TE studies in arthropods.

4. Discussion

In this study, we chose 14 representative arthropods spanning eight orders to study the coevolution between TEs and host genomes. Using our customized TE annotation pipeline, we both generated high-quality TE references and estimated the TE profiles in these species.

4.1. A New Database of High-Quality Transposable Element References for Arthropods

Characterizing TEs in an unbiased approach is an important task for the non-model organisms. Although Repbase is extensively used for TE identification and annotation [23], the TE reference sequences might not be complete for many non-model organisms. Therefore, many TE annotation tools have recently been developed for unbiased TE characterization [26,27,28,31,77]. In this study, we built an unbiased TE annotation pipeline (Figure 1a) by combining different TE identification and classification tools. We also present our reference sequences in the ArTEdb database, which provides useful resources for TE annotations in other arthropod genomes.
A very recent study [19] have extensively characterized TEs in the arthropod genomes with the RepeatModeler pipeline. RepeatModeler aims to identify sequences with high-copy numbers in genomes, which is suitable for identifying most types of TEs. However, RepeatModeler does not take into account the structural characteristics of TEs, and sometimes it does not perform as well as the family-specific tools. For example, the novel TE Gypsy-1_DroMel was identified by both RepeatModeler and two LTR-specific tools (LTR_Finder and LTRharvest). The sequence alignment indicates that RepeatModeler only identified a partial sequence of Gypsy-1_DroMel, while the combined approach we used (combining RepeatModeler, LTR_Finder, and LTRharvest) successfully identified the full-length Gypsy-1_DroMel (Figure S1). Besides TE identification, our ArTEdb database also significantly improved the annotation of TE family information. As RepeatModeler only uses sequence similarity to known TEs in TE classification, most TEs identified by RepeatModeler remain unclassified [19]. In this study, we also used PASTEClassifier [32] and TEclass [33] to annotate the identified TEs. PASTEClassifier takes full use of known TEs (Repbase) and domain annotations (Pfam and Gypsydb), and TEclass utilizes the supporting vector machine based on oligomer frequencies of repeats. These comprehensive classification methods make almost all the TEs be classified at least in class-level. Therefore, our study provides TE profiles with better annotation information.

4.2. Why Does the Transposable Element Loads Can Be So Different Across Arthropod Species?

Previous studies show that TEs gain and loss are important for genome sizes variation in vertebrates [21] and Drosophila [22]. Both a very recent study [19] and our results detected frequent gains and losses of TEs in the arthropod genomes. Moreover, our results suggest that multiple evolutionary forces can cause TE profiles to be very different even between closely related species, as shown in the four Lepidoptera species we analyzed (Figure 3,Figure 4,Figure 5). Unlike the protein-coding genes which are in general under selective constraints, the sequences of TEs are usually less constrained and evolve rapidly [78]. Therefore, besides the copy number variation caused by TE expansion and contraction, sequence diversification between homologous TE can also lead to TE diversification in the arthropods. Moreover, HTT is not uncommon between arthropods as shown in our results and previous studies [73,75]. Therefore, our results suggest that the TE profiles in the arthropod genomes are shaped by expansion and contraction of TEs, TE sequence diversification, and HTTs.
Then why can the TE loads be so different across arthropod species? According to the classic population genetics framework of TE biology, the content of TEs in a species is shaped by its rapid replication and the selective constraints because TEs are in general deleterious and selected against in most species. Since the selective strength of TEs in a species is determined by the effective population size (Ne) of that species [79], it is possible that the difference in Ne across arthropod species might be important for the variation in TE loads. In addition, DNA methylation [80] and RNA interference pathway [81,82] also suppress TE activities in arthropods, and the suppressive effects of both mechanisms might vary in arthropods. Therefore, the vast difference in TE loads among arthropods can be caused by the difference in natural selection or in the epigenetic regulatory mechanisms, although at this moment we cannot exclude the possibility that the TE difference in the studied arthropod species is mainly shaped by genetic drift as previously shown in nematode [51].

4.3. The Contribution of HTTs to the Transposable Element Repertoire in Arthropod Genomes

Previous studies have reported numerous HTTs in arthropods [70,73,75] and plants [83] (details are reviewed in Ref. [72,84]). In arthropods, most HTTs occurred for the Mariner (TcMar) subfamily [73,75], which are generally shorter (1–2 Kb) than LTRs (mostly longer than 5Kb) and might be easily transferred by vectors [85]. Accordingly, among the eight HTTs identified in this study, five of them are caused by the Mariner subfamily. Notably, the species with larger genomes have greater TE loads and more HTT events, suggesting that HTT may contribute to the TE expansions. In eukaryotes, TEs are repressed either by suppressing TE transcription or by piRNA-mediated cleavage of TE transcripts [86,87]. As the host organisms take time to develop piRNAs to repress a newly horizontally transferred TE, that TE might replicate rapidly and contribute significantly to the TE repertoire until abundant piRNAs are developed to repress that TE [82].
TEs recently horizontally transferred between two species will have higher sequences similarity than the protein-coding genes, which cause dS values to be smaller for the TEs than that for the protein-coding genes between the two species [73,88]. In this study, we used the amino acid distance instead of the dS to identify HTTs in arthropods, because the synonymous substitutions in the protein-coding genes between the studied species are usually saturated (dS values usually > 1). Since the number of orthologous genes between every two arthropods might be larger than 5000 [60], and our BUSCO analyses might have captured the most conserved ones, therefore, we set the genome-wide cutoff as the 100th minimum amino acid distance between two species, which represents the top ~2% of the total orthologous genes (Table S3). Thus, the HTTs we identified in this study do not necessarily recently occur, but might have occurred anciently.

4.4. Adaptive Transposable Element Insertions in Arthropods

In recent decades, numerous studies have demonstrated that TEs can benefit their hosts in multiple ways. For instance, TEs could be domesticated as promotors [89,90,91] or enhancers [92,93,94] to regulate gene expression. Moreover, a few TEs could be co-opted into novel protein-coding genes in the host genomes [95,96,97,98,99,100]. These findings suggest that TEs are important for providing raw materials of the regulatory elements and proteomes for the hosts. In addition, many studies have shown that TE insertions might increase the fitness of hosts. For example, a P element insertion in the promoter of Hsp70A significantly increases the fecundity of heat-shocked flies [91], and a Doc1420 insertion in CHKov1 significantly increases the pesticide resistance of hosts by disrupting the original gene structure [101]. The carbonaria form of the peppered moth (Biston betularia) was reported to be caused by a TE insertion [102] that upregulates a cortex transcript involved in early wing disc development. All these studies indicate that the beneficial effects of TEs are pervasive in eukaryotes. Although millions of TEs had been annotated in our study, the beneficial TE insertions remain unknown. Thus, further studies are required to identify the role of TEs in the adaptation of arthropods.

Supplementary Materials

The following are available online at https://www.mdpi.com/2073-4425/10/5/338/s1, Figure S1. The comparison of one TE identified by LTR-specific tools and RepeatModeler. Figure S2. Sequence divergence distribution of TEs in three Lepidoptera species. Figure S3. Rate shifts of TE loads in the phylogeny. Figure S4. The correlation between TEs and host genomes sizes. Figure S5. The copy numbers of six HTTs in 140 arthropods. Figure S6. Two HTTs in arthropods. Table S1. Basic information about the fourteen species. Table S2. The weighted small sample size corrected AIC (AW) and λ of the traits. Table S3. Cutoffs of amino acid distances. Table S4. The content of TIR in the 14 arthropod genomes. Table S5. TE loads are significantly correlated with genome sizes. Table S6. Eight horizontally transferred TEs. File S1. The phylogenetic tree of fourteen species. File S2. Protein alignment of eight HTTs.

Author Contributions

J.L. conceived the study. C.W. conducted the analysis. J.L. and C.W. wrote the manuscript.

Funding

This work was supported by grants from the National Natural Science Foundation of China (Nos. 91731301, 31771411, 31571333, and 91431101), Ministry of Science and Technology of the People’s Republic of China (2016YFA0500800) and Peking-Tsinghua Center for Life Science to J.L.

Acknowledgments

The analysis was performed on the Computing Platform of the Center for Life Science at Peking University.

Conflicts of Interest

The authors declare no conflict of interest.

References

  1. Finnegan, D.J. Eukaryotic transposable elements and genome evolution. Trends Genet. 1989, 5, 103–107. [Google Scholar] [CrossRef]
  2. Lander, E.S.; Linton, L.M.; Birren, B.; Nusbaum, C.; Zody, M.C.; Baldwin, J.; Devon, K.; Dewar, K.; Doyle, M.; FitzHugh, W.; et al. Initial sequencing and analysis of the human genome. Nature 2001, 409, 860–921. [Google Scholar] [PubMed]
  3. Wicker, T.; Sabot, F.; Hua-Van, A.; Bennetzen, J.L.; Capy, P.; Chalhoub, B.; Flavell, A.; Leroy, P.; Morgante, M.; Panaud, O.; et al. A unified classification system for eukaryotic transposable elements. Nat. Rev. Genet. 2007, 8, 973–982. [Google Scholar] [CrossRef] [PubMed]
  4. Orgel, L.E.; Crick, F. Selfish DNA: The ultimate parasite. Nature 1980, 284, 604–607. [Google Scholar] [CrossRef] [PubMed]
  5. Adams, M.D. The Genome Sequence of Drosophila melanogaster. Science 2000, 287, 2185–2195. [Google Scholar] [CrossRef] [PubMed] [Green Version]
  6. Ahola, V.; Lehtonen, R.J.; Somervuo, P.; Salmela, L.; Koskinen, P.; Rastas, P.; Välimäki, N.; Paulin, L.; Kvist, J.; Wahlberg, N.; et al. The Glanville fritillary genome retains an ancient karyotype and reveals selective chromosomal fusions in Lepidoptera. Nat. Commun. 2014, 5, 4737. [Google Scholar] [PubMed] [Green Version]
  7. Cao, Z.; Yu, Y.; Wu, Y.; Hao, P.; Di, Z.; He, Y.; Chen, Z.; Yang, W.; Shen, Z.; He, X.; et al. The genome of Mesobuthus martensii reveals a unique adaptation model of arthropods. Nat. Commun. 2013, 4, 2602. [Google Scholar] [CrossRef] [Green Version]
  8. Elsik, C.G.; Worley, K.C.; Bennett, A.K.; Beye, M.; Camara, F.; Childers, C.P.; De Graaf, D.C.; Debyser, G.; Deng, J.; Devreese, B.; et al. Finding the missing honey bee genes: Lessons learned from a genome upgrade. BMC Genom. 2014, 15, 86. [Google Scholar] [CrossRef]
  9. Grbić, M.; Van Leeuwen, T.; Clark, R.M.; Rombauts, S.; Rouzé, P.; Grbić, V.; Osborne, E.J.; Dermauw, W.; Ngoc, P.C.T.; Ortego, F.; et al. The genome of Tetranychus urticae reveals herbivorous pest adaptations. Nature 2011, 479, 487–492. [Google Scholar] [CrossRef] [PubMed]
  10. International Aphid Genomics Consortium. Genome sequence of the pea aphid acyrthosiphon pisum. PLoS Biol. 2010, 8, e1000313. [Google Scholar]
  11. International Aphid Genomics Consortium. The genome of a lepidopteran model insect, the silkworm bombyx mori. Insect Biochem. Mol. Biol. 2008, 38, 1036–1045. [Google Scholar] [CrossRef] [PubMed]
  12. Kakumani, P.K.; Malhotra, P.; Mukherjee, S.K.; Bhatnagar, R.K. A draft genome assembly of the army worm, Spodoptera frugiperda. Genomics 2014, 104, 134–143. [Google Scholar] [CrossRef]
  13. Li, X.; Fan, D.; Zhang, W.; Liu, G.; Zhang, L.; Zhao, L.; Fang, X.; Chen, L.; Dong, Y.; Chen, Y.; et al. Outbred genome sequencing and CRISPR/Cas9 gene editing in butterflies. Nat. Commun. 2015, 6, 8212. [Google Scholar] [CrossRef] [Green Version]
  14. Park, D.; Jung, J.W.; Choi, B.-S.; Jayakodi, M.; Lee, J.; Lim, J.; Yu, Y.; Choi, Y.-S.; Lee, M.-L.; Park, Y.; et al. Uncovering the novel characteristics of Asian honey bee, Apis cerana, by whole genome sequencing. BMC Genom. 2015, 16, 1. [Google Scholar] [CrossRef] [PubMed]
  15. Sadd, B.M.; Barribeau, S.M.; Bloch, G.; De Graaf, D.C.; Dearden, P.; Elsik, C.G.; Gadau, J.; Grimmelikhuijzen, C.J.; Hasselmann, M.; Lozier, J.D.; et al. The genomes of two key bumblebee species with primitive eusocial organization. Genome Biol. 2015, 16, 76. [Google Scholar] [CrossRef] [PubMed] [Green Version]
  16. Sanggaard, K.W.; Bechsgaard, J.S.; Fang, X.; Duan, J.; Dyrlund, T.F.; Gupta, V.; Jiang, X.; Cheng, L.; Fan, D.; Feng, Y.; et al. Spider genomes provide insight into composition and evolution of venom and silk. Nat. Commun. 2014, 5, 3765. [Google Scholar] [CrossRef] [Green Version]
  17. Wang, X.; Fang, X.; Yang, P.; Jiang, X.; Jiang, F.; Zhao, D.; Li, B.; Cui, F.; Wei, J.; Ma, C.; et al. The locust genome provides insight into swarm formation and long-distance flight. Nat. Commun. 2014, 5, 2957. [Google Scholar] [CrossRef] [Green Version]
  18. Xue, J.; Zhou, X.; Zhang, C.X.; Yu, L.L.; Fan, H.W.; Wang, Z.; Xu, H.J.; Xi, Y.; Zhu, Z.R.; Zhou, W.W.; et al. Genomes of the rice pest brown planthopper and its endosymbionts reveal complex complementary contributions for host adaptation. Genome Biol. 2014, 15, 521. [Google Scholar] [CrossRef] [PubMed] [Green Version]
  19. Petersen, M.; Armisén, D.; Gibbs, R.A.; Hering, L.; Khila, A.; Mayer, G.; Richards, S.; Niehuis, O.; Misof, B. Diversity and evolution of the transposable element repertoire in arthropods with particular reference to insects. BMC Evol. Biol. 2019, 19, 11. [Google Scholar] [CrossRef]
  20. Canapa, A.; Barucca, M.; Biscotti, M.A.; Forconi, M.; Olmo, E. Transposons, Genome Size, and Evolutionary Insights in Animals. Cytogenet. Genome Res. 2015, 147, 217–239. [Google Scholar] [CrossRef]
  21. Kapusta, A.; Suh, A.; Feschotte, C. Dynamics of genome size evolution in birds and mammals. Proc. Natl. Acad. Sci. USA 2017, 114, E1460–E1469. [Google Scholar] [CrossRef] [PubMed] [Green Version]
  22. Sessegolo, C.; Burlet, N.; Haudry, A. Strong phylogenetic inertia on genome size and transposable element content among 26 species of flies. Biol. Lett. 2016, 12, 20160407. [Google Scholar] [CrossRef] [PubMed] [Green Version]
  23. Bao, W.; Kojima, K.K.; Kohany, O. Repbase Update, a database of repetitive elements in eukaryotic genomes. Mob. DNA 2015, 6, 11. [Google Scholar] [CrossRef] [PubMed] [Green Version]
  24. Llorens, C.; Futami, R.; Covelli, L.; Dominguez-Escriba, L.; Viu, J.M.; Tamarit, D.; Aguilar-Rodriguez, J.; Vicente-Ripolles, M.; Fuster, G.; Bernet, G.P.; et al. The gypsy database (gydb) of mobile genetic elements: Release 2.0. Nucleic Acids Res. 2011, 39, D70–D74. [Google Scholar] [CrossRef]
  25. Lowe, T.M.; Eddy, S.R.; Avni, D.; Biberman, Y.; Meyuhas, O. tRNAscan-SE: A Program for Improved Detection of Transfer RNA Genes in Genomic Sequence. Nucleic Acids Res. 1997, 25, 955–964. [Google Scholar] [CrossRef] [Green Version]
  26. Xu, Z.; Wang, H. LTR_FINDER: An efficient tool for the prediction of full-length LTR retrotransposons. Nucleic Acids Res. 2007, 35, W265–W268. [Google Scholar] [CrossRef] [PubMed]
  27. Ellinghaus, D.; Kurtz, S.; Willhoeft, U. LTRharvest, an efficient and flexible software for de novo detection of LTR retrotransposons. BMC Bioinform. 2008, 9, 18. [Google Scholar] [CrossRef] [PubMed]
  28. Steinbiss, S.; Willhoeft, U.; Gremme, G.; Kurtz, S. Fine-grained annotation and classification of de novo predicted LTR retrotransposons. Nucleic Acids Res. 2009, 37, 7002–7013. [Google Scholar] [CrossRef] [Green Version]
  29. Edgar, R.C. Search and clustering orders of magnitude faster than BLAST. Bioinformatics 2010, 26, 2460–2461. [Google Scholar] [CrossRef] [PubMed] [Green Version]
  30. Larkin, M.; Blackshields, G.; Brown, N.; Chenna, R.; Mcgettigan, P.; Mc William, H.; Valentin, F.; Wallace, I.; Wilm, A.; López, R.; et al. Clustal W and Clustal X version 2.0. Bioinformatics 2007, 23, 2947–2948. [Google Scholar] [CrossRef] [Green Version]
  31. Smit, A.F.A.; Hubley, R.; Green, P. RepeatMasker Open-4.0 2013–2015. Available online: http://www.repeatmasker.org (accessed on 24 April 2017).
  32. Hoede, C.; Arnoux, S.; Moisset, M.; Chaumier, T.; Inizan, O.; Jamilloux, V.; Quesneville, H. PASTEC: An Automatic Transposable Element Classification Tool. PLoS ONE 2014, 9, 91929. [Google Scholar] [CrossRef]
  33. Abrusán, G.; Grundmann, N.; Demester, L.; Makalowski, W. TEclass—A tool for automated classification of unknown eukaryotic transposable elements. Bioinformatics 2009, 25, 1329–1330. [Google Scholar] [CrossRef]
  34. Bailly-Bechet, M.; Haudry, A.; Lerat, E. “One code to find them all”: A perl tool to conveniently parse repeatmasker output files. Mob. DNA 2014, 5, 13. [Google Scholar] [CrossRef]
  35. Waterhouse, R.M.; Seppey, M.; Simão, F.; Manni, M.; Ioannidis, P.; Klioutchnikov, G.; Kriventseva, E.V.; Zdobnov, E.M. BUSCO Applications from Quality Assessments to Gene Prediction and Phylogenomics. Mol. Biol. Evol. 2017, 35, 543–548. [Google Scholar] [CrossRef] [Green Version]
  36. Notredame, C.; Higgins, D.G.; Heringa, J. T-coffee: A novel method for fast and accurate multiple sequence alignment. J. Mol. Biol. 2000, 302, 205–217. [Google Scholar] [CrossRef]
  37. Wernersson, R. RevTrans: Multiple alignment of coding DNA from aligned amino acid sequences. Nucleic Acids Res. 2003, 31, 3537–3539. [Google Scholar] [CrossRef]
  38. Kumar, S.; Stecher, G.; Li, M.; Knyaz, C.; Tamura, K. MEGA X: Molecular Evolutionary Genetics Analysis across Computing Platforms. Mol. Biol. Evol. 2018, 35, 1547–1549. [Google Scholar] [CrossRef]
  39. Misof, B.; Liu, S.; Meusemann, K.; Peters, R.S.; Donath, A.; Mayer, C.; Frandsen, P.B.; Ware, J.; Flouri, T.; Beutel, R.G.; et al. Phylogenomics resolves the timing and pattern of insect evolution. Science 2014, 346, 763–767. [Google Scholar] [CrossRef] [PubMed]
  40. Yang, Z. PAML 4: Phylogenetic Analysis by Maximum Likelihood. Mol. Biol. Evol. 2007, 24, 1586–1591. [Google Scholar] [CrossRef] [PubMed] [Green Version]
  41. Sanderson, M.J. r8s: Inferring absolute rates of molecular evolution and divergence times in the absence of a molecular clock. Bioinformatics 2003, 19, 301–302. [Google Scholar] [CrossRef]
  42. Rehm, P.; Borner, J.; Meusemann, K.; Von Reumont, B.M.; Simon, S.; Hadrys, H.; Misof, B.; Burmester, T. Dating the arthropod tree based on large-scale transcriptome data. Mol. Phylo. Evol. 2011, 61, 880–887. [Google Scholar] [CrossRef]
  43. Revell, L.J. Phytools: An r package for phylogenetic comparative biology (and other things). Methods Ecol. Evol. 2012, 3, 217–223. [Google Scholar] [CrossRef]
  44. Pennell, M.W.; Eastman, J.M.; Slater, G.J.; Brown, J.; Uyeda, J.C.; Fitzjohn, R.G.; Alfaro, M.E.; Harmon, L.J. geiger v2.0: An expanded suite of methods for fitting macroevolutionary models to phylogenetic trees. Bioinformatics 2014, 30, 2216–2218. [Google Scholar] [CrossRef] [PubMed]
  45. Felsenstein, J. Maximum-likelihood estimation of evolutionary trees from continuous characters. Am. J. Hum. Genet. 1973, 25, 471–492. [Google Scholar]
  46. Butler, M.A.; King, A.A. Phylogenetic Comparative Analysis: A Modeling Approach for Adaptive Evolution. Am. Nat. 2004, 164, 683–695. [Google Scholar] [CrossRef] [PubMed]
  47. Harmon, L.J.; Losos, J.B.; Davies, T.J.; Gillespie, R.G.; Gittleman, J.L.; Jennings, W.B.; Kozak, K.H.; McPeek, M.; Moreno-Roark, F.; Near, T.J.; et al. Early bursts of body size and shape evolution are rare in comparative data. Evolution 2010, 64, 2385–2396. [Google Scholar] [CrossRef] [PubMed]
  48. Paradis, E.; Claude, J.; Strimmer, K. APE: Analyses of Phylogenetics and Evolution in R language. Bioinformatics 2004, 20, 289–290. [Google Scholar] [CrossRef] [Green Version]
  49. Holm, S. A simple sequentially rejective multiple test procedure. Scand. J. Statist. 1979, 6, 65–70. [Google Scholar]
  50. Pagel, M. Detecting correlated evolution on phylogenies: A general method for the comparative analysis of discrete characters. Proc. R. Soc. Lond. B. 1994, 255, 37–45. [Google Scholar]
  51. Szitenberg, A.; Cha, S.; Opperman, C.H.; Bird, D.M.; Blaxter, M.L.; Lunt, D.H. Genetic Drift, Not Life History or RNAi, Determine Long-Term Evolution of Transposable Elements. Genome Biol. Evol. 2016, 8, 2964–2978. [Google Scholar] [CrossRef] [Green Version]
  52. Szitenberg, A.; John, M.; Blaxter, M.L.; Lunt, D.H. ReproPhylo: An Environment for Reproducible Phylogenomics. PLoS Comput. Biol. 2015, 11, e1004447. [Google Scholar] [CrossRef] [PubMed]
  53. Rabosky, D.L.; Donnellan, S.C.; Grundler, M.; Lovette, I.J.; West, C.; James, S.A.; Davey, R.P.; Dicks, J.; Roberts, I.N. Analysis and Visualization of Complex Macroevolutionary Dynamics: An Example from Australian Scincid Lizards. Syst. Biol. 2014, 63, 610–627. [Google Scholar] [CrossRef] [PubMed] [Green Version]
  54. Rabosky, D.L.; Goldberg, E.E. Model Inadequacy and Mistaken Inferences of Trait-Dependent Speciation. Syst. Biol. 2015, 64, 340–355. [Google Scholar] [CrossRef] [Green Version]
  55. Rabosky, D.L.; Santini, F.; Eastman, J.; Smith, S.A.; Sidlauskas, B.; Chang, J.; Alfaro, M.E. Rates of speciation and morphological evolution are correlated across the largest vertebrate radiation. Nat. Commun. 2013, 4, 1958. [Google Scholar] [CrossRef] [Green Version]
  56. Rabosky, D.L.; Gründler, M.; Anderson, C.; Title, P.; Shi, J.J.; Brown, J.W.; Huang, H.; Larson, J.G. BAMMtools: An R package for the analysis of evolutionary dynamics on phylogenetic trees. Methods Ecol. Evol. 2014, 5, 701–707. [Google Scholar] [CrossRef]
  57. Altschul, S.F.; Gish, W.; Miller, W.; Myers, E.W.; Lipman, D.J. Basic local alignment search tool. J. Mol. Biol. 1990, 215, 403–410. [Google Scholar] [CrossRef]
  58. Slater, G.S.C.; Birney, E. Automated generation of heuristics for biological sequence comparison. BMC Bioinform. 2005, 6, 31. [Google Scholar] [CrossRef]
  59. Price, M.N.; Dehal, P.S.; Arkin, A.P. FastTree: Computing Large Minimum Evolution Trees with Profiles instead of a Distance Matrix. Mol. Biol. Evol. 2009, 26, 1641–1650. [Google Scholar] [CrossRef] [Green Version]
  60. Thomas, G.W.C.; Dohmen, E.; Hughes, D.S.T.; Murali, S.C.; Poelchau, M.; Glastad, K.; Anstead, C.A.; Ayoub, N.A.; Batterham, P.; Bellair, M.; et al. The genomic basis of arthropod diversity. bioRxiv 2018, 382945. [Google Scholar]
  61. Pearson, W.R. Rapid and sensitive sequence comparison with FASTP and FASTA. Meth. Enzymol. 1990, 183, 63–98. [Google Scholar]
  62. Misra, S.; Crosby, M.; Mungall, C.J.; Matthews, B.B.; Campbell, K.S.; Hradecky, P.; Huang, Y.; Kaminker, J.S.; Millburn, G.H.; Prochnik, S.; et al. Annotation of the Drosophila melanogaster euchromatic genome: A systematic review. Genome Biol. 2002, 3, 83. [Google Scholar] [CrossRef]
  63. Quesneville, H.; Bergman, C.M.; Andrieu, O.; Autard, D.; Nouaud, D.; Ashburner, M.; Anxolabéhère, D.; Stormo, G. Combined Evidence Annotation of Transposable Elements in Genome Sequences. PLoS Comput. Biol. 2005, 1, e22. [Google Scholar] [CrossRef]
  64. Xu, H.-E.; Zhang, H.-H.; Xia, T.; Han, M.-J.; Shen, Y.-H.; Zhang, Z. BmTEdb: A collective database of transposable elements in the silkworm genome. Database 2013, 2013, 55. [Google Scholar] [CrossRef]
  65. Obbard, D.J.; Gordon, K.H.; Buck, A.H.; Jiggins, F.M. The evolution of rnai as a defence against viruses and transposable elements. Philos. Trans. R. Soc. Lond. B Biol. Sci. 2009, 364, 99–115. [Google Scholar] [CrossRef]
  66. Zhao, X.; Xiong, J.; Mao, F.; Sheng, Y.; Chen, X.; Feng, L.; Dui, W.; Yang, W.; Kapusta, A.; Feschotte, C.; et al. RNAi-dependent Polycomb repression controls transposable elements in Tetrahymena. Genes Dev. 2019, 33, 348–364. [Google Scholar] [CrossRef]
  67. Revell, L.J.; Harmon, L.J.; Collar, D.C. Phylogenetic Signal, Evolutionary Process, and Rate. Syst. Biol. 2008, 57, 591–601. [Google Scholar] [CrossRef] [PubMed] [Green Version]
  68. Kidwell, M.G. Transposable elements and the evolution of genome size in eukaryotes. Genetica 2002, 115, 49–63. [Google Scholar] [CrossRef]
  69. Felsenstein, J. Phylogenies and the Comparative Method. Am. Nat. 1985, 125, 1–15. [Google Scholar] [CrossRef]
  70. Daniels, S.B.; Peterson, K.R.; Strausbaugh, L.D.; Kidwell, M.G.; Chovnick, A. Evidence for Horizontal Transmission of the P Transposable Element between Drosophila Species. Genetics 1990, 124, 339–355. [Google Scholar]
  71. Bingham, P.M.; Kidwell, M.G.; Rubin, G.M. The molecular basis of P-M hybrid dysgenesis: The role of the P element, a P-strain-specific transposon family. Cell 1982, 29, 995–1004. [Google Scholar] [CrossRef]
  72. Gilbert, C.; Feschotte, C. Horizontal acquisition of transposable elements and viral sequences: Patterns and consequences. Curr. Opin. Genet. Dev. 2018, 49, 15–24. [Google Scholar] [CrossRef] [PubMed]
  73. Peccoud, J.; Loiseau, V.; Cordaux, R.; Gilbert, C. Massive horizontal transfer of transposable elements in insects. Proc. Natl. Acad. Sci. USA 2017, 114, 4721–4726. [Google Scholar] [CrossRef] [PubMed] [Green Version]
  74. Blumenstiel, J.P. Evolutionary dynamics of transposable elements in a small RNA world. Trends Genet. 2011, 27, 23–31. [Google Scholar] [CrossRef] [PubMed]
  75. Reiss, D.; Mialdea, G.; Miele, V.; De Vienne, D.M.; Peccoud, J.; Gilbert, C.; Duret, L.; Charlat, S. Global survey of mobile DNA horizontal transfer in arthropods reveals Lepidoptera as a prime hotspot. PLoS Genet. 2019, 15, e1007965. [Google Scholar] [CrossRef] [PubMed]
  76. Silva, J.C.; Loreto, E.L.; Clark, J.B. Factors that affect the horizontal transfer of transposable elements. Curr. Issues Mol. Biol. 2004, 6, 57–71. [Google Scholar] [PubMed]
  77. Goerner-Potvin, P.; Bourque, G. Computational tools to unmask transposable elements. Nat. Rev. Genet. 2018, 19, 688–704. [Google Scholar] [CrossRef]
  78. Pasyukova, E.G.; Nuzhdin, S.V.; Morozova, T.V.; Mackay, T.F.C. Accumulation of Transposable Elements in the Genome of Drosophila melanogaster is Associated with a Decrease in Fitness. J. Hered. 2004, 95, 284–290. [Google Scholar] [CrossRef] [Green Version]
  79. Charlesworth, B. Effective population size and patterns of molecular evolution and variation. Nat. Rev. Genet. 2009, 10, 195–205. [Google Scholar] [CrossRef]
  80. Bewick, A.J.; Vogel, K.J.; Moore, A.J.; Schmitz, R.J. Evolution of DNA methylation across insects. Mol. Biol. Evol. 2017, 34, 654–665. [Google Scholar] [CrossRef] [PubMed]
  81. Lewis, S.H.; Quarles, K.A.; Yang, Y.; Tanguy, M.; Frezal, L.; Smith, S.A.; Sharma, P.P.; Cordaux, R.; Gilbert, C.; Giraud, I.; et al. Pan-arthropod analysis reveals somatic pirnas as an ancestral defence against transposable elements. Nat. Ecol. Evol. 2018, 2, 174–181. [Google Scholar] [CrossRef] [PubMed]
  82. Lu, J.; Clark, A.G. Population dynamics of PIWI-interacting RNAs (piRNAs) and their targets in Drosophila. Genome Res. 2009, 20, 212–227. [Google Scholar] [CrossRef] [Green Version]
  83. El Baidouri, M.; Cooke, R.; Gao, D.; Lasserre, E.; Llauro, C.; Mirouze, M.; Picault, N.; Panaud, O.; Carpentier, M.-C.; Jackson, S. Widespread and frequent horizontal transfers of transposable elements in plants. Genome Res. 2014, 24, 831–838. [Google Scholar] [CrossRef]
  84. Drezen, J.-M.; Josse, T.; Bézier, A.; Gauthier, J.; Huguet, E.; Herniou, E.A. Impact of Lateral Transfers on the Genomes of Lepidoptera. Genes 2017, 8, 315. [Google Scholar] [CrossRef]
  85. Gilbert, C.; Peccoud, J.; Chateigner, A.; Moumen, B.; Cordaux, R.; Herniou, E.A. Continuous Influx of Genetic Material from Host to Virus Populations. PLoS Genet. 2016, 12, e1005838. [Google Scholar] [CrossRef]
  86. Luo, S.; Lu, J. Silencing of Transposable Elements by piRNAs in Drosophila: An Evolutionary Perspective. Genom. Proteom. Bioinform. 2017, 15, 164–176. [Google Scholar] [CrossRef]
  87. Yamashiro, H.; Siomi, M.C. Piwi-interacting RNA in drosophila: Biogenesis, transposon regulation, and beyond. Chem. Rev. 2018, 118, 4404–4421. [Google Scholar] [CrossRef]
  88. Bartolomé, C.; Bello, X.; Maside, X. Widespread evidence for horizontal transfer of transposable elements across Drosophila genomes. Genome Biol. 2009, 10, R22. [Google Scholar] [CrossRef]
  89. Nigumann, P.; Redik, K.; Mätlik, K.; Speek, M. Many Human Genes Are Transcribed from the Antisense Promoter of L1 Retrotransposon. Genomics 2002, 79, 628–634. [Google Scholar] [CrossRef]
  90. Van De Lagemaat, L.N.; Landry, J.-R.; Mager, D.L.; Medstrand, P. Transposable elements in mammals promote regulatory variation and diversification of genes with specialized functions. Trends Genet. 2003, 19, 530–536. [Google Scholar] [CrossRef]
  91. Chen, B.; Shilova, V.Y.; Zatsepina, O.G.; Evgen’Ev, M.B.; Feder, M.E. Location of P element insertions in the proximal promoter region of Hsp70A is consequential for gene expression and correlated with fecundity in Drosophila melanogaster. Cell Stress Chaperones 2008, 13, 11–17. [Google Scholar] [CrossRef]
  92. Bejerano, G.; Lowe, C.B.; Ahituv, N.; King, B.; Siepel, A.; Salama, S.R.; Rubin, E.M.; Kent, W.J.; Haussler, D. A distal enhancer and an ultraconserved exon are derived from a novel retroposon. Nature 2006, 441, 87–90. [Google Scholar] [CrossRef]
  93. Smith, A.M.; Sanchez, M.-J.; Follows, G.A.; Kinston, S.; Donaldson, I.J.; Green, A.R.; Gottgens, B. A novel mode of enhancer evolution: The Tal1 stem cell enhancer recruited a MIR element to specifically boost its activity. Genome Res. 2008, 18, 1422–1432. [Google Scholar] [CrossRef] [PubMed] [Green Version]
  94. Franchini, L.F.; Lopez-Leal, R.; Nasif, S.; Beati, P.; Gelman, D.M.; Low, M.J.; de Souza, F.J.; Rubinstein, M. Convergent evolution of two mammalian neuronal enhancers by sequential exaptation of unrelated retroposons. Proc. Natl. Acad. Sci. USA 2011, 108, 15270–15275. [Google Scholar] [CrossRef] [Green Version]
  95. Bundock, P.; Hooykaas, P. An Arabidopsis hAT-like transposase is essential for plant development. Nature 2005, 436, 282–284. [Google Scholar] [CrossRef]
  96. Kapitonov, V.V.; Jurka, J. RAG1 Core and V(D)J Recombination Signal Sequences Were Derived from Transib Transposons. PLoS Biol. 2005, 3, e181. [Google Scholar] [CrossRef] [PubMed]
  97. Jangam, D.; Feschotte, C.; Betrán, E. Transposable element domestication as an adaptation to evolutionary conflicts. Trends Genet. 2017, 33, 817–831. [Google Scholar] [CrossRef]
  98. De Souza, F.S.; Franchini, L.F.; Rubinstein, M. Exaptation of Transposable Elements into Novel Cis-Regulatory Elements: Is the Evidence Always Strong? Mol. Biol. Evol. 2013, 30, 1239–1251. [Google Scholar] [CrossRef] [Green Version]
  99. Joly-Lopez, Z.; Bureau, T. Exaptation of transposable element coding sequences. Curr. Opin. Genet. Dev. 2018, 49, 34–42. [Google Scholar] [CrossRef]
  100. Chuong, E.B.; Elde, N.C.; Feschotte, C. Regulatory activities of transposable elements: From conflicts to benefits. Nat. Rev. Genet. 2017, 18, 71–86. [Google Scholar] [CrossRef]
  101. Aminetzach, Y.T.; MacPherson, J.M.; Petrov, D.A. Pesticide Resistance via Transposition-Mediated Adaptive Gene Truncation in Drosophila. Science 2005, 309, 764–767. [Google Scholar] [CrossRef]
  102. Hof, A.E.V.; Campagne, P.; Rigden, D.J.; Yung, C.J.; Lingley, J.; Quail, M.A.; Hall, N.; Darby, A.C.; Saccheri, I.J. The industrial melanism mutation in British peppered moths is a transposable element. Nature 2016, 534, 102–105. [Google Scholar] [CrossRef] [PubMed] [Green Version]
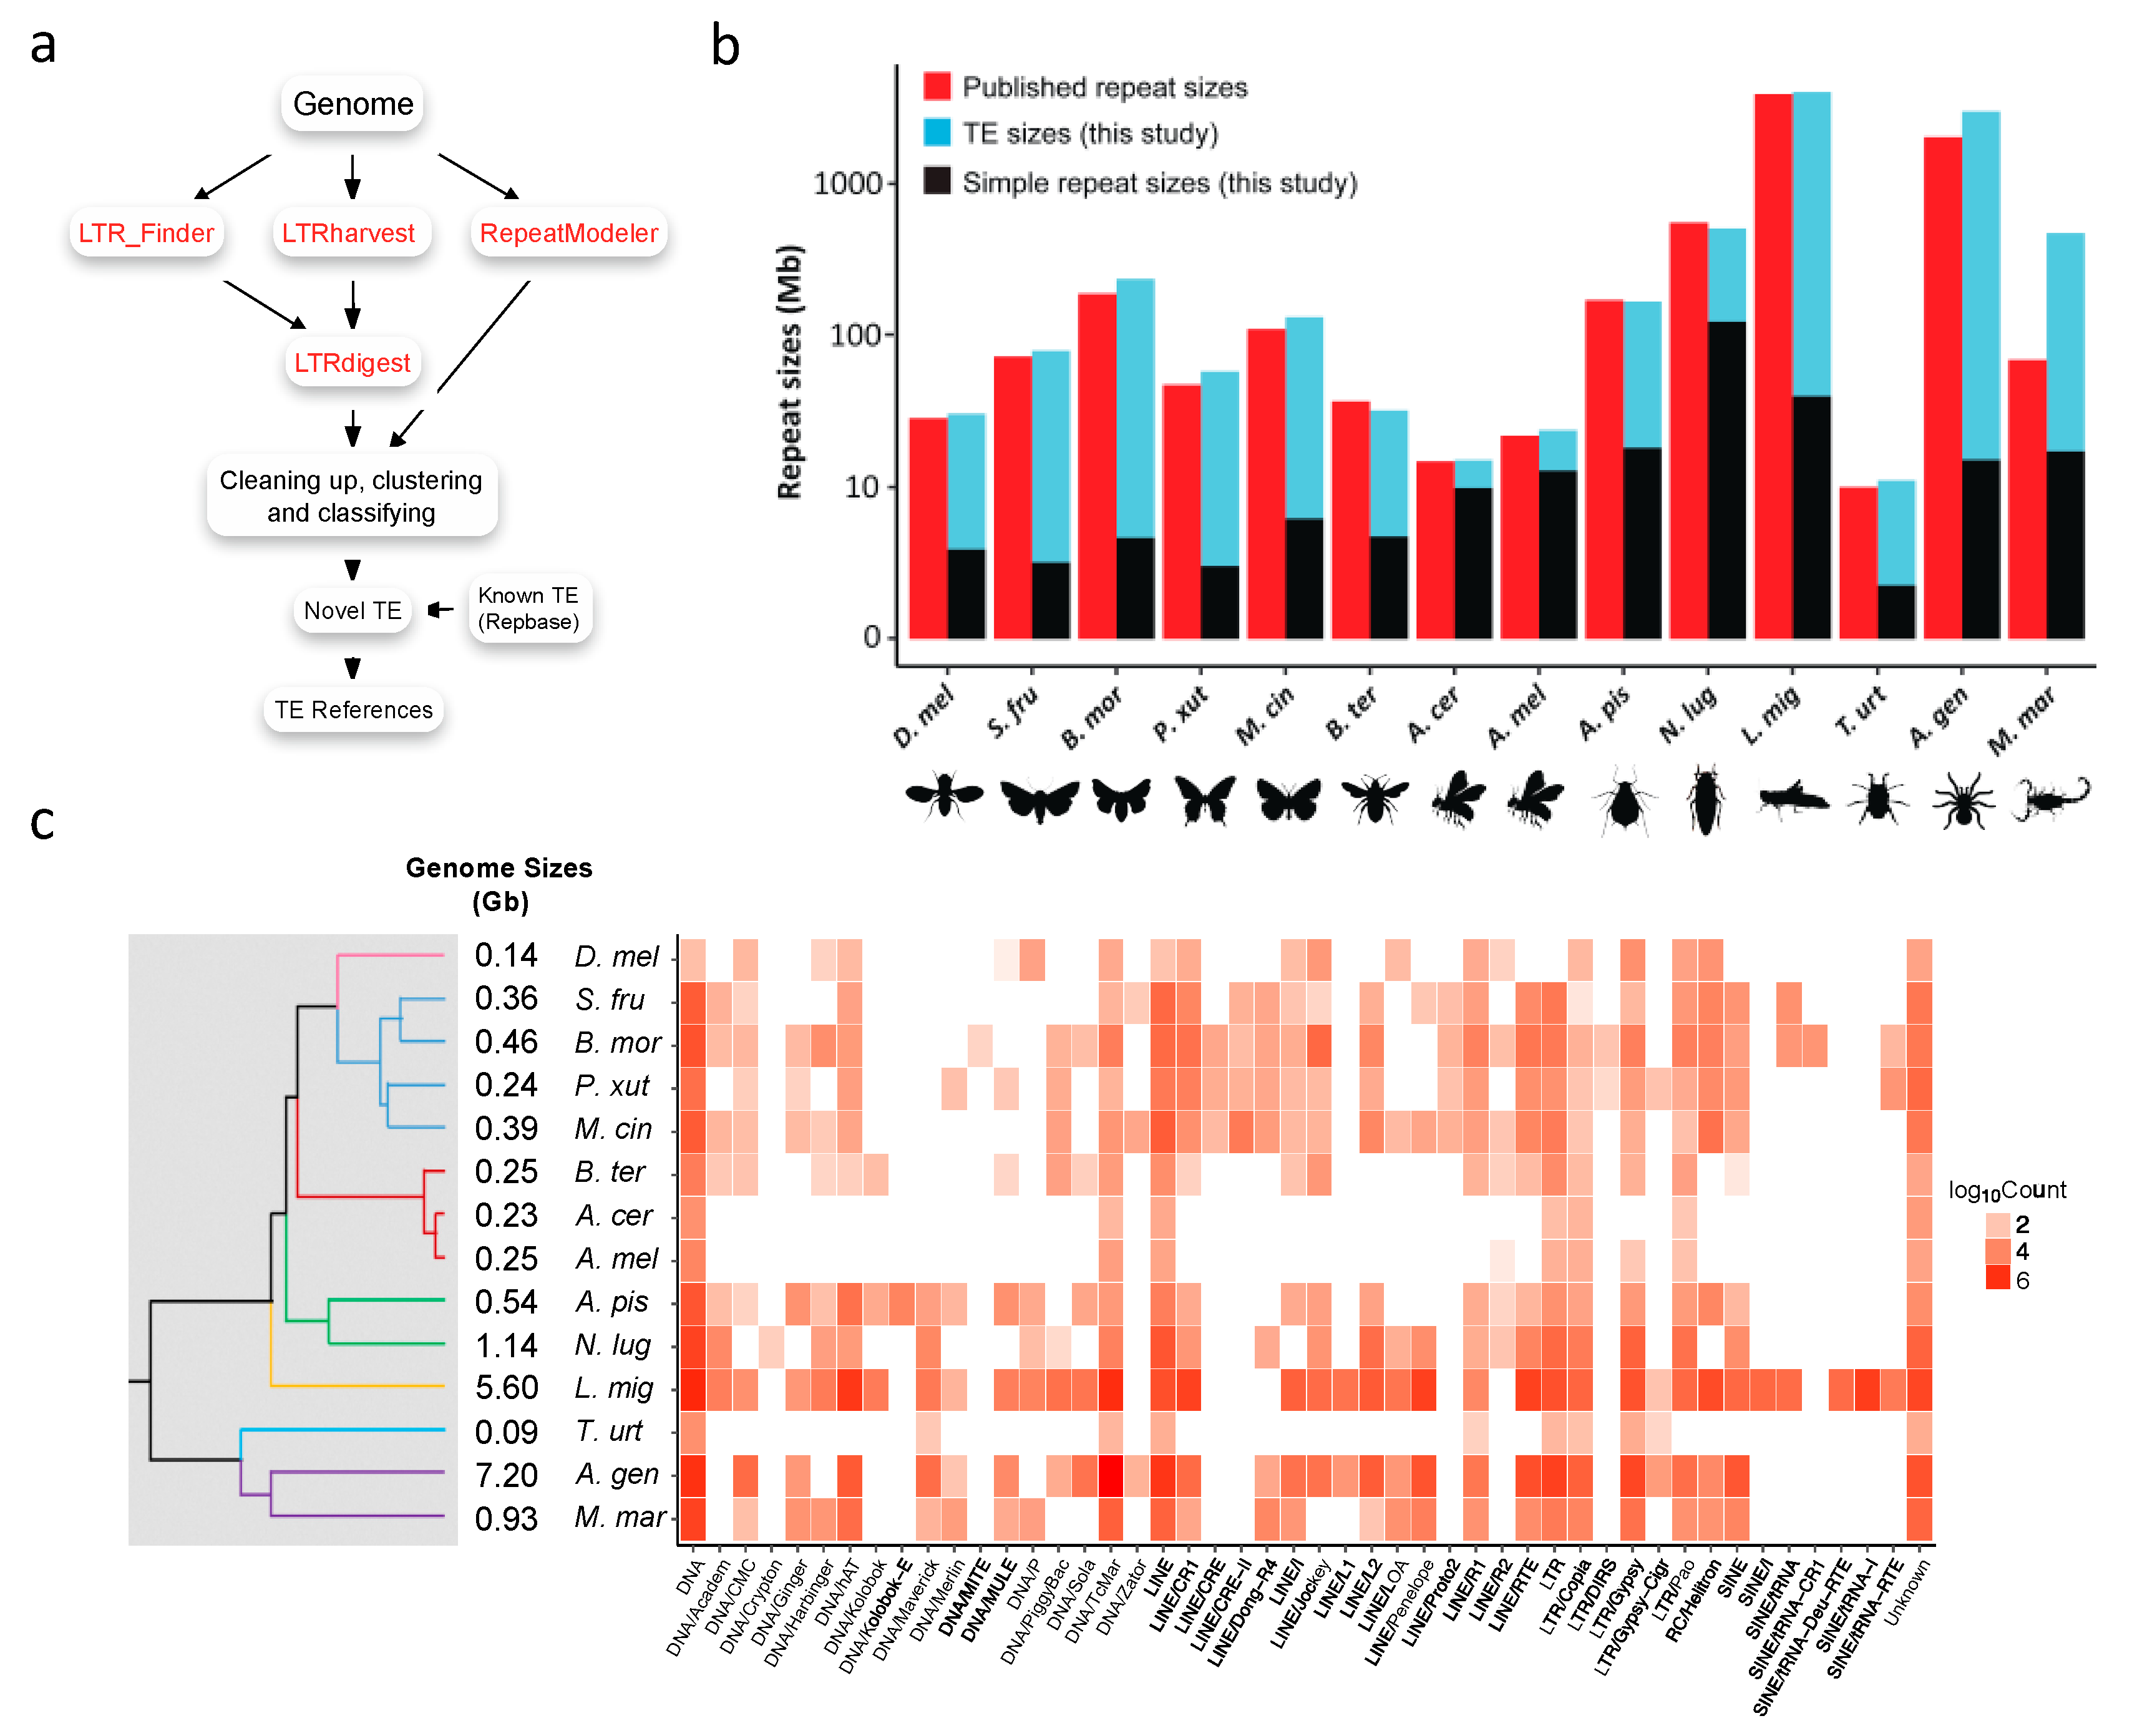
Figure 1. Annotating TEs in arthropods. (a) The TE reference construction workflow (see details in Materials and Methods). (b) The repeat sizes of fourteen arthropods. Published repeat sizes were adapted from the original genome sequencing studies (Table S1). The repeat sizes (TE and simple repeat) of this study were evaluated using the TE libraries defined in this study. The published repeat size of B. mor was adapted from [11]. D. mel, Drosophila melanogaster; B. mor, Bombyx mori; M. cin, Melitaea cinxia; P. xut, Papilio xuthus; S. fru, Spodoptera frugiperda; A. cer, Apis cerana; A. mel, Apis mellifera; B. ter, Bombus terrestris; N. lug, Nilaparvata lugens; A. pis, Acyrthosiphon pisum; L. mig, Locusta migratoria; A. gen, Acanthoscurria geniculata; M. mar, Mesobuthus martensii; T. urt, Tetranychus urticae. (c) The landscape of TE loads in arthropods.
Genes 10 00338 g001
Figure 2. Sequence divergence distribution of TEs. (ad) Distribution of sequence divergence of multiple TE subfamilies in four species. The y-axis shows the percentage of the host genomes that is annotated as TEs (TE contents). The x-axis shows Kimura 2-Parameter sequence divergence between individual TE copies and consensus references. Unknown, unclassified TEs; Other, Retro and Retroposon.
Genes 10 00338 g002
Figure 3. The phylogeny of Copia in Lepidoptera. The Copia were arbitrarily divided into three groups (G1–3). TEs with BM (annotated in Repbase) or BomMor (annotated in this study) suffixes are from B. mori (red name); TEs with PapXut, MelCin, and SpoFru suffixes are from P. xuthus (blue name), M. cinxia (black name), and S. frugiperda (green name). Only nodes with bootstrap value not lower than 70% were indicated. BEL-1_BM is the outgroup.
Genes 10 00338 g003
Figure 4. The phylogeny of BEL/Pao in Lepidoptera. The BEL/Pao were arbitrarily divided into four groups (G1–4). TEs with BM (annotated in Repbase) or BomMor (annotated in this study) suffixes are from B. mori (red name); TEs with PapXut, MelCin and SpoFru are from P. xuthus (blue name), M. cinxia (black name) and S. frugiperda (green name). Kabuki is from B. mori and has been annotated in BmTEdb [64]. Only nodes with bootstrap value not lower than 70% were indicated. Copia-1_BM is the outgroup.
Genes 10 00338 g004
Figure 5. The phylogeny of Gypsy in Lepidoptera. The Gypsy were arbitrarily divided into five groups (G1–5). TEs with BM (annotated in Repbase) or BomMor (annotated in this study) suffixes are from B. mori (red name); TEs with PapXut, MelCin and SpoFru are from P. xuthus (blue name), M. cinxia (black name) and S. frugiperda (green name). Rikishi is from B. mori and has been annotated in BmTEdb [64]. Only nodes with bootstrap value not lower than 70% were indicated. BEL-1_BM is the outgroup.
Genes 10 00338 g005
Figure 6. The expansion and contraction of TEs in the 14 arthropod species. (a) The ratio of TE load change (the offspring relative to the ancestral node) for each branch. (b) The dynamic evolutionary rates of TE loads in the phylogeny. Branch colors are scaled by evolutionary rates of TE loads, and rate increases from the cold color (blue) to warm color (red). TIR, terminal inverted repeat; LTR, long terminal repeat; LINE, long interspersed nuclear element; SINE, short interspersed nuclear element.
Genes 10 00338 g006
Figure 7. The HTTs in arthropods. (a) The HTT of Gypsy between M. cinxia and B. mori. (b) The HTT of Mariner between B. mori and S. frugiperda. The species names of hosts of HTT are in bold. (c) Eight HTTs in the fourteen arthropods.
Genes 10 00338 g007
Table 1. Genome sizes and the number of transposable elements references of fourteen arthropods.
ClassOrderSpeciesGenome Sizes TE Reference Sequences
RB/RM/LTRRTE/DTE/UnCTotal
InsectaDipteraDrosophila melanogaster144 Mb147/79/8159/47/28234
LepidopteraSpodoptera frugiperda358 Mb1/475/12263/190/35488
Bombyx mori460 Mb92/546/183552/232/37821
Papilio xuthus244 Mb41/319/60248/151/21420
Melitaea cinxia390 Mb0/763/17433/299/48780
HymenopteraBombus terrestris249 Mb6/520/12241/267/30538
Apis cerana228 Mb0/86/128/49/1087
Apis mellifera250 Mb6/136/135/98/10143
HemipteraAcyrthosiphon pisum542 Mb331/752/75326/796/361158
Nilaparvata lugens1.14 Gb0/1,136/230872/419/751366
OrthopteraLocusta migratoria5.6 Gb1028/1182/561144/1018/1042266
ArachnidaTrombidiformesTetranychus urticae90 Mb10/122/73105/86/14205
AraneaeAcanthoscurria geniculata7.2 Gb0/1857/167967/982/752024
ScorpionesMesobuthus martensii925 Mb39/1260/101476/843/811400
Sizes of current versions of genomes used in this study. Recently assembled genome based on PacBio single-molecule sequencing datasets. RB, RM, and LTR symbolize Repbase, RepeatModeler, and LTR de novo, respectively. RTE, DTE, and UnC symbolize retrotransposable elements, TIRs, and unclassified TEs, respectively.
Table 2. TE loads are significantly correlated with genome sizes.
TE SubfamiliesCorrelation CoefficientPCorrected P
LINE/L20.8681.20 × 10−43.01 × 10⁻³
SINE/Unclassified0.7841.51 × 10−33.18 × 10⁻²
LINE/Unclassified0.7602.55 × 10−34.85 × 10⁻²
DNA/Unclassified0.7562.79 × 10−35.02 × 10⁻²
DNA/TcMar0.7284.75 × 10−38.07 × 10⁻²
LTR/Copia0.7245.14 × 10−38.22 × 10⁻²
DNA/hAT0.6541.53 × 10−22.13 × 10⁻¹
LINE/CR10.6441.75 × 10−22.13 × 10⁻¹
LINE/RTE0.6521.57 × 10−22.13 × 10⁻¹
LTR/Unclassified0.6541.52 × 10−22.13 × 10⁻¹
LTR/Pao0.6441.76 × 10−22.13 × 10⁻¹
DNA/Ginger0.5594.72 × 10−24.25 × 10⁻¹
LINE/I0.5117.45 × 10−25.96 × 10⁻¹
DNA/CMC0.4898.97 × 10−26.28 × 10⁻¹
DNA/Academ0.4191.54 × 10−19.23 × 10⁻¹
LINE/Dong-R40.4031.73 × 10−19.23 × 10⁻¹
DNA/Harbinger0.3582.30 × 10−19.23 × 10⁻¹
DNA/PiggyBac0.3712.12 × 10−19.23 × 10⁻¹
LINE/Jockey0.3941.83 × 10−19.23 × 10⁻¹
LINE/R10.3512.40 × 10−19.23 × 10⁻¹
LTR/Gypsy0.3821.98 × 10−19.23 × 10⁻¹
Unclassified: subfamily information is unavailable.