Secreted Phospholipase A2-IIA Modulates Transdifferentiation of Cardiac Fibroblast through EGFR Transactivation: An Inflammation–Fibrosis Link

 and
and 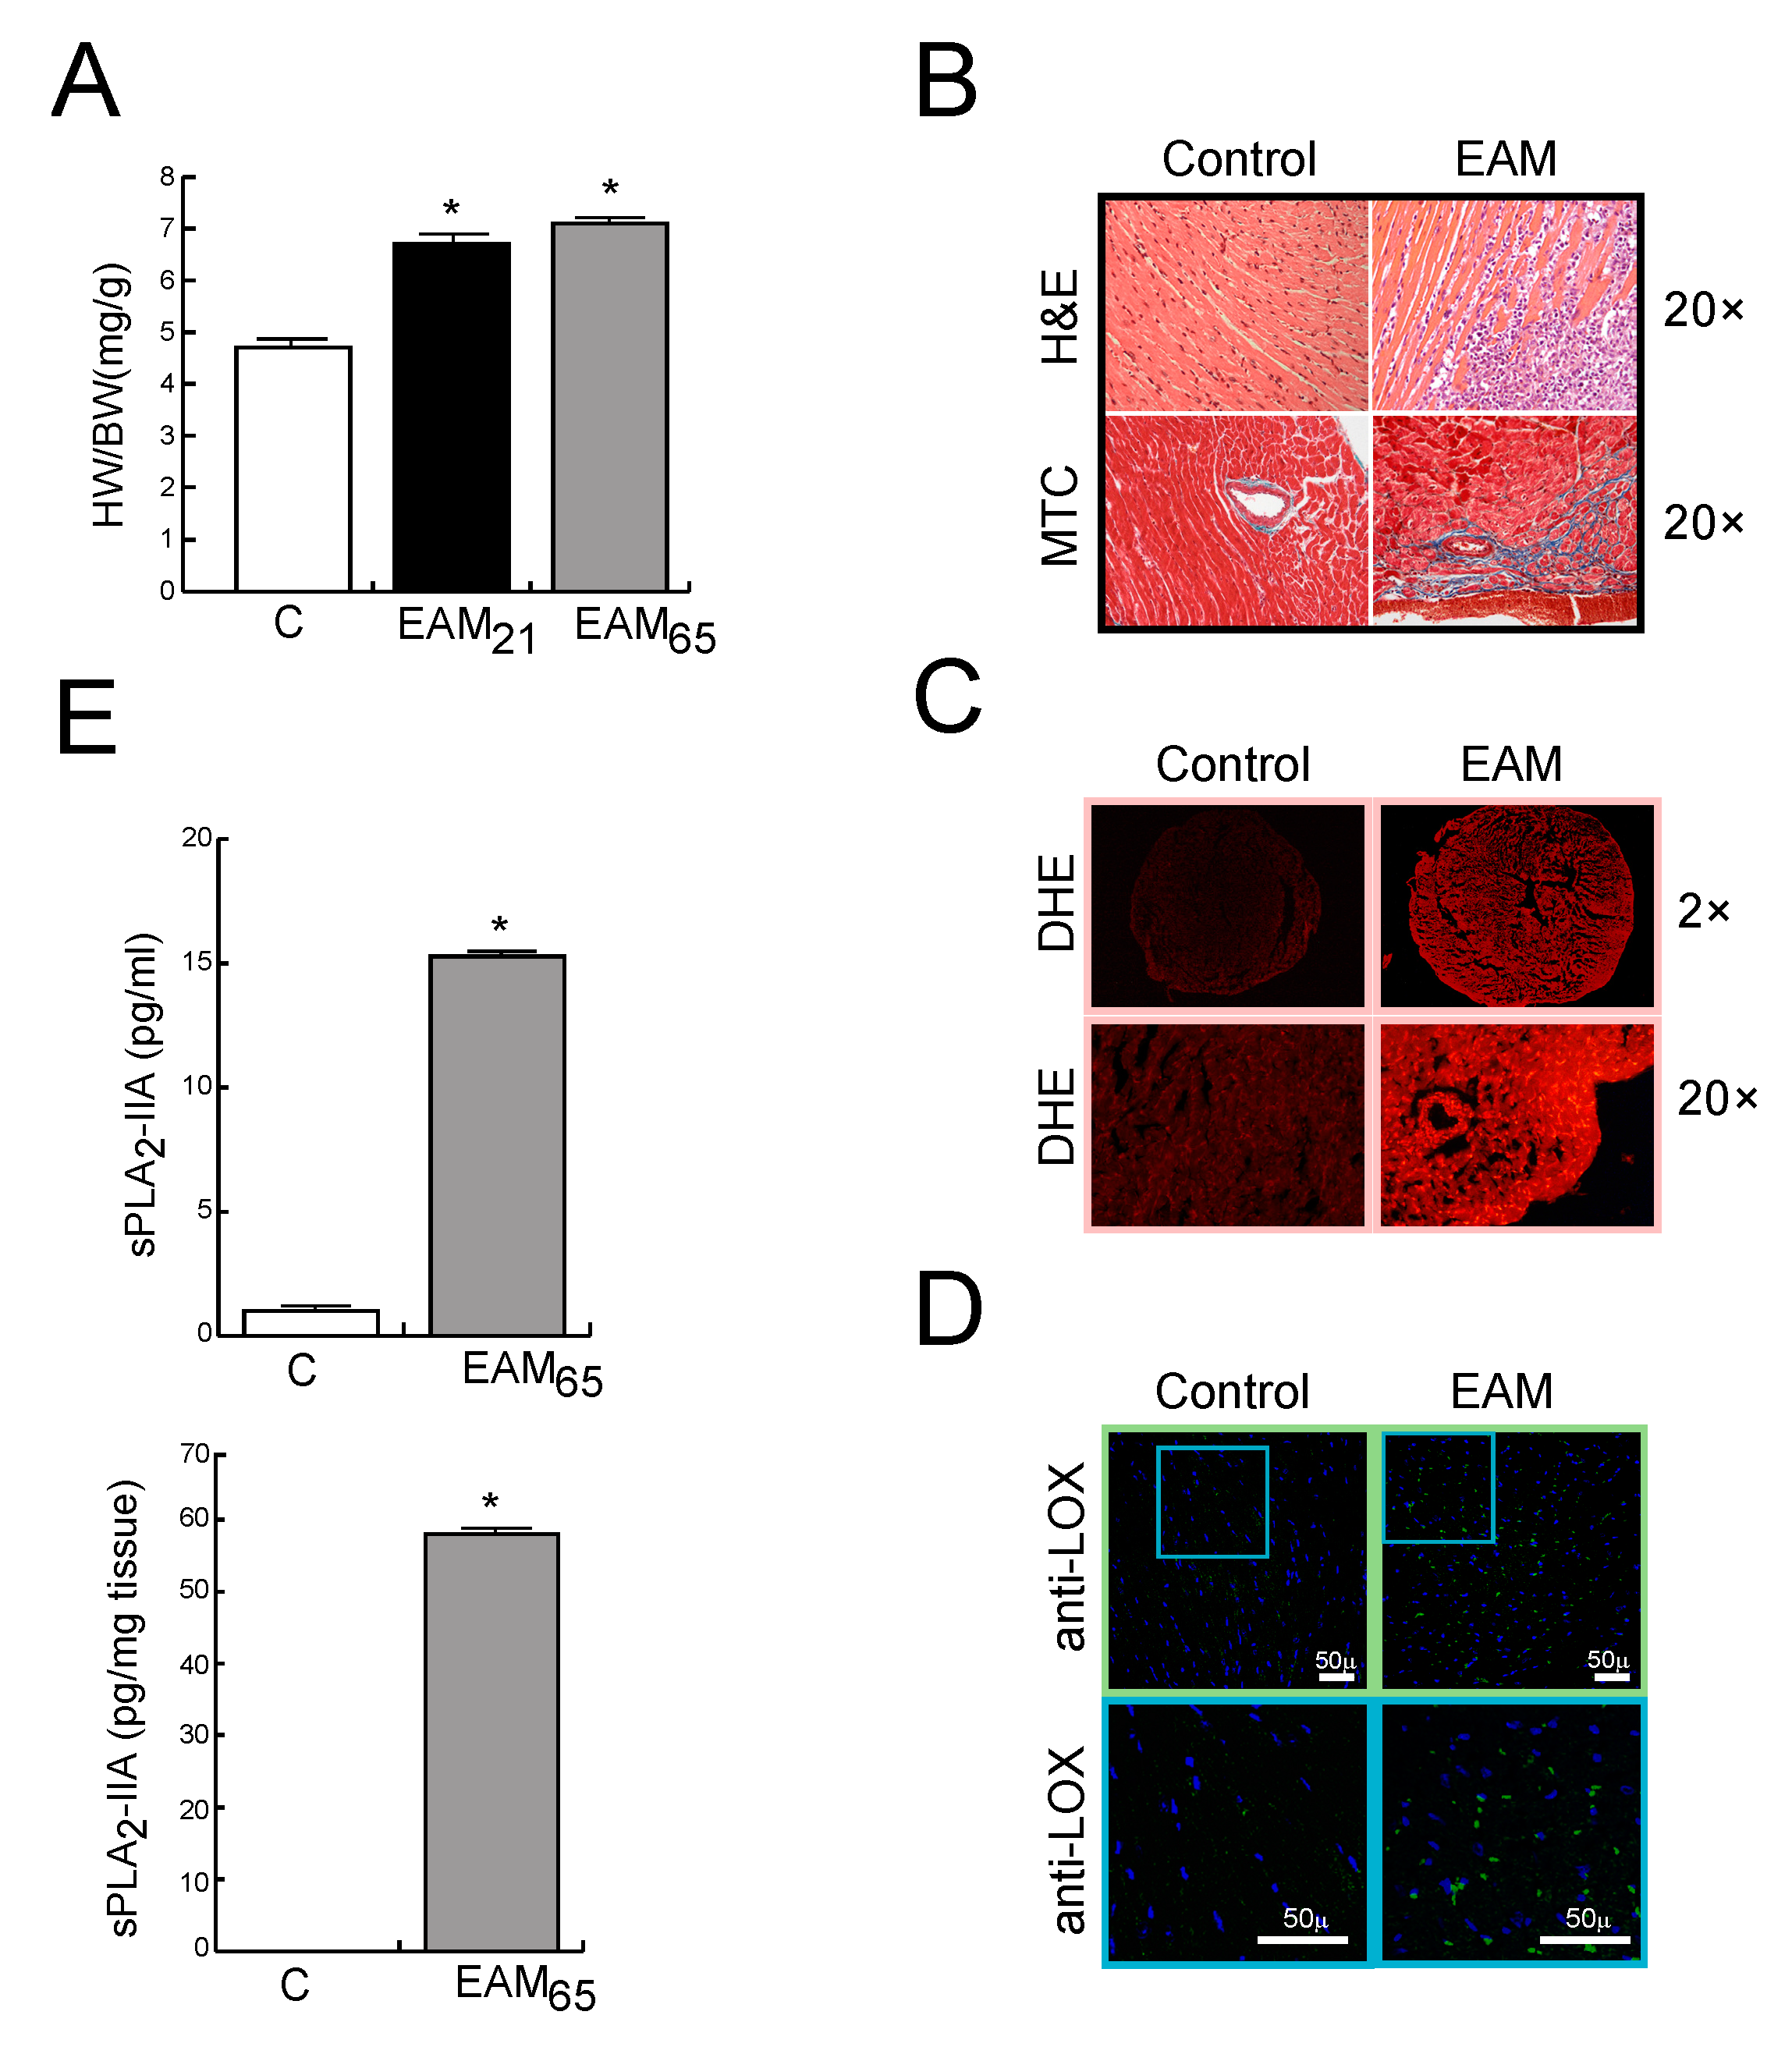
Abstract
1. Introduction
2. Materials and Methods
2.1. Materials
2.2. Animals and Immunization
2.3. Histological and Immunohistochemical Studies
2.4. In Situ Detection of Superoxide Production
2.5. Measurements of sPLA2-IIA by an Enzyme-Linked Immunosorbent Assay (ELISA)
2.6. In Vitro Studies
2.6.1. Cell Culture
2.6.2. Cell Proliferation Assay
2.6.3. Quantification of Collagen Deposition
2.6.4. Measurement of ROS Production and Mitochondrial Inner Transmembrane Potential Detection
2.6.5. Flow Cytometric Analysis
2.6.6. Measurements of LOX Enzymatic Activity
2.6.7. Western Blot Analysis
2.6.8. Immunofluorescence Studies
2.7. Statistical Analyses
3. Results
3.1. In Vivo Findings
sPLA2-IIA is Up-Regulated in MyCHα-Induced Myocarditis
3.2. In vitro Findings
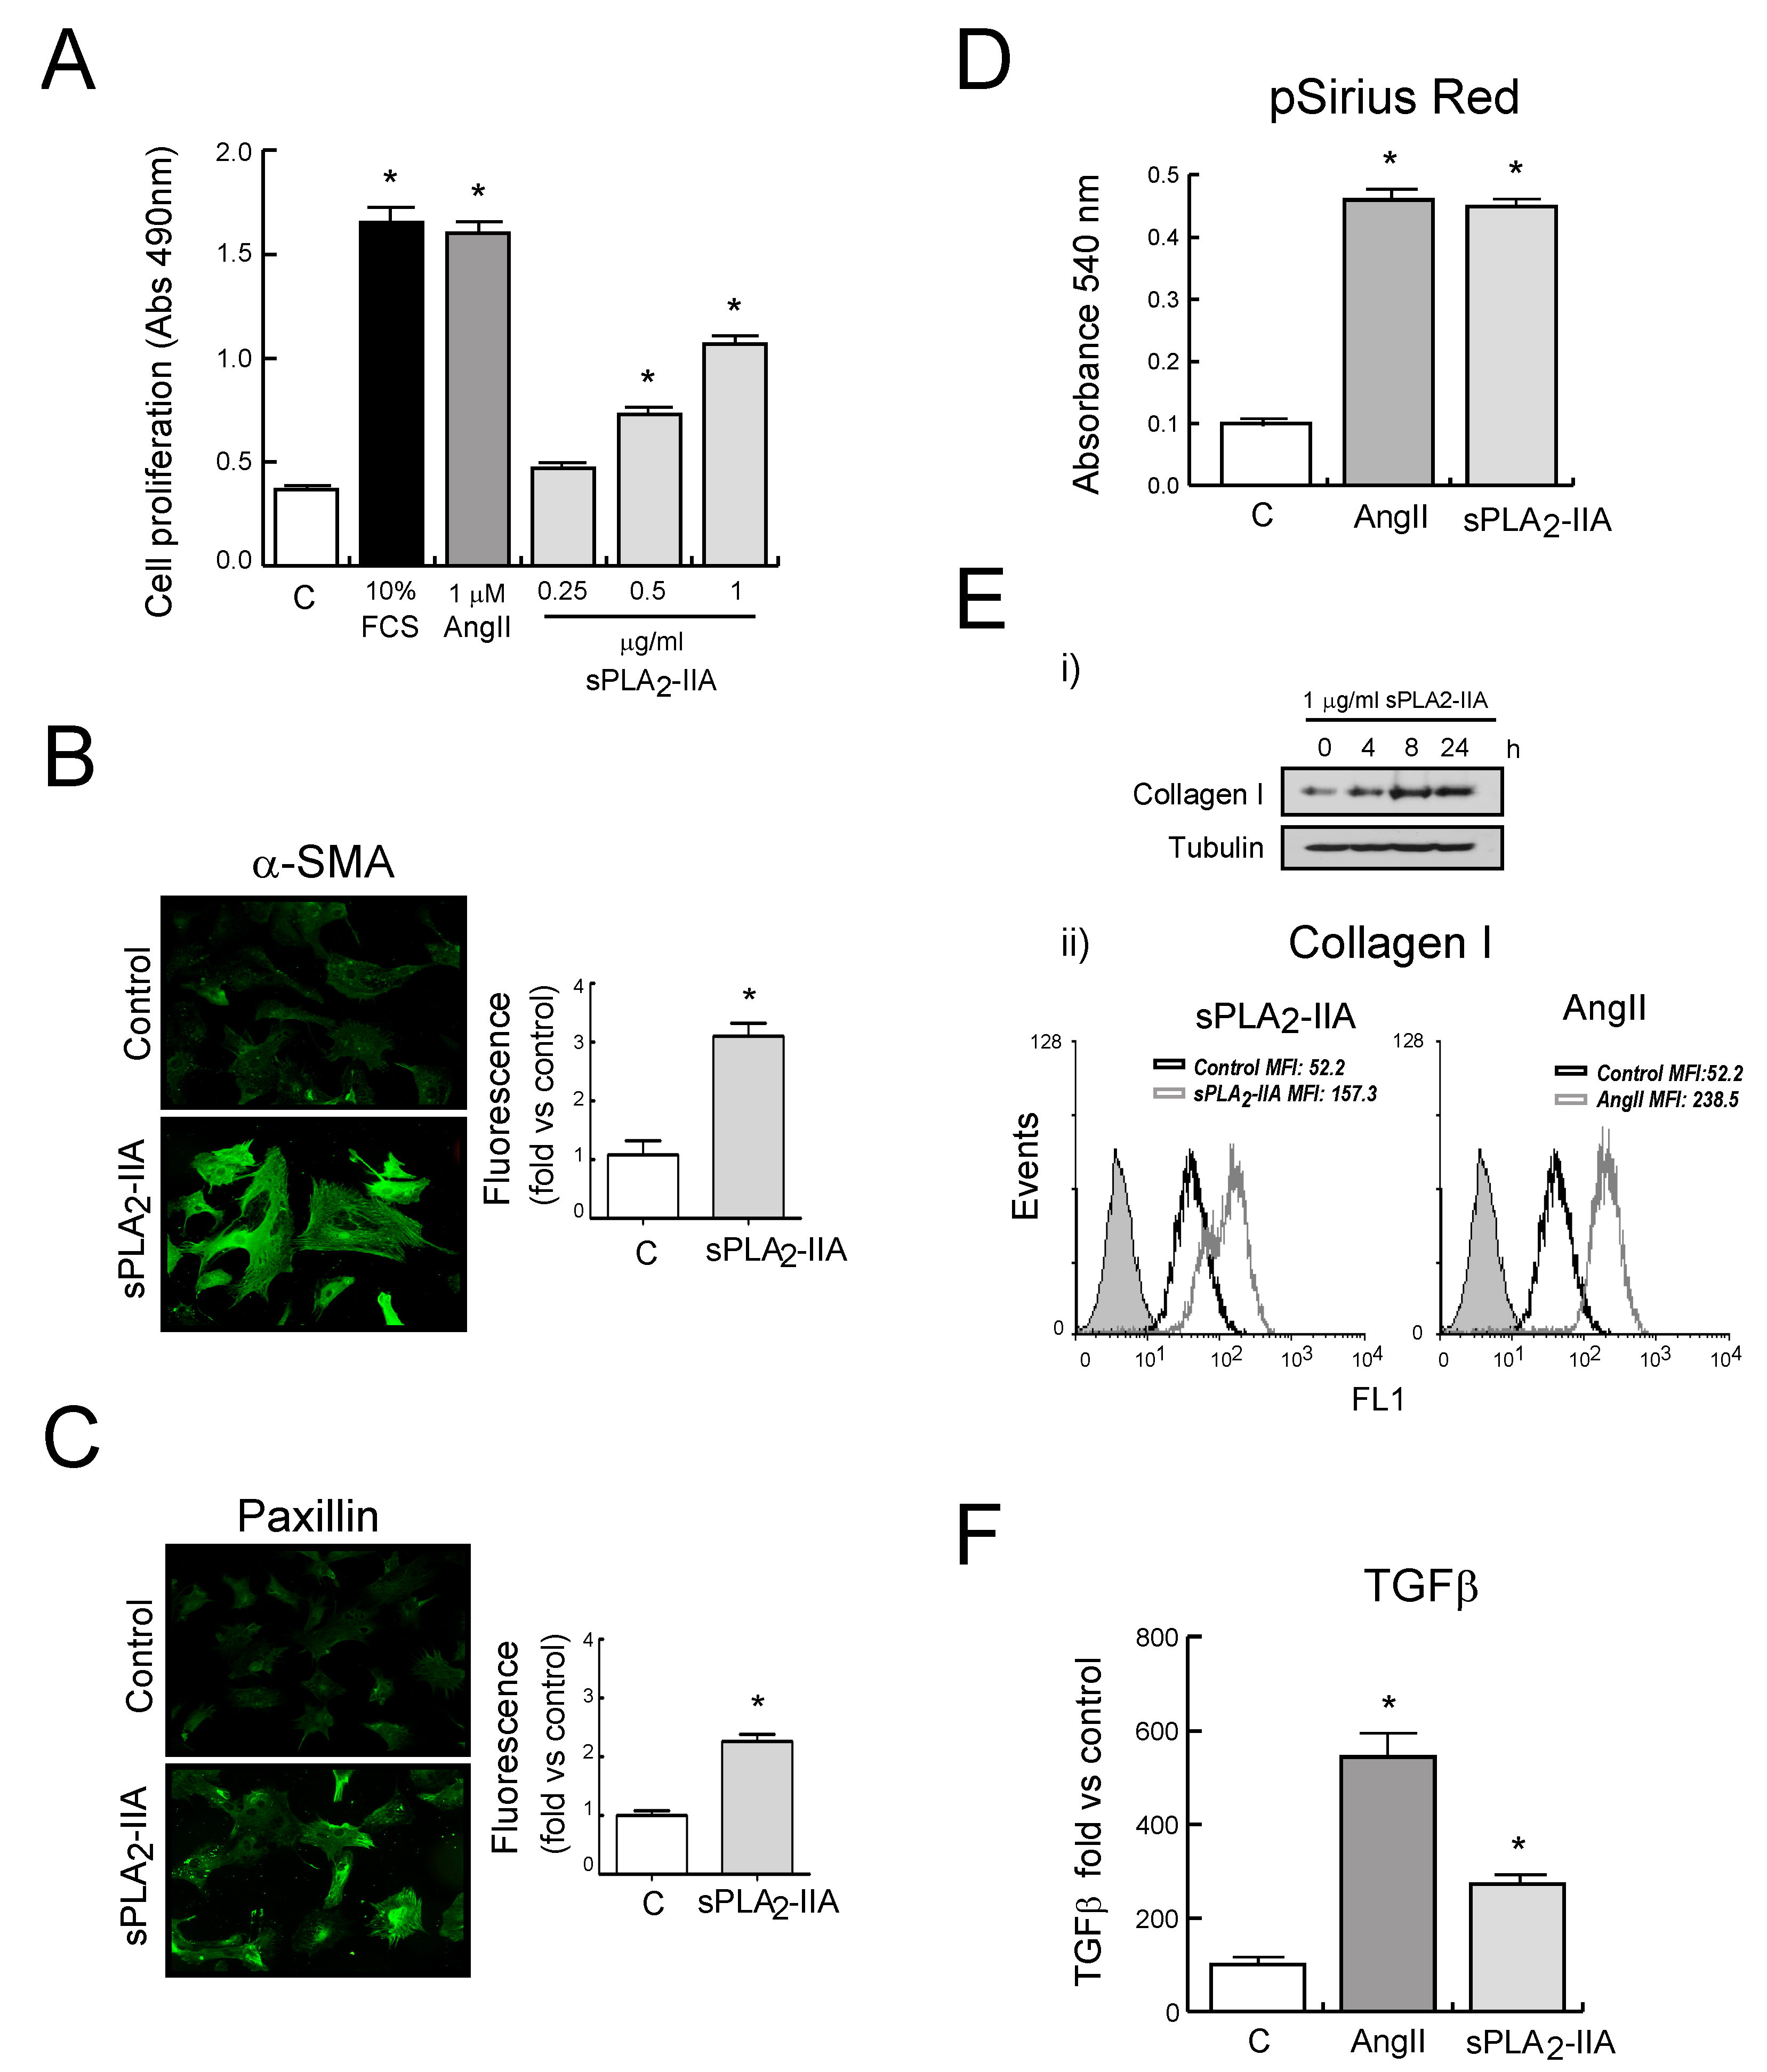
3.2.1. sPLA2-IIA Induces CF Proliferation and Collagen Synthesis
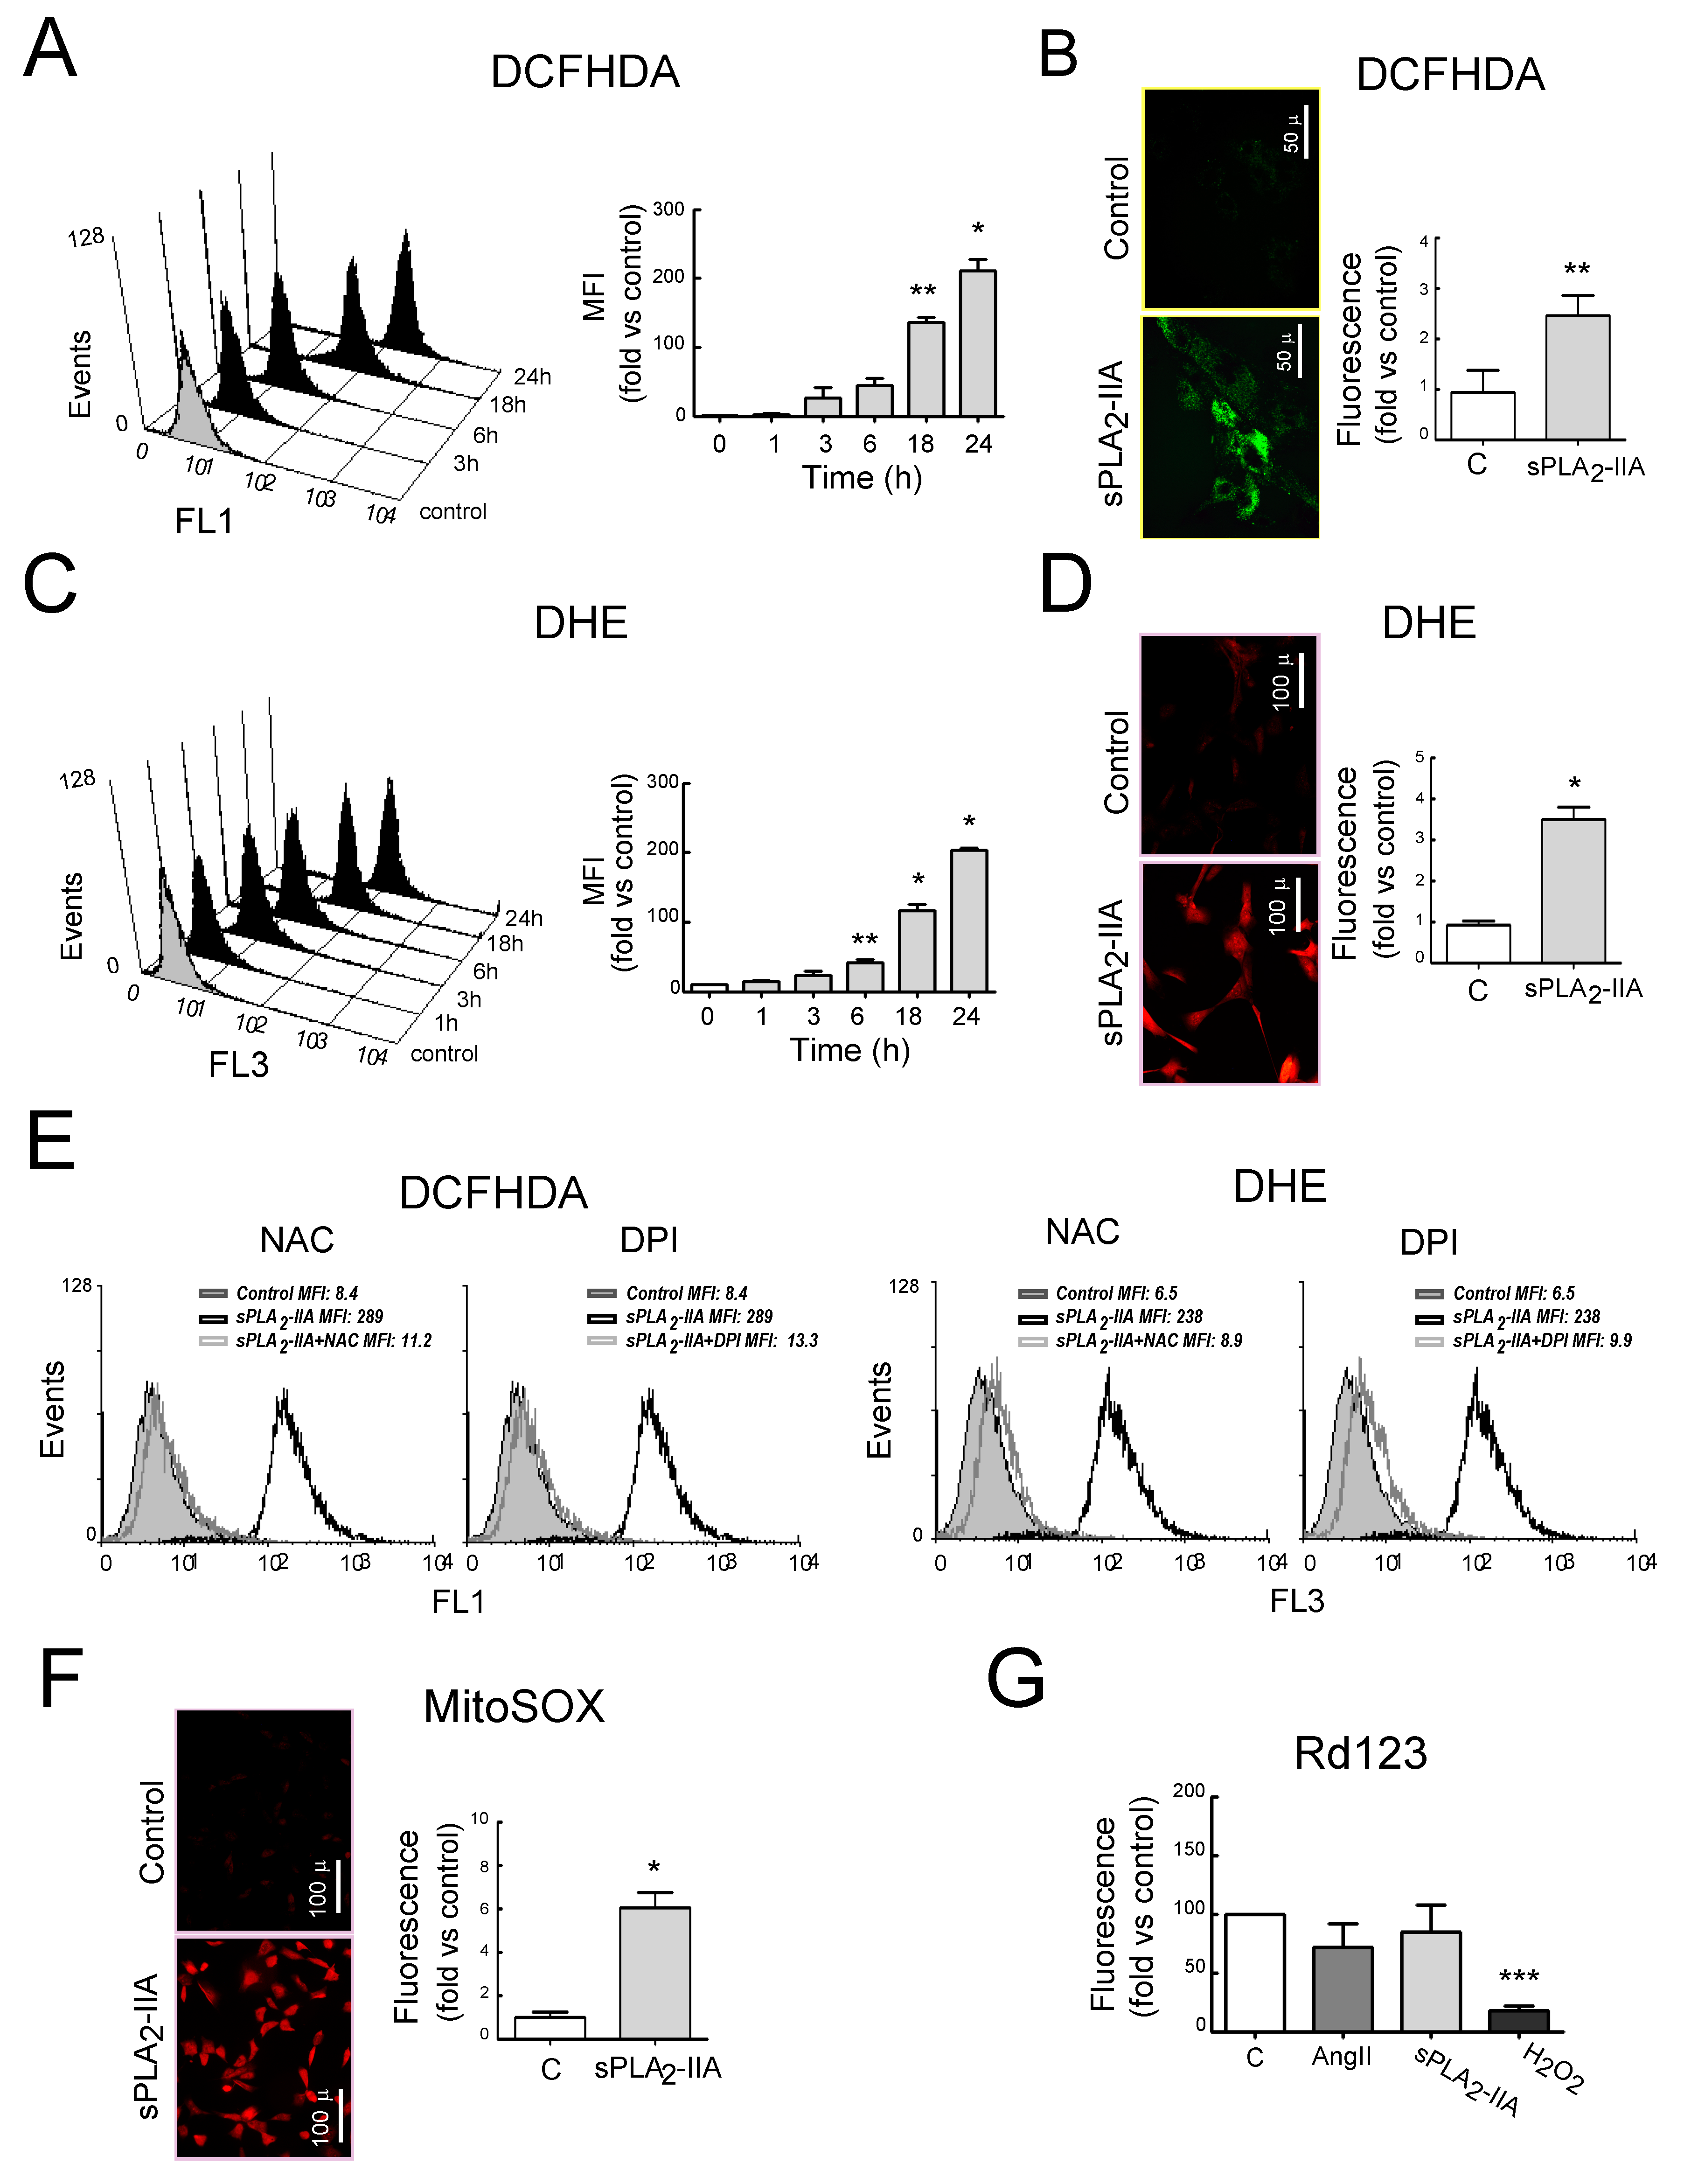
3.2.2. sPLA2-IIA Induces Oxidative Stress in Cardiac Fibroblast
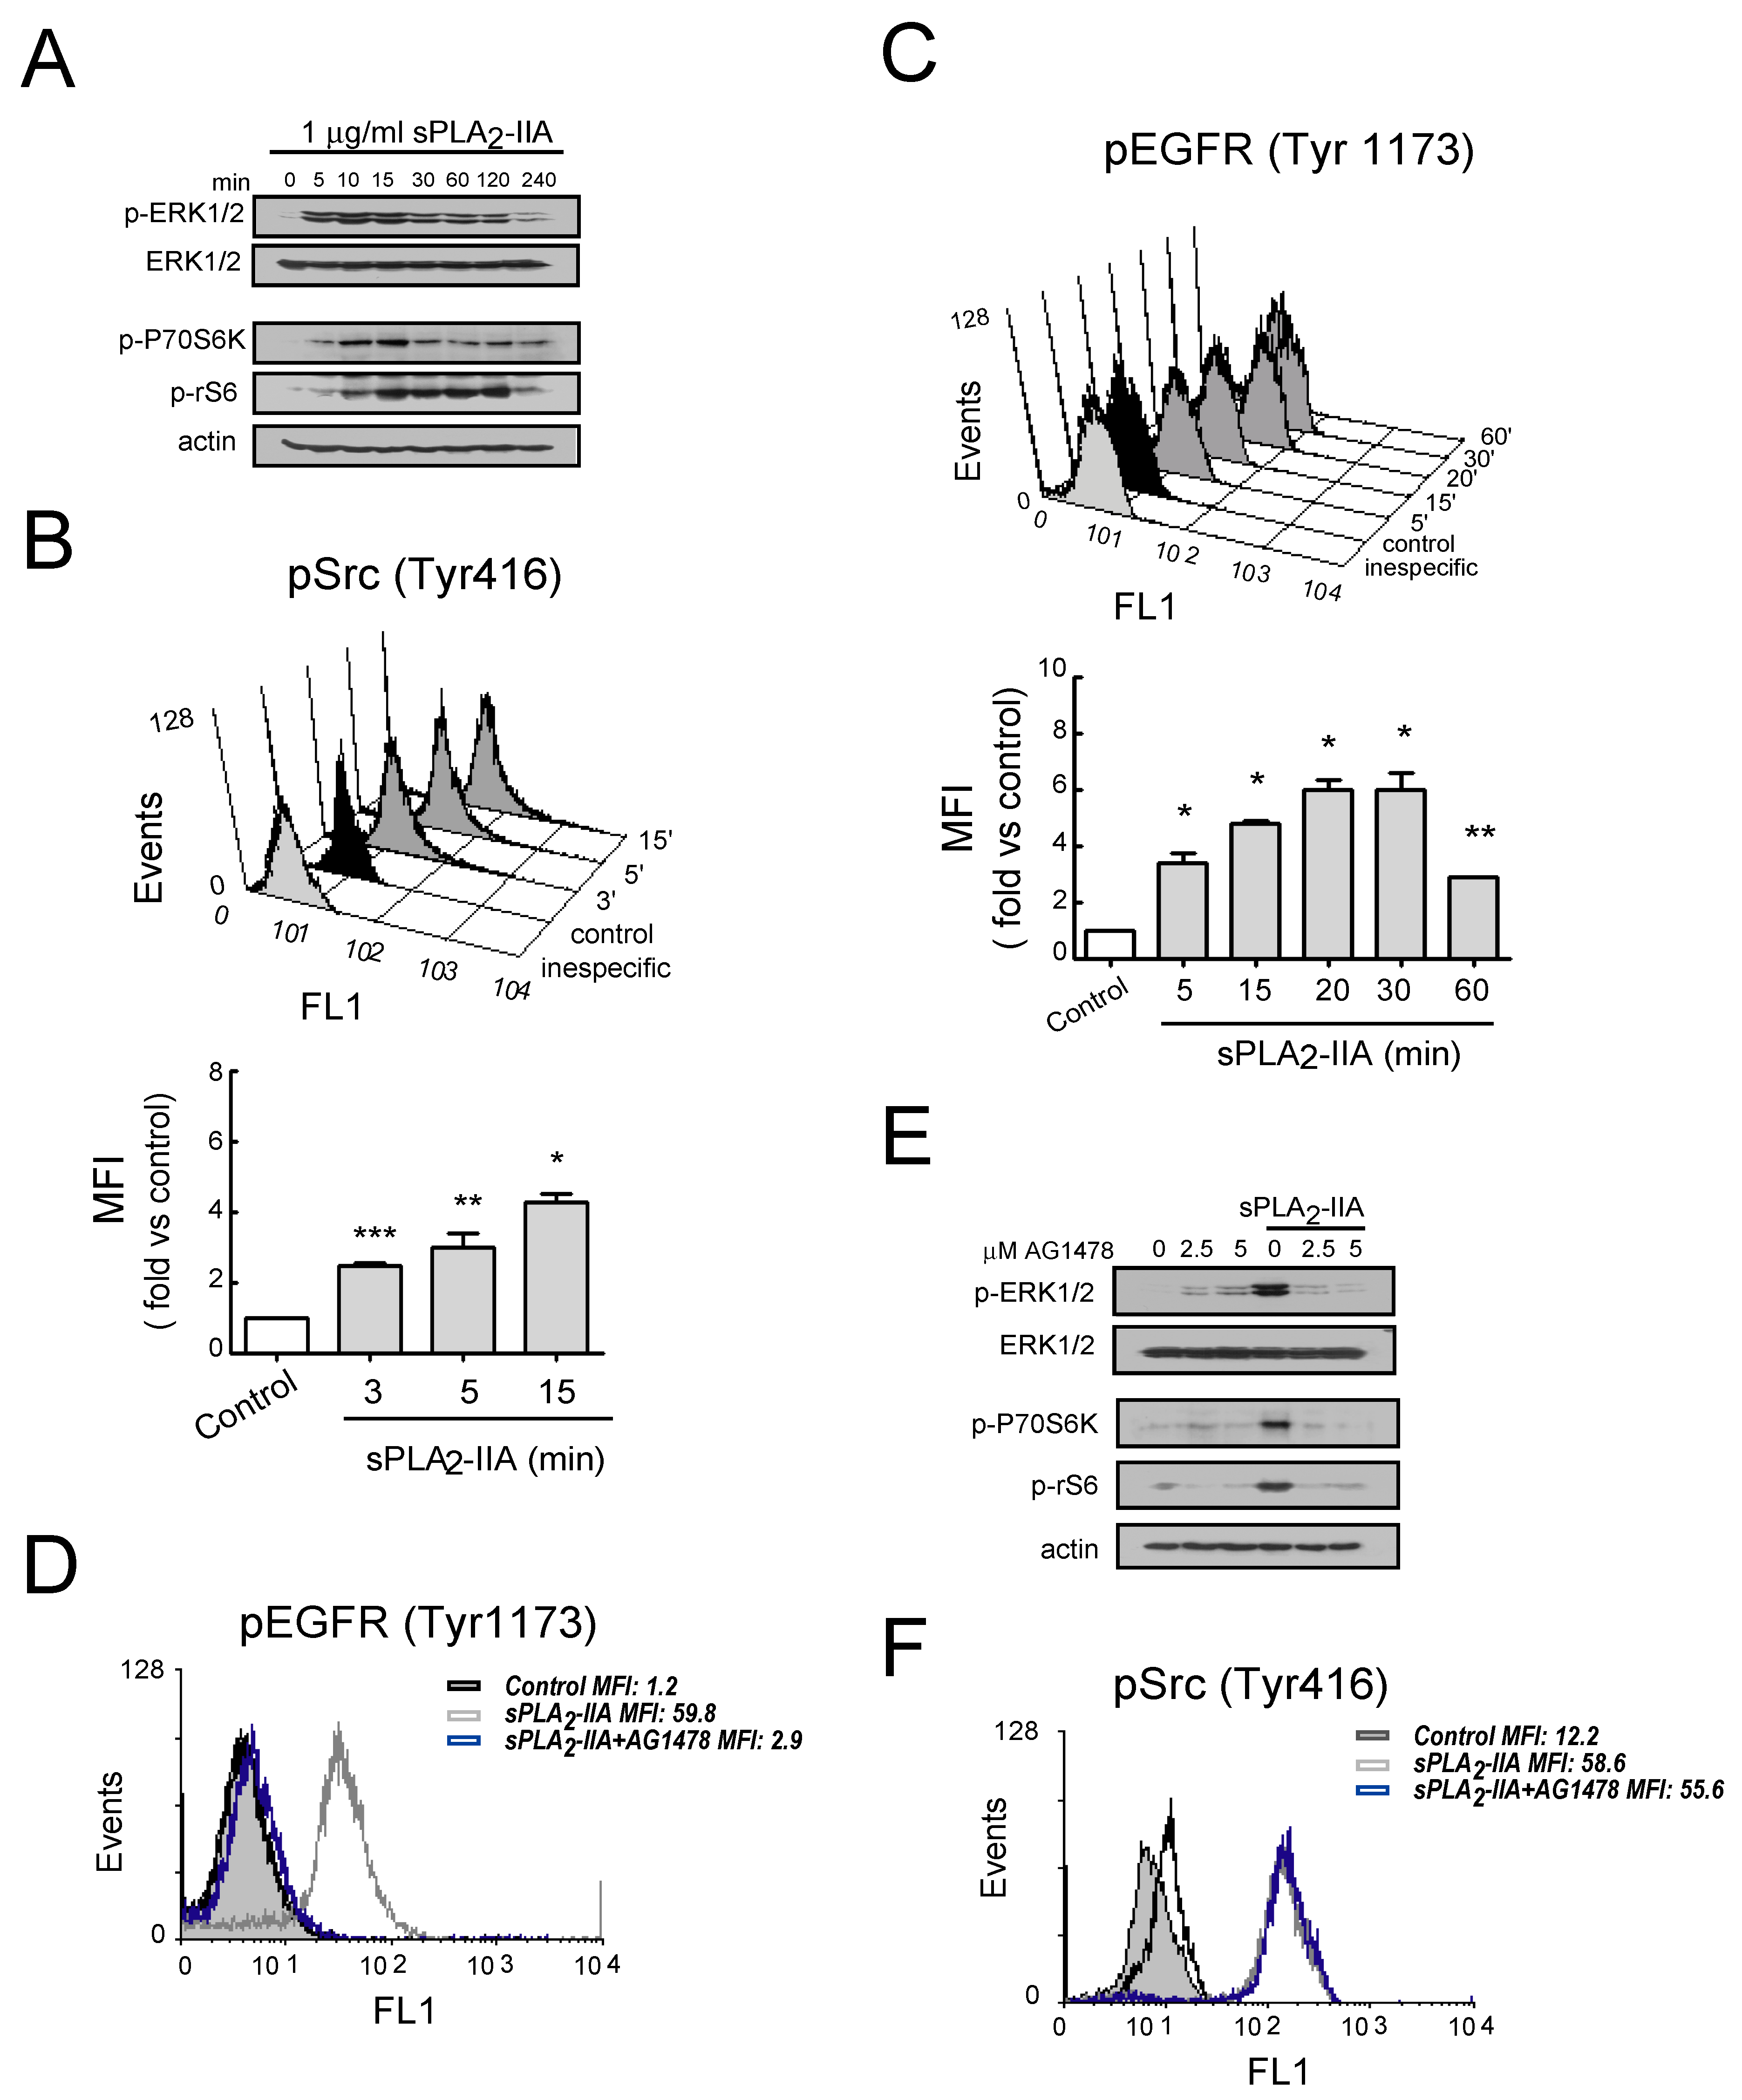
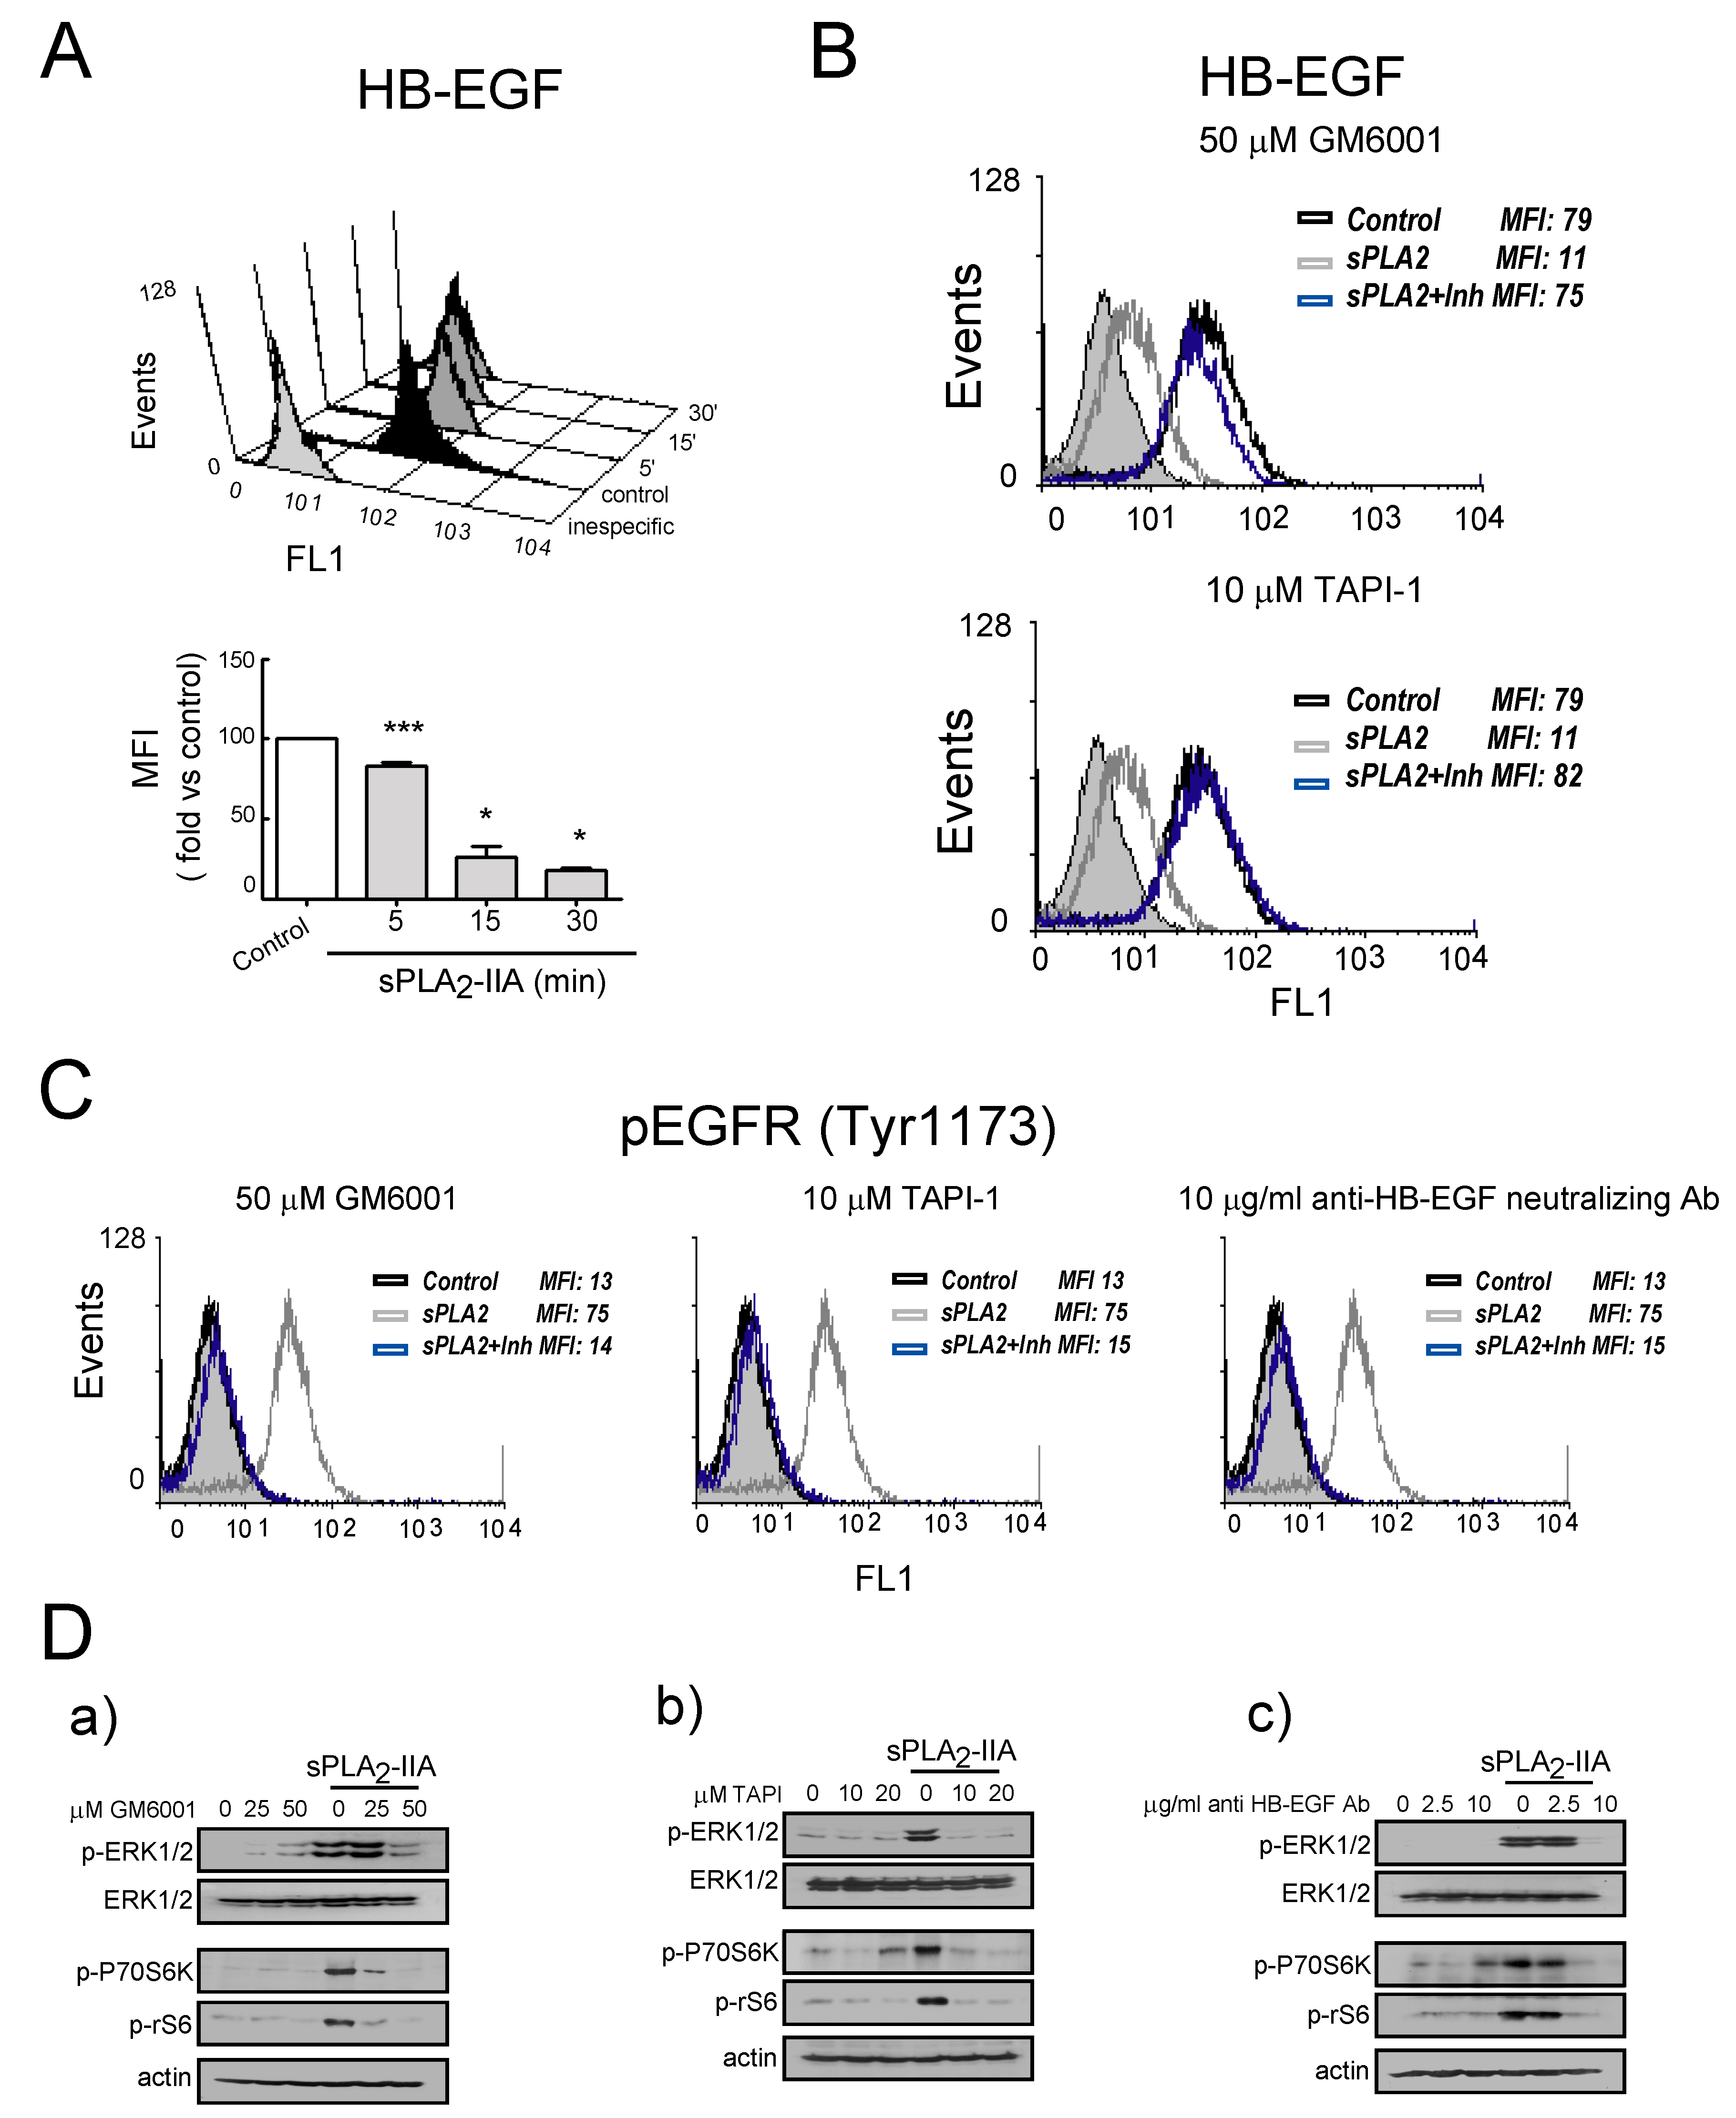
3.2.3. sPLA2-IIA-Activated Intracellular Signaling Cascades in Cardiac Fibroblast Requires EGFR Transactivation and ProHB-EGF Shedding
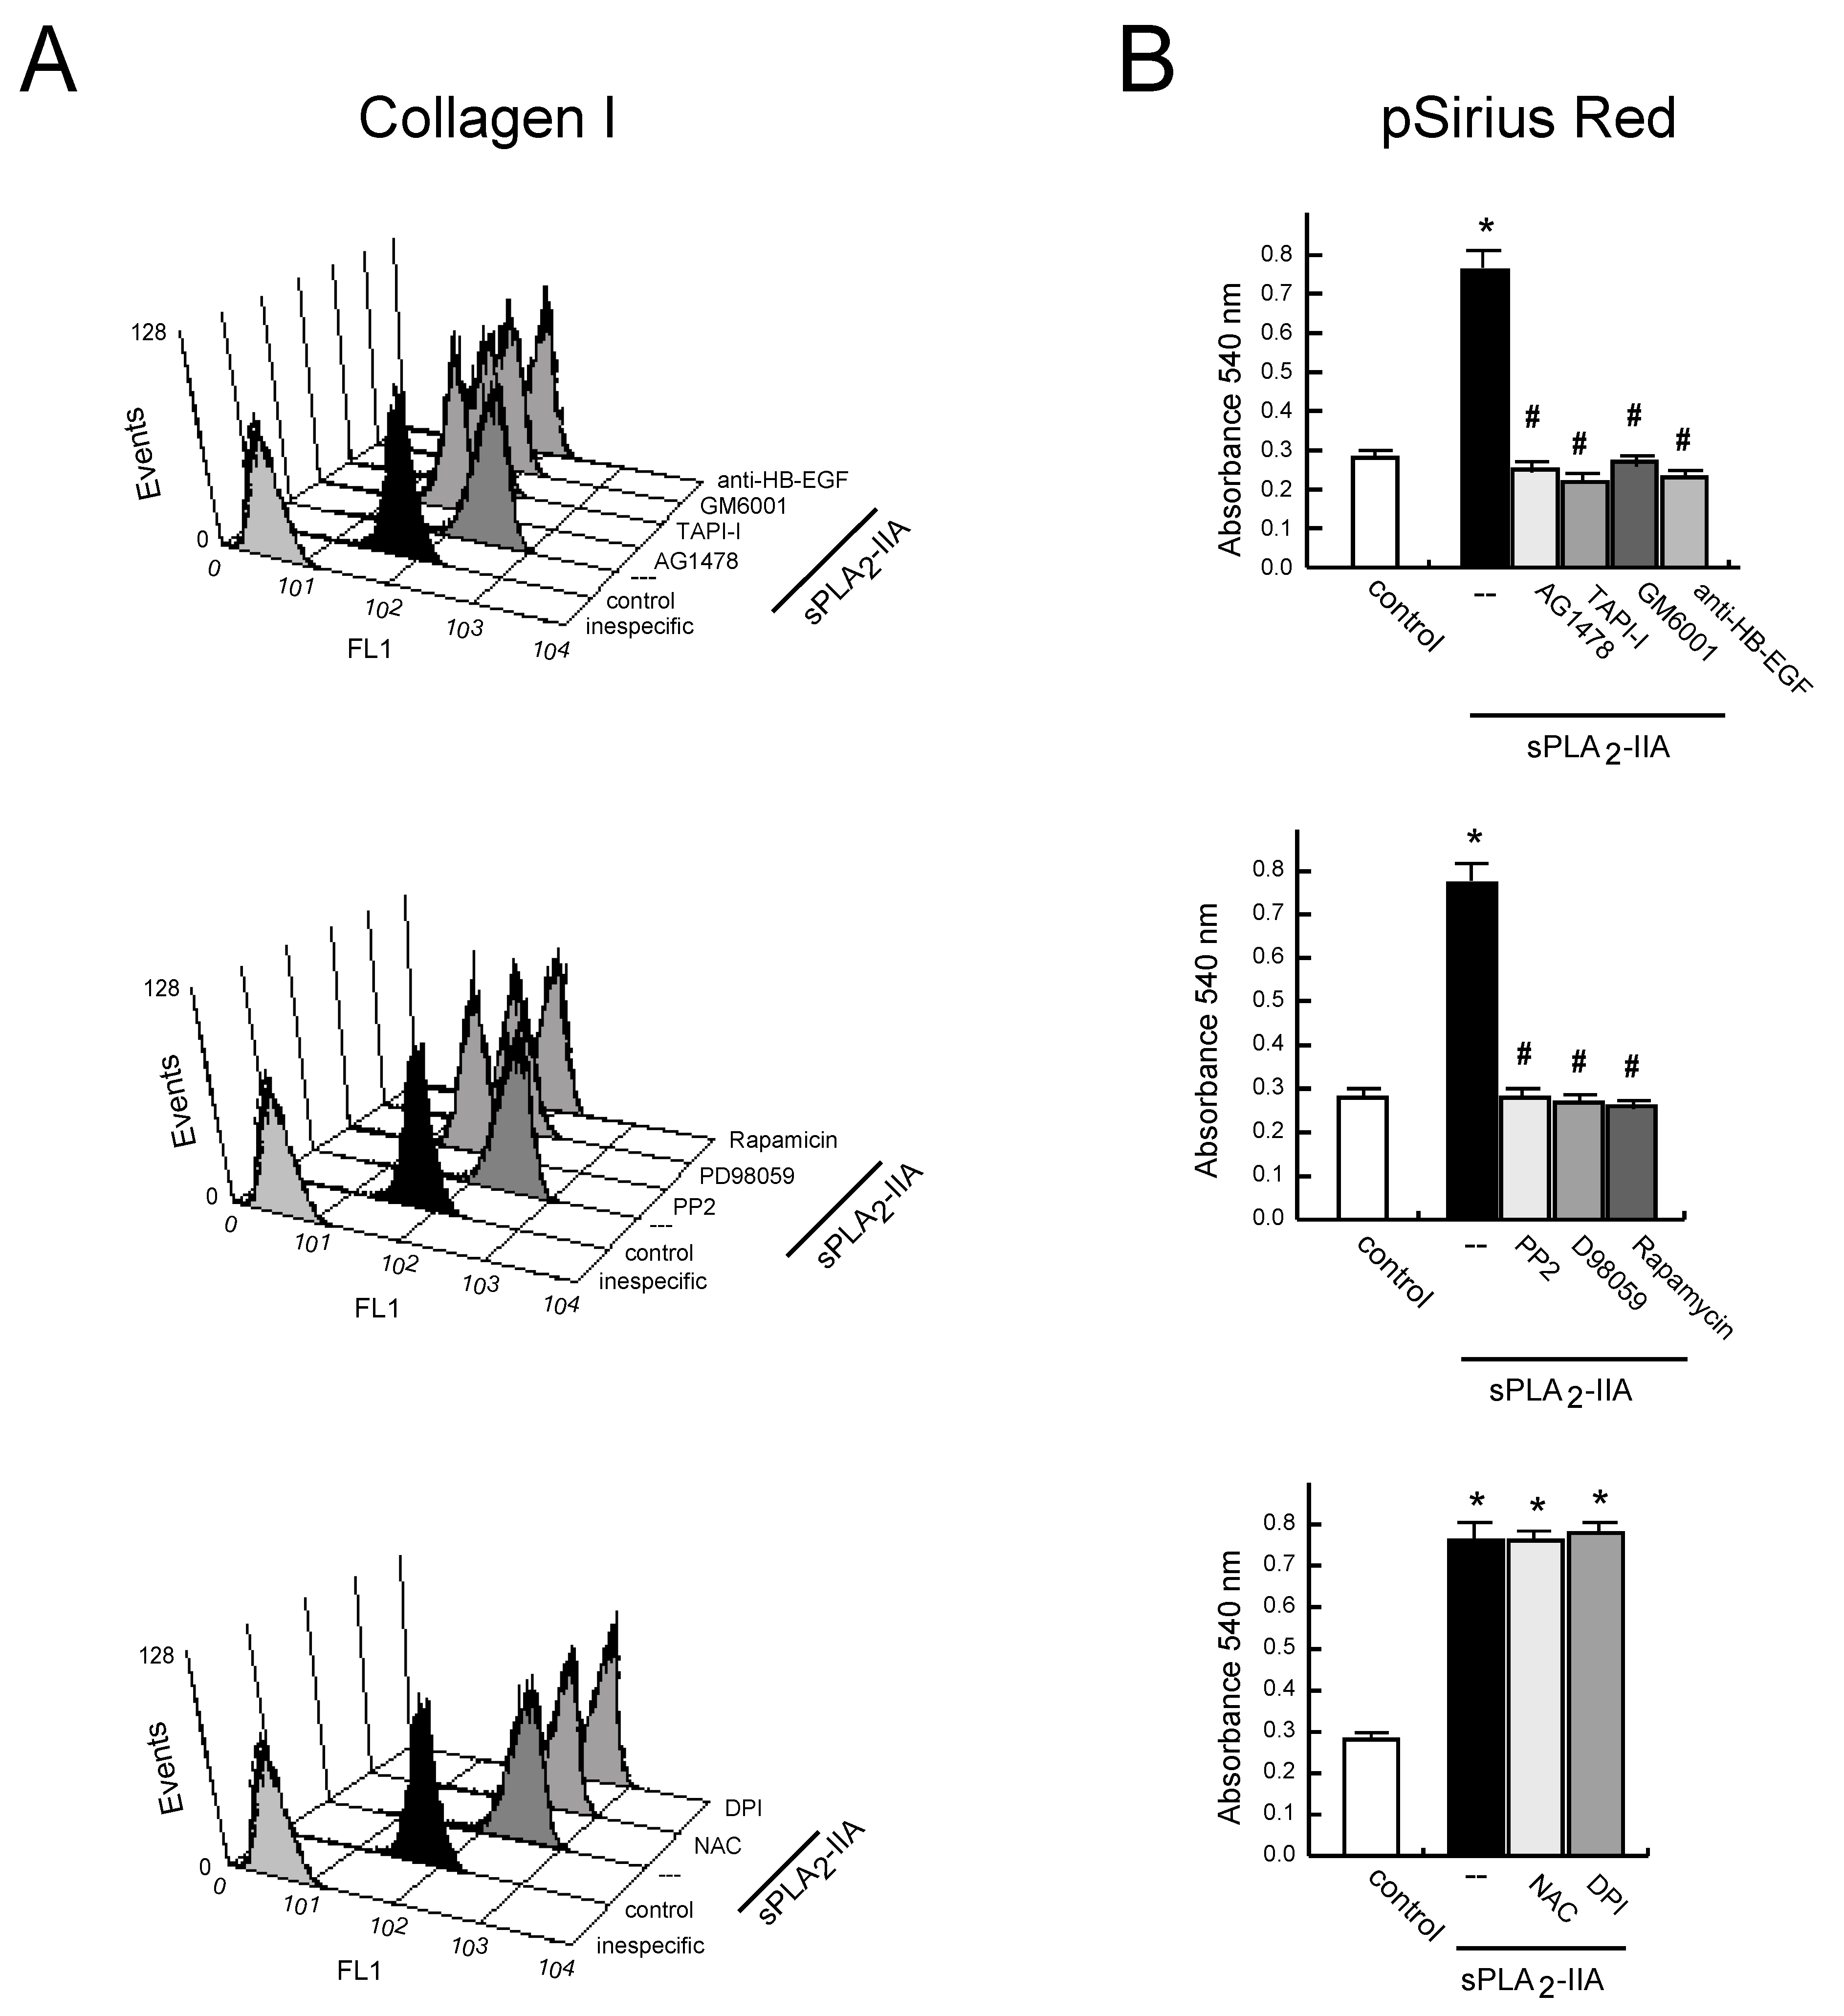
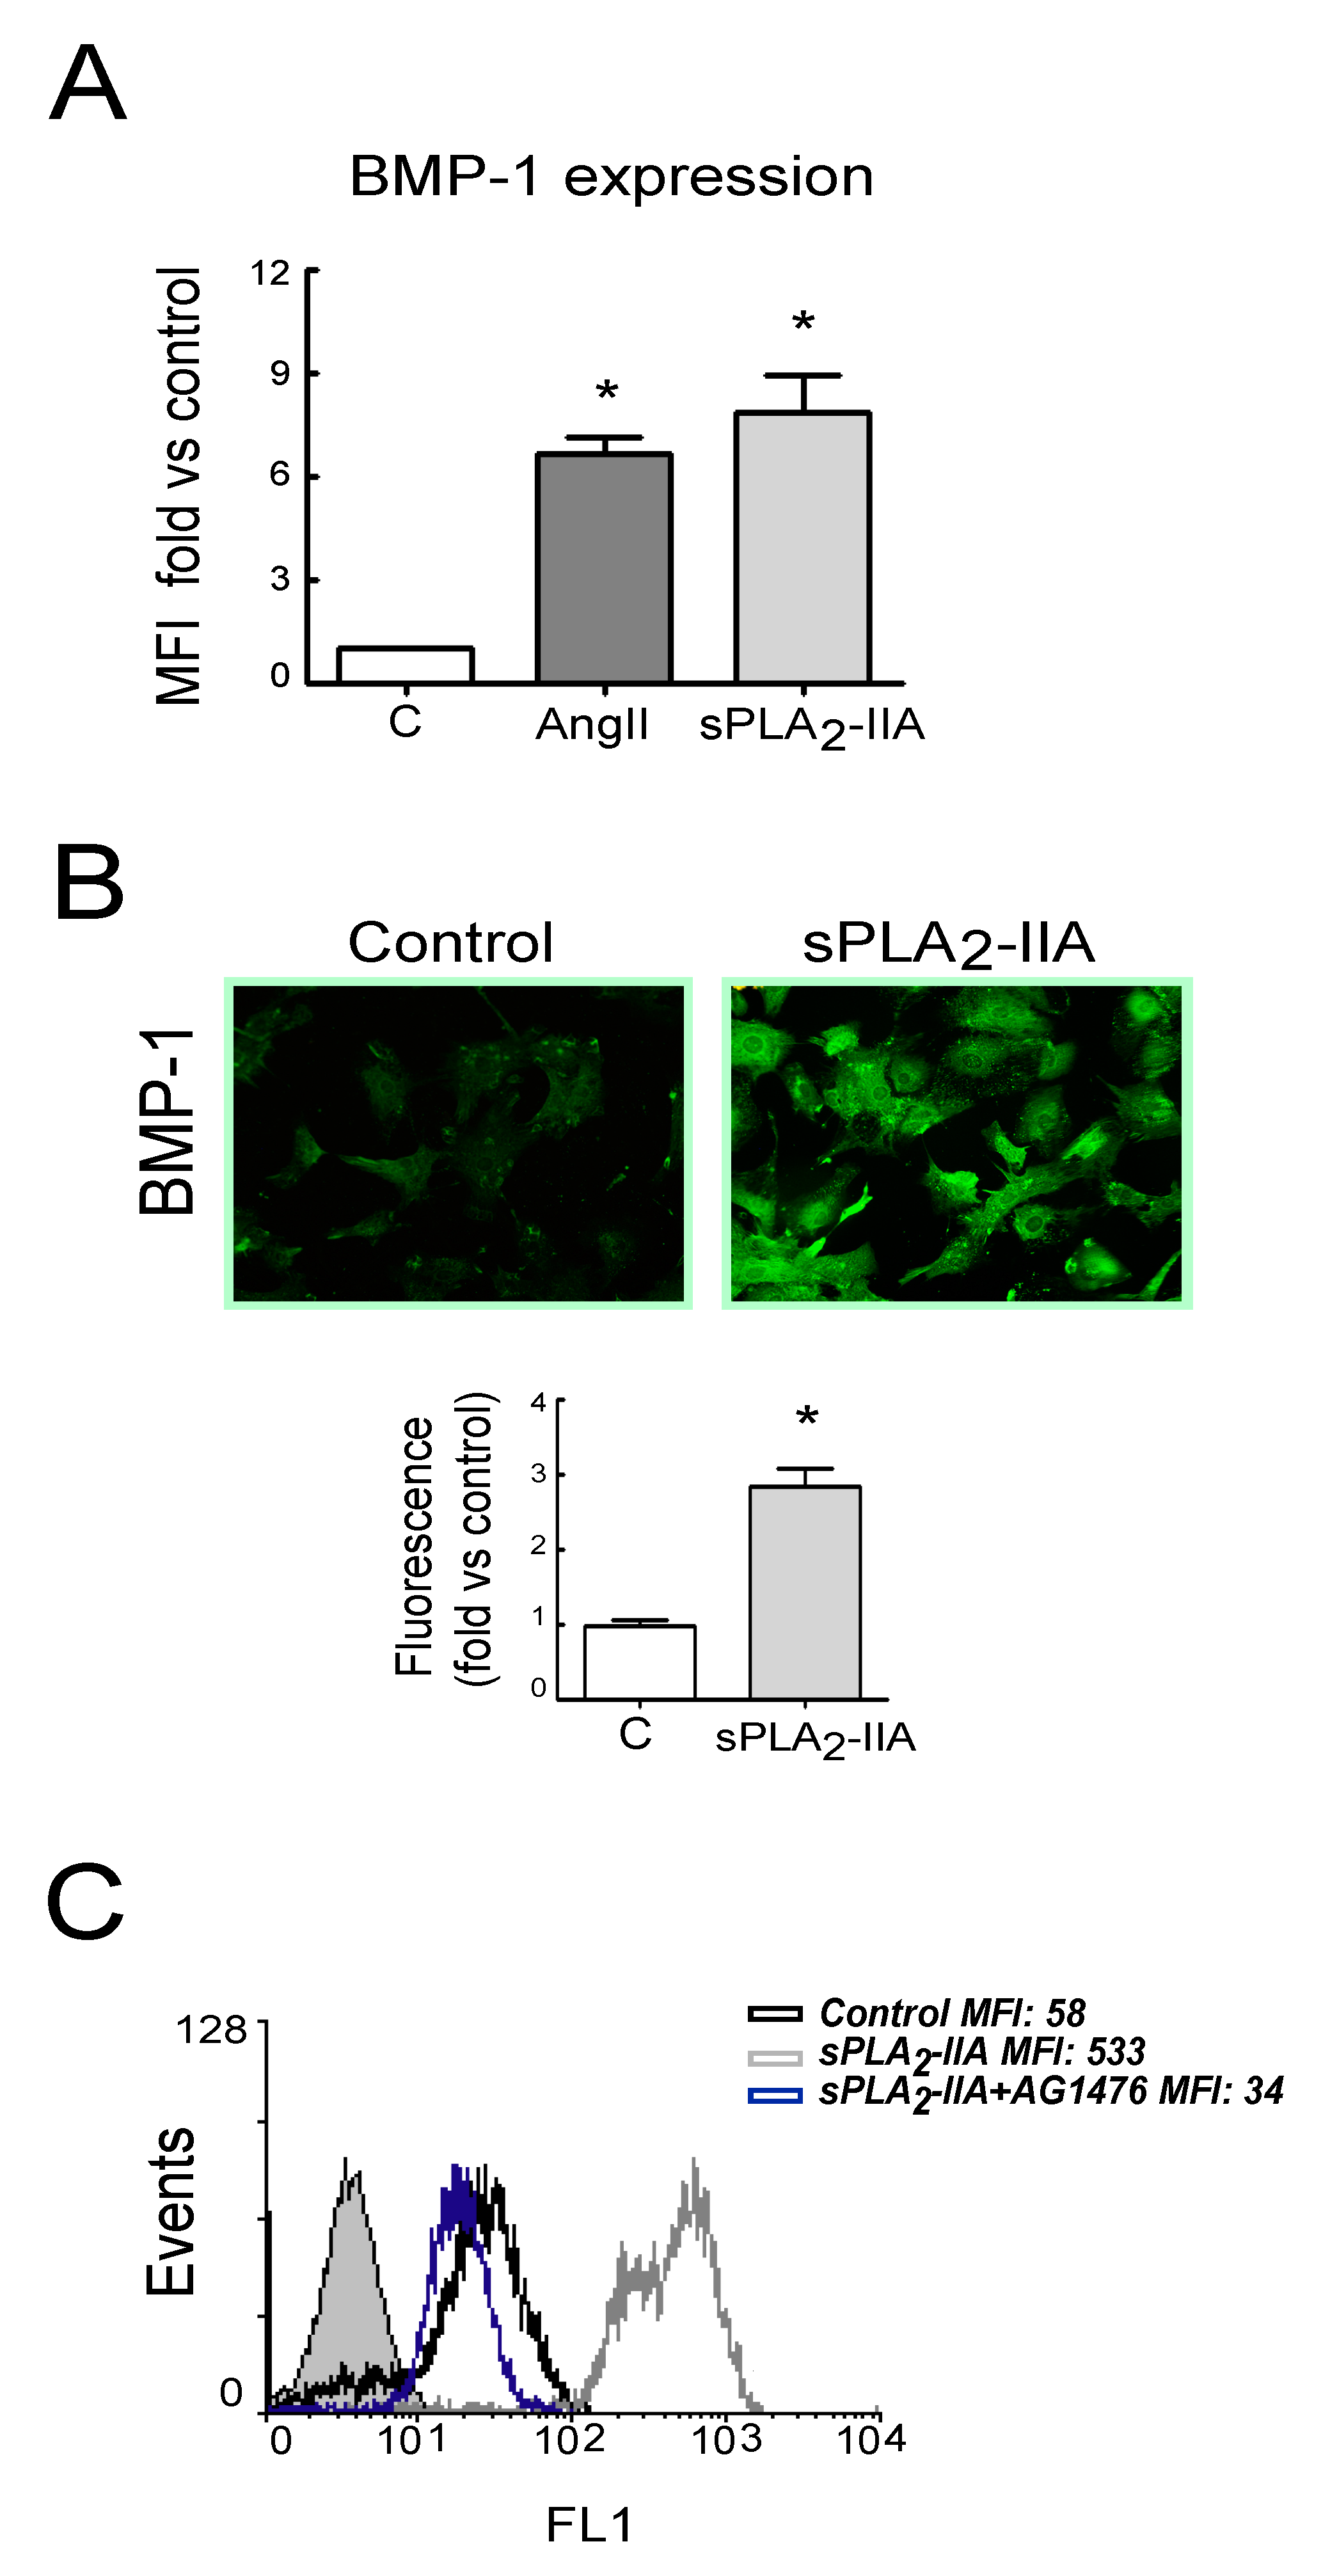
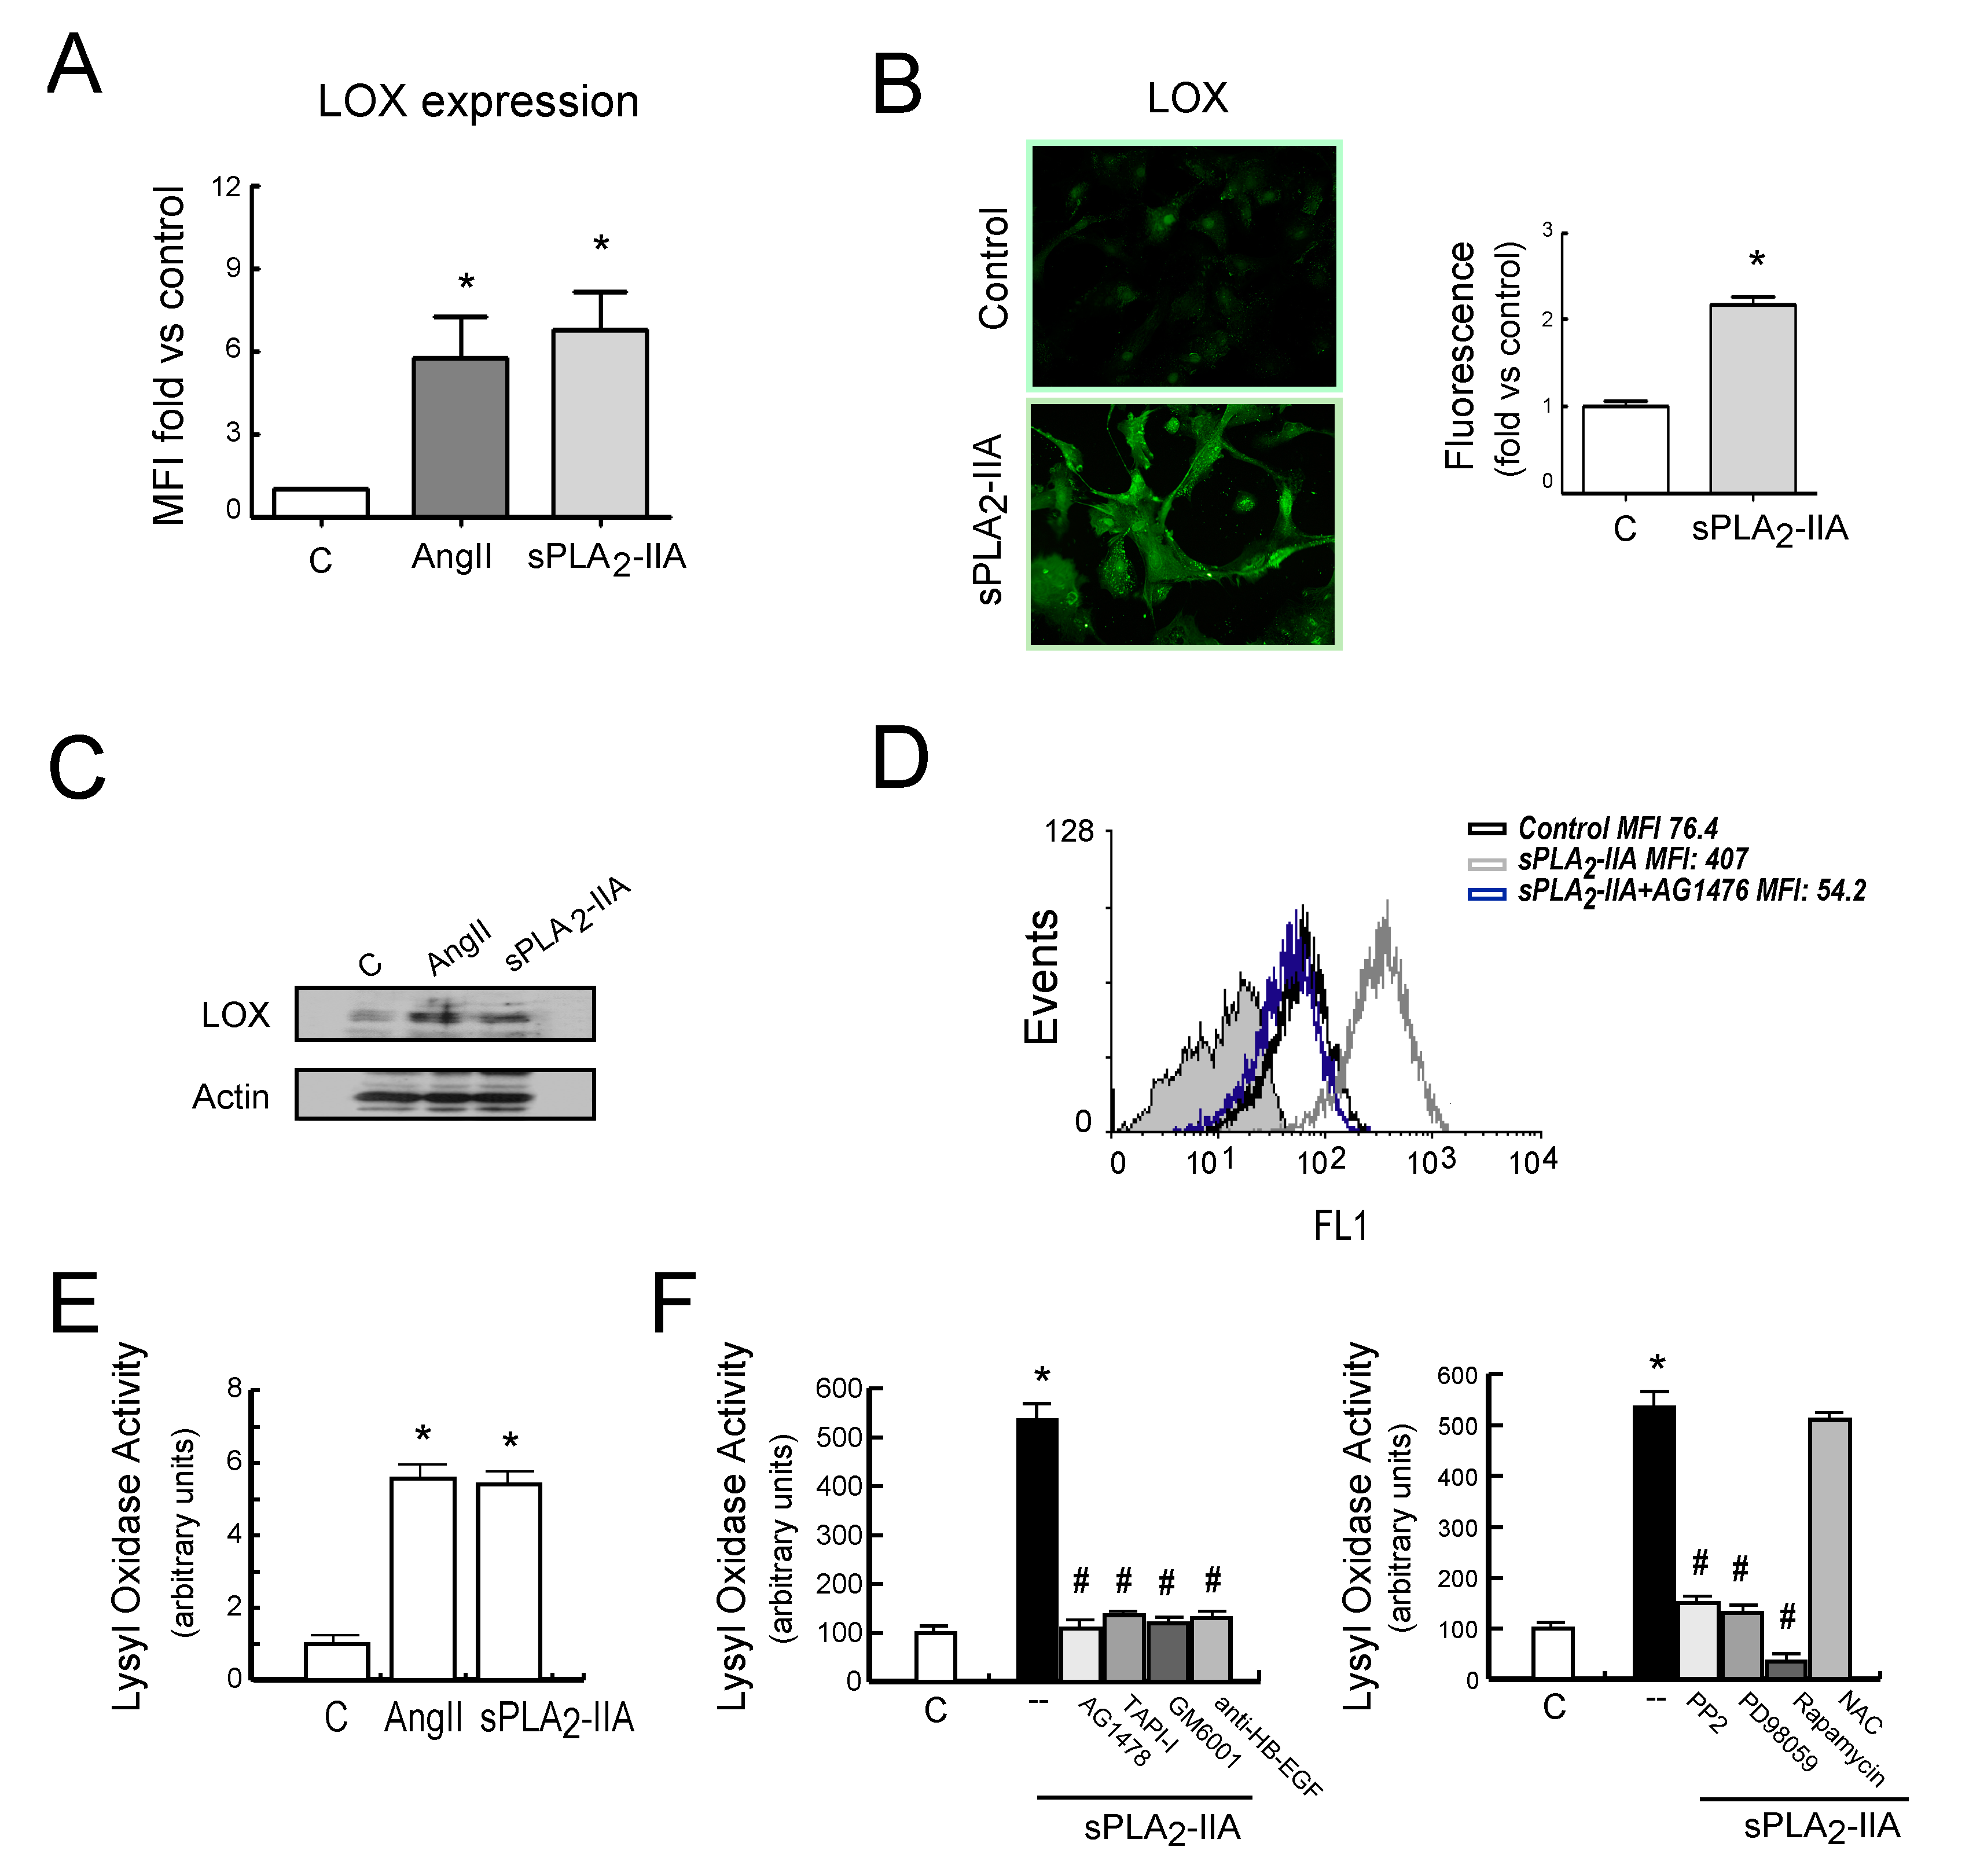
3.2.4. sPLA2-IIA-Induced Transactivation of EGFR Regulates Collagen Production and Maturation in CFs
4. Discussion
Supplementary Materials
Author Contributions
Funding
Acknowledgments
Conflicts of Interest
References
- Sagar, S.; Liu, P.P.; Cooper, L.T., Jr. Myocarditis. Lancet 2012, 379, 738–747. [Google Scholar] [CrossRef]
- Cihakova, D.; Rose, N.R. Chapter 4 Pathogenesis of myocarditis and dilated cardiomyopathy. Adv. Immunol. 2008, 99, 95–114. [Google Scholar]
- Rose, N.R. The significance of autoimmunity in myocarditis. Ernst Scher. Res. Found. Workshop 2006, 55, 141–154. [Google Scholar]
- Gjesdal, O.; Bluemke, D.A.; Lima, J.A. Cardiac remodeling at the population level—risk factors, screening, and outcomes. Nat. Rev. Cardiol. 2011, 8, 673–685. [Google Scholar] [CrossRef]
- Kania, G.; Blyszczuk, P.; Eriksson, U. Mechanisms of cardiac fibrosis in inflammatory heart disease. Trends Cardiovasc. Med. 2009, 19, 247–252. [Google Scholar] [CrossRef]
- Torre-Amione, G.; Kapadia, S.; Lee, J.; Durand, J.-B.; Bies, R.D.; Young, J.B.; Mann, D.L. Tumor necrosis factor-α and tumor necrosis factor receptors in the failing human heart. Circ. Res. 1996, 93, 704–711. [Google Scholar] [CrossRef]
- Torre-Amione, G.; Kapadia, S.; Lee, J.; Bies, R.D.; Lebovitz, R.; Mann, D.L. Expression and functional significance of tumor necrosis factor receptors in human myocardium. Circ. Res. 1995, 92, 1487–1493. [Google Scholar] [CrossRef]
- Siwik, D.A.; Chang, D.L.-F.; Colucci, W.S. Interleukin-1β and Tumor Necrosis Factor-α Decrease Collagen Synthesis and Increase Matrix Metalloproteinase Activity in Cardiac Fibroblasts In Vitro. Circ. Res. 2000, 86, 1259–1265. [Google Scholar] [CrossRef]
- Camelliti, P.; Borg, T.K.; Kohl, P. Structural and functional characterisation of cardiac fibroblasts. Cardiovasc. Res. 2005, 65, 40–51. [Google Scholar] [CrossRef]
- Schurch, W.; Seemayer, T.A.; Gabbiani, G. Myofibroblast. In Histology for pathologists; Sternberg, S.S., Ed.; Raven Press: New York, NY, USA, 1992; pp. 109–144. [Google Scholar]
- Fan, D.; Takawale, A.; Lee, J.; Kassiri, Z. Cardiac fibroblasts, fibrosis and extracellular matrix remodeling in heart disease. Fibrogenesis Tissue Repair 2012, 5, 15. [Google Scholar] [CrossRef]
- Maruhashi, T.; Kii, I.; Saito, M.; Kudo, A. Interaction between Periostin and BMP-1 Promotes Proteolytic Activation of Lysyl Oxidase. J. Biol. Chem. 2010, 285, 13294–13303. [Google Scholar] [CrossRef]
- Trackman, P.C. Diverse biological functions of extracellular collagen processing enzymes. J. Cell. Biochem. 2005, 96, 927–937. [Google Scholar] [CrossRef] [PubMed]
- Murakami, M.; Taketomi, Y.; Sato, H.; Yamamoto, K. Secreted phospholipase A2 revisited. J. Biochem. 2011, 150, 233–255. [Google Scholar] [CrossRef]
- Murakami, M.; Sato, H.; Miki, Y.; Yamamoto, K.; Taketomi, Y. A new era of secreted phospholipase A₂. J. Lipid Res. 1248; 56. [Google Scholar]
- Akinkuolie, A.O.; Lawler, P.R.; Chu, A.Y.; Caulfield, M.; Mu, J.; Ding, B.; Nyberg, F.; Glynn, R.J.; Ridker, P.M.; Hurt-Camejo, E.; et al. Group IIA Secretory Phospholipase A2, Vascular Inflammation, and Incident Cardiovascular Disease. Arter. Thromb. Vasc. Biol. 2019, 39, 1182–1190. [Google Scholar] [CrossRef] [PubMed]
- Niessen, H.W.; Krijnen, P.A.; Visser, C.A.; Meijer, C.J.; Hack, C.E. Type II secretory phospholipase A2 in cardiovascular disease: A mediator in atherosclerosis and ischemic damage to cardiomyocytes? Cardiovasc. Res. 2003, 60, 68–77. [Google Scholar] [CrossRef]
- Menschikowski, M.; Hagelgans, A.; Siegert, G. Secretory phospholipase A2 of group IIA: Is it an offensive or a defensive player during atherosclerosis and other inflammatory diseases? Prostaglandins Other Lipid Mediat. 2006, 79, 1–33. [Google Scholar] [CrossRef] [PubMed]
- Ibeas, E.; Fuentes, L.; Martín, R.; Hernández, M.; Nieto, M.L. Secreted phospholipase A2 type IIA as a mediator connecting innate and adaptive immunity: New role in atherosclerosis. Cardiovasc. Res. 2009, 81, 54–63. [Google Scholar] [CrossRef]
- Ghesquiere, S.A.; Gijbels, M.J.J.; Anthonsen, M.; van Gorp, P.J.J.; van der Made, I.; Johansen, B.; Hofker, M.H.; de Winther, M.P. Macrophage-specific overexpression of group IIa sPLA2 increases atherosclerosis and enhances collagen deposition. J. Lipid Res. 2005, 46, 201–210. [Google Scholar] [CrossRef]
- Levick, S.; Loch, D.; Rolfe, B.; Reid, R.C.; Fairlie, D.P.; Taylor, S.M.; Brown, L. Antifibrotic activity of an inhibitor of group IIA secretory phospholipase A2 in young spontaneously hypertensive rats. J. Immunol. 2006, 176, 7000–7007. [Google Scholar] [CrossRef] [PubMed]
- Nijmeijer, R.; Lagrand, W.K.; Baidoshvili, A.; Lubbers, Y.T.P.; Hermens, W.T.; Meijer, C.J.L.M.; Visser, C.A.; Hack, C.E.; Niessen, H.W.M. Secretory type II phospholipase A(2) binds to ischemic myocardium during myocardial infarction in humans. Cardiovasc. Res. 2002, 53, 138–146. [Google Scholar] [CrossRef]
- Nijmeijer, R.; Willemsen, M.; Meijer, C.J.L.M.; Visser, C.A.; Verheijen, R.H.; Gottlieb, R.A.; Hack, C.E.; Niessen, H.W.M. Type II secretory phospholipase A2 binds to ischemic flip-flopped cardiomyocytes and subsequently induces cell death. Am. J. Physiol. Circ. Physiol. 2003, 285, H2218–H2224. [Google Scholar] [CrossRef]
- Gijon, M.A.; Pérez, C.; Mendez, E.; Crespo, M.S. Phospholipase A2 from plasma of patients with septic shock is associated with high-density lipoproteins and C3 anaphylatoxin: Some implications for its functional role. Biochem. J. 1995, 306, 167–175. [Google Scholar] [CrossRef] [PubMed]
- Martin, R.; Cordova, C.; Roman, J.S.; Gutiérrez, B.; Cachofeiro, V.; Nieto, M.L. Oleanolic acid modulates the immune-inflammatory response in mice with experimental autoimmune myocarditis and protects from cardiac injury. Therapeutic implications for the human disease. J. Mol. Cell. Cardiol. 2014, 72, 250–262. [Google Scholar] [CrossRef] [PubMed]
- Hu, Q.; Noor, M.; Wong, Y.F.; Hylands, P.J.; Simmonds, M.S.J.; Xu, Q.; Jiang, D.; Hendry, B.M. In vitro anti-fibrotic activities of herbal compounds and herbs. Nephrol. Dial. Transpl. 2009, 24, 3033–3041. [Google Scholar] [CrossRef] [PubMed]
- Sivakumar, P.; Gupta, S.; Sarkar, S.; Sen, S. Upregulation of lysyl oxidase and MMPs during cardiac remodeling in human dilated cardiomyopathy. Mol. Cell Biochem. 2008, 307, 159–167. [Google Scholar] [CrossRef]
- López, B.; Querejeta, R.; González, A.; Beaumont, J.; Larman, M.; Díez, J. Impact of treatment on myocardial lysyl oxidase expression and collagen cross-linking in patients with heart failure. Hypertension. 2009, 53, 236–242. [Google Scholar] [CrossRef]
- Martínez-Martínez, E.; Rodríguez, C.; Galán, M.; Miana, M.; Jurado-López, R.; Bartolomé, M.V.; Luaces, M.; Islas, F.; Martínez-González, J.; López-Andrés, N.; et al. The lysyl oxidase inhibitor (β-aminopropionitrile) reduces leptin profibrotic effects and ameliorates cardiovascular remodeling in diet-induced obesity in rats. J. Mol. Cell. Cardiol. 2016, 92, 96–104. [Google Scholar] [CrossRef]
- Galán, M.; Varona, S.; Guadall, A.; Orriols, M.; Navas, M.; Aguiló, S.; García-Dorado, D.; Martínez-González, J.; De Diego, A.; Navarro, M.A.; et al. Lysyl oxidase overexpression accelerates cardiac remodeling and aggravates angiotensin II–induced hypertrophy. FASEB J. 2017, 31, 3787–3799. [Google Scholar] [CrossRef]
- Mishina, H.; Watanabe, K.; Tamaru, S.; Watanabe, Y.; Fujioka, D.; Takahashi, S.; Suzuki, K.; Nakamura, T.; Obata, J.E.; Kawabata, K.; et al. Lack of phospholipase A2 receptor increases susceptibility to cardiac rupture after myocardial infarction. Circ. Res. 2014, 114, 493–504. [Google Scholar] [CrossRef]
- Makki, N.; Thiel, K.W.; Miller, F.J. The Epidermal Growth Factor Receptor and Its Ligands in Cardiovascular Disease. Int. J. Mol. Sci. 2013, 14, 20597–20613. [Google Scholar] [CrossRef]
- Baltanás, A.; Miguel-Carrasco, J.L.; San Jose, G.; Cebrián, C.; Moreno, M.U.; Dotor, J.; Borrás-Cuesta, F.; López, B.; González, A.; Díez, J.; et al. A synthetic peptide from transforming growth factor-β₁ type III receptor inhibits NADPH oxidase and prevents oxidative stress in the kidney of spontaneously hypertensive rats. Antioxid. Redox Signal. 2013, 19, 1607–1618. [Google Scholar]
- Grossmann, C.; Krug, A.W.; Freudinger, R.; Mildenberger, S.; Voelker, K.; Gekle, M. Aldosterone-induced EGFR expression: Interaction between the human mineralocorticoid receptor and the human EGFR promoter. Am. J. Physiol. Metab. 2007, 292, E1790–E1800. [Google Scholar] [CrossRef] [PubMed]
- Schreier, B.; Rabe, S.; Schneider, B.; Bretschneider, M.; Rupp, S.; Ruhs, S.; Neumann, J.; Rueckschloss, U.; Sibilia, M.; Gotthardt, M.; et al. Loss of epidermal growth factor receptor in vascular smooth muscle cells and cardiomyocytes causes arterial hypotension and cardiac hypertrophy. Hypertension 2013, 6, 333–340. [Google Scholar] [CrossRef] [PubMed]
- Grisanti, L.A.; Repas, A.A.; Talarico, J.A.; Gold, J.I.; Carter, R.L.; Koch, W.J.; Tilley, D.G. Temporal and gefitinib-sensitive regulation of cardiac cytokine expression via chronic β-adrenergic receptor stimulation. Am. J. Physiol. Heart Circ. Physiol. 2015, 308, H316–H330. [Google Scholar] [CrossRef]
- Liang, D.; Zhong, P.; Hu, J.; Lin, F.; Qian, Y.; Xu, Z.; Wang, J.; Zeng, C.; Li, X.; Liang, G. EGFR inhibition protects cardiac damage and remodeling through attenuating oxidative stress in STZ-induced diabetic mouse model. J. Mol. Cell. Cardiol. 2015, 82, 63–74. [Google Scholar] [CrossRef]
- Sabri, A.; Short, J.; Guo, J.; Steinberg, S.F. Protease-activated receptor-1-mediated DNA synthesis in cardiac fibroblast is via epidermal growth factor receptor transactivation: Distinct PAR-1 signaling pathways in cardiac fibroblasts and cardiomyocytes. Circ. Res. 2002, 91, 532–539. [Google Scholar] [CrossRef]
- Tanaka, N.; Masamura, K.; Yoshida, M.; Kato, M.; Kawai, Y.; Miyamori, I. A role of heparin-binding epidermal growth factor-like growth factor in cardiac remodeling after myocardial infarction. Biochem. Biophys. Res. Commun. 2002, 297, 375–381. [Google Scholar] [CrossRef]
- Holbro, T.; Hynes, N.E. ErbB receptors: Directing key signaling networks throughout life. Annu. Rev. Pharmacol. Toxicol. 2004, 44, 195–217. [Google Scholar] [CrossRef]
- Martínez-Martínez, E.; Jurado-López, R.; Valero-Muñoz, M.; Bartolomé, M.V.; Ballesteros, S.; Luaces, M.; Briones, A.M.; López-Andrés, N.; Miana, M.; Cachofeiro, V. Leptin induces cardiac fibrosis through galectin-3, mTOR and oxidative stress: Potential role in obesity. J. Hypertens. 2014, 32, 1104–1114. [Google Scholar] [CrossRef]
- Fujita, M.; Zhu, K.; Fujita, C.K.; Zhao, M.; Lam, K.S.; Kurth, M.J.; Takada, Y.K.; Takada, Y. Proinflammatory secreted phospholipase A2 type IIA (sPLA-IIA) induces integrin activation through direct binding to a newly identified binding site (site 2) in integrins αvβ3, α4β1, and α5β1. J. Biol. Chem. 2015, 290, 259–271. [Google Scholar] [CrossRef]


© 2020 by the authors. Licensee MDPI, Basel, Switzerland. This article is an open access article distributed under the terms and conditions of the Creative Commons Attribution (CC BY) license (http://creativecommons.org/licenses/by/4.0/).
Share and Cite
Martin, R.; Gutierrez, B.; Cordova, C.; San Roman, A.; Alvarez, Y.; Hernandez, M.; Cachofeiro, V.; Nieto, M.L. Secreted Phospholipase A2-IIA Modulates Transdifferentiation of Cardiac Fibroblast through EGFR Transactivation: An Inflammation–Fibrosis Link. Cells 2020, 9, 396. https://doi.org/10.3390/cells9020396
Martin R, Gutierrez B, Cordova C, San Roman A, Alvarez Y, Hernandez M, Cachofeiro V, Nieto ML. Secreted Phospholipase A2-IIA Modulates Transdifferentiation of Cardiac Fibroblast through EGFR Transactivation: An Inflammation–Fibrosis Link. Cells. 2020; 9(2):396. https://doi.org/10.3390/cells9020396
Chicago/Turabian StyleMartin, Ruben, Beatriz Gutierrez, Claudia Cordova, Alberto San Roman, Yolanda Alvarez, Marita Hernandez, Victoria Cachofeiro, and Maria L Nieto. 2020. "Secreted Phospholipase A2-IIA Modulates Transdifferentiation of Cardiac Fibroblast through EGFR Transactivation: An Inflammation–Fibrosis Link" Cells 9, no. 2: 396. https://doi.org/10.3390/cells9020396
APA StyleMartin, R., Gutierrez, B., Cordova, C., San Roman, A., Alvarez, Y., Hernandez, M., Cachofeiro, V., & Nieto, M. L. (2020). Secreted Phospholipase A2-IIA Modulates Transdifferentiation of Cardiac Fibroblast through EGFR Transactivation: An Inflammation–Fibrosis Link. Cells, 9(2), 396. https://doi.org/10.3390/cells9020396