
Morphology of Neutrophils during Their Activation and NETosis: Atomic Force Microscopy Study
 , ,
, ,  , , , and
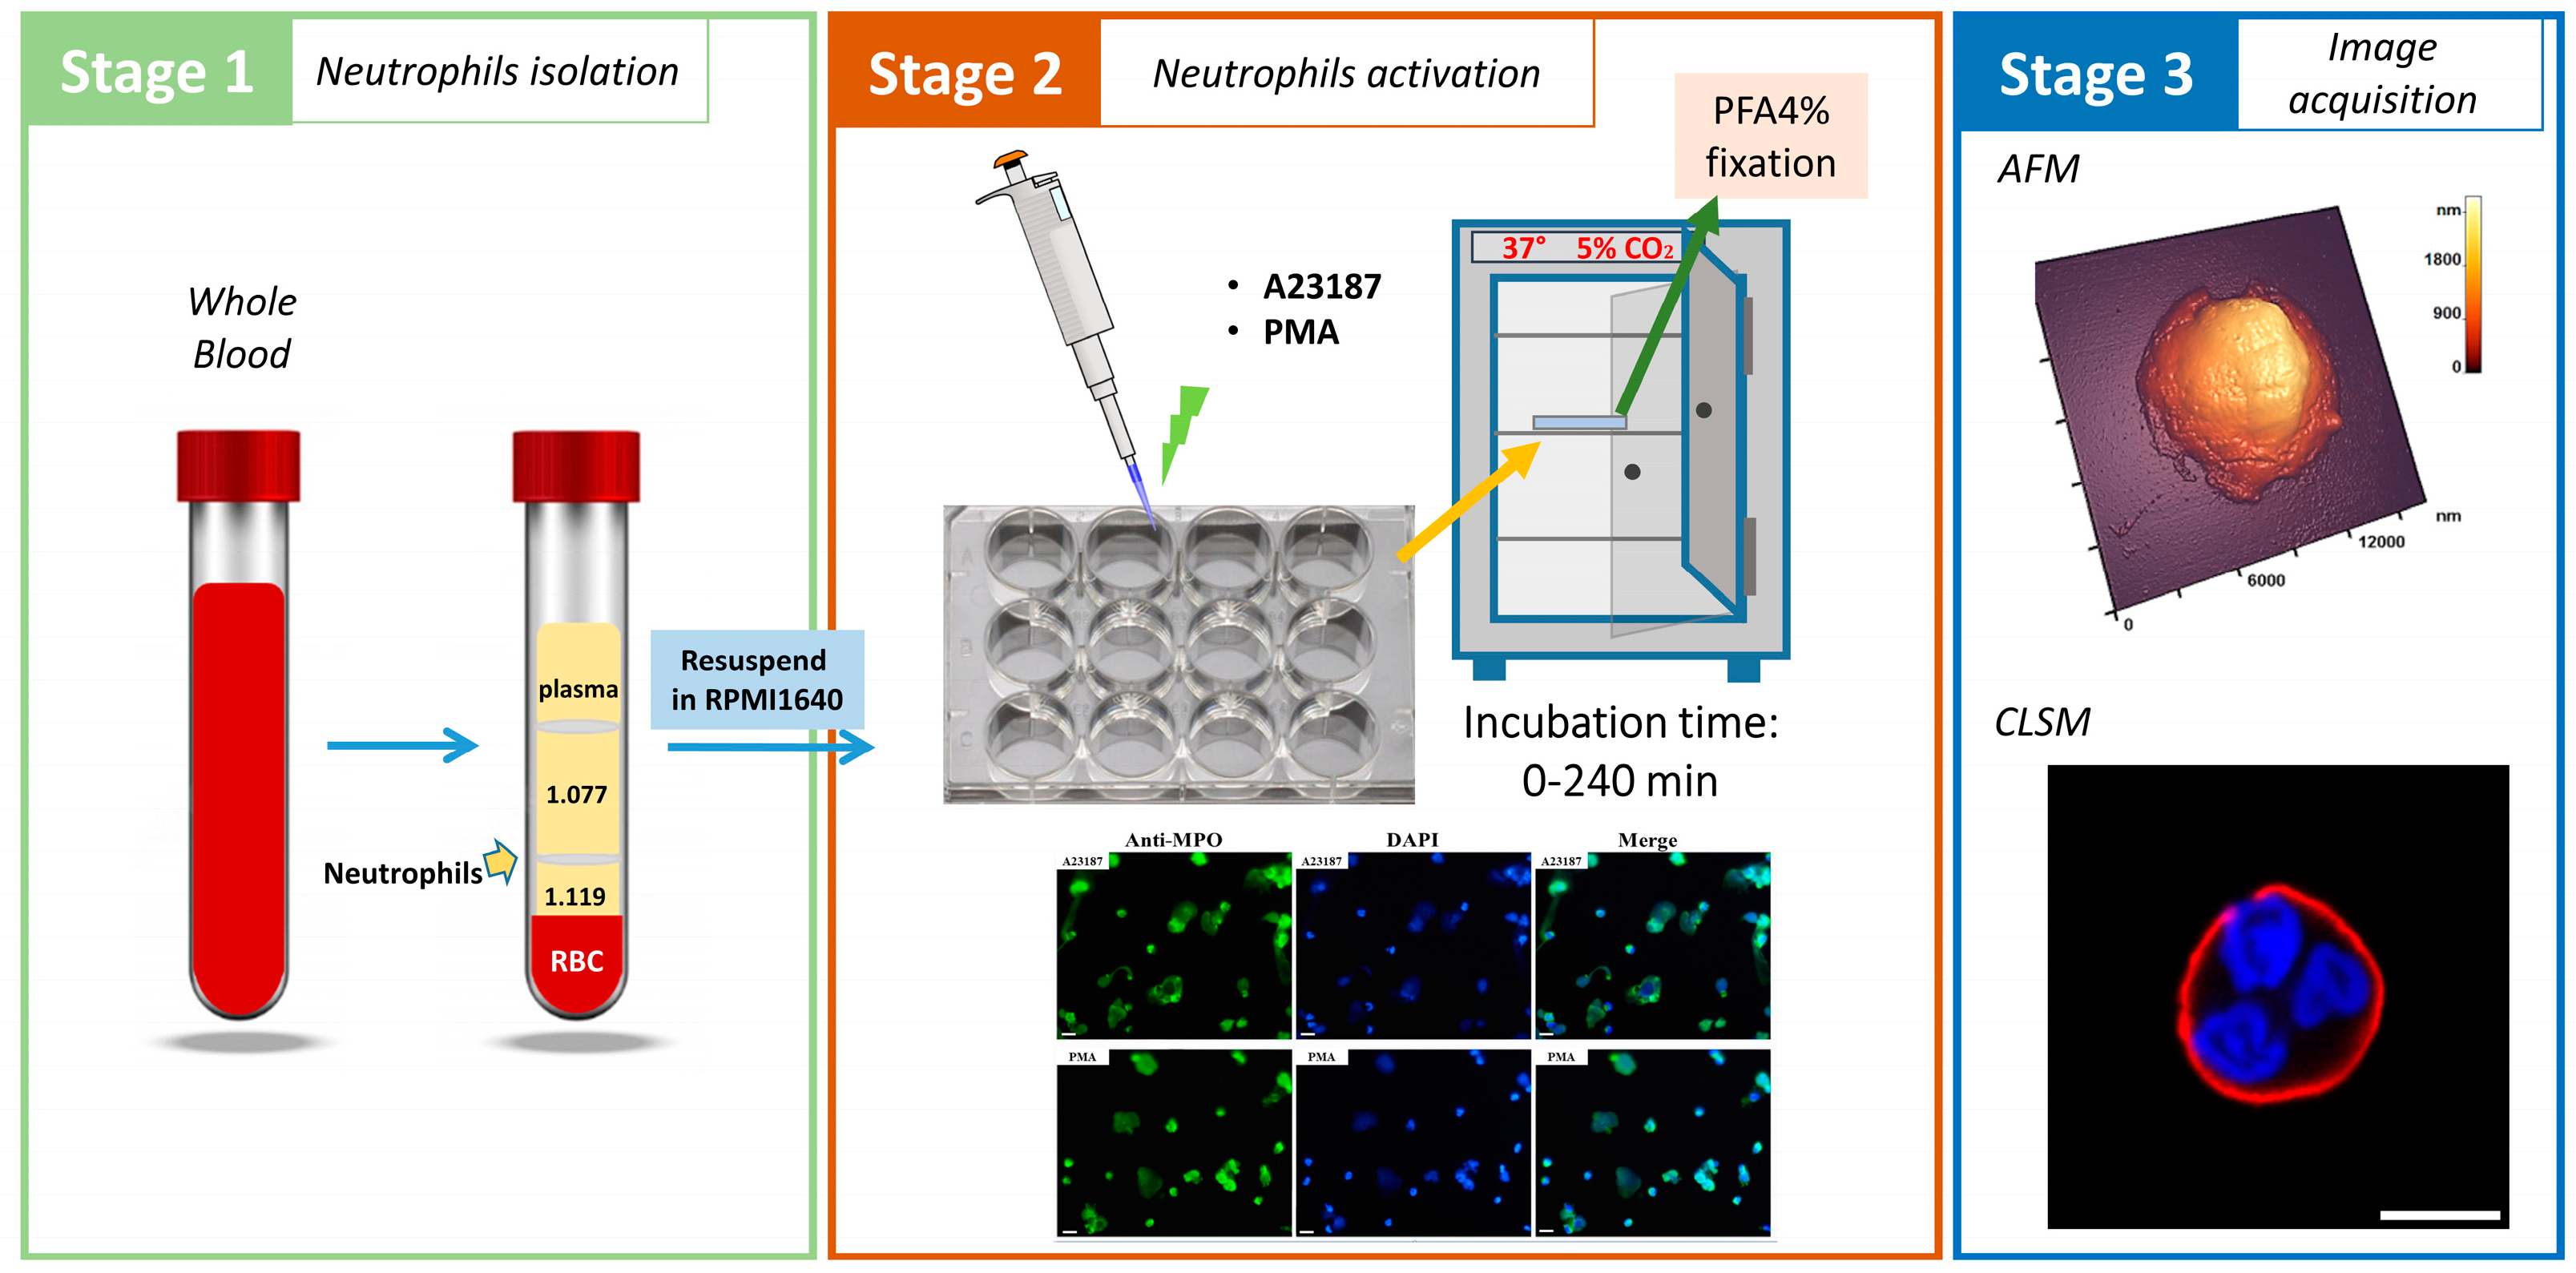
Abstract
:1. Introduction
2. Materials and Methods
2.1. Isolation of Primary Human Neutrophils
2.2. Induction and Detection of Neutrophil Extracellular Traps
2.3. Atomic Force Microscopy
2.4. Membrane Nanostructure
2.5. Fluorescence Staining of Neutrophils
2.6. Wide-Field Fluorescence Microscopy
2.7. Confocal Laser-Scanning Microscope (CLSM)
2.8. Statistical Analysis
2.8.1. AFM
2.8.2. Wide-Field and Confocal Microscopy
3. Results
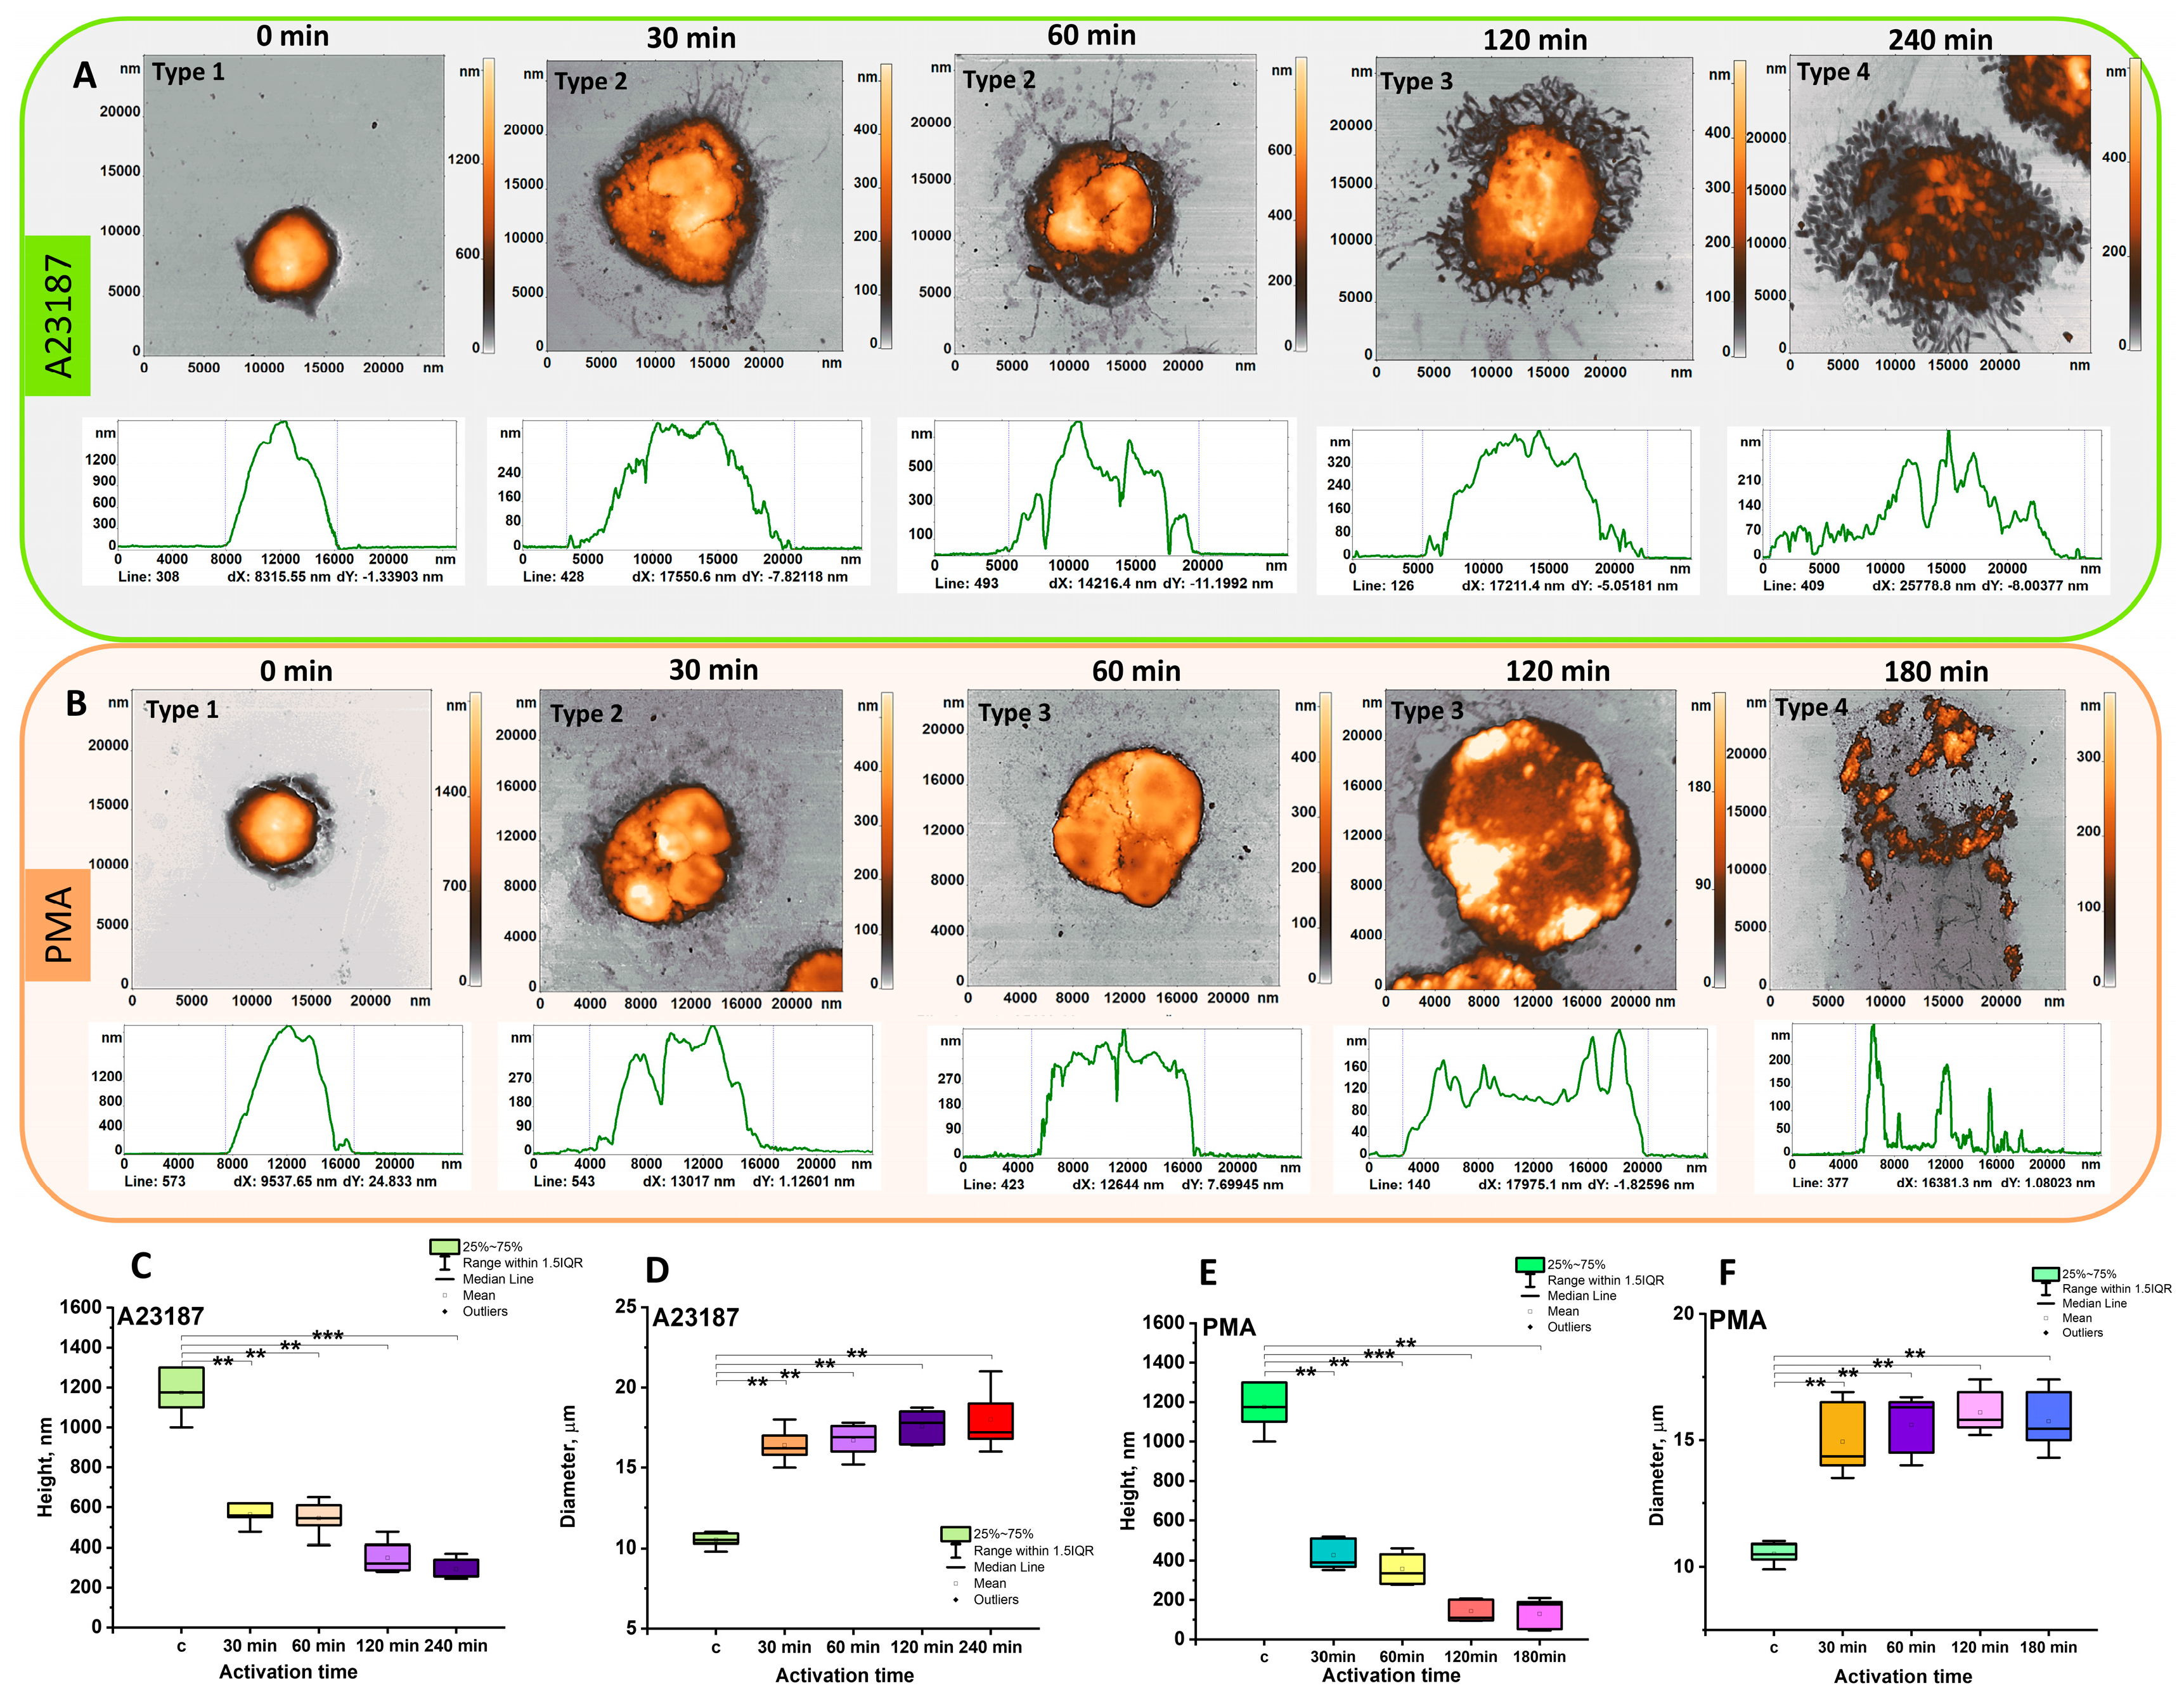
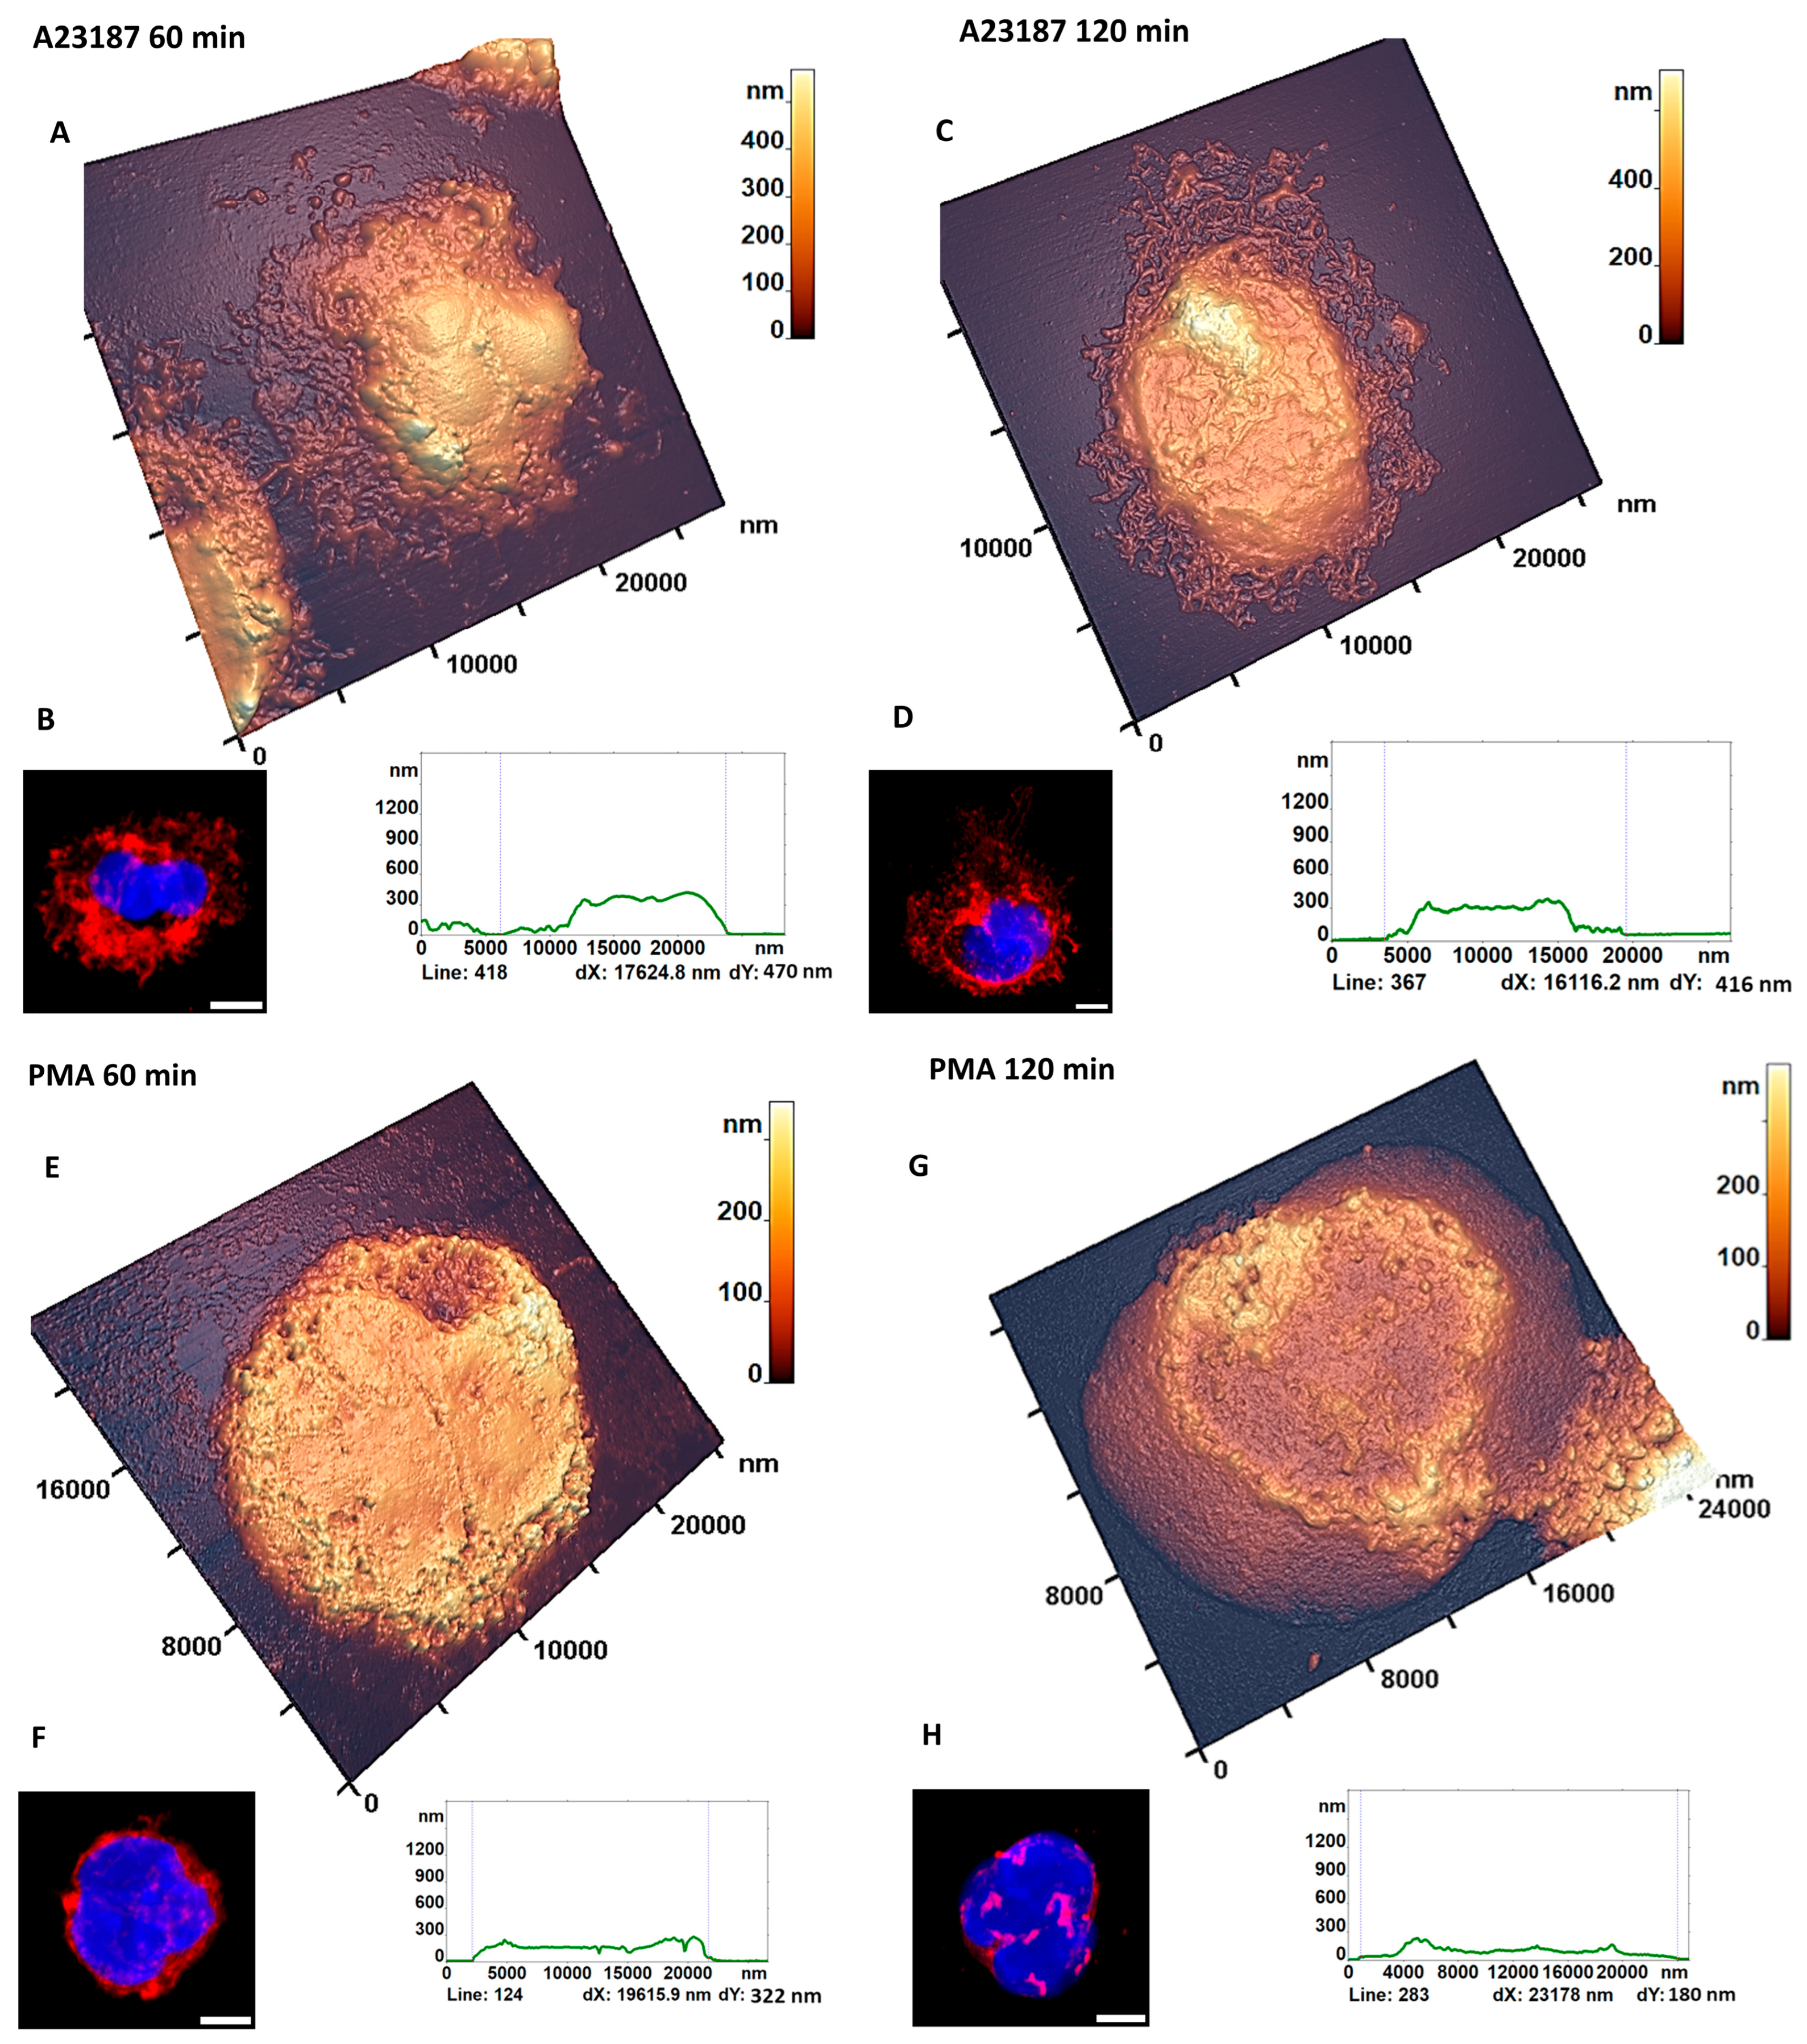
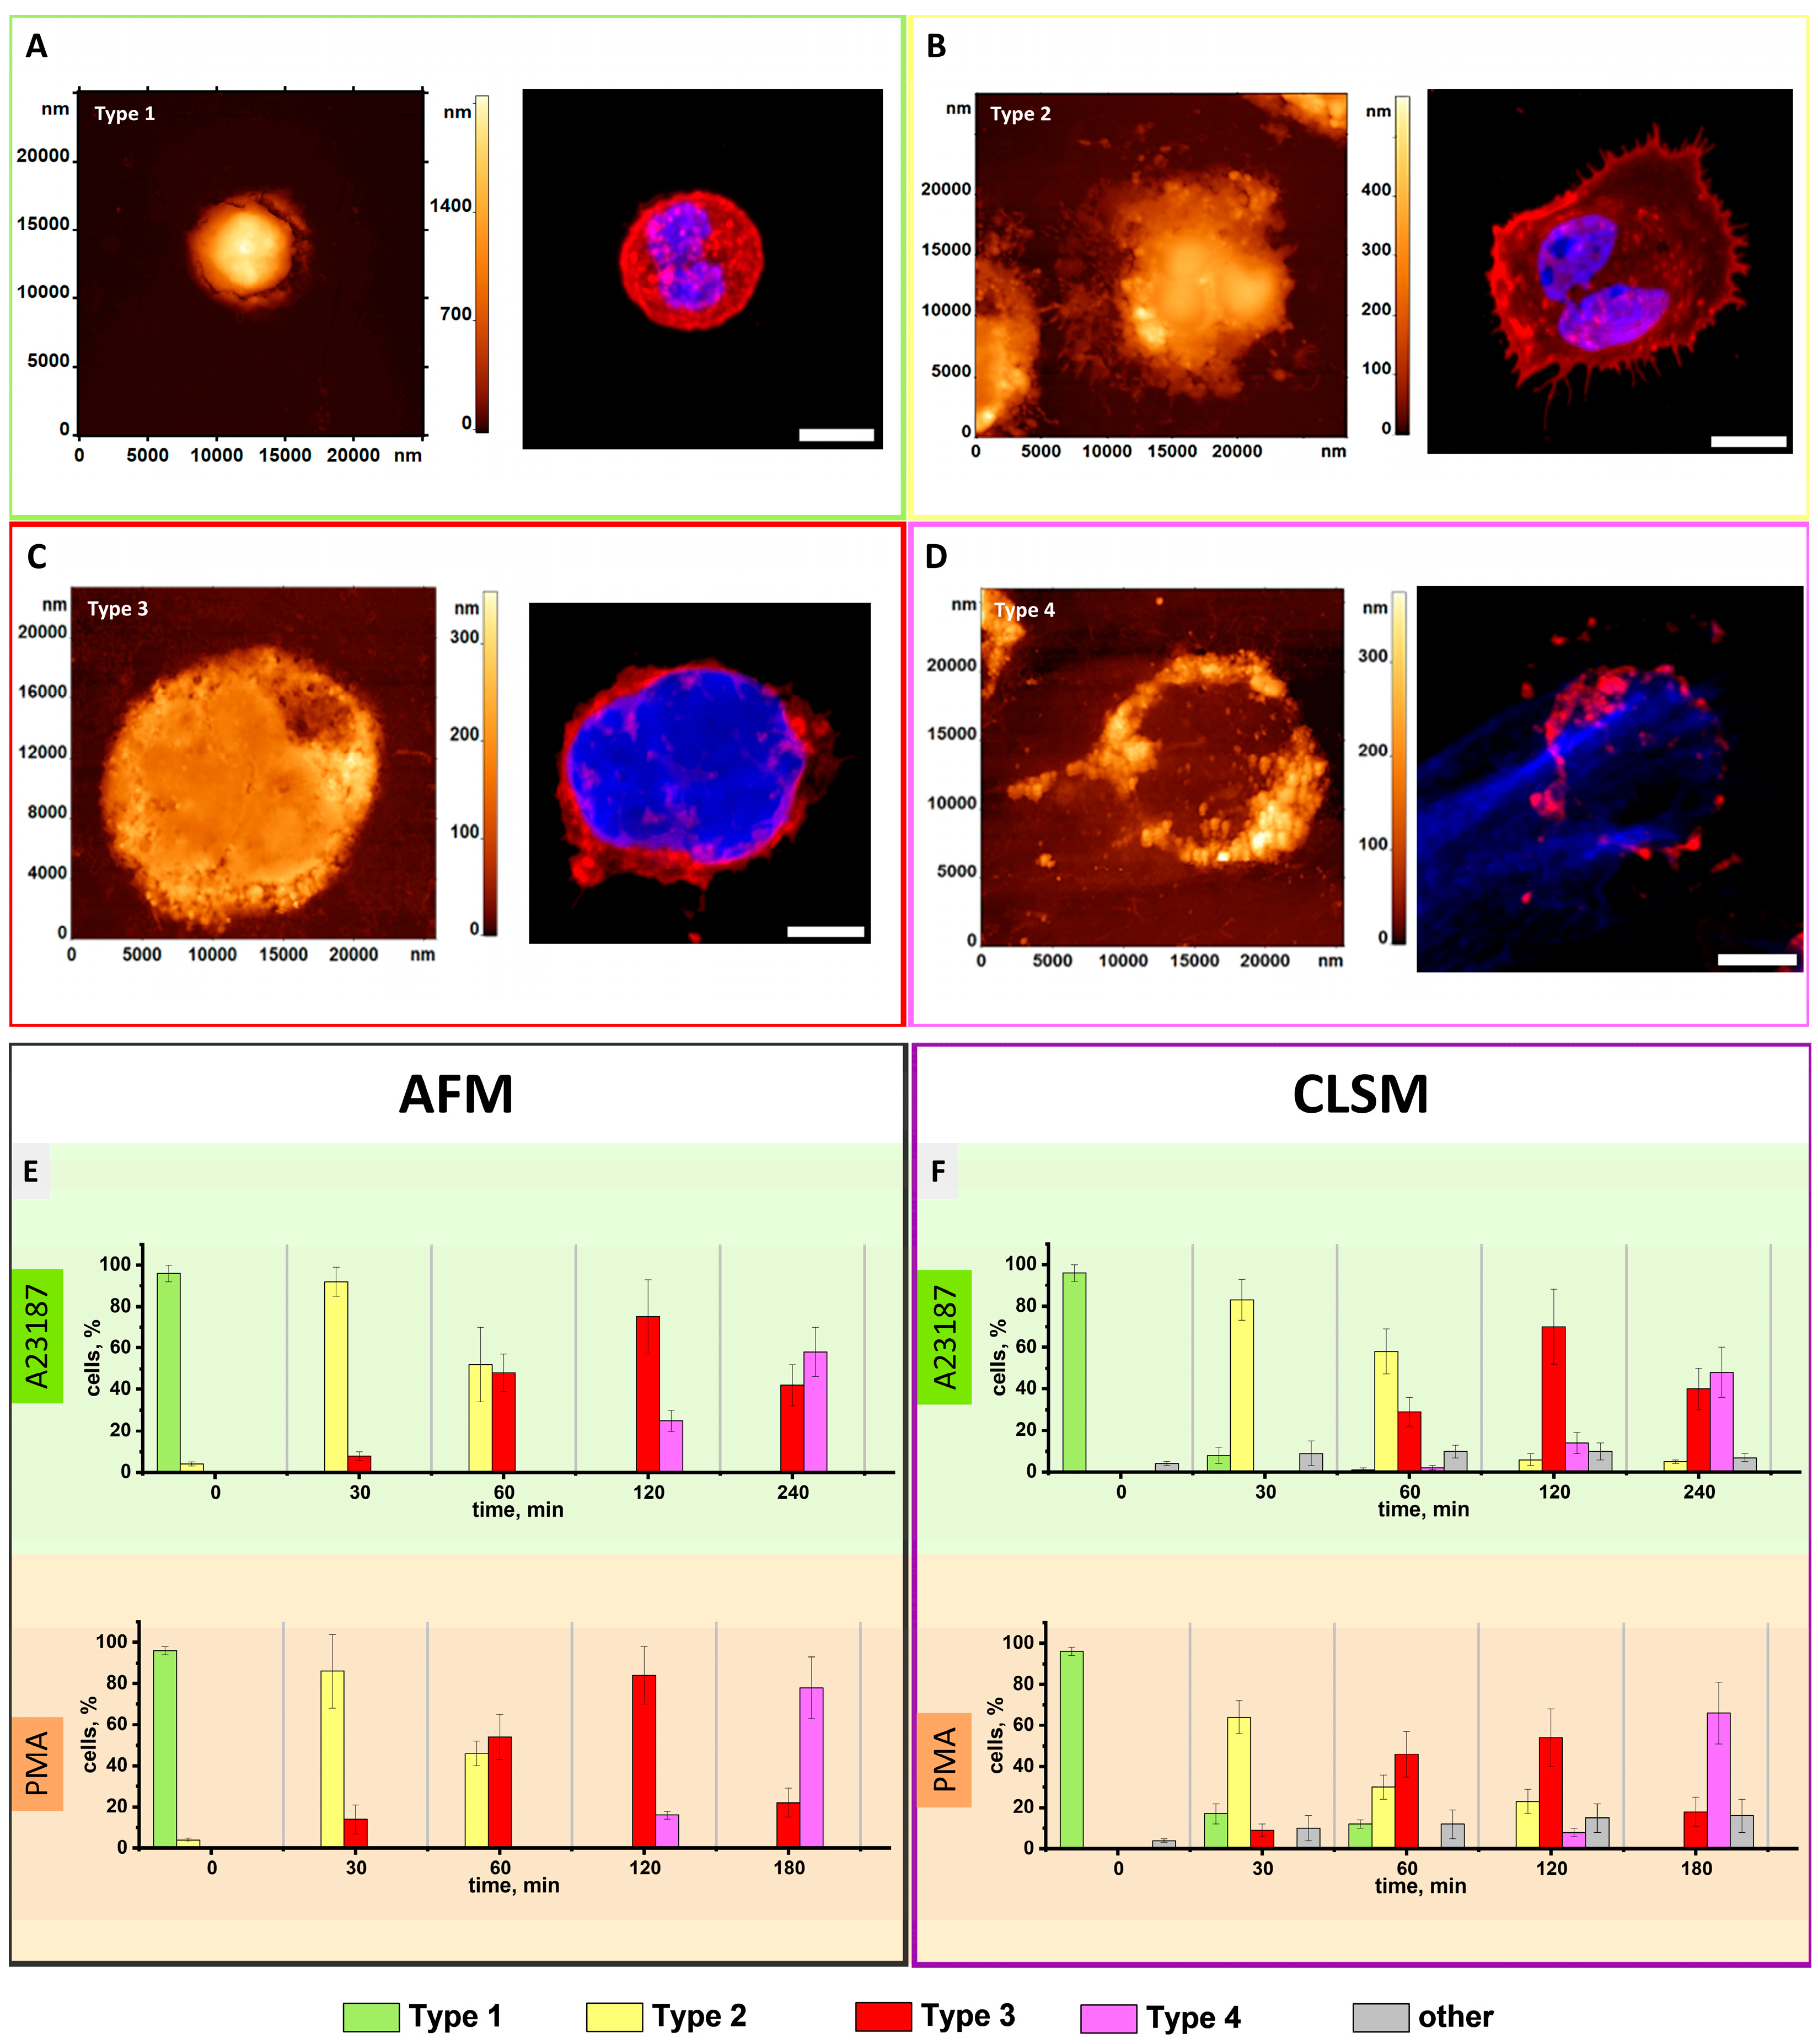
3.1. AFM Characterization of Neutrophils Morphological Changes upon Activation Recapitulated for Most of Those of CLSM
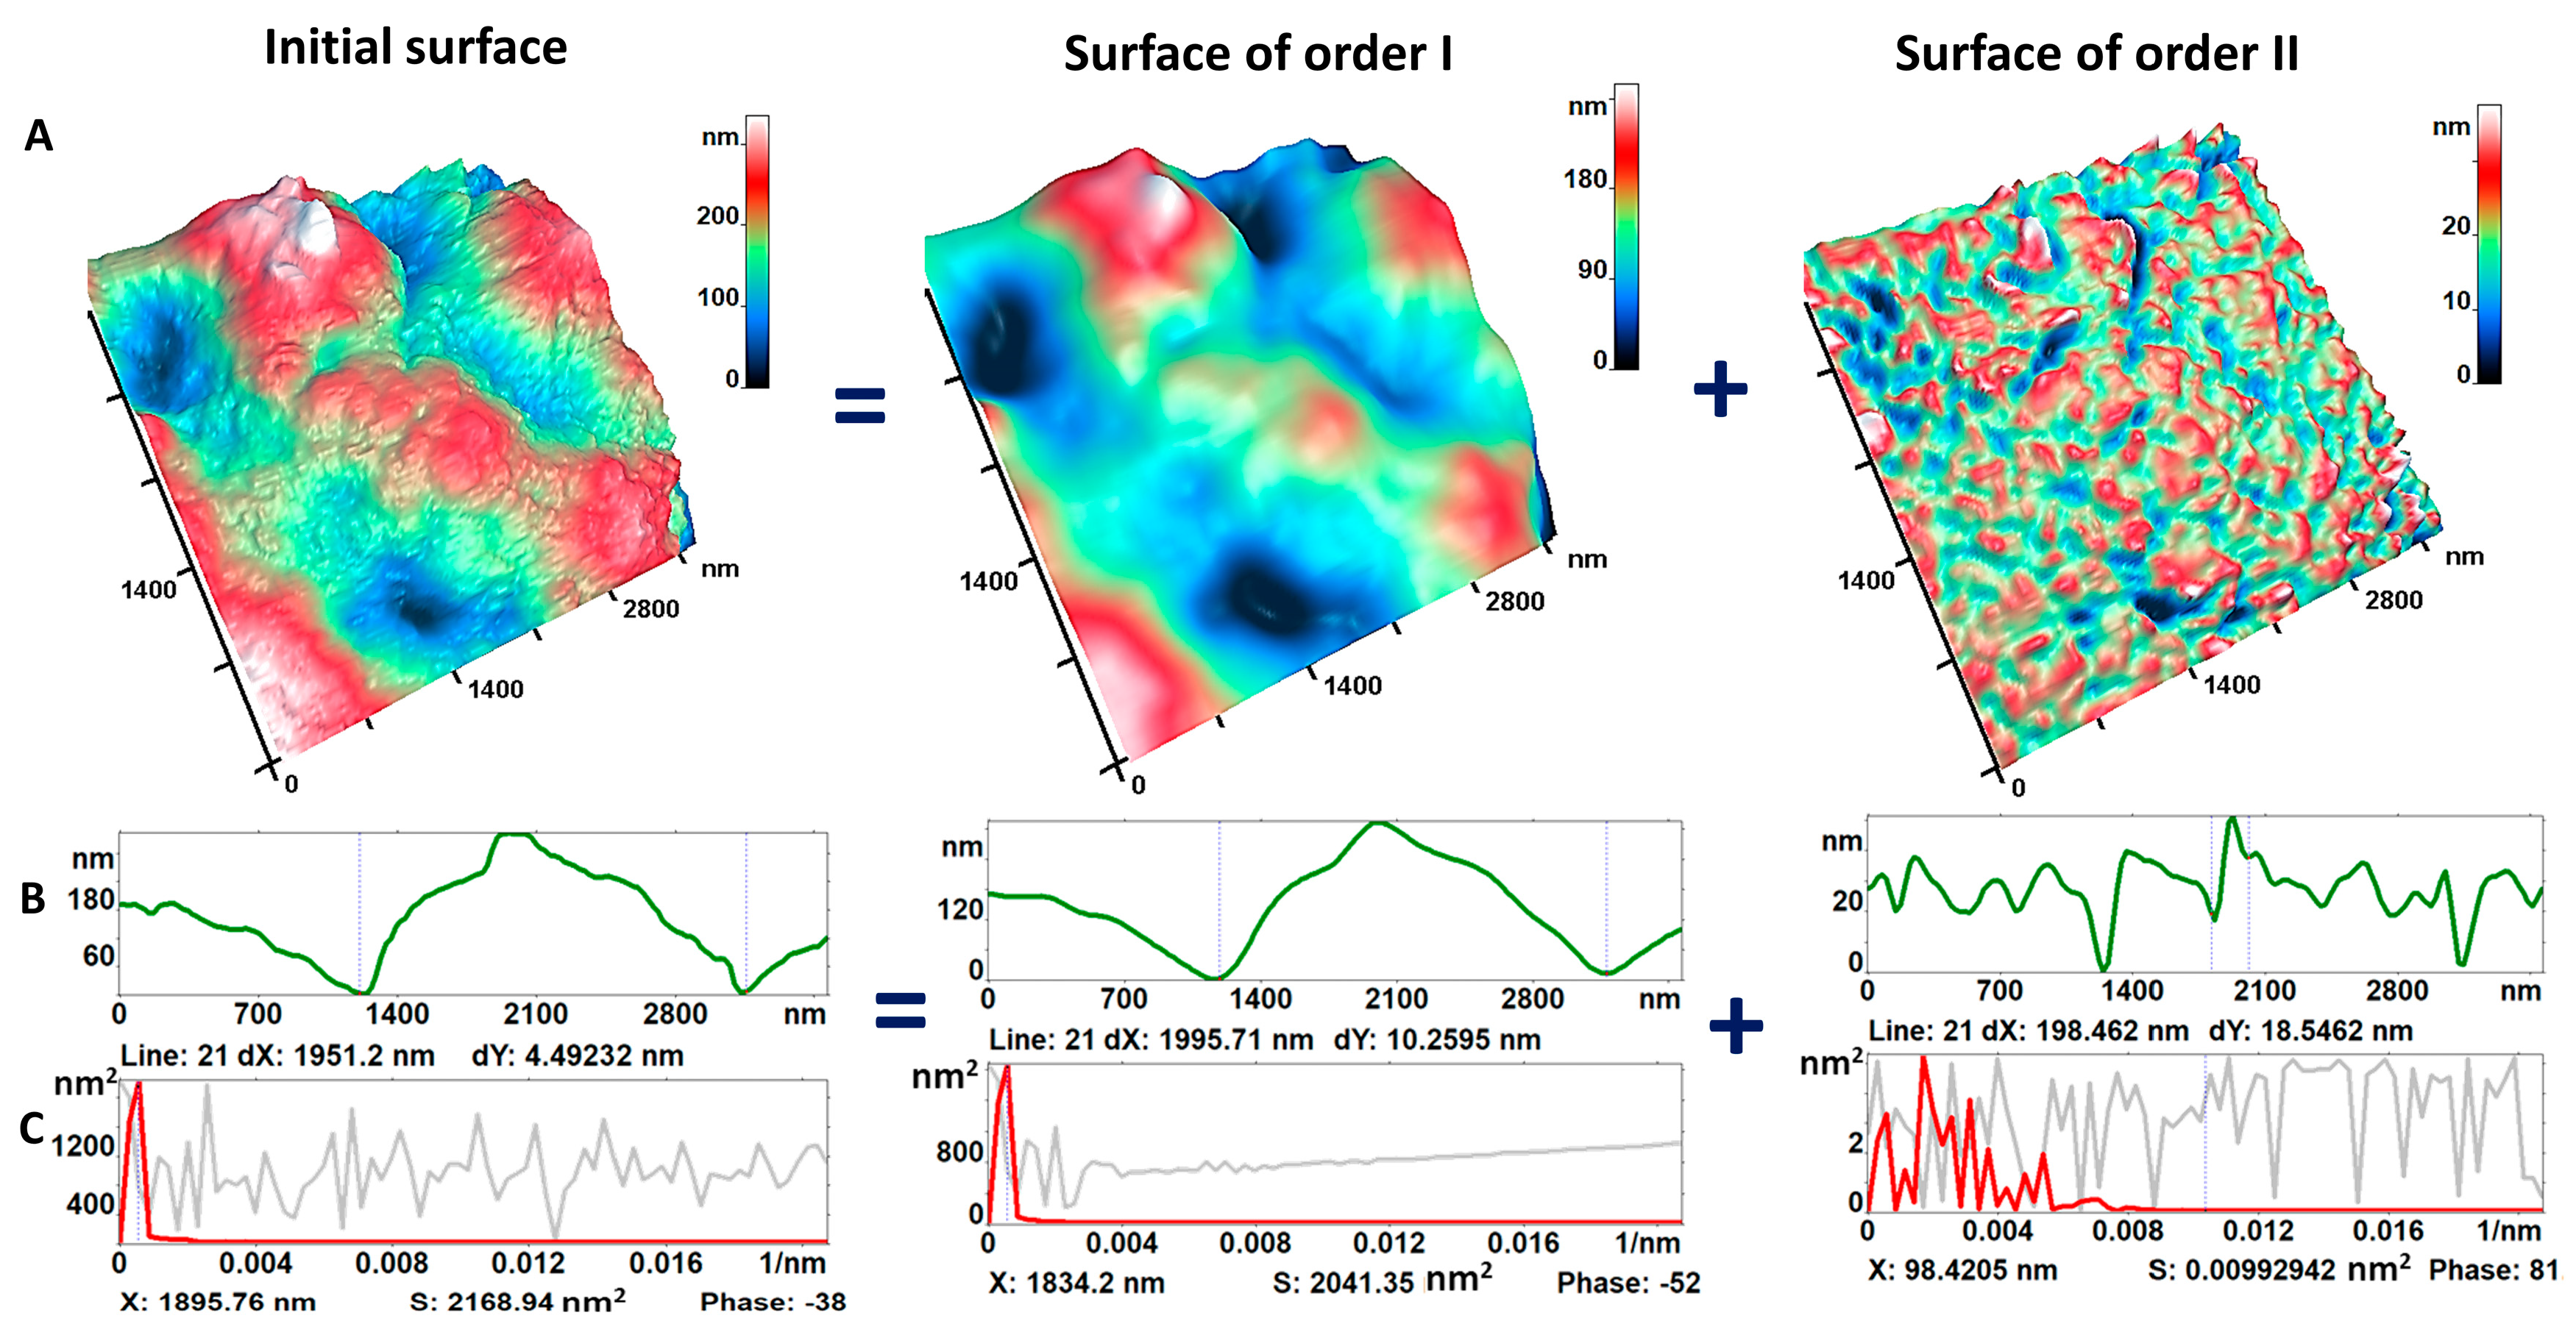
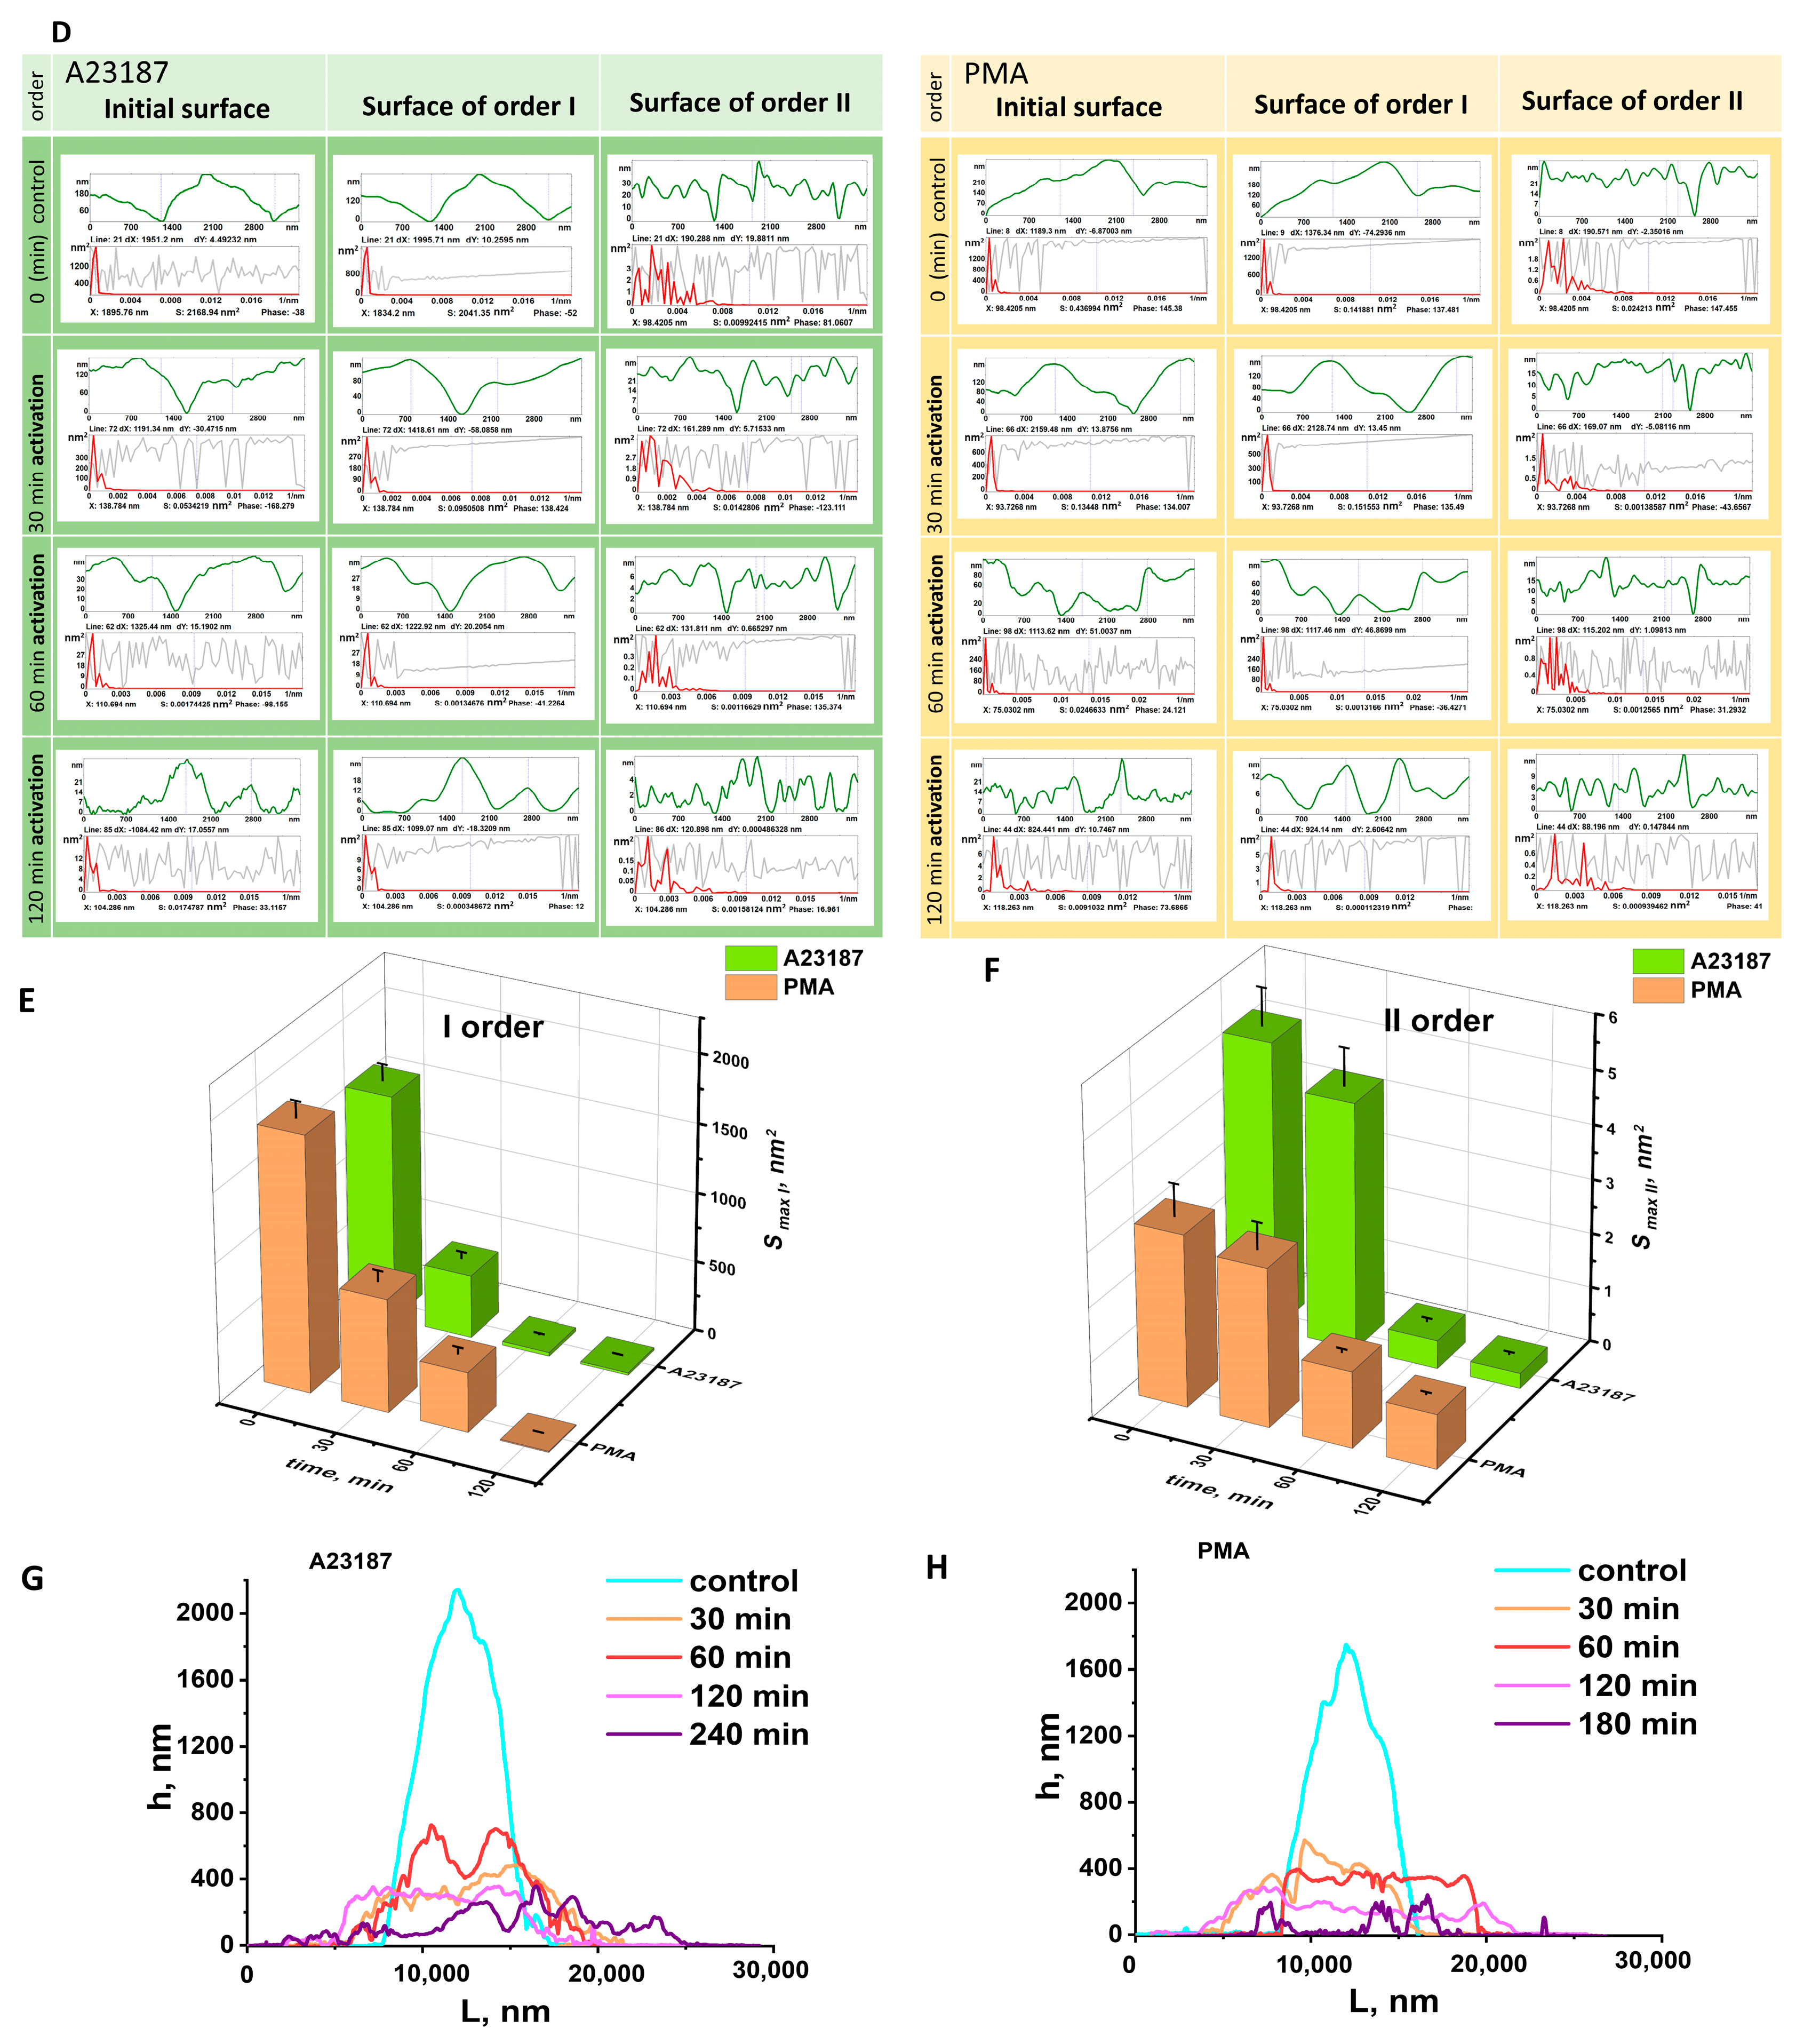
3.2. Nanosurface of Neutrophil Membranes during Activation
3.3. AFM Characterization of Cellular Transformation upon Activation
3.3.1. Cell Fragments
3.3.2. Characteristic Changes in the Nucleus Estimated by AFM
3.3.3. NETosis
4. Discussion
5. Conclusions
Supplementary Materials
Author Contributions
Funding
Institutional Review Board Statement
Informed Consent Statement
Data Availability Statement
Acknowledgments
Conflicts of Interest
References
- Brinkmann, V.; Reichard, U.; Goosmann, C.; Fauler, B.; Uhlemann, Y.; Weiss, D.S.; Weinrauch, Y.; Zychlinsky, A. Neutrophil Extracellular Traps Kill Bacteria. Science 2004, 303, 1532–1535. [Google Scholar] [CrossRef] [PubMed]
- Steinberg, B.E.; Grinstein, S. Unconventional Roles of the NADPH Oxidase: Signaling, Ion Homeostasis, and Cell Death. Sci. STKE 2007, 2007, pe11. [Google Scholar] [CrossRef] [PubMed]
- Pinegin, B.; Vorobjeva, N.; Pinegin, V. Neutrophil Extracellular Traps and Their Role in the Development of Chronic Inflammation and Autoimmunity. Autoimmun. Rev. 2015, 14, 633–640. [Google Scholar] [CrossRef]
- Vorobjeva, N.V.; Pinegin, B.V. Neutrophil Extracellular Traps: Mechanisms of Formation and Role in Health and Disease. Biochemistry 2014, 79, 1286–1296. [Google Scholar] [CrossRef] [PubMed]
- Vorobjeva, N.V.; Chernyak, B.V. NETosis: Molecular Mechanisms, Role in Physiology and Pathology. Biochemistry 2020, 85, 1178–1190. [Google Scholar] [CrossRef]
- Vorobjeva, N.V. Neutrophil Extracellular Traps: New Aspects. Mosc. Univ. Biol. Sci. Bull. 2020, 75, 173–188. [Google Scholar] [CrossRef]
- Papayannopoulos, V. Neutrophil Extracellular Traps in Immunity and Disease. Nat. Rev. Immunol. 2018, 18, 134–147. [Google Scholar] [CrossRef] [PubMed]
- Grebenchikov, O.A.; Kasatkina, I.S.; Kadantseva, K.K.; Meshkov, M.A.; Bayeva, A.A. The Effect of Lithium Chloride on Neutrophil Activation on Exposure to Serum of Patients with Septic Shock. Gen. Reanimatol. 2020, 16, 45–55. [Google Scholar] [CrossRef]
- Belambri, S.A.; Rolas, L.; Raad, H.; Hurtado-Nedelec, M.; Dang, P.M.-C.; El-Benna, J. NADPH Oxidase Activation in Neutrophils: Role of the Phosphorylation of Its Subunits. Eur. J. Clin. Investig. 2018, 48, e12951. [Google Scholar] [CrossRef]
- Kenny, E.F.; Herzig, A.; Krüger, R.; Muth, A.; Mondal, S.; Thompson, P.R.; Brinkmann, V.; von Bernuth, H.; Zychlinsky, A. Diverse Stimuli Engage Different Neutrophil Extracellular Trap Pathways. eLife 2017, 6, e24437. [Google Scholar] [CrossRef]
- Neeli, I.; Radic, M. Opposition between PKC Isoforms Regulates Histone Deimination and Neutrophil Extracellular Chromatin Release. Front. Immunol. 2013, 4, 38. [Google Scholar] [CrossRef] [PubMed]
- Lood, C.; Blanco, L.P.; Purmalek, M.M.; Carmona-Rivera, C.; De Ravin, S.S.; Smith, C.K.; Malech, H.L.; Ledbetter, J.A.; Elkon, K.B.; Kaplan, M.J. Neutrophil Extracellular Traps Enriched in Oxidized Mitochondrial DNA Are Interferogenic and Contribute to Lupus-like Disease. Nat. Med. 2016, 22, 146–153. [Google Scholar] [CrossRef]
- Metzler, K.D.; Goosmann, C.; Lubojemska, A.; Zychlinsky, A.; Papayannopoulos, V. A Myeloperoxidase-Containing Complex Regulates Neutrophil Elastase Release and Actin Dynamics during NETosis. Cell Rep. 2014, 8, 883–896. [Google Scholar] [CrossRef] [PubMed]
- Neubert, E.; Meyer, D.; Rocca, F.; Günay, G.; Kwaczala-Tessmann, A.; Grandke, J.; Senger-Sander, S.; Geisler, C.; Egner, A.; Schön, M.P.; et al. Chromatin Swelling Drives Neutrophil Extracellular Trap Release. Nat. Commun. 2018, 9, 3767. [Google Scholar] [CrossRef] [PubMed]
- Sollberger, G.; Choidas, A.; Burn, G.L.; Habenberger, P.; Di Lucrezia, R.; Kordes, S.; Menninger, S.; Eickhoff, J.; Nussbaumer, P.; Klebl, B.; et al. Gasdermin D Plays a Vital Role in the Generation of Neutrophil Extracellular Traps. Sci. Immunol. 2018, 3, eaar6689. [Google Scholar] [CrossRef]
- Amulic, B.; Knackstedt, S.L.; Abu Abed, U.; Deigendesch, N.; Harbort, C.J.; Caffrey, B.E.; Brinkmann, V.; Heppner, F.L.; Hinds, P.W.; Zychlinsky, A. Cell-Cycle Proteins Control Production of Neutrophil Extracellular Traps. Dev. Cell 2017, 43, 449–462.e5. [Google Scholar] [CrossRef]
- Lewis, H.D.; Liddle, J.; Coote, J.E.; Atkinson, S.J.; Barker, M.D.; Bax, B.D.; Bicker, K.L.; Bingham, R.P.; Campbell, M.; Chen, Y.H.; et al. Inhibition of PAD4 Activity Is Sufficient to Disrupt Mouse and Human NET Formation. Nat. Chem. Biol. 2015, 11, 189–191. [Google Scholar] [CrossRef]
- Ezzeroug Ezzraimi, A.; Baudoin, J.-P.; Mariotti, A.; Camoin-Jau, L. Microscopic Description of Platelet Aggregates Induced by Escherichia Coli Strains. Cells 2022, 11, 3495. [Google Scholar] [CrossRef] [PubMed]
- Manzenreiter, R.; Kienberger, F.; Marcos, V.; Schilcher, K.; Krautgartner, W.D.; Obermayer, A.; Huml, M.; Stoiber, W.; Hector, A.; Griese, M.; et al. Ultrastructural Characterization of Cystic Fibrosis Sputum Using Atomic Force and Scanning Electron Microscopy. J. Cyst. Fibros. 2012, 11, 84–92. [Google Scholar] [CrossRef]
- Pleskova, S.N.; Gorshkova, E.N.; Kriukov, R.N. Dynamics of Formation and Morphological Features of Neutrophil Extracellular Traps Formed under the Influence of Opsonized Staphylococcus Aureus. J. Mol. Recognit. 2018, 31, e2707. [Google Scholar] [CrossRef]
- Aguado, M.T.; Pujol, N.; Rubiol, E.; Tura, M.; Celada, A. Separation of Granulocytes from Peripheral Blood in a Single Step Using Discontinuous Density Gradients of Ficoll-Urografin. A Comparative Study with Separation by Dextran. J. Immunol. Methods 1980, 32, 41–50. [Google Scholar] [CrossRef] [PubMed]
- Kozlova, E.K.; Chernysh, A.M.; Moroz, V.V.; Kuzovlev, A.N. Analysis of Nanostructure of Red Blood Cells Membranes by Space Fourier Transform of AFM Images. Micron 2013, 44, 218–227. [Google Scholar] [CrossRef] [PubMed]
- Schneider, C.A.; Rasband, W.S.; Eliceiri, K.W. NIH Image to ImageJ: 25 Years of Image Analysis. Nat. Methods 2012, 9, 671–675. [Google Scholar] [CrossRef] [PubMed]
- Sergunova, V.; Leesment, S.; Kozlov, A.; Inozemtsev, V.; Platitsina, P.; Lyapunova, S.; Onufrievich, A.; Polyakov, V.; Sherstyukova, E. Investigation of Red Blood Cells by Atomic Force Microscopy. Sensors 2022, 22, 2055. [Google Scholar] [CrossRef]
- Kozlova, E.; Sergunova, V.; Sherstyukova, E.; Gudkova, O.; Kozlov, A.; Inozemtsev, V.; Lyapunova, S.; Chernysh, A. Topological Relationships Cytoskeleton-Membrane Nanosurface-Morphology as a Basic Mechanism of Total Disorders of RBC Structures. Int. J. Mol. Sci. 2022, 23, 2045. [Google Scholar] [CrossRef]
- Inozemtsev, V.; Sergunova, V.; Vorobjeva, N.; Kozlova, E.; Sherstyukova, E.; Lyapunova, S.; Chernysh, A. Stages of NETosis Development upon Stimulation of Neutrophils with Activators of Different Types. Int. J. Mol. Sci. 2023, 24, 12355. [Google Scholar] [CrossRef]
- Byrd, A.S.; O’Brien, X.M.; Laforce-Nesbitt, S.S.; Parisi, V.E.; Hirakawa, M.P.; Bliss, J.M.; Reichner, J.S. NETosis in Neonates: Evidence of a Reactive Oxygen Species–Independent Pathway in Response to Fungal Challenge. J. Infect. Dis. 2016, 213, 634–639. [Google Scholar] [CrossRef]
- McDonald, B.; Urrutia, R.; Yipp, B.G.; Jenne, C.N.; Kubes, P. Intravascular Neutrophil Extracellular Traps Capture Bacteria from the Bloodstream during Sepsis. Cell Host Microbe 2012, 12, 324–333. [Google Scholar] [CrossRef]
- Mohanty, T.; Sjögren, J.; Kahn, F.; Abu-Humaidan, A.H.A.; Fisker, N.; Assing, K.; Mörgelin, M.; Bengtsson, A.A.; Borregaard, N.; Sørensen, O.E. A Novel Mechanism for NETosis Provides Antimicrobial Defense at the Oral Mucosa. Blood 2015, 126, 2128–2137. [Google Scholar] [CrossRef]
- Rossaint, J.; Herter, J.M.; Van Aken, H.; Napirei, M.; Döring, Y.; Weber, C.; Soehnlein, O.; Zarbock, A. Synchronized Integrin Engagement and Chemokine Activation Is Crucial in Neutrophil Extracellular Trap–Mediated Sterile Inflammation. Blood 2014, 123, 2573–2584. [Google Scholar] [CrossRef]
- Neubert, E.; Meyer, D.; Kruss, S.; Erpenbeck, L. The Power from within—Understanding the Driving Forces of Neutrophil Extracellular Trap Formation. J. Cell Sci. 2020, 133, jcs241075. [Google Scholar] [CrossRef] [PubMed]
- Salafranca, J.; Ai, Z.; Wang, L.; Udalova, I.A.; van Grinsven, E. Analysis of Neutrophil Morphology and Function Under Genetic Perturbation of Transcription Factors In Vitro. Methods Mol. Biol. 2023, 2594, 69–86. [Google Scholar]
- Albertine, K.H.; Cerasoli, F.; Gee, M.H.; Ishihara, Y.; Tahamont, M.V.; Gottlieb, J.E.; Peters, S.P. Morphological Analysis of the Activation of Adherent Neutrophils in Vitro. Tissue Cell 1988, 20, 519–530. [Google Scholar] [CrossRef] [PubMed]
- Lamzin, I.M.; Khayrullin, R.M. The Quality Assessment of Stored Red Blood Cells Probed Using Atomic-Force Microscopy. Anat. Res. Int. 2014, 2014, 869683. [Google Scholar] [CrossRef]
- Dokukin, M.E.; Guz, N.V.; Gaikwad, R.M.; Woodworth, C.D.; Sokolov, I. Cell Surface as a Fractal: Normal and Cancerous Cervical Cells Demonstrate Different Fractal Behavior of Surface Adhesion Maps at the Nanoscale. Phys. Rev. Lett. 2011, 107, 028101. [Google Scholar] [CrossRef]
- Sergey, A.; Viliya, G.; Lucie, S.; Ilnur, K. Neutrophils’ Atomic Force Microscopy in COPD with Pulmonary Hypertension (PH). Eur. Respir. J. 2016, 48, PA5098. [Google Scholar] [CrossRef]
- Thiam, H.R.; Wong, S.L.; Wagner, D.D.; Waterman, C.M. Cellular Mechanisms of NETosis. Annu. Rev. Cell Dev. Biol. 2020, 36, 191–218. [Google Scholar] [CrossRef]
- Thiam, H.R.; Wong, S.L.; Qiu, R.; Kittisopikul, M.; Vahabikashi, A.; Goldman, A.E.; Goldman, R.D.; Wagner, D.D.; Waterman, C.M. NETosis Proceeds by Cytoskeleton and Endomembrane Disassembly and PAD4-Mediated Chromatin Decondensation and Nuclear Envelope Rupture. Proc. Natl. Acad. Sci. USA 2020, 117, 7326–7337. [Google Scholar] [CrossRef]
- Chlanda, P.; Mekhedov, E.; Waters, H.; Schwartz, C.L.; Fischer, E.R.; Ryham, R.J.; Cohen, F.S.; Blank, P.S.; Zimmerberg, J. The Hemifusion Structure Induced by Influenza Virus Haemagglutinin Is Determined by Physical Properties of the Target Membranes. Nat. Microbiol. 2016, 1, 16050. [Google Scholar] [CrossRef]
- Roberts, R.E.; Hallett, M.B. Neutrophil Cell Shape Change: Mechanism and Signalling during Cell Spreading and Phagocytosis. Int. J. Mol. Sci. 2019, 20, 1383. [Google Scholar] [CrossRef]
- de Bont, C.M.; Koopman, W.J.H.; Boelens, W.C.; Pruijn, G.J.M. Stimulus-Dependent Chromatin Dynamics, Citrullination, Calcium Signalling and ROS Production during NET Formation. Biochim. Biophys. Acta-Mol. Cell Res. 2018, 1865, 1621–1629. [Google Scholar] [CrossRef] [PubMed]
- Gupta, A.K.; Giaglis, S.; Hasler, P.; Hahn, S. Efficient Neutrophil Extracellular Trap Induction Requires Mobilization of Both Intracellular and Extracellular Calcium Pools and Is Modulated by Cyclosporine A. PLoS ONE 2014, 9, e97088. [Google Scholar] [CrossRef] [PubMed]
- Vorobjeva, N.; Dagil, Y.; Pashenkov, M.; Pinegin, B.; Chernyak, B. Protein Kinase C Isoforms Mediate the Formation of Neutrophil Extracellular Traps. Int. Immunopharmacol. 2023, 114, 109448. [Google Scholar] [CrossRef]
- Pires, R.H.; Felix, S.B.; Delcea, M. The Architecture of Neutrophil Extracellular Traps Investigated by Atomic Force Microscopy. Nanoscale 2016, 8, 14193–14202. [Google Scholar] [CrossRef] [PubMed]
- Desai, J.; Kumar, S.V.; Mulay, S.R.; Konrad, L.; Romoli, S.; Schauer, C.; Herrmann, M.; Bilyy, R.; Müller, S.; Popper, B.; et al. PMA and Crystal-Induced Neutrophil Extracellular Trap Formation Involves RIPK1-RIPK3-MLKL Signaling. Eur. J. Immunol. 2016, 46, 223–229. [Google Scholar] [CrossRef]
- D’Cruz, A.A.; Speir, M.; Bliss-Moreau, M.; Dietrich, S.; Wang, S.; Chen, A.A.; Gavillet, M.; Al-Obeidi, A.; Lawlor, K.E.; Vince, J.E.; et al. The Pseudokinase MLKL Activates PAD4-Dependent NET Formation in Necroptotic Neutrophils. Sci. Signal. 2018, 11, eaao1716. [Google Scholar] [CrossRef]


Disclaimer/Publisher’s Note: The statements, opinions and data contained in all publications are solely those of the individual author(s) and contributor(s) and not of MDPI and/or the editor(s). MDPI and/or the editor(s) disclaim responsibility for any injury to people or property resulting from any ideas, methods, instructions or products referred to in the content. |
© 2023 by the authors. Licensee MDPI, Basel, Switzerland. This article is an open access article distributed under the terms and conditions of the Creative Commons Attribution (CC BY) license (https://creativecommons.org/licenses/by/4.0/).
Share and Cite
Sergunova, V.; Inozemtsev, V.; Vorobjeva, N.; Kozlova, E.; Sherstyukova, E.; Lyapunova, S.; Chernysh, A. Morphology of Neutrophils during Their Activation and NETosis: Atomic Force Microscopy Study. Cells 2023, 12, 2199. https://doi.org/10.3390/cells12172199
Sergunova V, Inozemtsev V, Vorobjeva N, Kozlova E, Sherstyukova E, Lyapunova S, Chernysh A. Morphology of Neutrophils during Their Activation and NETosis: Atomic Force Microscopy Study. Cells. 2023; 12(17):2199. https://doi.org/10.3390/cells12172199
Chicago/Turabian StyleSergunova, Viktoria, Vladimir Inozemtsev, Nina Vorobjeva, Elena Kozlova, Ekaterina Sherstyukova, Snezhanna Lyapunova, and Aleksandr Chernysh. 2023. "Morphology of Neutrophils during Their Activation and NETosis: Atomic Force Microscopy Study" Cells 12, no. 17: 2199. https://doi.org/10.3390/cells12172199
APA StyleSergunova, V., Inozemtsev, V., Vorobjeva, N., Kozlova, E., Sherstyukova, E., Lyapunova, S., & Chernysh, A. (2023). Morphology of Neutrophils during Their Activation and NETosis: Atomic Force Microscopy Study. Cells, 12(17), 2199. https://doi.org/10.3390/cells12172199