Article

The Transglutaminase-2 Interactome in the APP23 Mouse Model of Alzheimer’s Disease

by
Micha M. M. Wilhelmus
1,†,
Elisa Tonoli
2,†,
Clare Coveney
2,
David J. Boocock
2,
Cornelis A. M. Jongenelen
1,
John J. P. Brevé
1,
Elisabetta A. M. Verderio
2,3,* and
Benjamin Drukarch
1
1
Department of Anatomy and Neurosciences, Amsterdam Neuroscience, Amsterdam UMC, Vrije Universiteit Amsterdam, 1081 HZ Amsterdam, The Netherlands
2
School of Science and Technology, Nottingham Trent University, Nottingham NG11 8NS, UK
3
Department of Biological Sciences, Alma Mater Studiorum University of Bologna, 40126 Bologna, Italy
*
Author to whom correspondence should be addressed.
These authors contributed equally to this work.
Cells 2022, 11(3), 389; https://doi.org/10.3390/cells11030389
Submission received: 14 December 2021 / Revised: 6 January 2022 / Accepted: 14 January 2022 / Published: 24 January 2022

Abstract

:
Amyloid-beta (Aβ) deposition in the brain is closely linked with the development of Alzheimer’s disease (AD). Unfortunately, therapies specifically targeting Aβ deposition have failed to reach their primary clinical endpoints, emphasizing the need to broaden the search strategy for alternative targets/mechanisms. Transglutaminase-2 (TG2) catalyzes post-translational modifications, is present in AD lesions and interacts with AD-associated proteins. However, an unbiased overview of TG2 interactors is lacking in both control and AD brain. Here we aimed to identify these interactors using a crossbreed of the AD-mimicking APP23 mouse model with wild type and TG2 knock-out (TG2−/−) mice. We found that absence of TG2 had no (statistically) significant effect on Aβ pathology, soluble brain levels of Aβ1–40 and Aβ1–42, and mRNA levels of TG family members compared to APP23 mice at 18 months of age. Quantitative proteomics and network analysis revealed a large cluster of TG2 interactors involved in synaptic transmission/assembly and cell adhesion in the APP23 brain typical of AD. Comparative proteomics of wild type and TG2−/− brains revealed a TG2-linked pathological proteome consistent with alterations in both pathways. Our data show that TG2 deletion leads to considerable network alterations consistent with a TG2 role in (dys)regulation of synaptic transmission and cell adhesion in APP23 brains.

1. Introduction

Alzheimer’s disease (AD) is characterized pathologically by typical lesions in the brain, in particular senile plaques (SP), neurofibrillary tangles (NFTs) and cerebral amyloid angiopathy (CAA) [1]. SP and CAA are comprised of extracellular protein aggregates enriched in multimers of amyloid-beta (Aβ) protein [2]. Aβ, in soluble and/or aggregated form, is considered as a key protein driving the disease process in AD and is therefore a major target in the development of disease-modifying (immune)therapies for AD. Unfortunately, however, at least until now, therapeutic strategies aimed specifically at reducing Aβ load suffer from inadequate efficacy, i.e., not meeting their primary clinical endpoints [3]. Different from the focus on alterations in Aβ production, accumulation and/or deposition in the brain as isolated factors in AD pathogenesis per se, the causal role of Aβ in AD has also been considered as part of a multifactorial disease process in which, in addition to Aβ, multiple other proteins are involved in key molecular and cellular mechanisms linked to neuronal dysfunction and neurodegeneration. Amongst mechanisms identified using this research strategy are neuroinflammation, oxidative stress, synaptic toxicity, cell cycle and cell membrane abnormalities and (abnormal) post-translational modification(s) of both intra- and extracellular proteins [4,5,6]. Considering the lack of success thus far with an (exclusively) Aβ-centered approach, in order to better understand AD pathophysiology and develop novel and more effective strategies for treatment, it may therefore be of utmost importance to gain more insight into such “non-amyloid factors and mechanisms”.
Transglutaminase-2 (TG2), or tissue transglutaminase, is a member of the enzyme family of transglutaminases (EC 2.3.2.13), generally known for their post-translational modification of protein substrates. TG2 is present both inside and outside of cells, including the cell surface, and has a wide range of functions, in particular crosslinking of Gln and Lys residues on protein substrates, acting as a deamidase, GTPase, isopeptidase or protein disulphide isomerase or as a molecular adapter/scaffold in non-enzymatic protein–protein interactions [7]. TG2 is involved in various (physiological and pathological) processes and conditions, including cell growth and differentiation, cell death and survival, fibrosis, inflammation and tissue repair [8]. TG2 enzymatic crosslinking activity is calcium-dependent and associated with its spatial conformation, as its compact (“closed”) conformation is generally considered as the enzymatically inactive state, whereas the stretched (“open”) conformation is associated with its enzymatic active (crosslinking) state [7]. Depending on the cellular (patho)physiology and tissue condition at hand, both TG2 spatial conformation and (sub)cellular location changes, affecting TG2 binding partners and/or enzymatic substrates with which it interacts both intracellularly and extracellularly. Therefore, this condition at hand also dictates TG2 involvement in the various cellular pathways to which its binding partners belong.
TG2 is ubiquitously expressed in neurons, glial cells and in parenchymal vessels and capillaries in the human brain [9,10]. Both TG2 enzyme as well as its crosslinking activity are elevated in AD post mortem brain tissue and cerebrospinal fluid compared to controls [11,12,13]. In addition, TG2 and its crosslinking activity are present in SPs and CAA in post mortem tissue of AD cases and in glial cells associated with these lesions [10,14]. Apart from TG2 association with AD brain lesions, it is known to directly interact and post-translationally modify soluble Aβ monomers inducing neurotoxic protein multimers [15,16,17,18,19,20]. Interestingly, TG2 also interacts with various other proteins strongly associated with the pathophysiology of AD, such as Apolipoprotein E, heparan sulphate proteoglycans, heat shock proteins, gelsolin, various mitochondrial proteins and proteins of the ubiquitin system [21,22,23,24,25]. However, an integrated view of the “protein interactome” of TG2 in AD is currently lacking. More importantly, analysis of such a TG2 interactome reveals the cellular pathways in which TG2 is involved, and how AD conditions affect TG2 involvement in pathways compared to control conditions. As a first step towards this end, in the present study we used the extensively characterized APP23 AD mimicking mouse model.
In previous work, we demonstrated the presence of TG2 and its in vivo activity in Aβ pathology and lesion-associated brain cells in APP23 mice [26]. The APP23 mouse AD model demonstrates a variety of characteristic Aβ pathologies, i.e., vascular amyloid deposits and parenchymal Aβ deposits, divided into senile plaques, small dense plaques and large diffuse anti-Aβ antibody immunoreactive areas, that develop between 12 and 24 months of age [27].
In order to analyze all TG2 interactors under both normal and AD-related disease condition to unravel the cellular pathways in which TG2 is involved, we performed a comprehensive and unbiased analysis of the proteome and TG2 interactome of APP23 and wild type (WT) animals. To establish such a comparative TG2 proteome and perform network and pathway analysis of APP23 and WT mice, crossbred animals of the APP23 mice and WT with TG2−/− mice [28] were developed to exclude non-specific TG2 interactors. As TG2 is associated with both SP and its precursor diffuse plaques in AD, as well as both early vascular Aβ deposition and CAA [10,22,29], we analyzed animal brains at a disease duration (18 months) in which these Aβ pathologies are prominently present in APP23 mice, but have not yet developed to end stage disease [27]. Using this material also distribution and levels of Aβ pathology, mRNA of TG2 family members and soluble Aβ levels were determined in APP23, APP23/TG2−/−, WT and WT/TG2−/− animals.

2. Materials and Methods

2.1. Animals

APP23 mice, overexpressing human APP751 carrying the Swedish double mutation (K670M/N671L) [27], were obtained from Novartis (generous gift from Dr. Derya R. Shimshek, Novartis Institutes of BioMedical Research, Neuroscience, Basel, Switzerland). TG2−/− mice were a generous gift from Prof. Gerry Melino, and generated by deletion of 1,200 base pairs, from exon 5 to intron 6, which includes exon 6 containing the active site of TG2 [28]. C57BL/6 mice wild type (WT) were purchased from Charles River (Leiden, The Netherlands). All mice were bred within our facilities on a C57Bl/6 J background and group-housed in standard mouse cages under conventional laboratory conditions with a 12:12 h light-dark cycle (light on at 8:00 AM, light off at 8:00 PM), constant room temperature (22 ± 2 °C), humidity level (55 ± 5%), and food and water available ad libitum. Based on established milestones in the progression of AD pathology within the model (e.g., first appearance of plaques, cognitive deficits and progression of wide-spread Aβ pathology), 18-month-old mice were selected for the study [30], consisting of APP23 (n = 8), WT (n = 6), APP23/TG2−/− (n = 10) and WT/TG2−/− (n = 5). The experimental procedure using the above-mentioned mice were carried out in accordance with the animal welfare body of the VU University and approved by the local Animal Care and Use Committee.

2.2. Tissue Collection

Animals were euthanized at 18 months of age by cervical dislocation. The brains were harvested and dissected on ice into three parts: two hemi-forebrains and the cerebellum (the olfactory bulbs were discarded). After dissection, the brains were snap frozen in liquid nitrogen and immediately stored at −80 °C until use.

2.3. Immunohistochemistry and Double (Immuno)Fluorescence Staining

Serial coronal sections of 6 μm were obtained, starting at the base of the hippocampus. The acquired sections were fixated for 10 min using 100% acetone, unless stated otherwise. Non-specific sites were blocked using bovine serum albumin (Capricorn Scientific, Ebsdorfergrund, Germany), except for the Aβ staining for which the sections were treated with milk powder. Endogenous peroxidases were quenched using a 0.3% H2O2, 0.1% sodium azide solution in Tris-buffered saline (TBS, pH 7.6), for 15 min. All sections were incubated with their primary antibodies overnight at 4 degrees Celsius. Primary antibodies were diluted in a TBS-triton (0.5% tritonX) solution. Further details are provided in Table S1. Between the different incubation steps, sections were washed with TBS. The sections were stained for Aβ using a rabbit anti-human anti-amyloid antibody (715800, dilution 1/400) purchased from Invitrogen (Carlsbad, CA, USA). Secondary biotinylated antibody, goat anti-rabbit, was obtained from Jackson Immunoresearch (West Grove, PA, USA) and used in a 1/400 dilution. The complex of antibodies was recognized by the avidin-biotin-peroxidase complex, using the Vectastain Elite Avidin Biotin kit (Vector Laboratories, Burlingame, CA), for a period of one hour. This was done in combination with 3,3′-Diaminobenzidine (DAB) as chromogen (Sigma, St. Louis, MO, USA). After the precipitation of DAB, sections were rinsed with Tris-HCl and subsequently washed with tap water before being dehydrated in a series of alcohol dilutions, after which the sections were covered in xylene and mounted with Entellan (Merck Millipore, Darmstadt, Germany). Counterstaining was performed using hematoxylin. After counterstaining, the sections were washed with tap water once more, before being dehydrated in a series of alcohol dilutions, after which the sections were covered in xylene and mounted with Entellan (Merck Millipore).

2.4. Quantification of Immunohistochemical Stainings

Using a Leica brightfield microscope (DM5000B, Leica Microsystems, Wetzlar, Germany) equipped with a nuance spectral imager (Nuance 3.02, Perkin Elmer Inc., Hopkinton, MA, USA) two serial Aβ stainings were photographed per cohort, with an average of 30 μm (a minimum of 18 μm) spacing between sections of the same animal. The quantification of the Aβ burden was accomplished by performing a surface measurement of Aβ carried out by capturing a section in 4 photos at a magnification of 2.5×, following the protocol by Hepp et al. [31]. The load of Aβ pathology was represented by the percentage of the section that is covered by Aβ. In order to determine what fraction of the surface area in a section is overlaid with Aβ pathology, the multispectral imaging system used the individual spectra of DAB and hematoxylin. After discriminating between the spectra of DAB and hematoxylin the nuance software, using the co-localization tool, was able to compute the fraction of Aβ represented by DAB, that co-localizes with the hematoxylin background. To distinguish which threshold should be implemented, a test was performed with multiple sections containing a wide variety of Aβ pathology. The threshold was set at 0.200 for hematoxylin and 0.938 for Aβ, respectively. After calculating the percentage of Aβ pathology, the values of two slides per mouse were averaged, representing the amyloid-beta burden per mouse. In addition to quantification of Aβ pathology, a morphological quantification was performed to evaluate the differences between APP23 and APP23/TG2−/− mice in the amount of individual amyloid manifestations. In order to do so, the protein deposits were divided into 3 morphology-based categories: senile plaques, small dense plaques and vascular amyloid deposits, respectively (see Figure 1B). Senile plaques are defined as parenchymal Aβ deposits of approximately 20–60 μm in diameter, whereas small dense plaques are approximately 2–10 μm in diameter. Vascular amyloid deposits are defined as Aβ deposits in the brain vasculature. The morphological quantification was performed by manually appointing the individual forms of Aβ deposits to one of the categories and counting these at a magnification of 4× using an Olympus Brightfield microscope (Vanox-T, Olympus Life Science Solutions, Shinjuku, Tokyo, Japan).

2.5. Semi-Quantitative RT-PCR

To determine the mRNA transcript levels in all mice, brain tissue was homogenized in Trizol reagent (Invitrogen, Carlsbad, CA, USA). Total RNA was isolated and 1 μg of cDNA was synthesized using the Reverse Transcription System (Promega, Madison, WI, USA) with oligo-dT primers and AMV enzyme according to the manufacturer’s instructions. For semi-quantitative RT-PCR, the SYBR Green PCR Core reagents kit (Applied Biosystems, Foster City, CA, USA) was used. Amplification of cDNA was performed in MicroAmp Optical 96-well Reaction Plates (Applied Biosystems) on an ABI PRISM 7700 Sequence Detection System (Applied Biosystems). The reaction mixture (20 μL) was composed of 1× SYBR Green buffer, 3 mM MgCl2, 875 μM dNTP mix with dUTP, 0.3 U AmpliTaq gold, 0.12 U Amperase UNG, 12.5 ng cDNA and 15 pmol of each primer (Table S2). The reaction conditions were an initial 2 min at 50 °C, followed by 10 min at 95 °C and 40 cycles of 15 s at 95 °C and 1 min at 59 °C. The mRNA expression levels were quantified relatively to the level of the housekeeping gene glyceraldehyde-3-phosphate-dehydrogenase (GAPDH) using the following calculation: 2−(Threshold cycle of target mRNA “–’’ Threshold cycle of GAPDH) × 100.

2.6. Aβ1–40 and Aβ1–42 Protein Analysis
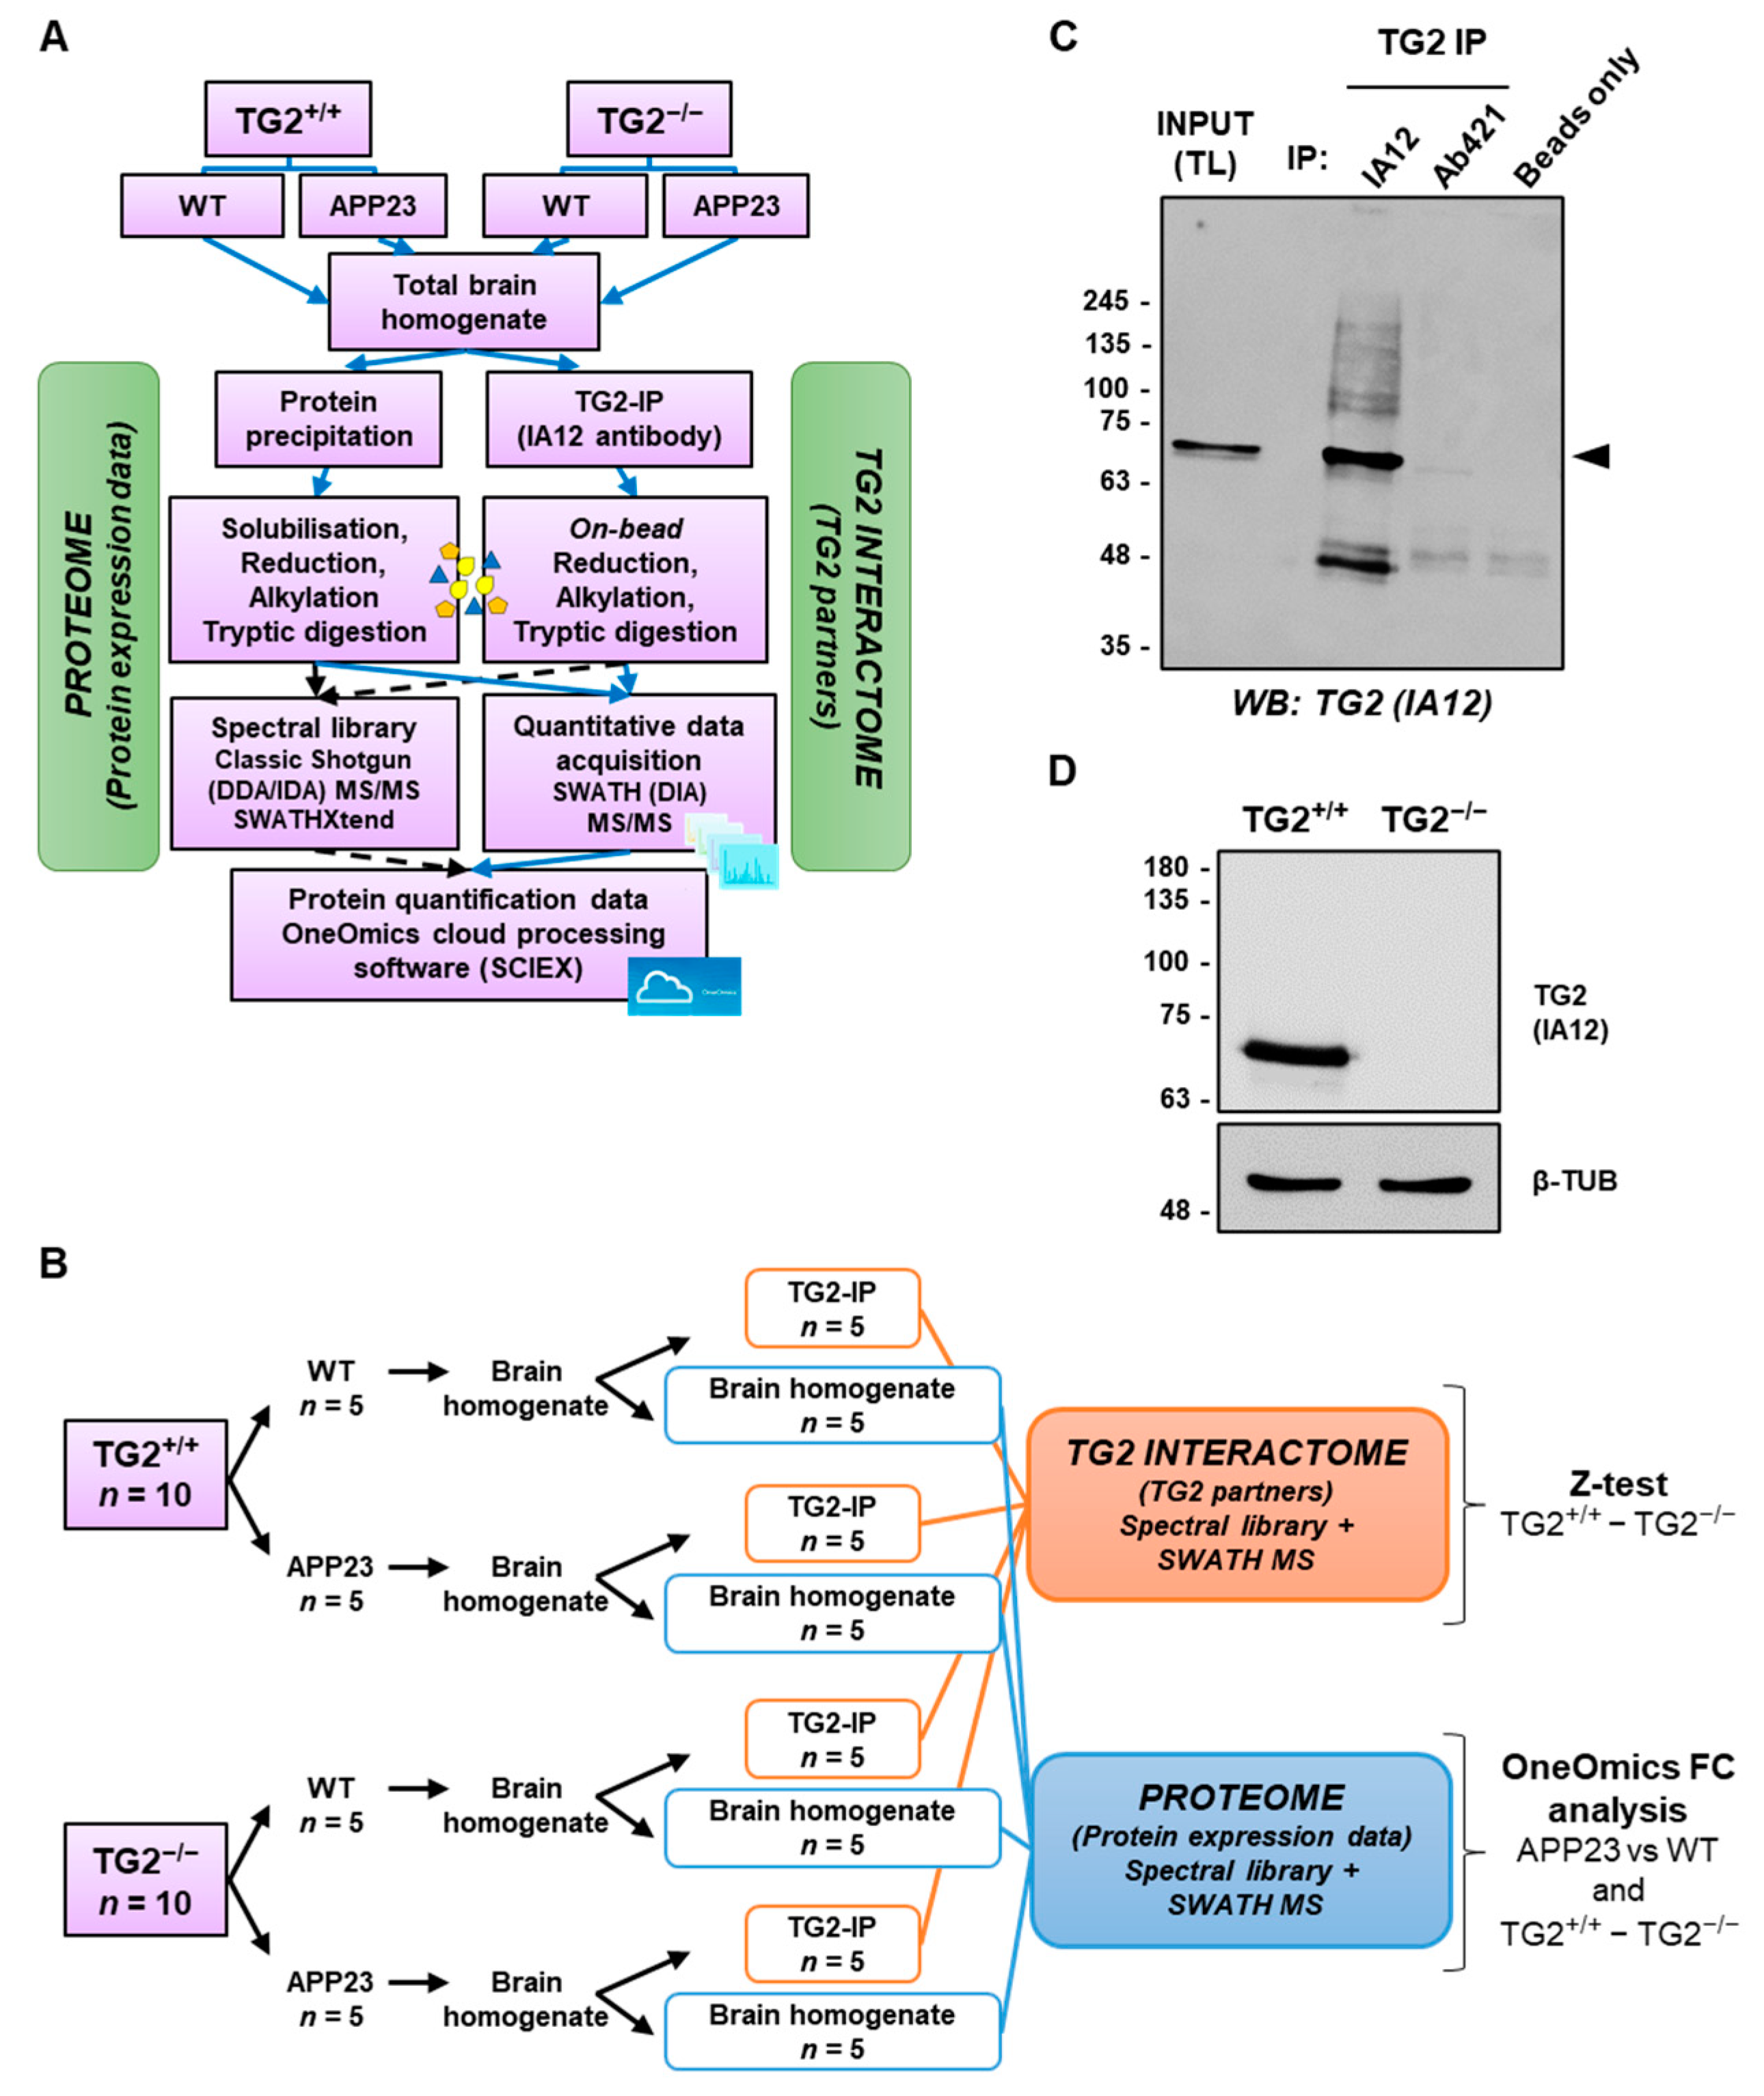
The concentration of Aβ1–x, Aβ1–40, and Aβ1–42 in the soluble protein fraction was determined by ELISA measurements using the human Aβ1–x assay kit, the human Aβ1–40 assay kit, and the human Aβ1–42 assay kit (IBL International, Hamburg, Germany). All samples were diluted to within the detection limits of the test and analyzed in duplicate according to the manufacturer’s instructions. The Aβ1–x assay detects all Aβ variants with an intact N-terminus and a length of more than 16 amino acids. The Aβ1–40 assay shows ≤0.1% cross-reactivity with other human Aβ species, but does show 16.3% cross-reactivity with endogenous Aβ1–40. The Aβ1–42 assay shows ≤0.1% cross-reactivity with other human Aβ species and endogenous Aβ (manufacturer’s instructions).

2.7. Brain Proteome

Five mice brains per animal group (WT, WT/TG2−/−, APP23 and APP23/TG2−/−) were weighted and homogenized in 10% w/v IP lysis buffer (25 mM Tris pH 7.4, 150 mM NaCl, 1 mM EDTA, 1% NP40, 5% glycerol; Sigma protease inhibitors) (Merck Life Science UK Limited, Gillingham, United Kingdom) using a glass-teflon Dounce homogenizer. The five APP23 and APP23/TG2−/− mice were selected based on the presence of average levels of Aβ pathology when compared to the whole group. The tissue lysates were centrifuged at 13,000× g at 4 °C for 10 min and the supernatants used for further analysis (total brain homogenates). Equal amounts of total protein extracts (50 μg) were acetone precipitated (−80 °C overnight), followed by centrifugation at 16,000× g for 10 min at 4 °C and solubilization in 50 mM tri-ethyl ammonium bicarbonate (TEAB, Sigma) containing 0.1% (w/v) ProteaseMAX™ Surfactant (Promega UK, Southampton, United Kingdom). Proteins were subjected to reduction (5 mM dithiothreitol at 56 °C for 20 min), alkylation (15 mM iodoacetamide at room temperature for 15 min), and then trypsin digested overnight at 37 °C with 0.01 mg/mL MS-grade trypsin (Promega) and 0.01% (w/v) ProteaseMAX surfactant in a water bath. Samples were vacuum concentrated to dryness and resuspended in 30 µL of 5% (v/v) acetonitrile/0.1% (v/v) formic acid for MS analysis. Peptides were analyzed by RP-HPLC-ESI-MS/MS using a TripleTOF 6600+ mass spectrometer (SCIEX, Ontario, Canada). Analysis of differentially expressed proteins was performed using the OneOmics cloud processing online platform (SCIEX) as the ratio of protein peak area in APP23/TG2−/− or WT/TG2−/− mice over the protein peak area of the same protein in APP23 or WT mice, respectively. Data were regarded as differentially expressed at 0.545 (55%) confidence level.

2.8. TG2 Immunoprecipitation from Brain Homogenates

TG2 with associated proteins was immunoprecipitated from the total brain homogenate fractions using the Pierce crosslink magnetic IP kit (Fisher Scientific, Loughborough, United Kingdom) by protein A/G magnetic beads to which anti-TG2 antibody (IA12; University of Sheffield) [32] was crosslinked using disuccinimidyl suberate. Incubations of brain homogenates with the antibody-coated beads were performed for 22 h at 4 °C in constant rotation. TG2-associated proteins were subjected to reduction, alkylation and trypsin digestion directly on the beads after washing the beads three times with 50 mM TEAB. Beads were incubated for 15 h with 0.02 mg/mL of proteomics-grade trypsin (Promega) in 50 mM TEAB. Peptides were analyzed by RP-HPLC-ESI-MS/MS using a TripleTOF 6600+ mass spectrometer (SCIEX). Proteins were considered specifically associated with TG2 in WT and APP23 mice according to z-test analysis, using TG2−/− cohorts as background controls, as previously described [24].

2.9. Information Dependent Acquisition (IDA) and SWATH Acquisition MS of Brain Homogenates and TG2 Immunoprecipitates

Brain homogenates and TG2 immunoprecipitates were analyzed by RP-HPLC-ESI-MS/MS using a TripleTOF 6600+ mass spectrometer as outlined before [24], with some modification in the protocol. The mass spectrometer was used in two different modalities depending on the stage of the experiment: information dependent acquisition (IDA) mode was employed at the beginning for spectral library construction, while SWATH 2.0-data independent acquisition (DIA) mode was used for the quantitation [33]. RP-HPLC mobile phases were solvent A (0.1% (v/v) formic acid in LC/MS grade water) and B (LC/MS grade acetonitrile containing 0.1% (v/v) formic acid). Samples were injected (trap/elute via 5 × 0.3 mm YMC Triart C18 trap column) onto a YMC Triart-C18 column (15 cm, 3 μm, 300 μm i.d) at 5 μL/min using a microflow LC system (Eksigent ekspert nano LC 425) with an increasing linear gradient of B going from 3% to 30% in 68 min, to 40% at 73 min then washing to 80% for 3 min before re-equilibration in a total time of 87 min (spectral library production by IDA), or 3% to 30% over 38 min to 40% at 43 min followed by wash, to 80% for 3 min and re-equilibrated for a total run time of 57 min (SWATH-DIA). Mass calibration (TOF-MS and Product ion) was performed every 4 samples using an injection of a standard of 40 fmol PepCal mix (SCIEX). Ionization was via the SCIEX DuoSpray™ source, using a 50 μm electrode at +5500 V. A spectral library was produced from IDA acquisitions of all samples. IDA acquisition files were searched using ProteinPilot 5.0.2 (SCIEX) and the analysis was conducted by the software with an exhaustive identification strategy, searching the Swiss-Prot database (January 2019 release, 16 January 2019) for murine species. The generated file was imported into PeakView 2.1 software (SCIEX) as an ion library and aligned to the SWATH data using endogenous peptides and exported as a .txt file after filtering for false discovery rate (FDR) of 1% and excluding shared peptides. All samples were injected again in SWATH acquisition mode using 100 variable SWATH acquisition windows with an accumulation time of 25 ms between 100–1500 m/z along with a single TOFMS survey scan for 50 ms between 400–1250 m/z, for a cycle time of 2.6 s. SWATH extraction was carried out in OneOmics (SCIEX) with the following parameters: extraction window of 5 min, maximum 30 peptides/protein, maximum 6 transitions/peptide, exclude shared peptides, and XIC width set at 30 ppm. Fold change analysis was also carried out using OneOmics. The mass spectrometry proteomics data were deposited to the ProteomeXchange Consortium via the PRIDE partner repository with the dataset identifier “PXD030354”.

2.10. Z-Test Statistical Analysis

The significance of protein association with TG2 was determined by z-test analysis [34] in the five SWATH-DIA (5 animals per group) performed on TG2-IP, using the TG2-null mice as background control. First, the protein peak area of every detected protein was normalized within the whole experiment using a Z-transformation: each intensity value was transformed using the natural log transformation and then normalized by subtracting the average of the entire population and dividing for the standard deviation of the entire population, as we previously described [24]. ΔZ values were then calculated by subtracting TG2−/− Z-score from TG2+/+ Z-score for each protein in the APP23 or WT. Results were then plotted on a normal distribution curve to obtain probability values (p-values). Proteins with p-value lower than 0.05 detected in all 5 animals per group were regarded as significantly associated with TG2, meaning that the protein can be considered a specific partner (directly or indirectly associated) for the enzyme.

2.11. Bioinformatic Analysis

Functional classification and enrichment analysis of proteins of interest were performed using two different bioinformatics resources: PANTHER (Protein ANalysis THrough Evolutionary Relationships) database (www.pantherdb.org, 5 February 2021) and METACORE (https://portal.genego.com, 12 June 2020). In both cases, the whole Mus musculus genome was employed as background list. For the enrichment analysis of molecular functions or biological processes, we employed the statistical overrepresentation tool in Panther (Fisher exact, Bonferroni correction). Known and predicted protein-protein interactions were investigated using STRING (Search Tool for the Retrieval of INteracting Genes/proteins) database v11 (http://string-db.org, 4 May 2021). The network was produced by using the default confidence level (0.4) and by removing all the unconnected proteins and the small unconnected networks.

2.12. Statistical Analysis

Non-parametrical statistical analyses with exact significance values were used for all group comparisons. Comparisons between the genotype groups were performed using the independent-samples Mann-Whitney U test. Differences between the various age groups were evaluated with the independent-samples Kruskal–Wallis test. Post hoc analysis between specific age groups was performed using the independent-samples Mann–Whitney U test with a Bonferroni correction for multiple comparisons. All statistical tests were performed using SPSS statistics software v22.0 (IBM, Amrock, NY, USA). All graphs were created using Graphpad Prism v5.03 (Graphpad, San Diego, CA, USA).

3. Results

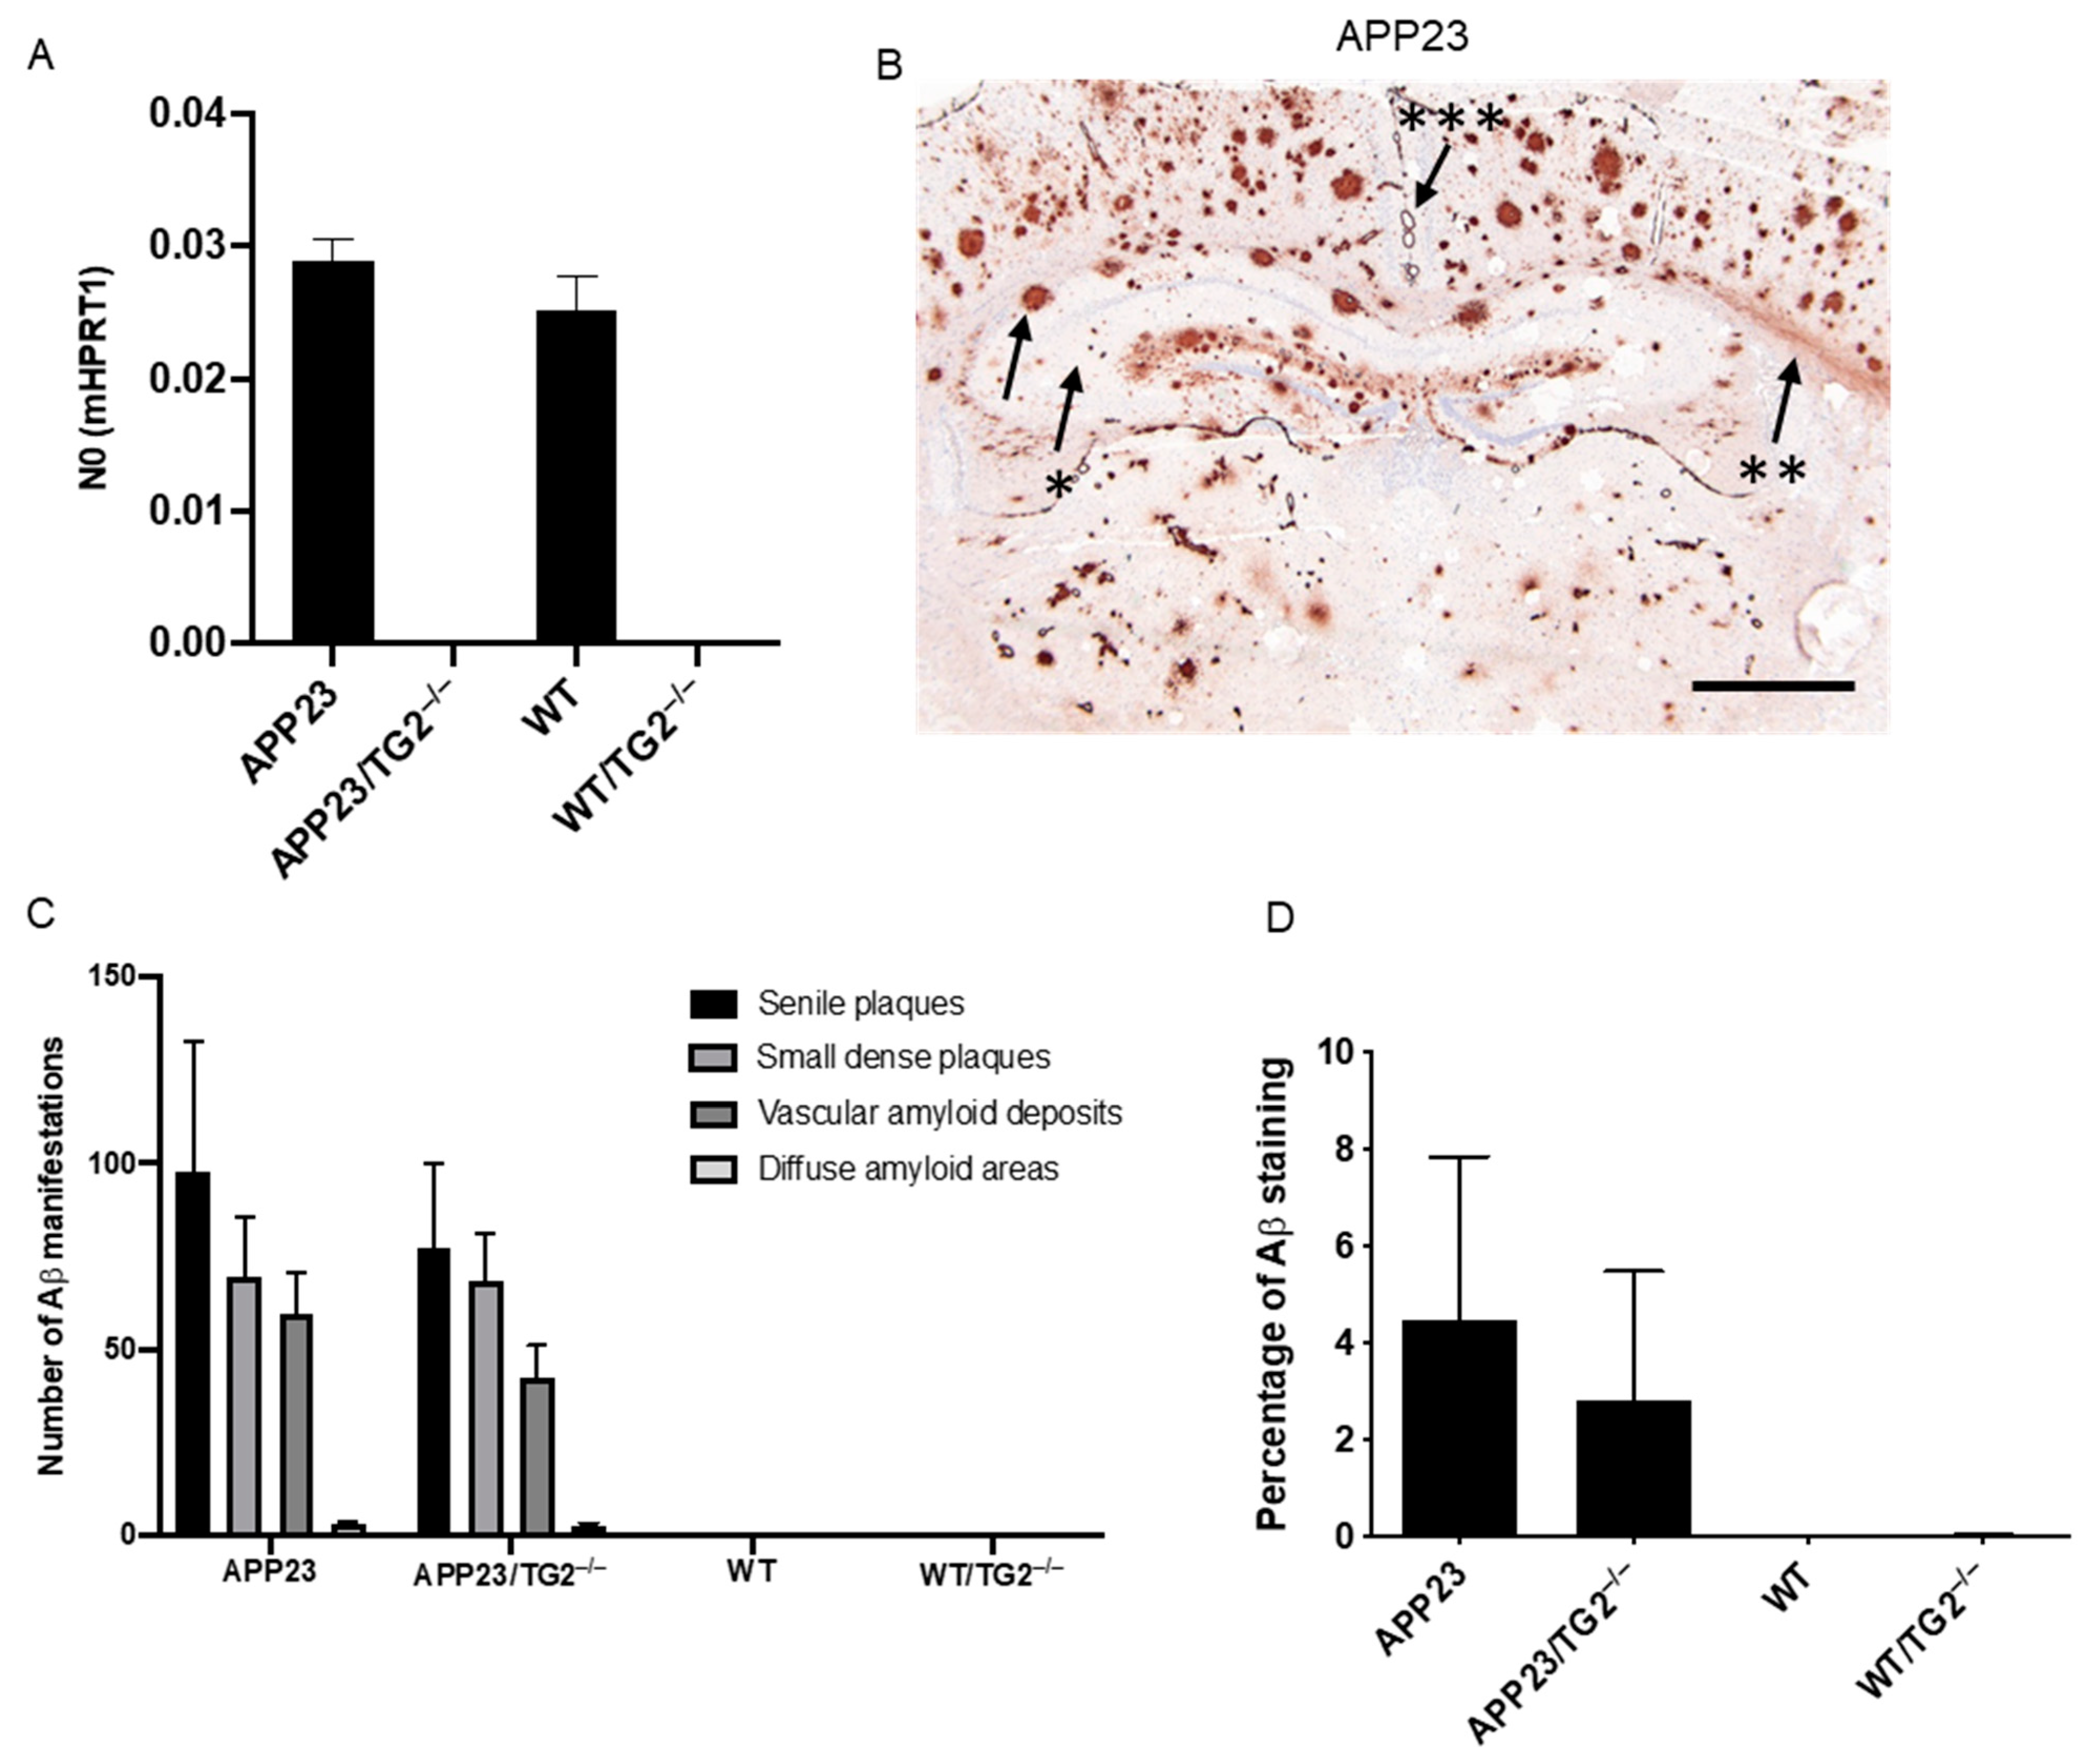
3.1. Distribution and Quantification of Aβ Pathology in APP23 and APP23/TG2−/− Mice Brain

To confirm the complete absence of TG2 mRNA in the newly developed crossbred mice, TGM2 mRNA levels were analyzed in brain homogenates of APP23, WT, APP23/TG2−/− and WT/TG2−/− mice. In both APP23 (n = 9) and WT (n = 6) mice, TGM2 mRNA was observed (Figure 1A). In contrast, in both WT/TG2−/− (n = 3) and APP23/TG2−/− (n = 9) mice, TGM2 mRNA was absent (Figure 1A). The trend increase in TGM2 in APP23 compared to WT was not significant.
In APP23 mice, initial Aβ deposits were observed at the age of 6 months and increased in both number and surface area with age [27]. In brain tissue of 12- to 24-month-old APP23 mice, Aβ deposits are abundantly present and different types of Aβ deposits have been described, i.e., vascular amyloid deposits and parenchymal Aβ deposits, divided into senile plaques, small dense plaques and large diffuse anti-Aβ antibody immunoreactive areas [27]. To analyze the effect of the absence of TG2 on Aβ deposits, immunohistochemical analysis on cryo-fixed post mortem brain tissue using an anti-human Aβ antibody was performed on both APP23 and the newly developed crossbred APP23/TG2−/− mice. In both APP23 and APP23/TG2−/− mice, the above-described types of Aβ pathology were observed (Figure 1B).
In order to quantify the effect of the absence of TG2 on the different type of Aβ lesions, differences in number of Aβ lesions are quantified in whole brain slices. We found no anti-Aβ antibody immunoreactive deposits in WT and WT/TG2−/− mice brains (Figure 1C). Analysis of the total number of senile plaques, small dense plaques, vascular amyloid deposits and diffuse amyloid areas in APP23 and APP23/TG2−/− mice showed no significant difference between the two groups (Figure 1C). To determine whether the absence of TG2 significantly affects the overall Aβ load in these mice, the percentage of anti-Aβ antibody immunoreactivity was analyzed as a percentage of total brain surface area [31]. In both WT and WT/TG2−/− mice, no Aβ deposits were detected (Figure 1D). In line with our quantitative analysis of the number of individual Aβ lesions, the percentage of total brain anti-Aβ antibody immunoreactivity demonstrated no significant difference in anti-Aβ antibody immunoreactivity as a fraction of brain surface area between APP23 and APP23/TG2−/− mice (Figure 1D).

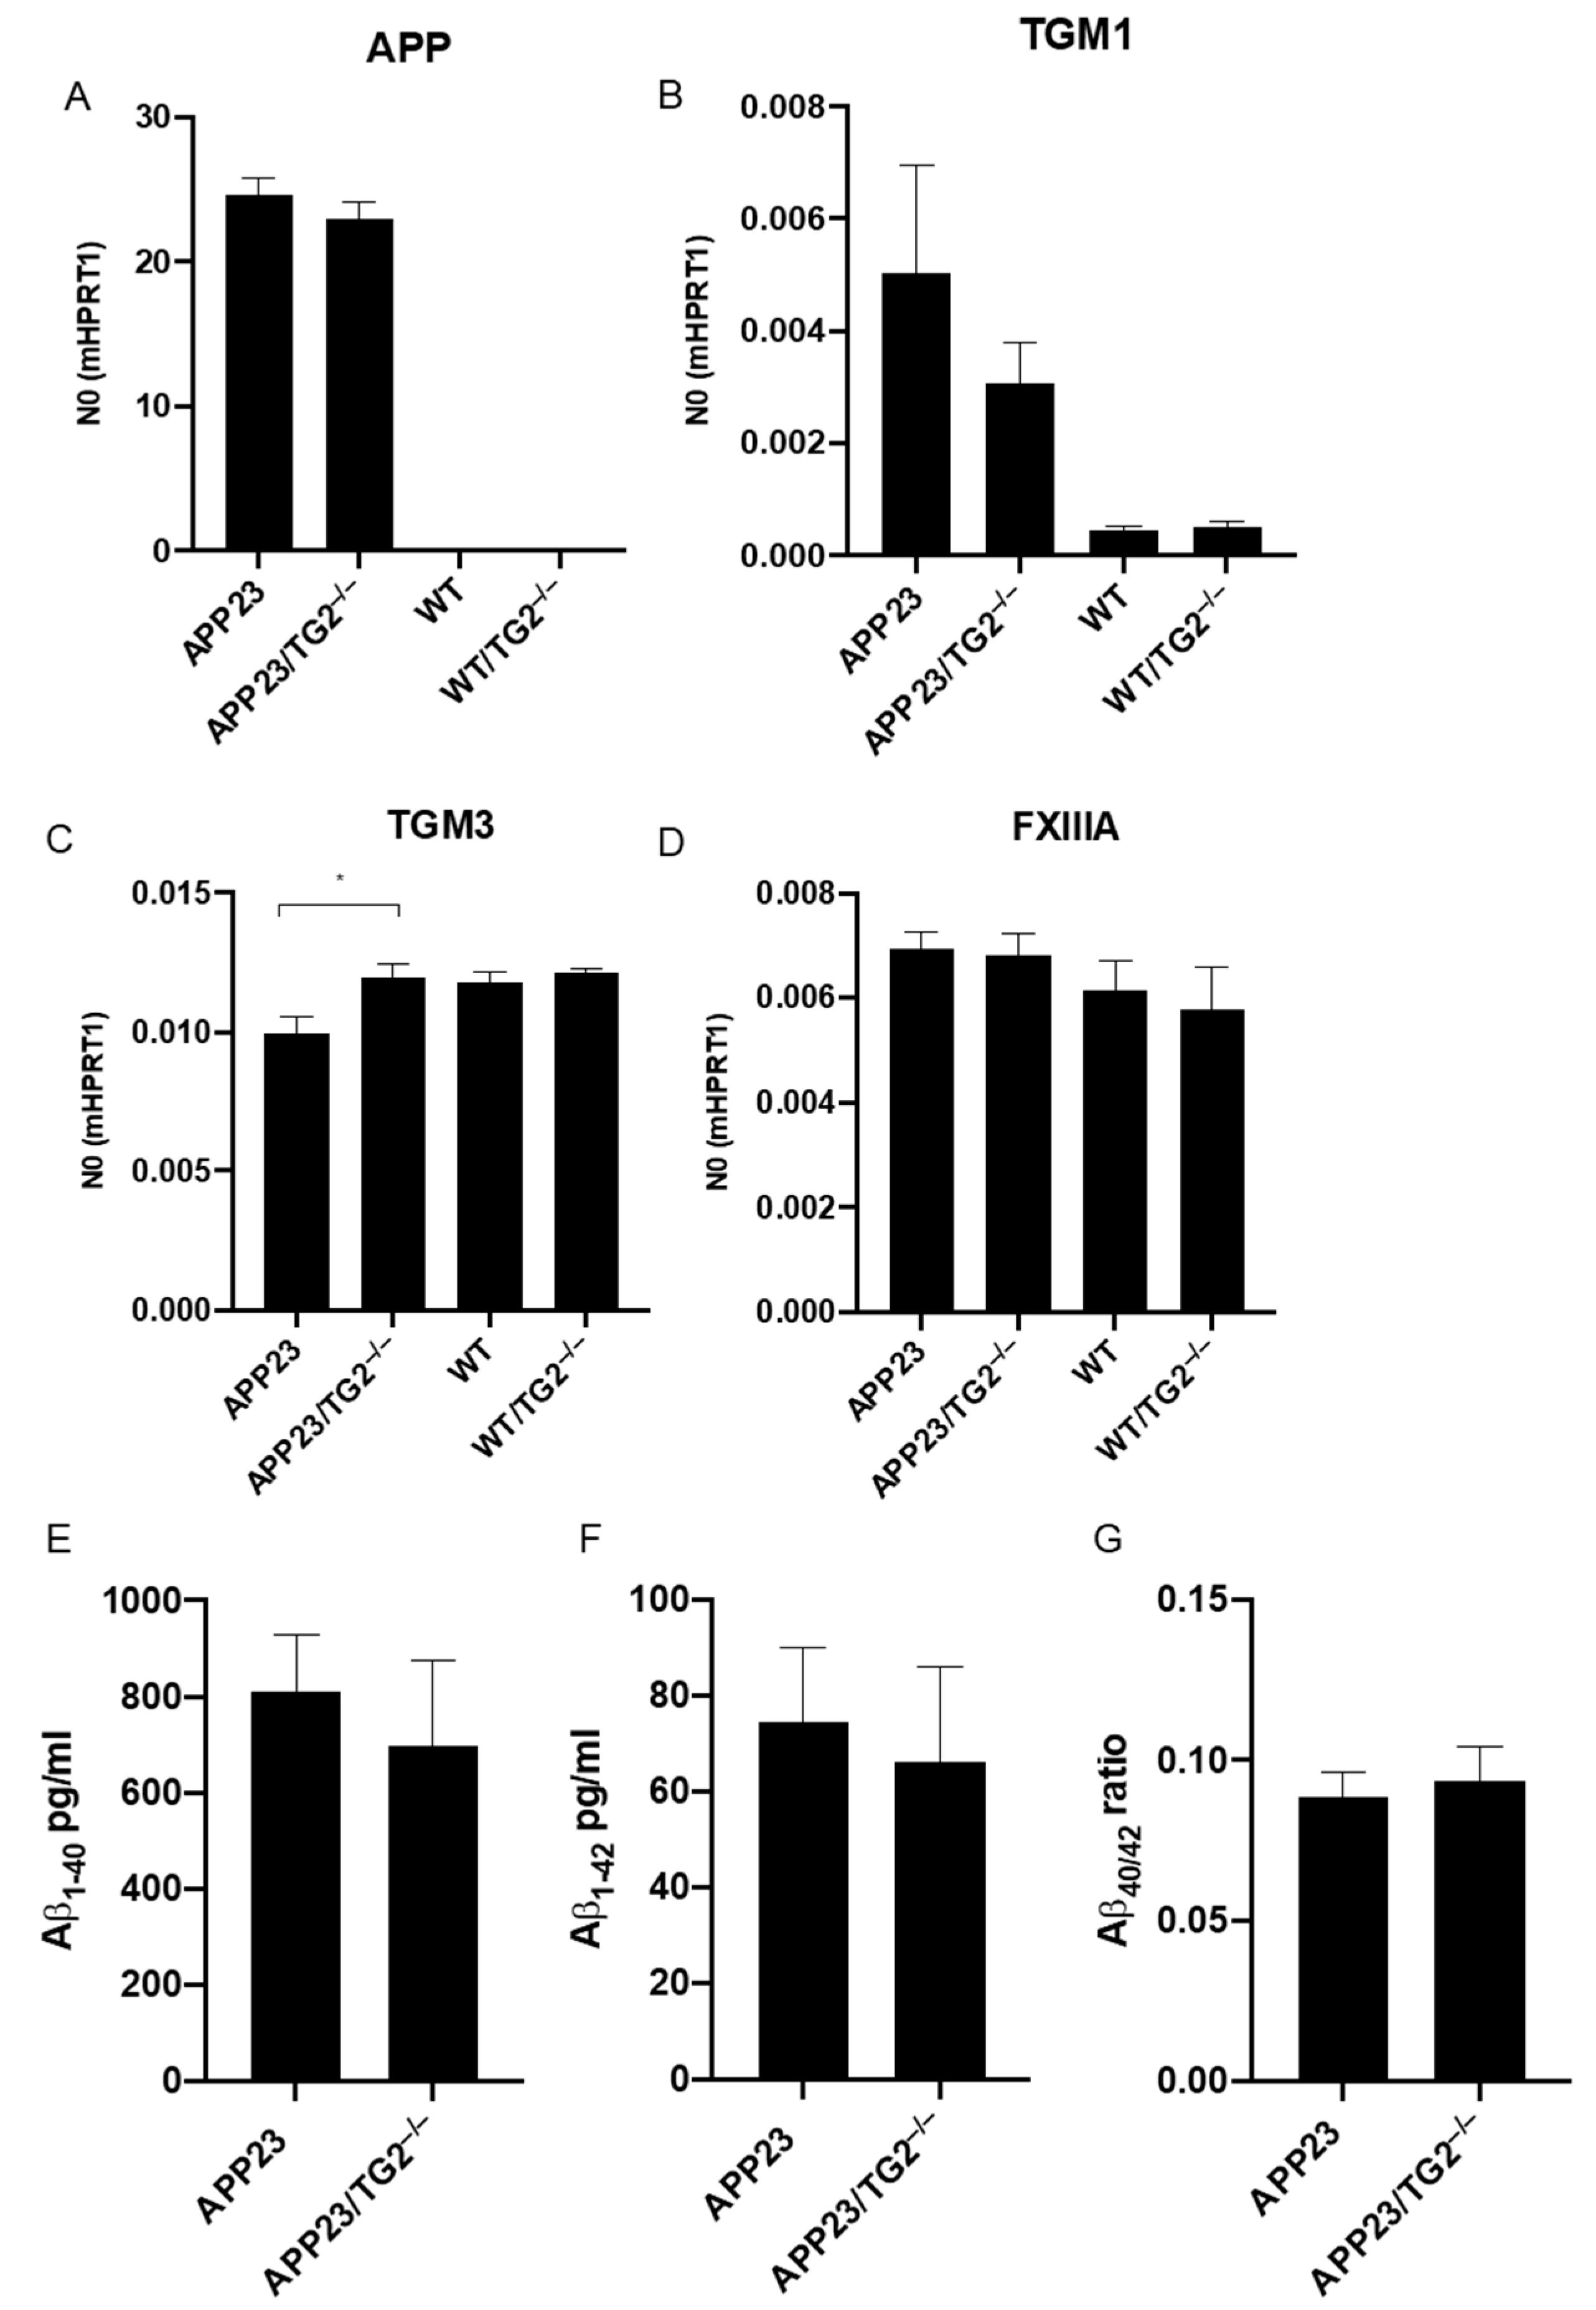
3.2. Analysis of mRNA of Human APP, Mouse TGM1, TGM3, TGM6 and FXIIIA and Soluble Brain Aβ1–40 and Aβ1–42 Levels, and Aβ40/42 Ratio in Mouse Brain Homogenates

Absence of TG2 might result in upregulation of other TG family members [35]. In order to investigate this, mRNA levels of other TG family members known to be expressed in the human brain, i.e., TG1, TG3, TG6 and FXIIIa, were analyzed. mRNA levels in mouse brain homogenates demonstrated no significant difference in human APP mRNA levels between APP23 and APP23/TG2−/− (Figure 2A). As expected, no human APP mRNA was observed in both WT and WT/TG2−/− mice (Figure 2A). Analysis of TG2 family members expressed in the mouse brain demonstrated no significant increase in mRNA levels between APP23 or WT and their TG2−/− counterparts for TGM1 (Figure 2B), FXIIIA (Figure 2D) and TGM6 (data not shown as TGM6 mRNA level were not significantly higher compared to background), with the exception of TGM3 mRNA levels which were different between APP23 and APP23/TG2−/− mice but not between WT and WT/TG2−/− (Figure 2C). This suggests that TGM3 expression is reduced in APP23 mice when compared to APP23/TG2−/− mice, but also, albeit not significantly, when compared to WT and WT/TG2−/− mice.
As Aβ interacts with and is a substrate of TG2 [19], we analyzed the effects of the absence of TG2 on levels of soluble brain Aβ1–40, Aβ1–42 and/or Aβ40/42 ratio using a dedicated ELISA. Although a reduction in both soluble brain Aβ1–40 and Aβ1–42 levels was observed in APP23/TG2−/− mice compared to APP23 mice, no significant difference was found (Figure 2E,F). Analysis of Aβ1–40 /Aβ1–42 ratio also demonstrated no significant difference in soluble Aβ1–40 /Aβ1–42 ratio between APP23 and APP23/TG2−/− mice (Figure 2G).

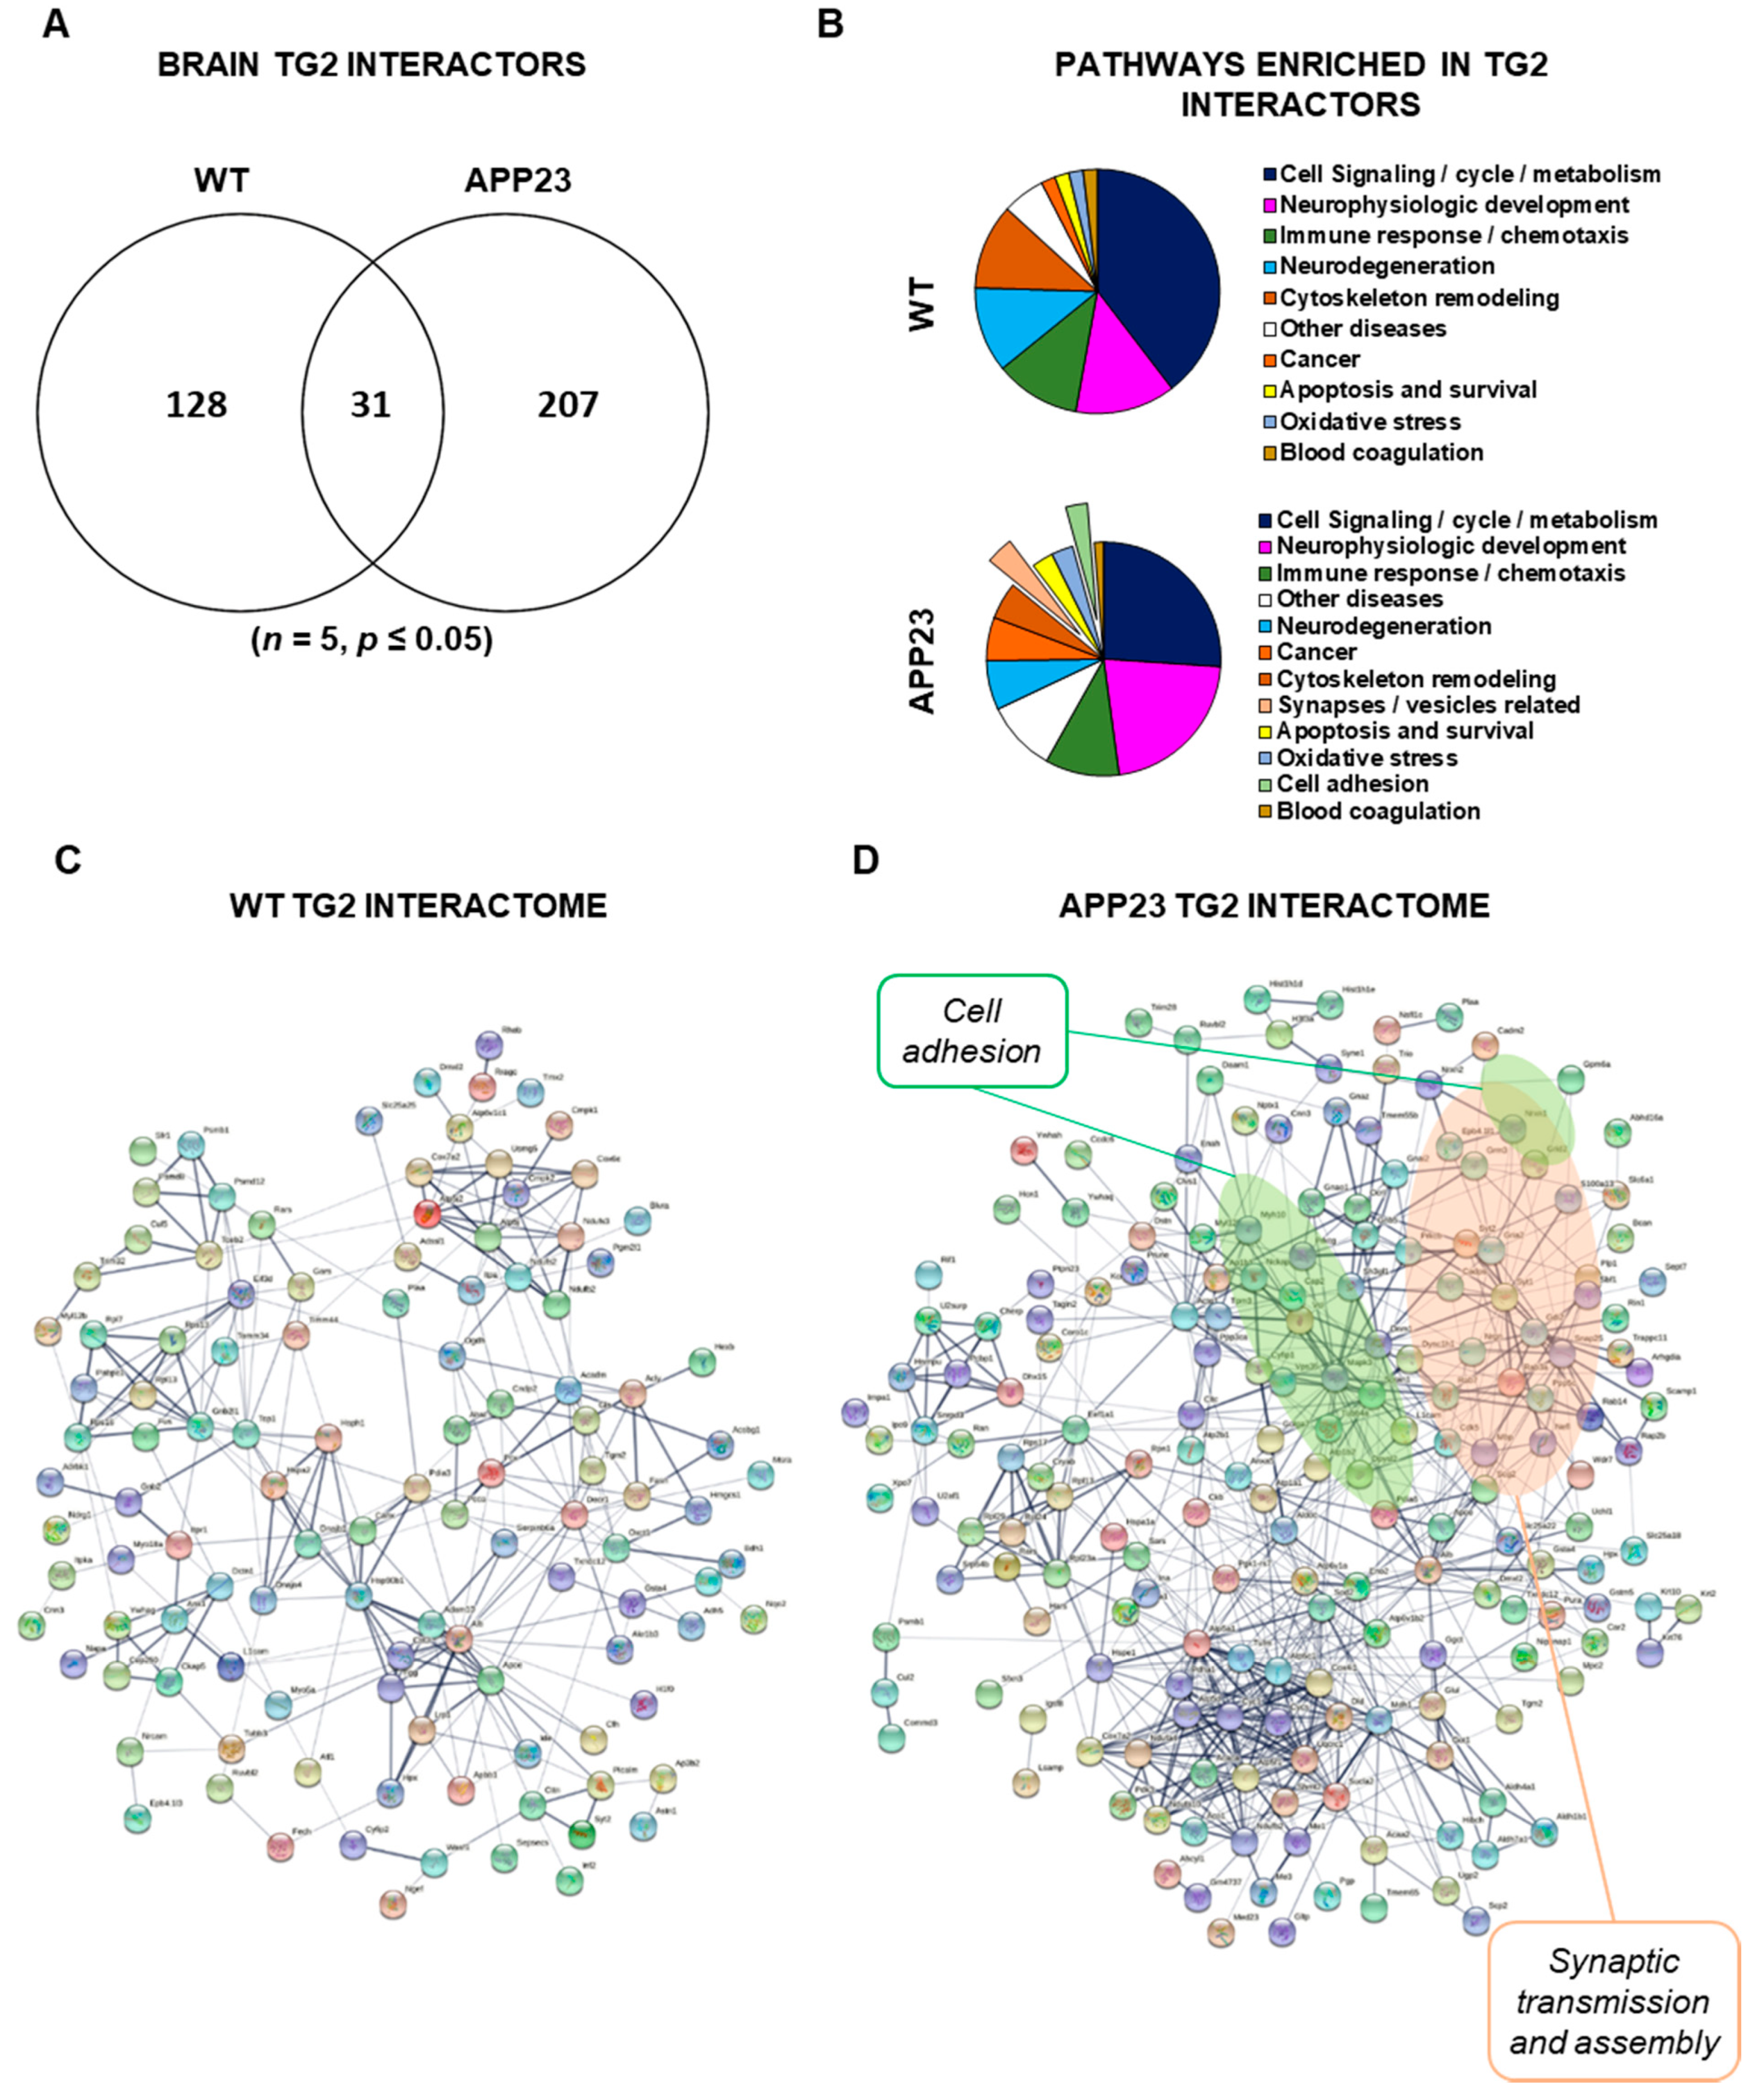
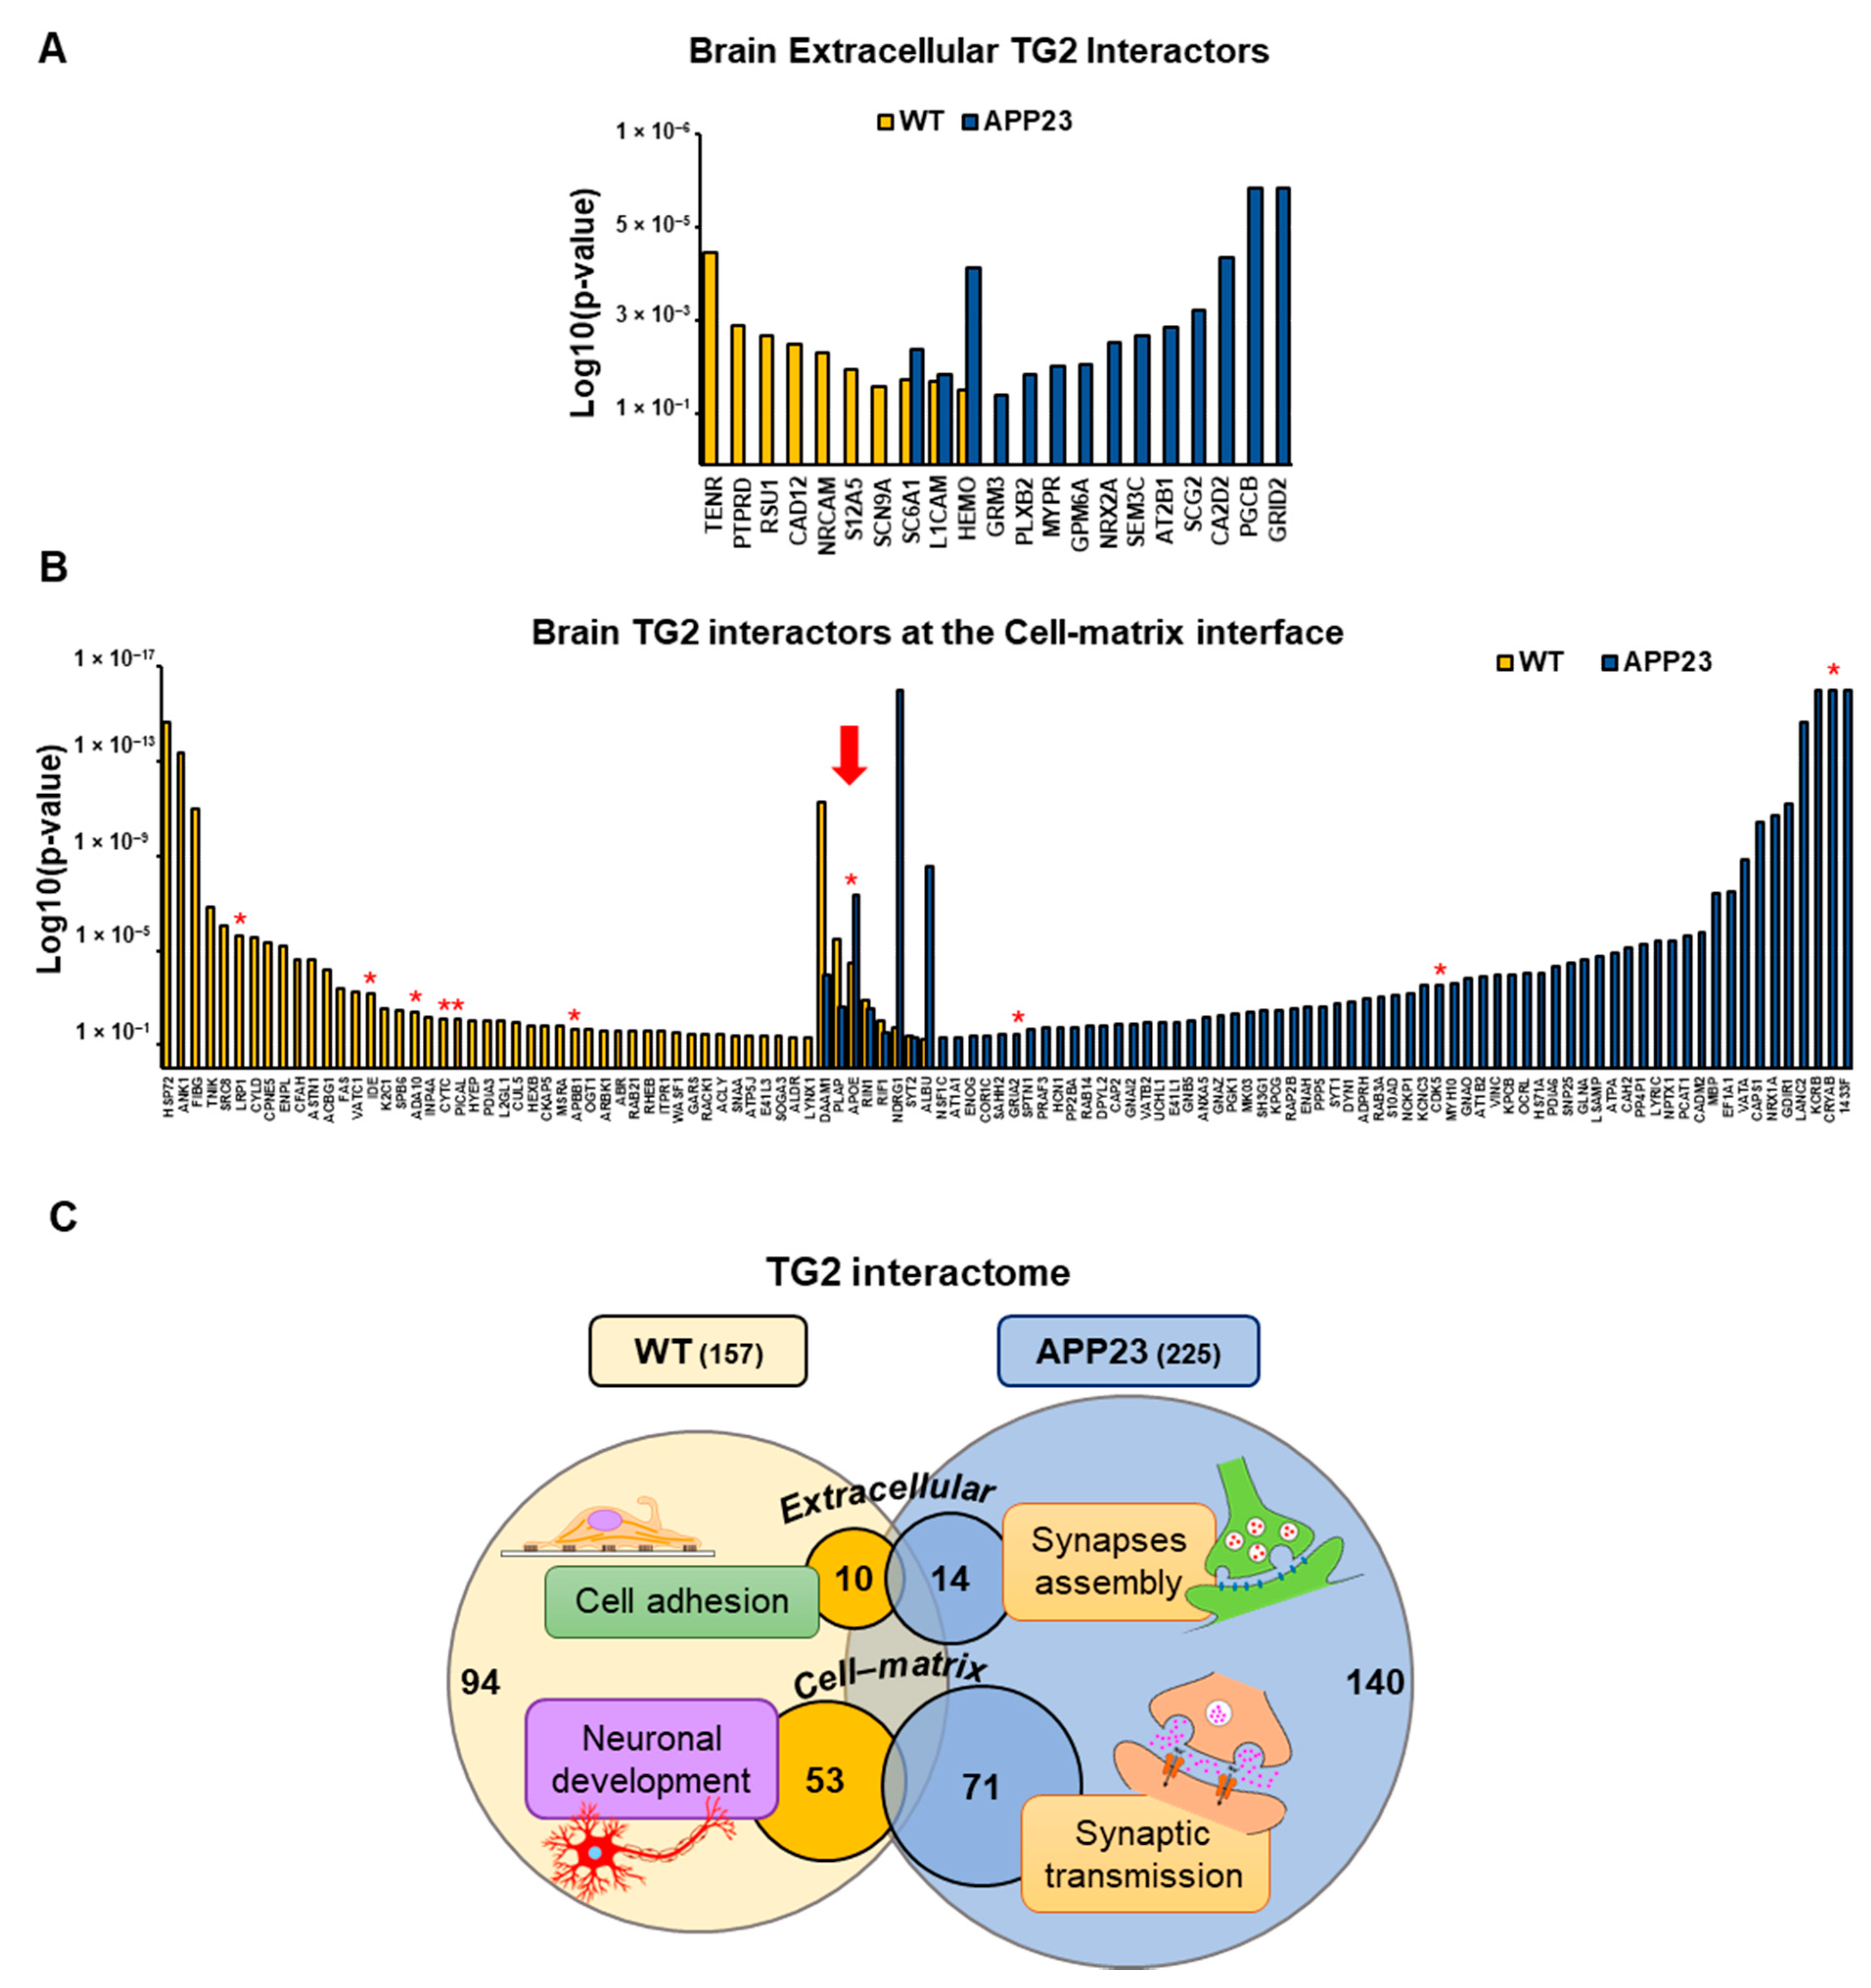
3.3. Quantitative Comparative Proteomics of TG2 Binding Partners

We performed quantitative proteomics by sequential window acquisition of all theoretical fragmentation spectra (SWATH) mass spectrometry (MS) on TG2-immunoprecipitated whole brain homogenates of APP23 and WT mice, using the APP23/TG2−/− and WT/TG2−/− as a control. This unbiased approach was used to detect protein–protein complexes ex vivo. The TG2 IP proteome from both WT/TG2−/− (n = 5) and APP23/TG2−/− (n = 5) was subtracted from the respective TG2 IP WT (n = 5) or APP23 (n = 5) proteome to reveal only the TG2-dependent interactions. The outline of this original approach is shown in Figure 3A,B. TG2-associated complexes were isolated by IP using magnetic beads coated with an anti-TG2 antibody (mouse monoclonal IA12) [32] which was validated for ability to immunoprecipitate mouse TG2 in comparison with another polyclonal anti-TG2 antibody (Figure 3C), and for specificity using TG2+/+ and TG2−/− primary mouse cell lysates as negative control (Figure 3D). In order to resolve proteomes at the highest possible sensitivity, reproducibility, and proteome coverage, the above-mentioned SWATH acquisition was used. Five IP per cohort, each starting from total lysates generated from five animal donors from each mice model, as well as the total homogenates, were used to build the spectral library to avoid bias from individual donors and achieve generalizable results (Figure 3B).
Analysis of the TG2 interactome (Figure 4A) highlighted a clear change in TG2 partners from WT to APP23 brain, with a 50% increase of TG2 interactors in the disease model, of which 13% were in common with the WT interactome (Figure 4A). Specifically, 159 proteins were the TG2 partners in the WT brain and 238 proteins in the APP23 brain, of which 31 proteins were in common (Figure 4A and Table S3). Analysis of pathway maps (Metacore) showed an enrichment of TG2-associated proteins in the macro-categories of cell adhesion (e.g., actin, vinculin and beta-tubulin) and synaptic vesicles-related pathways (e.g., RAB3A, synaptogamin and NPTX1) uniquely in APP23 brain (Figure 4B). Network analysis of the TG2 interactomes performed by STRING (built based on known and predicted protein–protein interactions) (Figure 4C,D) revealed new clusters of cell adhesion and synaptic vesicles-related proteome in the APP23 TG2 interactome, which were absent in the WT TG2 interactome. A protein cluster related to mitochondrial energy metabolism was identified in both networks (lower portion of the map) but this was enlarged and denser in APP23, suggesting a link of TG2 with mitochondrial stress typical of Aβ-associated pathology [36].
When TG2-interacting proteins were classified according to their cellular localization (Panther), a cluster of TG2 interactors was found exclusively localized at the cell membrane and extracellular space (Figure 5A, Table 1 and Table 2) (about 11% of APP23 interactome and 8% of WT interactome) and a cluster at the cell–matrix interface (Figure 5B, Table 1 and Table 2), (about 30% of APP23 interactome and 33% of WT interactome). Among these, APOE was confirmed as a strong TG2 partner in APP23 brain (p = 4.3 × 10⁻⁸) and WT brain (p = 3.5 × 10⁻⁵) (Figure 5B, red arrow). The TG2 interactome included a series of other Aβ-interacting proteins in both WT and APP23 brain (e.g., glutamate receptor 2, cyclin-dependent-like kinase 5, insulin-degrading enzyme, disintegrin and metalloproteinase domain-containing protein 10, phosphatidylinositol-binding clathrin assembly protein, amyloid-beta A4 precursor protein-binding family B member 1; Figure 5B, red asterisks). Biological process analysis of these subgroups of TG2-interacting proteins (Panther) revealed a significant enrichment of cell adhesion and brain development functions in WT brain and of synapses assembly and synaptic transmission in APP23 brain (Figure 5C). Notably, of the 207 TG2 partners restricted to the APP23 brain (Table S3) only two of the detected proteins were slightly overexpressed in the APP23 total proteome compared to the WT proteome, as shown in the next section (Table 3), thus ruling out a concentration-dependent partnership with TG2.
Together, these data suggest that the array of TG2 interactors undergoes a clear change from WT to APP23 brain at 18 months and shifts towards synapse-related functions in the presence of Aβ pathology.

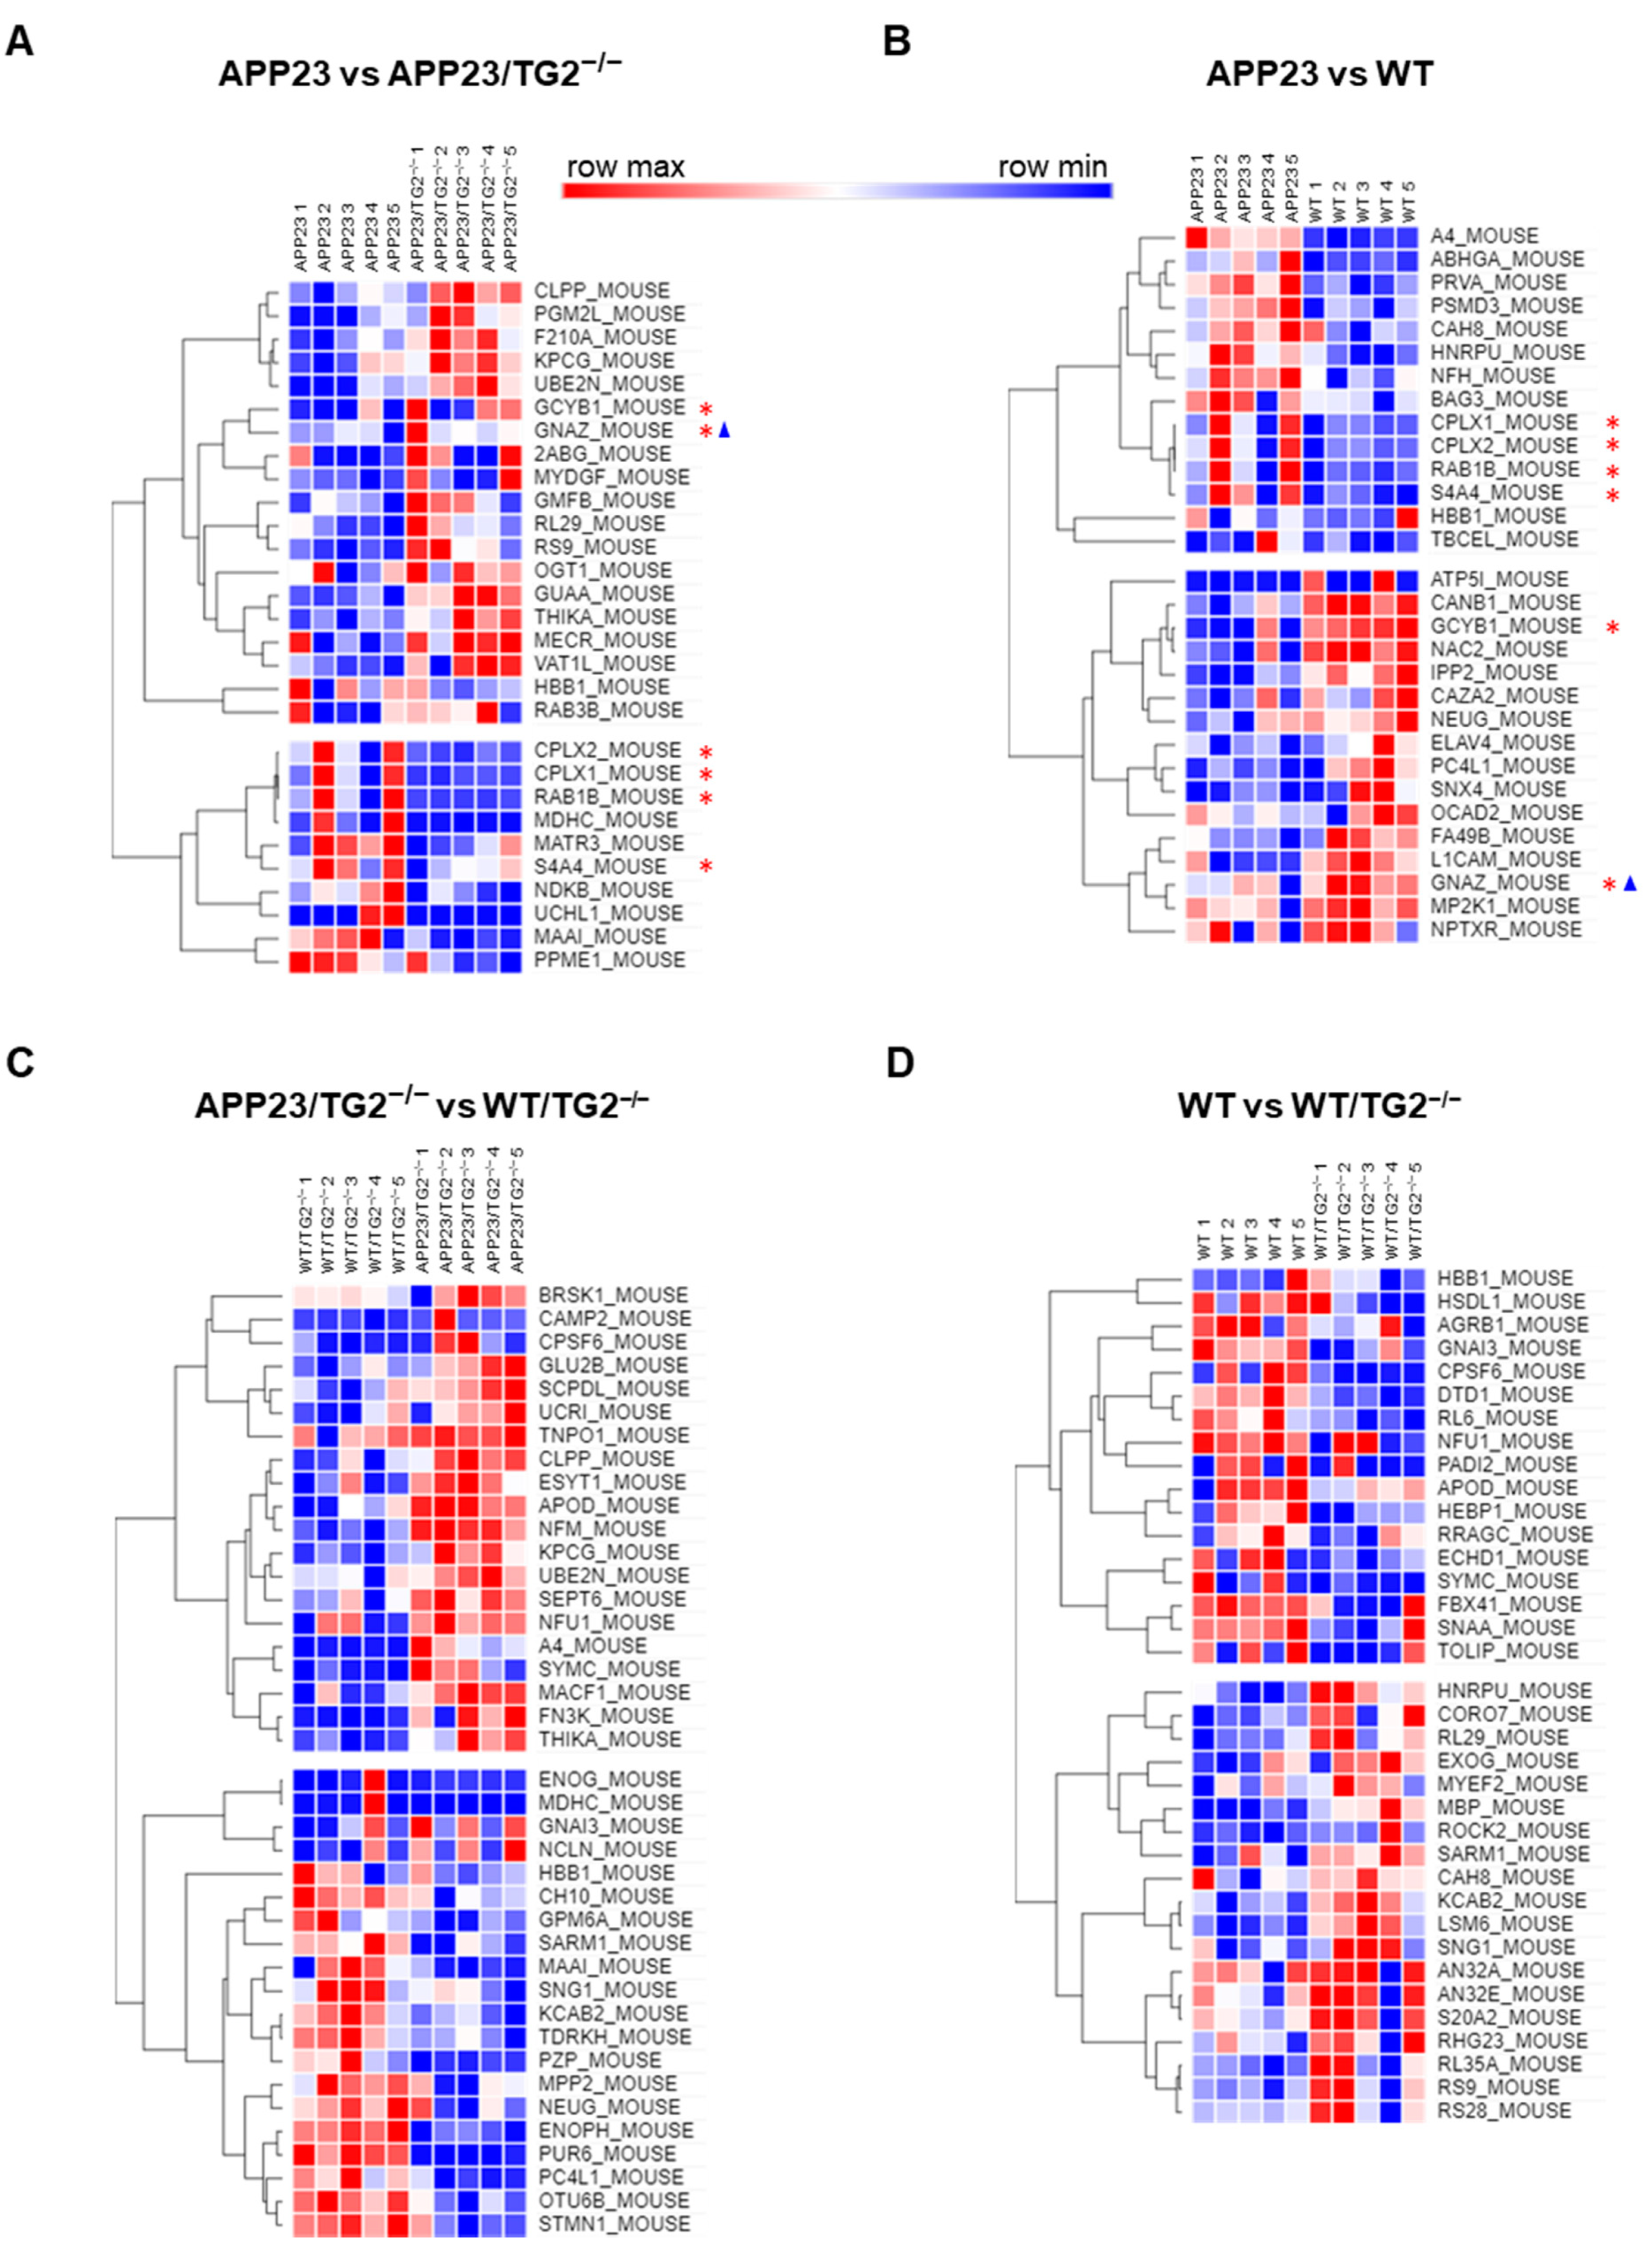
3.4. TG2+/+ and TG2−/− Brain Proteomes in APP23 Mouse Model

Having identified the specific TG2-associated protein network in the APP23 brain-TG2 precipitates, we extended the analysis of the TG2-linked pathological proteome to those proteins which do not necessary physically interact with TG2, but concur to TG2-mediated AD pathology. Quantitative proteomics was employed to compare the healthy and diseased (APP23) brain. Comparison of APP23 with APP23/TG2−/− brains (Figure 6A) highlighted proteins specifically linked with expression of TG2: Ras-related protein Rab-1B (RAB1B); Complexin-1 and -2 (CPLX1 and CPLX2) and Electrogenic sodium bicarbonate cotransporter 1 (S4A4) (log2 (APP23/APP23 TG2−/−) > 0, Table 4). These proteins were increased in the wild type APP23 brains and decreased in the APP23 brains lacking TG2 (Figure 6A); moreover, they were involved in the APP23 pathology as consistently increased in the APP23 brains compared to WT brains (Figure 6B) (log2 (APP23/WT) > 0, Table 3). Notably, CPLX2 was also found to be increased in previous proteomic analysis of the APP23 mouse model, although CPLX1 was decreased initially in 2-month-old mice [37,38].
Conversely, Guanylate cyclase soluble (sGC) subunit beta-1 (GCYB1) and G Protein Subunit Alpha Z (GNAZ) consistently decreased in the wild type APP23 brains compared to the APP23/TG2−/− brains where they were more expressed (Figure 6A) (log2 (APP23/APP23 TG2−/−) < 0, Table 4) and they were involved in the APP23 pathology being decreased in APP23 brains compared to WT (Figure 6B) (log2 (APP23/WT) < 0, Table 3).
Comparative proteomics of the APP23/TG2−/− brains versus the WT/TG2−/− brains (Figure 6C, Table 5) failed to detect differences in the above-mentioned proteins between these mice cohorts, thus excluding that these proteins changed independently from TG2 expression. Furthermore, none of the TG2-related proteins altered in APP23 compared to WT identified in this study (Figure 6A,B, red asterisks in the heat maps) changed in the WT brains following TG2−/− (Figure 6D, Table 6), underscoring our interpretation that they are part of a TG2-linked pathological proteome associated with the disease (APP23) phenotype.
ApoE, a well-known risk factor of AD and linked to Aβ pathology in APP23 mice in previous work [21,37,38], was revealed as a TG2 partner in both the WT and the APP23 interactome (Figure 5B, Table 2) and was also found to be increased in the APP23 brains in this study but at a lower level of confidence (54%).

4. Discussion

We here for the first time provide an unbiased overview of TG2 interactors and their pathways in both “normal” and an Aβ pathology-mimicking condition, using TG2−/− mouse models as a control. Network analysis of the TG2 interactome revealed a 50% increase of the number of TG2 interactors in the APP23 model compared to WT, and a clear change in the cellular pathways of which these interactors are part. Interestingly, under APP23 conditions, TG2 interactors linked to synaptic vesicle trafficking and cell adhesion pathways were added to the pathways observed in the WT condition. In addition, the number of TG2 interactors which were part of a protein cluster related to mitochondrial energy metabolism was enlarged in APP23 compared to WT. Apart from the pathway analysis, cellular location analysis of TG2 interactors revealed clusters of proteins present at the cell membrane and cell–matrix interface, and biological process analysis demonstrated that TG2 interactors are involved in cell adhesion and synaptic transmission. In line with these data, comparative proteomics showed that TG2 deletion resulted in (stronger) association of TG2 with the proteins part of synaptic transmission, mitochondrial function, membrane trafficking and signaling pathways in APP23 brains compared to WT. Together, these data show a strong shift in both number and cellular function of TG2 interactors between control and disease condition, and provide novel insight into the role of TG2 in development and/or progression of Aβ pathology and related cellular processes.
In both 18-month-old APP23 and APP23/TG2−/− mice, a variety of Aβ pathology, i.e., senile plaques, small dense plaques and vascular Aβ deposits was observed, as expected [27]. As 18-month-old APP23 mice are considered to be in a “moderate” state of disease progression [27], compared to end-stage disease observed in 24-month-old animals, variation in Aβ pathology and load between animals of the same group did not come as a surprise. However, given the proposed role of TG2 in Aβ development and disease progression [39], interactors of TG2 found at this stage of the disease might be more relevant as potential therapeutic targets compared to end-stage disease interactors. Interestingly, despite the accumulating evidence that TG2 plays an important role in development and progression of Aβ pathology in both AD [39] and in the APP23 mouse model [26], in the current study absence of TG2 did not lead to significant differences in Aβ load and pathology, between APP23 and APP23/TG2−/− mice. In addition, no statistical differences in soluble Aβ brain levels of Aβ1–40, Aβ1–42 and Aβ40/42 ratio were observed between APP23 and APP23/TG2−/− mice, although the levels measured are in line with previous publications and demonstrated a typical 10-fold increase between soluble Aβ1–40 and Aβ1–42 levels [40]. Furthermore, with the exception of TGM3, the absence of TG2 did not result in the increase in mRNA levels of other TG2 family members, as reported previously in a Parkinson’s disease model [35]. These data demonstrate that both animal models, i.e., APP23 and APP23/TG2−/−, are ideal for TG2 interactome and proteome comparison, as the absence of TG2 did not affect Aβ pathology and levels and did not give rise to compensatory alterations in expression of other TG family members.
Analysis of the TG2 proteome of APP23 and WT mice demonstrated a strong shift in TG2 interactors between mice models. Interestingly, the 159 TG2 interactors found in WT mice increased to 238 interactors in APP23 mice, with only 31 interactors in common. This demonstrated that the expression and accumulation of human Aβ in APP23 mice has a robust effect on the panel of TG2 interactors when compared to its WT counterpart. Our findings are in line with previous TG2 interactome analysis between control and disease state, i.e., a kidney fibrotic mouse model, in which a similar strong shift in TG2 interactors between control and disease state was observed [24]. This dramatic shift in interactors is most likely related to TG2 pleiotropic functions in and outside the cell [7]. Driven by the cellular state at hand, TG2 localization and conformation changes, related to its catalytically active (open) or inactive (closed) state, lead to different binding partners and/or substrates [7,41]. Of special interest are the identified TG2 binding partners unique to APP23 mice and well-known players in Aβ pathophysiology and neurodegeneration such as the glutamate receptor in the extracellular space or cell membrane compartment [42], and 14-3-3 protein and alpha-B-crystallin in the cell–matrix compartment [29,43,44]. In addition to their role in AD, both 14-3-3 and alpha-B-crystallin are known interactors and substrates of TG2, respectively [45,46]. Alike TG2, 14-3-3 protein plays a role in cell survival and the autophagy pathway and both their expression is altered in AD, suggesting a possible connection to neurodegeneration in AD [43,47]. Our findings also hint towards an Aβ-driven process in which TG2 crosslinks alpha-B-crystallin, thereby modifying Aβ-induced cytotoxicity, as suggested previously [44,45], or hampering alpha-B-crystallin physiological functioning in recognizing misfolded proteins [48]. In addition, amongst the TG2 interactors common for APP23 and WT is the well-known AD risk factor and key player in both Aβ-pathophysiology and AD-related neurodegeneration [49,50], Apolipoprotein E (ApoE), which we recently identified as a substrate for TG2-catalyzed crosslinking [21]. Interestingly, the p-value of ApoE decreased approximately 800-fold in APP23 mice, compared to WT, suggesting that it is more strongly associated with TG2 in disease. Although the role of ApoE in the formation of the typical AD brain lesions and neurodegeneration is still under debate, our data suggest a possible link with TG2 that might modify ApoE at the post-translational level under pathological conditions such as AD.
In addition to separate individual interactors of TG2 observed under control and Aβ pathology conditions, pathway and network analyses of our data demonstrated a unique enrichment of TG2-associated proteins in cell adhesion- and synaptic vesicles-related pathways in APP23 mice. In AD, Aβ-dependent changes in synaptic adhesion affect the function and integrity of synapses, suggesting that alterations in synaptic adhesion play key roles in the disruption of neuronal networks, resulting in neurodegeneration [51]. TG2 is also closely linked to the cell adhesion process, in which it interacts with an array of matrix molecules such as integrin, growth factor receptors, and other cell surface or extracellular matrix proteins, in particular fibronectin and heparan sulfate proteoglycans, to trigger adhesion signaling [52,53,54]. Modifications in the synaptic vesicle-related pathways are also well known for AD, as results of human and animal AD model studies demonstrate considerable changes in the expression and functions of presynaptic proteins, attributed in part to direct effects of Aβ on the synaptic vesicle cycle (SVC) [55]. This effect of Aβ on the SVC is not surprising as the SVC is considered as both the prime site of Aβ production and toxicity [55]. However, insight into the role of TG2 in synaptic vesicle cycling and release is very limited. TGs are known to covalently modify synapsin, which binds to small synaptic vesicles and is involved in neurotransmitter release [56]. In addition, TG2 binds and crosslinks α-synuclein, a protein known for its role in synaptic vesicle budding, exacerbating alpha-synuclein’s toxicity [57]. Interestingly, in the present study we observed TG2 interactors involved in the synaptic vesicle pathway, e.g., RAB-3, dynamin, secretogranin, synaptotagmin and synaptosomol-associated proteins, suggesting that TG2 plays a more important role in the synaptic vesicle pathway than considered thus far. Apart from the cell adhesion- and synaptic vesicles-related pathways, an enlarged protein cluster related to mitochondrial energy metabolism was identified in networks of APP23 mice compared to WT, suggesting a link of TG2 with mitochondrial stress typical of Aβ-associated pathology. Indeed, mitochondrial dysfunction is a well-known phenomenon in AD, appearing as impaired energy metabolism, disrupted mitochondrial bioenergetics and genomic homeostasis, and abnormal fusion and fission (reviewed by Wang et al) [36]. In the context of the results of the current study it is therefore of interest to note that TG2 is also closely linked to mitochondria and mitochondrial functioning, as TG2 is localized in various brain cells at both the inner and outer mitochondrial membrane space and the matrix, and its crosslinking activity is associated with “mitochondrial disease” [58]. In fact, various mitochondrial proteins, e.g., G3PDH, Bax, ANT1, Prohibitin, Aconitase 2 and ATP Synthase Beta are interactors and substrates of TG2 specifically under pathological conditions [58].
Our comparative proteomics data are in line with the TG2 interactome data, as they also reveal alterations in proteins involved in vesicle trafficking and synaptic transmission release. Proteins that are part of these pathways, i.e., RAB1B (known to control intracellular membrane trafficking), and CPLX1 and 2 (which interact with SNAREs proteins in neurotransmitter release), were found to be upregulated in APP23 compared to APP23/TG2−/− mice. Conversely, CYB1, involved in cGMP signaling-related long-term potentiation (LTP) underlying memory formation [59,60], and GNAZ consistently increased in the APP23/TG2−/− brains, and decreased in APP23 brains compared to WT, suggesting that they are also associated with TG2-mediated APP23 pathology. Moreover, and in line with previous proteomic analysis of the APP23 mouse model, we also found Complexins and Guanine nucleotide-binding proteins significantly altered in the APP23 mouse model [37,38]. However, analysis of the TG2 interactors in the APP23 brain and concurrently of the APP23 proteome has also revealed that less than 1% of the TG2 partners emerged as increased in the AD-mimicking model in our all-round investigation, suggesting modification of a specific set of proteins in brain post-translationally by transglutaminase as part of the pathological process, rather than transcriptionally.
Altogether, by performing a comprehensive and unbiased analysis of the proteome and TG2 interactome of APP23 and WT animals, using TG2−/− crossbred animals to exclude non-specific TG2 interactors, we found both known and novel TG2 interactors linked to Aβ pathology and related cellular processes, location and pathways in APP23 mice. Surprisingly, despite the elaborate biochemical and both human and murine post mortem studies linking TG2 to both the Aβ cascade and Aβ pathology, we here did not detect human or murine Aβ as a TG2 interactor. In addition, proteomics data revealed that Aβ (A4) levels changed independently from TG2 between APP23 and WT. This suggests that TG2 role in the Aβ cascade and/or pathology might be of a non-Aβ-related nature, and needs further exploring to unravel the mechanisms by which TG2 is involved in neuronal dysfunction and neurodegeneration in AD. Exploring the role of proteins involved in AD via a non-Aβ-centered approach might lead to a better understanding of AD pathophysiology, and open up new inroads to the development of novel and more effective strategies for treatment.

Supplementary Materials

The following are available online at https://www.mdpi.com/article/10.3390/cells11030389/s1, Supplementary Table S1: Details of antibodies used for IHC and IF; Supplementary Table S2: Details of primers used for semi-quantitative RT-PCR; Supplementary Table S3: Full list of proteins significantly interacting with TG2 in the WT brain, APP23 brain or both phenotypes.

Author Contributions

Conceptualization, M.M.M.W., B.D., E.A.M.V., E.T.; Methodology, E.A.M.V., E.T., D.J.B., M.M.M.W., B.D.; Formal Analysis, E.T., C.C., D.J.B., M.M.M.W.; Investigation, E.T., M.M.M.W.; Data Curation, E.T., C.C., D.J.B., C.A.M.J., J.J.P.B.; Writing—Original Draft Preparation, M.M.M.W., B.D., E.A.M.V., E.T.; Writing—Review and Editing, E.A.M.V., E.T., M.M.M.W., B.D.; Visualization, E.T., E.A.M.V., M.M.M.W., C.C.; Supervision, M.M.M.W., B.D., E.A.M.V.; Funding Acquisition, E.A.M.V., M.M.M.W., B.D. All authors have read and agreed to the published version of the manuscript.

Funding

Part of this work was funded by the Proof-of-Concept fund of Amsterdam Neuroscience (PoC-2014-ND-06), the Marmont Foundation (UK) and the Health and Wellbeing Talent Fellowship (Nottingham Trent University).

Institutional Review Board Statement

The study was approved by the Animal Ethics Committee of the VU University (protocol code ANW 14-03, 10-7-2014).

Informed Consent Statement

Not applicable.

Data Availability Statement

The mass spectrometry proteomics data were deposited to the ProteomeXchange Consortium via the PRIDE partner repository with the dataset identifier “PXD030354”.

Acknowledgments

We thank Allert Jonker, John J.G.M. Bol and Osoul Chouchane of the department of Anatomy and Neurosciences for assisting in the processing of the mouse material.

Conflicts of Interest

The authors declare no conflict of interest.

References

  1. Selkoe, D.J. Amyloid Protein and Alzheimer’s Disease. Sci. Am. 1991, 5, 68–79. [Google Scholar] [CrossRef] [PubMed]
  2. Selkoe, D.J. The molecular pathology of Alzheimer’s disease. Neuron 1991, 6, 487–498. [Google Scholar] [CrossRef]
  3. Tian Hui Kwan, A.; Arfaie, S.; Therriault, J.; Rosa-Neto, P.; Gauthier, S. Lessons Learnt from the Second Generation of An-ti-Amyloid Monoclonal Antibodies Clinical Trials. Dement. Geriatr. Cogn. Disord. 2020, 49, 334–348. [Google Scholar] [CrossRef] [PubMed]
  4. Khan, A.; Corbett, A.; Ballard, C. Emerging treatments for Alzheimer’s disease for non-amyloid and non-tau targets. Expert Rev. Neurother. 2017, 17, 683–695. [Google Scholar] [CrossRef] [PubMed]
  5. Herrup, K.; Carrillo, M.C.; Schenk, D.; Cacace, A.; DeSanti, S.; Fremeau, R.; Bhat, R.; Glicksman, M.; May, P.; Swerdlow, R.; et al. Beyond amyloid: Getting real about nonamyloid targets in Alzheimer’s disease. Alzheimer’s Dement. 2013, 9, 452–458.e1. [Google Scholar] [CrossRef] [Green Version]
  6. Rahman, M.M.; Lendel, C. Extracellular protein components of amyloid plaques and their roles in Alzheimer’s disease pathology. Mol. Neurodegener. 2021, 16, 1–30. [Google Scholar] [CrossRef]
  7. Lorand, L.; Graham, R.M. Transglutaminases: Crosslinking enzymes with pleiotropic functions. Nat. Rev. Mol. Cell Biol. 2003, 4, 140–156. [Google Scholar] [CrossRef]
  8. Tatsukawa, H.; Hitomi, K. Role of Transglutaminase 2 in Cell Death, Survival, and Fibrosis. Cells 2021, 10, 1842. [Google Scholar] [CrossRef]
  9. Kim, S.Y.; Grant, P.; Lee, J.H.; Pant, H.C.; Steinert, P.M. Differential Expression of Multiple Transglutaminases in Human Brain. Increased Expression and Cross-Linking by Transglutaminases 1 and 2 in Alzheimer’s Disease. J. Biol. Chem. 1999, 274, 30715–30721. [Google Scholar] [CrossRef] [Green Version]
  10. Wilhelmus, M.M.; Grunberg, S.C.; Bol, J.G.; van Dam, A.M.; Hoozemans, J.J.; Rozemuller, A.J.; Drukarch, B. Transglu-taminases and Transglutaminase-Catalyzed Cross-Links Colocalize with the Pathological Lesions in Alzheimer’s Disease Brain. Brain Pathol. 2009, 19, 612–622. [Google Scholar] [CrossRef]
  11. Johnson, G.V.; Cox, T.M.; Lockhart, J.P.; Zinnerman, M.D.; Miller, M.L.; E Powers, R. Transglutaminase activity is increased in Alzheimer’s disease brain. Brain Res. 1997, 751, 323–329. [Google Scholar] [CrossRef]
  12. Bonelli, R.M.; Aschoff, A.; Niederwieser, G.; Heuberger, C.; Jirikowski, G. Cerebrospinal Fluid Tissue Transglutaminase as a Biochemical Marker for Alzheimer’s Disease. Neurobiol. Dis. 2002, 11, 106–110. [Google Scholar] [CrossRef] [PubMed] [Green Version]
  13. Nemes, Z.; Fesus, L.; Egerhazi, A.; Keszthelyi, A.; Degrell, I.M. N(Epsilon)(Gamma-Glutamyl)Lysine in Cerebrospinal Fluid Marks Alzheimer Type and Vascular Dementia. Neurobiol. Aging 2001, 22, 403–406. [Google Scholar] [CrossRef]
  14. Zhang, W.; Johnson, B.R.; Suri, D.E.; Martinez, J.; Bjornsson, T.D. Immunohistochemical demonstration of tissue transglutaminase in amyloid plaques. Acta Neuropathol. 1998, 96, 395–400. [Google Scholar] [CrossRef]
  15. Dudek, S.M.; Johnson, G.V.W. Transglutaminase Catalyzes the Formation of Sodium Dodecyl Sulfate-Insoluble, Alz-50-Reactive Polymers of τ? J. Neurochem. 1993, 61, 1159–1162. [Google Scholar] [CrossRef]
  16. Dudek, S.M.; Johnson, G.V. Transglutaminase Facilitates the Formation of Polymers of the Beta-Amyloid Peptide. Brain Res. 1994, 651, 129–133. [Google Scholar] [CrossRef]
  17. Schmid, A.W.; Condemi, E.; Tuchscherer, G.; Chiappe, D.; Mutter, M.; Vogel, H.; Moniatte, M.; Tsybin, Y. Tissue Transglutaminase-mediated Glutamine Deamidation of β-Amyloid Peptide Increases Peptide Solubility, Whereas Enzymatic Cross-linking and Peptide Fragmentation May Serve as Molecular Triggers for Rapid Peptide Aggregation. J. Biol. Chem. 2011, 286, 12172–12188. [Google Scholar] [CrossRef] [Green Version]
  18. Wilhelmus, M.M.; Otte-Holler, I.; van Triel, J.J.; Veerhuis, R.; Maat-Schieman, M.L.; Bu, G.; de Waal, R.M.; Verbeek, M.M. Lipoprotein Receptor-Related Protein-1 Mediates Amyloid-Beta-Mediated Cell Death of Cerebrovascular Cells. Am. J. Pathol. 2007, 171, 1989–1999. [Google Scholar] [CrossRef] [Green Version]
  19. Wilhelmus, M.M.M.; Jongenelen, C.A.; Bol, J.G.J.M.; Drukarch, B. Interaction between Tissue Transglutaminase and Am-yloid-Beta: Protein- Protein Binding versus Enzymatic Crosslinking. Anal. Biochem. 2020, 592, 113578. [Google Scholar] [CrossRef]
  20. Hartley, D.M.; Zhao, C.; Speier, A.C.; Woodard, G.A.; Li, S.; Li, Z.; Walz, T. Transglutaminase Induces Protofibril-like Am-yloid Beta-Protein Assemblies That Are Protease-Resistant and Inhibit Long-Term Potentiation. J. Biol. Chem. 2008, 283, 16790–16800. [Google Scholar] [CrossRef] [Green Version]
  21. de Jager, M.; Drukarch, B.; Hofstee, M.; Breve, J.; Jongenelen, C.A.; Bol, J.G.; Wilhelmus, M.M. Tissue Transglutami-nase-Catalysed Cross-Linking Induces Apolipoprotein E Multimers Inhibiting Apolipoprotein E’s Protective Effects towards Amyloid-Beta-Induced Toxicity. J. Neurochem. 2015, 134, 1116–1128. [Google Scholar] [CrossRef]
  22. de Jager, M.; van der Wildt, B.; Schul, E.; Bol, J.G.; van Duinen, S.G.; Drukarch, B.; Wilhelmus, M.M. Tissue Transglutaminase Colocalizes with Extracellular Matrix Proteins in Cerebral Amyloid Angiopathy. Neurobiol. Aging 2013, 34, 1159–1169. [Google Scholar] [CrossRef] [Green Version]
  23. Boros, S.; Ahrman, E.; Wunderink, L.; Kamps, B.; de Jong, W.W.; Boelens, W.C.; Emanuelsson, C.S. Site-Specific Transami-dation and Deamidation of the Small Heat-Shock Protein Hsp20 by Tissue Transglutaminase. Proteins 2006, 62, 1044–1052. [Google Scholar] [CrossRef] [PubMed]
  24. Furini, G.; Schroeder, N.; Huang, L.; Boocock, D.; Scarpellini, A.; Coveney, C.; Tonoli, E.; Ramaswamy, R.; Ball, G.; Verderio, C.; et al. Proteomic Profiling Reveals the Transglutaminase-2 Externalization Pathway in Kidneys after Unilateral Ureteric Obstruction. J. Am. Soc. Nephrol. 2018, 29, 880–905. [Google Scholar] [CrossRef] [PubMed] [Green Version]
  25. Altuntas, S.; Rossin, F.; Marsella, C.; D’Eletto, M.; Diaz-Hidalgo, L.; Farrace, M.G.; Campanella, M.; Antonioli, M.; Fimia, G.M.; Piacentini, M. The transglutaminase type 2 and pyruvate kinase isoenzyme M2 interplay in autophagy regulation. Oncotarget 2015, 6, 44941–44954. [Google Scholar] [CrossRef] [PubMed]
  26. Wilhelmus, M.M.M.; De Jager, M.; Smit, A.B.; Van Der Loo, R.J.; Drukarch, B. Catalytically active tissue transglutaminase colocalises with Aβ pathology in Alzheimer’s disease mouse models. Sci. Rep. 2016, 6, 20569. [Google Scholar] [CrossRef] [PubMed] [Green Version]
  27. Sturchler-Pierrat, C.; Abramowski, D.; Duke, M.; Wiederhold, K.-H.; Mistl, C.; Rothacher, S.; Ledermann, B.; Bürki, K.; Frey, P.; Paganetti, P.; et al. Two amyloid precursor protein transgenic mouse models with Alzheimer disease-like pathology. Proc. Natl. Acad. Sci. USA 1997, 94, 13287–13292. [Google Scholar] [CrossRef] [PubMed] [Green Version]
  28. De Laurenzi, V.; Melino, G. Gene Disruption of Tissue Transglutaminase. Mol. Cell Biol. 2001, 21, 148–155. [Google Scholar] [CrossRef] [Green Version]
  29. Wilhelmus, M.M.M.; Otte-Holler, I.; Wesseling, P.; De Waal, R.M.W.; Boelens, W.C.; Verbeek, M.M. Specific association of small heat shock proteins with the pathological hallmarks of Alzheimer’s disease brains. Neuropathol. Appl. Neurobiol. 2006, 32, 119–130. [Google Scholar] [CrossRef]
  30. Van Dam, D.; D’Hooge, R.; Staufenbiel, M.; Van Ginneken, C.; Van Meir, F.; De Deyn, P.P. Age-Dependent Cognitive Decline in the APP23 Model Precedes Amyloid Deposition. Eur. J. Neurosci. 2003, 17, 388–396. [Google Scholar] [CrossRef]
  31. Hepp, D.H.; Vergoossen, D.L.E.; Huisman, E.; Lemstra, A.W.; Bank, N.B.; Berendse, H.W.; Rozemuller, A.J.; Foncke, E.M.; van de Berg, W. Distribution and Load of Amyloid-β Pathology in Parkinson Disease and Dementia with Lewy Bodies. J. Neuropathol. Exp. Neurol. 2016, 75, 936–945. [Google Scholar] [CrossRef] [PubMed]
  32. Burhan, I.; Furini, G.; Lortat-Jacob, H.; Atobatele, A.G.; Scarpellini, A.; Schroeder, N.; Atkinson, J.; Maamra, M.; Nutter, F.H.; Watson, P.; et al. Interplay between transglutaminases and heparan sulphate in progressive renal scarring. Sci. Rep. 2016, 6, 31343. [Google Scholar] [CrossRef] [PubMed] [Green Version]
  33. Gillet, L.C.; Navarro, P.; Tate, S.; Röst, H.; Selevsek, N.; Reiter, L.; Bonner, R.; Aebersold, R. Targeted Data Extraction of the MS/MS Spectra Generated by Data-Independent Acquisition: A New Concept for Consistent and Accurate Proteome Analysis. Mol. Cell. Proteom. 2012, 11, O111.016717. [Google Scholar] [CrossRef] [PubMed] [Green Version]
  34. Cheadle, C.; Vawter, M.P.; Freed, W.J.; Becker, K.G. Analysis of Microarray Data Using Z Score Transformation. J. Mol. Diagn. 2003, 5, 73–81. [Google Scholar] [CrossRef] [Green Version]
  35. Battaglia, G.; Farrace, M.G.; Mastroberardino, P.G.; Viti, I.; Fimia, G.M.; Van, B.J.; Devreese, B.; Melino, G.; Molinaro, G.; Busceti, C.L.; et al. Transglutaminase 2 Ablation Leads to Defective Function of Mito-chondrial Respiratory Complex I Affecting Neuronal Vulnerability in Experimental Models of Extrapyramidal Disorders. J. Neurochem. 2007, 100, 36–49. [Google Scholar] [CrossRef]
  36. Wang, W.; Zhao, F.; Ma, X.; Perry, G.; Zhu, X. Mitochondria dysfunction in the pathogenesis of Alzheimer’s disease: Recent advances. Mol. Neurodegener. 2020, 15, 1–22. [Google Scholar] [CrossRef]
  37. Guerreiro, N.; Staufenbiel, M.; Gomez-Mancilla, B. Proteomic 2-D DIGE Profiling of APP23 Transgenic Mice Brain from Pre-plaque and Plaque Phenotypes. J. Alzheimer’s Dis. 2008, 13, 17–30. [Google Scholar] [CrossRef]
  38. Hartl, D.; Rohe, M.; Mao, L.; Staufenbiel, M.; Zabel, C.; Klose, J. Impairment of Adolescent Hippocampal Plasticity in a Mouse Model for Alzheimer’s Disease Precedes Disease Phenotype. PLoS ONE 2008, 3, e2759. [Google Scholar] [CrossRef] [Green Version]
  39. Wilhelmus, M.M.; de Jager, M.; Bakker, E.N.; Drukarch, B. Tissue Transglutaminase in Alzheimer’s Disease: Involvement in Pathogenesis and its Potential as a Therapeutic Target. J. Alzheimer’s Dis. 2014, 42, S289–S303. [Google Scholar] [CrossRef]
  40. Janssen, L.; Keppens, C.; De Deyn, P.P.; Van Dam, D. Late age increase in soluble amyloid-beta levels in the APP23 mouse model despite steady-state levels of amyloid-beta-producing proteins. Biochim. et Biophys. Acta (BBA)—Mol. Basis Dis. 2016, 1862, 105–112. [Google Scholar] [CrossRef] [Green Version]
  41. Lee, C.S.; Park, H.H. Structural aspects of transglutaminase 2: Functional, structural, and regulatory diversity. Apoptosis 2017, 22, 1057–1068. [Google Scholar] [CrossRef] [PubMed]
  42. Wang, R.; Reddy, P.H. Role of Glutamate and NMDA Receptors in Alzheimer’s Disease. J. Alzheimer’s Dis. 2017, 57, 1041–1048. [Google Scholar] [CrossRef] [PubMed] [Green Version]
  43. Gu, Q.; Cuevas, E.; Raymick, J.; Kanungo, J.; Sarkar, S. Downregulation of 14-3-3 Proteins in Alzheimer’s Disease. Mol. Neurobiol. 2020, 57, 32–40. [Google Scholar] [CrossRef] [PubMed]
  44. Wilhelmus, M.M.; Boelens, W.C.; Otte-Holler, I.; Kamps, B.; de Waal, R.M.; Verbeek, M.M. Small Heat Shock Proteins Inhibit Amyloid-Beta Protein Aggregation and Cerebrovascular Amyloid-Beta Protein Toxicity. Brain Res. 2006, 1089, 67–78. [Google Scholar] [CrossRef]
  45. Groenen, P.J.; Bloemendal, H.; de Jong, W.W. The Carboxy-Terminal Lysine of Alpha B-Crystallin Is an Amine-Donor Sub-strate for Tissue Transglutaminase. Eur. J. Biochem. 1992, 205, 671–674. [Google Scholar] [CrossRef]
  46. Mishra, S.; Murphy, L.J. Phosphorylation of transglutaminase 2 by PKA at Ser216 creates 14-3-3 binding sites. Biochem. Biophys. Res. Commun. 2006, 347, 1166–1170. [Google Scholar] [CrossRef]
  47. D’Eletto, M.; Farrace, M.G.; Falasca, L.; Reali, V.; Oliverio, S.; Melino, G.; Griffin, M.; Fimia, G.M.; Piacentini, M. Transglu-taminase 2 Is Involved in Autophagosome Maturation. Autophagy 2009, 5, 1145–1154. [Google Scholar] [CrossRef]
  48. Maksimiuk, M.; Sobiborowicz, A.; Tuzimek, A.; Deptała, A.; Czerw, A.; Badowska-Kozakiewicz, A.M. AB-Crystallin as a Promising Target in Pathological Conditions – A Review. Ann. Agric. Environ. Med. 2020, 27, 326–334. [Google Scholar] [CrossRef]
  49. Yamazaki, Y.; Zhao, N.; Caulfield, T.R.; Liu, C.-C.; Bu, G. Apolipoprotein E and Alzheimer Disease: Pathobiology and Tar-geting Strategies. Nat. Rev. Neurol. 2019, 15, 501–518. [Google Scholar] [CrossRef]
  50. Wilhelmus, M.M.; Otte-Holler, I.; Davis, J.; Van Nostrand, W.E.; de Waal, R.M.; Verbeek, M.M. Apolipoprotein E Genotype Regulates Amyloid-Beta Cytotoxicity. J. Neurosci. 2005, 25, 3621–3627. [Google Scholar] [CrossRef]
  51. Leshchyns’Ka, I.; Sytnyk, V. Synaptic Cell Adhesion Molecules in Alzheimer’s Disease. Neural Plast. 2016, 2016, 1–9. [Google Scholar] [CrossRef] [PubMed] [Green Version]
  52. Eckert, R.L.; Kaartinen, M.; Nurminskaya, M.; Belkin, A.M.; Colak, G.; Johnson, G.V.; Mehta, K. Transglutaminase regulation of cell function. Physiol. Rev. 2014, 94, 383–417. [Google Scholar] [CrossRef] [PubMed] [Green Version]
  53. Yunes-Medina, L.; Paciorkowski, A.; Nuzbrokh, Y.; Johnson, G.V.W. Depletion of transglutaminase 2 in neurons alters ex-pression of extracellular matrix and signal transduction genes and compromises cell viability. Mol. Cell. Neurosci. 2018, 86, 72–80. [Google Scholar] [CrossRef] [PubMed]
  54. Furini, G.; Verderio, E.A. Spotlight on the Transglutaminase 2-Heparan Sulfate Interaction. Med. Sci. 2019, 7, 5. [Google Scholar] [CrossRef] [Green Version]
  55. Ovsepian, S.V.; Leary, V.B.O.; Zaborszky, L.; Ntziachristos, V.; Dolly, J.O. Synaptic Vesicle Cycle and Amyloid B: Biting the Hand That Feeds. Alzheimers Dement. 2018, 14, 502–513. [Google Scholar] [CrossRef]
  56. Facchiano, F.; Benfenati, F.; Valtorta, F.; Luini, A. Covalent modification of synapsin I by a tetanus toxin-activated transglutaminase. J. Biol. Chem. 1993, 268, 4588–4591. [Google Scholar] [CrossRef]
  57. Zhang, J.; Grosso Jasutkar, H.; Yan, R.; Woo, J.-M.; Lee, K.-W.; Im, J.-Y.; Junn, E.; Iismaa, S.E.; Mouradian, M.M. Transglu-taminase 2 Depletion Attenuates α-Synuclein Mediated Toxicity in Mice. Neuroscience 2020, 441, 58–64. [Google Scholar] [CrossRef]
  58. Lai, T.-S.; Lin, C.-J.; Wu, Y.-T.; Wu, C.-J. Tissue transglutaminase TG2 and mitochondrial function and dysfunction. Front. Biosci. 2017, 22, 1114–1137. [Google Scholar] [CrossRef] [Green Version]
  59. Zhuo, M.; Hu, Y.; Schultz, C.; Kandel, E.R.; Hawkins, R.D. Role of Guanylyl Cyclase and CGMP-Dependent Protein Kinase in Long-Term Potentiation. Nature 1994, 368, 635–639. [Google Scholar] [CrossRef]
  60. Monfort, P.; Muñoz, M.-D.; Kosenko, E.; Felipo, V. Long-Term Potentiation in Hippocampus Involves Sequential Activation of Soluble Guanylate Cyclase, cGMP-Dependent Protein Kinase, and cGMP-Degrading Phosphodiesterase. J. Neurosci. 2002, 22, 10116–10122. [Google Scholar] [CrossRef]
Figure 1. Distribution and quantification of Aβ deposits in APP23, APP23/TG2−/−, WT and WT/TG2−/− mice brain. (A) TGM2 mRNA levels were determined in brain homogenates of APP23, APP23/TG2−/−, WT and WT/TG2−/− mice. In APP23 (n = 9) and WT (n = 6) mice, TGM2 mRNA was observed, whereas TGM2 mRNA was absent in WT/TG2−/− (n = 3) and APP23/TG2−/− (n = 9) mice. (B) Analysis of Aβ deposits in post mortem cryo-fixed brain tissue of APP23 mice demonstrated different types of Aβ deposits, i.e., senile plaques (arrow), small dense plaques (arrow, asterisk), large diffuse anti-Aβ antibody immunoreactive areas (arrow, double asterisk) and vascular amyloid deposits (arrow, triple asterisk). (C) The number of Aβ lesions was quantified in whole brain sections. No anti-Aβ antibody immunoreactive deposits were found in WT or WT/TG2−/− mice. No significant difference in the number of various anti-Aβ antibody immunoreactive deposits between APP23 and APP23/TG2−/− mice was observed. (D) The percentage of anti-Aβ antibody immunoreactivity was analyzed as a percentage of total brain surface area. In both WT and WT/TG2−/− mice, Aβ deposits were absent. No significant difference was found as a percentage of anti-Aβ antibody immunoreactivity in brain surface area between APP23 and APP23/TG2−/−. Scale bar: (B) 60 μm. Standard error of the mean is shown. Abbreviations: TG2 = transglutaminase-2, WT = wild type, Aβ = amyloid-beta, TGM2 = transglutaminase-2 coding gene.
Cells 11 00389 g001
Figure 2. Analysis of mRNA of human APP, mouse TGM1, TGM3, TGM6 and FXIIIA, and soluble brain Aβ1–40 and Aβ1–42 levels, and Aβ40/42 ratio in mouse brain homogenates. (AD) Levels of mRNA of APP, TGM1, TGM3 and FXIIIA were analyzed in mouse brain homogenates of WT, WT/TG2−/− APP23 and APP23/TG2−/−. (A) No significant difference in human APP mRNA levels were found between APP23 and APP23/TG2−/− mice. No human APP mRNA was observed in both WT and TG2−/− mice. No significant increase in mRNA levels between APP23 or WT mice and APP23/TG2−/− and TG2−/−, respectively, for TGM1 (B), TGM3 (C), and FXIIIA (D) was found. For TGM3, a significant increase (* p = 0.03) was observed between APP23 and APP23/TG2−/− mice (C). (EG) Soluble human Aβ1–40, Aβ1–42 and Aβ1–40/Aβ1–42 ratio were analyzed in mouse brain homogenates. No significant difference in both soluble brain Aβ1–40 and Aβ1–42 levels were found in APP23/TG2−/− mice compared to APP23 mice (E,F). No significant difference in soluble brain Aβ1–40/Aβ1–42 ratio was found between APP23 and APP23/TG2−/− mice (G). Standard error of the mean is shown. Abbreviations: TG2 = transglutaminase-2, TGM1 = transglutaminase-1 coding gene, TGM3 = transglutaminase-3 coding gene, APP = amyloid-beta precursor protein coding gene, FXIIIa = factor 13a, Aβ = amyloid-beta.
Cells 11 00389 g002
Figure 3. Analysis of TG2 interactome and total proteome in mouse brain by comparative proteomics. (A) Workflow describing the approach used for the isolation of TG2-interacting proteins. TG2 was immunoprecipitated from total homogenates obtained from WT, APP23, WT/TG2−/− and APP23/TG2−/− brains (with TG2−/− cohorts used as negative controls) using magnetic beads crosslinked with a mouse monoclonal anti-TG2 antibody (IA12). TG2 co-immunoprecipitated proteins (TG2-IP) were trypsin digested on beads and analyzed by SWATH MS. SWATH quantitative data were extracted using a spectral library produced by shotgun/data dependent acquisition (DDA/IDA) MS on all TG2-IP samples and total brain lysates. The TG2 interactome was generated via evaluation of differences between TG2+/+ and TG2−/− precipitated proteins (background) by using a paired sample z-test. (B) Sample size (n) used in the study. (C) TG2 was immunoprecipitated from a mouse brain total lysate (WT) by Pierce Crosslink Magnetic IP/Co-IP Kit as described in the Methods, using either mouse monoclonal anti TG2 (IA12) or rabbit polyclonal anti-TG2 (Ab421) antibodies. TG2-IP samples were separated by reducing SDS-PAGE (10% w/v) and subjected to Western blot for TG2 using IA12 antibody. Black triangle denotes TG2. The brain total lysate (input, TL) from a WT mouse was used as loading control (50 μg). (D) Total cell lysates from WT and WT/TG2−/− mouse primary astrocytes were subjected to WB and probed with IA12 antibody (10 μg).
Cells 11 00389 g003
Figure 4. Analysis of TG2-associated proteins in brain reveals an increase in TG2 partners in APP23 animals compared to WT. (A) Number of proteins identified by comparative proteomics as specifically associated with TG2 in APP23 and WT brains by z-test (p ≤ 0.05; n = 5), using the workflow shown in Figure 3A,B. (B) Pie charts display the distribution of the enriched pathways of TG2-associated proteins in WT (53 enriched pathways) and APP23 (263 enriched pathways) according to METACORE “pathway maps” analysis, manually grouped in macro-categories. The area of each slice is proportional to the number of enriched pathways it comprises. TG2 partners which were in common between WT and APP23 were not included in this analysis. (C,D) The protein interaction network built from TG2-associated proteins in WT (C) and APP23 (D) was mapped against the M. musculus reference database using String V11.0 (http://stringdb.org, 4 May 2021). The map was built by considering both known and predicted protein interactions with the default threshold confidence level of 0.4. The thickness of the lines is proportional to the confidence of the interactions.
Cells 11 00389 g004
Figure 5. TG2-interacting proteins localized in the extracellular space and cell–matrix interface. (A) TG2 interactors in WT and APP23 exclusively localized at the plasma membrane and extracellular space according to PANTHER analysis (GO database Cellular Component-Complete). Proteins are listed in order of significance of their association with TG2 (Log10 p-value, z-test). (B) TG2 partners in WT and APP23 localized at the cell–matrix interface according to PANTHER analysis. Red asterisks indicate proteins linked to amyloid β. The red arrow indicates APOE. (C) Chart visualizing the TG2 interactome in WT and APP23 brain, including only proteins localized extracellularly or at the cell–matrix interface, with highlight of enriched GO molecular functions according to PANTHER analysis (GO database Molecular Function-Complete). Immunoglobulins were manually removed from these analyses.
Cells 11 00389 g005
Figure 6. Analysis of brain proteome reveals significant changes between WT and APP23, and the effect of TG2 knock-out on protein expression. (AD) Heat maps of each comparison (confidence ≥ 55%). The red asterisks in (B) indicate proteins changed in expression level in APP23 compared to WT, which are also dependent on TG2 expression (change in APP23 reversed in APP23/TG2−/− proteome as shown in (A)). The blue delta (Δ) indicates which of these APP23-linked TG2-expression-dependent proteins are also TG2 interactors (with reference to Figure 4). Each row maximum value is depicted in red and minimum value in blue, with intermediate values indicated with shades in between.
Cells 11 00389 g006
Table 1. Proteins significantly interacting with TG2 in the extracellular space and plasma membrane, in the WT brain, APP23 brain or both phenotypes.
IDTG2-Interactor Namep-ValuePhenotype
TENRTenascin-R 1.5 × 10⁻⁴WT
PTPRDReceptor-type tyrosine-protein phosphatase delta 3.1 × 10⁻³WT
RSU1Ras suppressor protein 1 4.7 × 10⁻³WT
CAD12Cadherin-12 6.4 × 10⁻³WT
NRCAMNeuronal cell adhesion molecule 9.6 × 10⁻³WT
S12A5Solute carrier family 12 member 5 1.9 × 10⁻²WT
SCN9ASodium channel protein type 9 subunit alpha 3.8 × 10⁻²WT
SC6A1Sodium- and chloride-dependent GABA transporter 1 2.9 × 10⁻²/8.0 × 10−3WT/APP23
L1CAMNeural cell adhesion molecule L1 3.2 × 10⁻²/2.4 × 10−2WT/APP23
HEMOHemopexin 4.5 × 10⁻²/2.8 × 10−4WT/APP23
PGCBBrevican core protein 1.0 × 10⁻⁵APP23
GRID2Glutamate receptor ionotropic, delta-2 1.0 × 10⁻⁵APP23
CA2D2Voltage-dependent calcium channel subunit alpha-2/delta-2 1.8 × 10⁻⁴APP23
SCG2Secretogranin-2 1.6 × 10⁻³APP23
AT2B1Plasma membrane calcium-transporting ATPase 1 3.2 × 10⁻³APP23
SEM3CSemaphorin-3C 4.6 × 10⁻³APP23
NRX2ANeurexin-2 6.0 × 10⁻³APP23
GPM6ANeuronal membrane glycoprotein M6-a 1.5 × 10⁻²APP23
MYPRMyelin proteolipid protein 1.6 × 10⁻²APP23
PLXB2Plexin-B2 2.4 × 10⁻²APP23
GRM3Metabotropic glutamate receptor 3 5.5 × 10⁻²APP23
The specificity of association with TG2 was evaluated by z-test analysis (p ≤ 0.05) of n = 5 animals per cohort, using the TG2−/− mice as background control (as shown in Figure 3A,B). Proteins are denoted by UniProtKB protein entry name (ID) and full name, and they are listed according to the specificity of the interaction with TG2 (p-value). WT, TG2-associated proteins in WT brain; WT/APP23, TG2-associated proteins in both WT and APP23 brain; APP23, TG2-associated proteins in APP23 brain.
Table 2. Proteins significantly interacting with TG2 at the cell–matrix interface, in the WT brain, the APP23 brain or both phenotypes.
IDTG2-Interactor Namep-ValuePhenotype
HSP72Heat shock-related 70 kDa protein 2 2.4 × 10⁻¹⁵WT
ANK1Ankyrin-1 4.7 × 10⁻¹⁴WT
FIBGFibrinogen gamma chain 1.0 × 10⁻¹¹WT
TNIKTraf2 and NCK-interacting protein kinase 1.5 × 10⁻⁷WT
SRC8Src substrate cortactin 9.4 × 10⁻⁷WT
LRP1Prolow-density lipoprotein receptor-related protein 1 2.3 × 10⁻⁶WT
CYLDUbiquitin carboxyl-terminal hydrolase CYLD 2.9 × 10⁻⁶WT
CPNE5Copine-5 4.8 × 10⁻⁶WT
ENPLEndoplasmin 6.6 × 10⁻⁶WT
CFAHComplement factor H 2.5 × 10⁻⁵WT
ASTN1Astrotactin-1 2.6 × 10⁻⁵WT
ACBG1Long-chain-fatty-acid—CoA ligase ACSBG1 6.9 × 10⁻⁵WT
FASFatty acid synthase 4.2 × 10⁻⁴WT
VATC1V-type proton ATPase subunit C 1 5.3 × 10⁻⁴WT
IDEInsulin-degrading enzyme 6.8 × 10⁻⁴WT
K2C1Keratin, type II cytoskeletal 1 2.9 × 10⁻³WT
SPB6Serpin B6 3.5 × 10⁻³WT
ADA10Disintegrin and metalloproteinase domain-containing protein 10 4.2 × 10⁻³WT
INP4AType I inositol 3,4-bisphosphate 4-phosphatase 6.9 × 10⁻³WT
CYTCCystatin-C 7.7 × 10⁻³WT
PICALPhosphatidylinositol-binding clathrin assembly protein 7.8 × 10⁻³WT
HYEPEpoxide hydrolase 1 8.8 × 10⁻³WT
PDIA3Protein disulfide-isomerase A3 1.0 × 10⁻²WT
L2GL1Lethal(2) giant larvae protein homolog 1 1.0 × 10⁻²WT
CUL5Cullin-5 1.1 × 10⁻²WT
HEXBBeta-hexosaminidase subunit beta 1.5 × 10⁻²WT
CKAP5Cytoskeleton-associated protein 5 1.5 × 10⁻²WT
MSRAMitochondrial peptide methionine sulfoxide reductase 1.6 × 10⁻²WT
APBB1Amyloid-beta A4 precursor protein-binding family B member 1 2.0 × 10⁻²WT
OGT1UDP-N-acetylglucosamine—peptide N-acetylglucosaminyltransferase 110 kDa subunit 2.0 × 10⁻²WT
ARBK1Beta-adrenergic receptor kinase 1 2.4 × 10⁻²WT
ABRActive breakpoint cluster region-related protein 2.5 × 10⁻²WT
RAB21Ras-related protein Rab-21 2.6 × 10⁻²WT
RHEBGTP-binding protein Rheb 2.7 × 10⁻²WT
ITPR1Inositol 1,4,5-trisphosphate receptor type 1 2.7 × 10⁻²WT
WASF1Wiskott-Aldrich syndrome protein family member 1 2.8 × 10⁻²WT
GARSGlycine—tRNA ligase 3.5 × 10⁻²WT
RACK1Receptor of activated protein C kinase 1 3.5 × 10⁻²WT
ACLYATP-citrate synthase 3.7 × 10⁻²WT
SNAAAlpha-soluble NSF attachment protein 3.8 × 10⁻²WT
ATP5JATP synthase-coupling factor 6, mitochondrial 4.0 × 10⁻²WT
E41L3Band 4.1-like protein 3 4.0 × 10⁻²WT
SOGA3Protein SOGA34.4 × 10−2WT
ALDRAldose reductase 4.6 × 10⁻²WT
LYNX1Ly-6/neurotoxin-like protein 1 4.8 × 10⁻²WT
DAAM1Disheveled-associated activator of morphogenesis 1 5.1 × 10⁻¹²/1.1 × 10−4WT/APP23
PLAPPhospholipase A-2-activating protein 3.2 × 10⁻⁶/2.6 × 10−3WT/APP23
APOEApolipoprotein E 3.5 × 10⁻⁵/4.3 × 10−8WT/APP23
RIN1Ras and Rab interactor 1 1.3 × 10⁻³/2.9 × 10−3WT/APP23
RIF1Telomere-associated protein RIF1 9.7 × 10⁻³/2.8 × 10−2WT/APP23
NDRG1Protein NDRG1 1.9 × 10⁻²/1.0 × 10−16WT/APP23
SYT2Synaptotagmin-2 4.2 × 10⁻²/5.0 × 10−2WT/APP23
ALBUSerum albumin 5.5 × 10⁻²/2.8 × 10−9WT/APP23
KCRBCreatine kinase B-type 1.0 × 10⁻¹⁶APP23
CRYABAlpha-crystallin B chain 1.0 × 10⁻¹⁶APP23
1433F14-3-3 protein eta 1.0 × 10⁻¹⁶APP23
LANC2LanC-like protein 2 2.4 × 10⁻¹⁵APP23
GDIR1Rho GDP-dissociation inhibitor 1 6.8 × 10⁻¹²APP23
NRX1ANeurexin-1 2.1 × 10⁻¹¹APP23
CAPS1Calcium-dependent secretion activator 1 3.7 × 10⁻¹¹APP23
VATAV-type proton ATPase catalytic subunit A 1.4 × 10⁻⁹APP23
EF1A1Elongation factor 1-alpha 1 3.5 × 10⁻⁸APP23
MBPMyelin basic protein 3.7 × 10⁻⁸APP23
CADM2Cell adhesion molecule 2 1.7 × 10⁻⁶APP23
PCAT1Lysophosphatidylcholine acyltransferase 1 2.3 × 10⁻⁶APP23
NPTX1Neuronal pentraxin-1 4.0 × 10⁻⁶APP23
LYRICProtein LYRIC 4.0 × 10⁻⁶APP23
PP4P1Type 1 phosphatidylinositol 4,5-bisphosphate 4-phosphatase 5.7 × 10⁻⁶APP23
CAH2Carbonic anhydrase 2 7.4 × 10⁻⁶APP23
ATPAATP synthase subunit alpha, mitochondrial 1.3 × 10⁻⁵APP23
LSAMPLimbic system-associated membrane protein 1.8 × 10⁻⁵APP23
GLNAGlutamine synthetase 2.4 × 10⁻⁵APP23
SNP25Synaptosomal-associated protein 25 3.6 × 10⁻⁵APP23
PDIA6Protein disulfide-isomerase A6 5.1 × 10⁻⁵APP23
HS71AHeat shock 70 kDa protein 1A 8.7 × 10⁻⁵APP23
OCRLInositol polyphosphate 5-phosphatase OCRL-19.2 × 10⁻⁵APP23
KPCBProtein kinase C beta type 1.0 × 10⁻⁴APP23
VINCVinculin 1.1 × 10⁻⁴APP23
AT1B2Sodium/potassium-transporting ATPase subunit beta-2 1.3 × 10⁻⁴APP23
GNAOGuanine nucleotide-binding protein G(o) subunit alpha 1.4 × 10⁻⁴APP23
MYH10Myosin-10 2.5 × 10⁻⁴APP23
CDK5Cyclin-dependent-like kinase 5 3.0 × 10⁻⁴APP23
KCNC3Potassium voltage-gated channel subfamily C member 3 3.1 × 10⁻⁴APP23
NCKP1Nck-associated protein 1 6.6 × 10⁻⁴APP23
S10ADProtein S100-A13 8.5 × 10⁻⁴APP23
RAB3ARas-related protein Rab-3A 9.6 × 10⁻⁴APP23
ADPRH[Protein ADP-ribosylarginine] hydrolase 1.1 × 10⁻³APP23
DYN1Dynamin-1 1.4 × 10⁻³APP23
SYT1Synaptotagmin-1 1.7 × 10⁻³APP23
PPP5Serine/threonine-protein phosphatase 5 2.3 × 10⁻³APP23
ENAHProtein enabled homolog 2.4 × 10⁻³APP23
RAP2BRas-related protein Rap-2b 3.2 × 10⁻³APP23
KPCGProtein kinase C gamma type 3.4 × 10⁻³APP23
SH3G1Endophilin-A2 3.5 × 10⁻³APP23
MK03Mitogen-activated protein kinase 3 4.2 × 10⁻³APP23
PGK1Phosphoglycerate kinase 1 4.6 × 10⁻³APP23
GNAZGuanine nucleotide-binding protein G(z) subunit alpha 5.2 × 10⁻³APP23
ANXA5Annexin A5 6.8 × 10⁻³APP23
GNB5Guanine nucleotide-binding protein subunit beta-5 9.6 × 10⁻³APP23
E41L1Band 4.1-like protein 1 1.1 × 10⁻²APP23
UCHL1Ubiquitin carboxyl-terminal hydrolase isozyme L1 1.1 × 10⁻²APP23
VATB2V-type proton ATPase subunit B, brain isoform 1.2 × 10⁻²APP23
GNAI2Guanine nucleotide-binding protein G(i) subunit alpha-2 1.2 × 10⁻²APP23
CAP2Adenylyl cyclase-associated protein 2 1.2 × 10⁻²APP23
DPYL2Dihydropyrimidinase-related protein 2 1.5 × 10⁻²APP23
RAB14Ras-related protein Rab-14 1.5 × 10⁻²APP23
PP2BASerine/threonine-protein phosphatase 2B catalytic subunit alpha isoform 1.7 × 10⁻²APP23
HCN1Potassium/sodium hyperpolarization-activated cyclic nucleotide-gated channel 1 1.8 × 10⁻²APP23
PRAF3PRA1 family protein 3 1.8 × 10⁻²APP23
SPTN1Spectrin alpha chain, non-erythrocytic 1 2.0 × 10⁻²APP23
GRIA2Glutamate receptor 2 3.3 × 10⁻²APP23
SAHH2S-adenosylhomocysteine hydrolase-like protein 1 3.8 × 10⁻²APP23
COR1CCoronin-1C 4.2 × 10⁻²APP23
ENOGGamma-enolase 4.3 × 10⁻²APP23
AT1A1Sodium/potassium-transporting ATPase subunit alpha-1 4.7 × 10⁻²APP23
NSF1CNSFL1 cofactor p47 5.0 × 10⁻²APP23
The specificity of association with TG2 was evaluated as explained in Table 1. WT, TG2-associated proteins in WT brain; WT/APP23, TG2-associated proteins in both WT and APP23 brain; APP23, TG2-associated proteins in APP23 brain.
Table 3. Proteins changed in APP23 compared to WT proteome. Positive log2FC indicates upregulated proteins; negative log2FC indicates downregulated proteins.
IDNamelog2FC
(APP23/WT)
Confidence
ELAV4ELAV-like protein 43.930.55
TBCELTubulin-specific chaperone cofactor E-like protein2.840.56
ATP5IATP synthase subunit e, mitochondrial2.560.60
GCYB1Guanylate cyclase soluble subunit beta-12.470.71
SNX4Sorting nexin-42.340.58
PSMD326S proteasome non-ATPase regulatory subunit 31.310.68
A4Amyloid beta A4 protein1.180.78
CPLX2Complexin-21.090.58
CPLX1Complexin-11.080.63
RAB1BRas-related protein Rab-1B1.030.70
BAG3BAG family molecular chaperone regulator 30.910.55
CAH8Carbonic anhydrase-related protein0.760.67
HBB1Hemoglobin subunit beta-10.700.56
ABHGAProtein ABHD16A0.600.65
CAZA2F-actin-capping protein subunit alpha-20.570.65
PRVAParvalbumin alpha0.470.68
NFHNeurofilament heavy polypeptide0.470.67
HNRPUHeterogeneous nuclear ribonucleoprotein U0.410.55
OCAD2OCIA domain-containing protein 20.380.63
L1CAMNeural cell adhesion molecule L10.370.60
FA49BProtein FAM49B0.330.66
IPP2Protein phosphatase inhibitor 20.330.63
GNAZGuanine nucleotide-binding protein G(z) subunit alpha0.320.56
S4A4Electrogenic sodium bicarbonate cotransporter 10.280.56
NEUGNeurogranin0.280.55
CANB1Calcineurin subunit B type 10.270.55
NAC2Sodium/calcium exchanger 2−0.480.81
MP2K1Dual specificity mitogen-activated protein kinase kinase 1−0.490.57
NPTXRNeuronal pentraxin receptor−0.530.55
PC4L1Purkinje cell protein 4-like protein 1−0.540.82
Proteins changed at confidence ≥ 55% are listed according to log2(FC) level. APP23/WT ratio expressed as log2FC (log2(APP23/WT)) is here shown.
Table 4. Proteins changed in APP23 compared to APP23/TG2−/− proteome. Positive log2FC indicates upregulated proteins; negative log2FC indicates downregulated proteins.
IDNamelog2FC
(APP23/APP23 TG2−/−)
Confidence
UCHL1Ubiquitin carboxyl-terminal hydrolase isozyme L16.020.58
MATR3Matrin-33.320.57
MDHCMalate dehydrogenase, cytoplasmic1.780.55
MAAIMaleylacetoacetate isomerase1.590.70
CPLX2Complexin-21.410.57
S4A4Electrogenic sodium bicarbonate cotransporter 11.210.57
CPLX1Complexin-11.160.59
RAB1BRas-related protein Rab-1B1.010.71
HBB1Hemoglobin subunit beta-10.770.66
NDKBNucleoside diphosphate kinase B0.430.72
PPME1Protein phosphatase methylesterase 10.430.62
GNAZGuanine nucleotide-binding protein G(z) subunit alpha−0.370.55
OGT1UDP-N-acetylglucosamine—peptide N-acetylglucosaminyltransferase 110 kDa subunit−0.450.55
CLPPATP-dependent Clp protease proteolytic subunit, mitochondrial−0.550.63
F210AProtein FAM210A−0.560.67
RL2960S ribosomal protein L29−0.740.56
KPCGProtein kinase C gamma type−0.940.72
PGM2LGlucose 1,6-bisphosphate synthase−0.940.72
UBE2NUbiquitin-conjugating enzyme E2 N−1.000.79
RS940S ribosomal protein S9−1.250.77
MECRTrans-2-enoyl-CoA reductase, mitochondrial−1.480.56
VAT1LSynaptic vesicle membrane protein VAT-1 homolog-like−1.490.56
RAB3BRas-related protein Rab-3B−1.750.55
GUAAGMP synthase [glutamine-hydrolyzing]−2.230.62
GCYB1Guanylate cyclase soluble subunit beta-1−2.390.56
GMFBGlia maturation factor beta−2.570.58
THIKA3-ketoacyl-CoA thiolase A, peroxisomal−2.970.64
2ABGSerine/threonine-protein phosphatase 2A 55 kDa regulatory subunit B gamma isoform−3.430.61
MYDGFMyeloid-derived growth factor−3.590.57
The APP23 and APP23/TG2−/− proteomes were resolved by SWATH acquisition MS as described in the Methods. Proteins changed at confidence ≥ 55% are listed according to log2(FC) level. APP23/APP23 TG2−/− ratio was calculated by SCIEX OneOmics cloud processing software. The protein peak area variation expressed as log2FC (log2(APP23/APP23 TG2−/−)) is here shown.
Table 5. Proteins changed in APP23/TG2−/− compared to WT/TG2−/− proteome. Positive log2FC indicates upregulated proteins; negative log2FC indicates downregulated proteins.
IDNamelog2FC
(APP23 TG2−/−/WT TG2−/−)
Confidence
GNAI3Guanine nucleotide-binding protein G(k) subunit alpha3.550.56
MACF1Microtubule-actin crosslinking factor 13.460.57
FN3KFructosamine-3-kinase3.180.78
THIKA3-ketoacyl-CoA thiolase A, peroxisomal3.080.62
SYMCMethionine—tRNA ligase, cytoplasmic3.060.62
CPSF6Cleavage and polyadenylation specificity factor subunit 62.750.62
NFU1NFU1 iron-sulfur cluster scaffold homolog, mitochondrial2.450.58
ESYT1Extended synaptotagmin-12.400.71
ENOGGamma-enolase2.070.60
SEP6Septin-61.620.60
CLPPATP-dependent Clp protease proteolytic subunit, mitochondrial1.490.88
A4Amyloid beta A4 protein1.260.62
NCLNNicalin0.920.55
UCRICytochrome b-c1 complex subunit Rieske, mitochondrial0.830.59
NFMNeurofilament medium polypeptide0.730.79
UBE2NUbiquitin-conjugating enzyme E2 N0.680.65
KPCGProtein kinase C gamma type0.580.67
CAMP2Calmodulin-regulated spectrin-associated protein 20.500.56
APODApolipoprotein D0.490.56
BRSK1Serine/threonine-protein kinase BRSK10.460.67
SCPDLSaccharopine dehydrogenase-like oxidoreductase0.390.68
TNPO1Transportin-10.360.56
GLU2BGlucosidase 2 subunit beta0.160.60
STMN1Stathmin−0.250.63
GPM6ANeuronal membrane glycoprotein M6-a−0.300.57
MPP2MAGUK p55 subfamily member 2−0.360.63
NEUGNeurogranin−0.490.68
OTU6BOTU domain-containing protein 6B−0.490.69
PC4L1Purkinje cell protein 4-like protein 1−0.510.83
CH1010 kDa heat shock protein, mitochondrial−0.560.64
HBB1Hemoglobin subunit beta-1−0.600.71
MDHCMalate dehydrogenase, cytoplasmic−0.820.57
SNG1Synaptogyrin-1−0.920.55
KCAB2Voltage-gated potassium channel subunit beta-2−0.940.66
MAAIMaleylacetoacetate isomerase−1.370.65
TDRKHTudor and KH domain-containing protein−1.660.57
ENOPHEnolase-phosphatase E1−2.110.60
SARM1Sterile alpha and TIR motif-containing protein 1−2.210.62
PZPPregnancy zone protein−2.380.62
PUR6Multifunctional protein ADE2−4.390.70
Proteins changed at confidence ≥55% are listed according to log2(FC) level. APP23 TG2−/−/WT TG2−/− ratio expressed as log2FC (log2(APP23 TG2−/−/WT TG2−/−)) is here shown.
Table 6. Proteins changed in WT compared to WT/TG2−/− proteome. Positive log2FC indicates upregulated proteins; negative log2FC indicates downregulated proteins.
IDNamelog2FC
(WT/WT TG2−/−)
Confidence
CPSF6Cleavage and polyadenylation specificity factor subunit 63.760.68
GNAI3Guanine nucleotide-binding protein G(k) subunit alpha3.750.55
PADI2Protein-arginine deiminase type-23.590.59
TOLIPToll-interacting protein3.530.61
SYMCMethionine—tRNA ligase, cytoplasmic3.460.60
ECHD1Ethylmalonyl-CoA decarboxylase2.540.60
HSDL1Inactive hydroxysteroid dehydrogenase-like protein 12.500.55
AGRB1Brain-specific angiogenesis inhibitor 12.490.55
NFU1NFU1 iron-sulfur cluster scaffold homolog, mitochondrial2.210.66
FBX41F-box only protein 411.170.64
APODApolipoprotein D0.680.57
SNAAAlpha-soluble NSF attachment protein0.470.58
HEBP1Heme-binding protein 10.270.56
RRAGCRas-related GTP-binding protein C0.270.55
DTD1D-tyrosyl-tRNA(Tyr) deacylase 10.230.68
RL660S ribosomal protein L60.210.56
CORO7Coronin-7−0.290.63
AN32AAcidic leucine-rich nuclear phosphoprotein 32 family member A−0.350.64
HNRPUHeterogeneous nuclear ribonucleoprotein U−0.430.73
CAH8Carbonic anhydrase-related protein−0.470.55
MBPMyelin basic protein−0.610.75
HBB1Hemoglobin subunit beta-1−0.620.79
MYEF2Myelin expression factor 2−0.630.57
S20A2Sodium-dependent phosphate transporter 2−0.790.80
KCAB2Voltage-gated potassium channel subunit beta-2−0.850.61
RL35A60S ribosomal protein L35a−0.940.55
RS2840S ribosomal protein S28−1.010.67
LSM6U6 snRNA-associated Sm-like protein LSm6−1.020.57
RL2960S ribosomal protein L29−1.030.78
AN32EAcidic leucine-rich nuclear phosphoprotein 32 family member E−1.030.61
RS940S ribosomal protein S9−1.160.61
SNG1Synaptogyrin-1−1.230.57
SARM1Sterile alpha and TIR motif-containing protein 1−2.270.65
EXOGNuclease EXOG, mitochondrial−3.220.56
RHG23Rho GTPase-activating protein 23−3.380.63
ROCK2Rho-associated protein kinase 2−3.610.61
Proteins changed at confidence ≥ 55% are listed according to log2(FC) level. WT/WT TG2−/− ratio expressed as log2FC (log2(WT/WT TG2−/−)) is here shown.
Publisher’s Note: MDPI stays neutral with regard to jurisdictional claims in published maps and institutional affiliations.

