Article

Adipose Tissue Steroid Receptor RNA Activator 1 (SRA1) Expression Is Associated with Obesity, Insulin Resistance, and Inflammation

1
Department of Immunology & Microbiology, Dasman Diabetes Institute, Dasman 15462, Kuwait
2
Animal and Imaging Core Facilities, Dasman Diabetes Institute, Dasman 15462, Kuwait
3
Department of Genetics and Bioinformatics, Dasman Diabetes Institute, Dasman 15462, Kuwait
4
Department of Public Health, University of Helsinki, 00100 Helsinki, Finland
5
Public Health Promotion Unit, Diabetes Research Group, Finnish Institute for Health and Welfare, King Abdulaziz University, Jeddah 21589, Saudi Arabia
*
Author to whom correspondence should be addressed.
These authors contributed equally to this work.
Cells 2021, 10(10), 2602; https://doi.org/10.3390/cells10102602
Submission received: 9 August 2021 / Revised: 14 September 2021 / Accepted: 16 September 2021 / Published: 30 September 2021
(This article belongs to the Special Issue Adipocytes and Metabolic Health - Second Edition)

Abstract

:
Steroid receptor RNA activator 1 (SRA1) is involved in pathophysiological responses of adipose tissue (AT) in obesity. In vitro and animal studies have elucidated its role in meta-inflammation. Since SRA1 AT expression in obesity/type 2 diabetes (T2D) and the relationship with immune-metabolic signatures remains unclear, we assessed AT SRA1 expression and its association with immune–metabolic markers in individuals with obesity/T2D. For this, 55 non-diabetic and 53 T2D individuals classified as normal weight (NW; lean), overweight, and obese were recruited and fasting blood and subcutaneous fat biopsy samples were collected. Plasma metabolic markers were assessed using commercial kits and AT expression of SRA1 and selected immune markers using RT-qPCR. SRA1 expression was significantly higher in non-diabetic obese compared with NW individuals. SRA1 expression associated with BMI, PBF, serum insulin, and HOMA-IR in the total study population and people without diabetes. SRA1 associated with waist circumference in people without diabetes and NW participants, whereas it associated inversely with HbA1c in overweight participants. In most study subgroups AT SRA1 expression associated directly with CXCL9, CXCL10, CXCL11, TNF-α, TGF-β, IL2RA, and IL18, but inversely with CCL19 and CCR2. TGF-β/IL18 independently predicted the SRA1 expression in people without diabetes and in the total study population, while TNF-α/IL-2RA predicted SRA1 only in people with diabetes. TNF-α also predicted SRA1 in both NW and obese people regardless of the diabetes status. In conclusion, AT SRA1 expression is elevated in people with obesity which associates with typical immunometabolic markers of obesity/T2D, implying that SRA1 may have potential as a biomarker of metabolic derangements.

1. Introduction

SRA1 is a gene that encodes steroid receptor RNA activator 1 (SRA1) [1]. SRA1 was initially characterized as an intergenic long non-coding RNA (lncRNA)that functions as an RNA coactivator of nuclear receptors to enhance steroid receptor-dependent gene expression [1]. It was reported that SRA1 can modulate gene transcription in the cell- and system-specific manners [1,2,3,4]. SRA1 can be recruited to DNA through interactions with other proteins that bind either directly or indirectly to DNA and serves as a natural organizer, regulating multiple physiological functions that govern the epigenetic modifications, modulation of chromatin modification, and gene expressions [5,6,7].
The role of SRA1 and its coactivators in the regulation of mammary gland development, myocyte, and adipocyte differentiation, steroidogenesis, tumorigenesis, hepatic steatosis, stem cell function, lipid metabolism, glucose homeostasis, and insulin sensitivity in adipocytes has been well documented [1,8,9]. Indeed, aberrant SRA1 expression and recent mutant variants have been identified in several clinical samples [4,5,7,8,9,10,11,12]. Higher expression levels of SRA1 in the human liver, muscle tissues, and in white and brown adipose tissues as key organs in the regulation of metabolic homeostasis compared to other tissues have been reported [1,8,13]. In fact, SRA1 is now known to be associated with several diseases, including obesity, cardiovascular diseases, polycystic ovary syndrome (PCOS), laryngeal squamous cell carcinoma, and breast cancer [3,8,9,10,13,14,15,16,17].
Obesity results from an imbalance between energy intake and expenditure, in which the excess energy is stored as triglyceride in white adipose tissue with both increased fat cell size (hypertrophy) and number (hyperplasia) [18]. Obesity induces a state of chronic, low-grade inflammation in fat that is accompanied by the local secretion of cytokines and chemokines, causing attenuation of insulin action [19,20,21,22,23]. Obesity is closely associated with a number of diseases including type 2 diabetes (T2D), cardiovascular disease, hypertension, dementia, and certain cancers [24,25]. Adipocytes function both as reservoirs of fuel and as endocrine cells, secreting adipokines such as leptin, adiponectin, interleukin-6 (IL-6), and tumor necrosis factor-α (TNF-α) to regulate whole-body energy metabolism and glucose homeostasis [26,27].
Based on our knowledge, the level of SRA1 expression in the AT in obesity and its association with insulin resistance and metabolic inflammation in humans in a clinical setting are poorly understood. Therefore, in this study, we aimed at investigating the levels of expression of SRA1 in the subcutaneous AT and determined its association with the inflammatory and metabolic markers in overweight/obese individuals, with or without T2D.

2. Materials and Methods

2.1. Study Population and Anthropometric Measurements

The study comprised 108 participants including 55 non-diabetic (8 NW, 19 overweight, and 28 obese), and 53 T2D (4 NW, 13 overweight, and 36 obese) individuals. In accordance with the ethical guidelines of the Declaration of Helsinki which is approved by the ethics committee of Dasman Diabetes Institute, Kuwait, (grant number RA 2010-003), each study participant submitted written informed consent for participation in the study. The exclusion criteria included chronic diseases of the lung, heart, kidney, or liver; hematologic disorders; pregnancy; immune dysfunction; type 1 diabetes, or malignancy, as previously described [28].

2.2. Anthropometric Measurements

Height and weight were measured using calibrated, portable electronic weighing scales and portable, inflexible height-measuring bars; waist and hip circumferences were measured using constant-tension tape. Body mass index (BMI, kg/m2) was calculated as the weight (kg)/height (m2) and participants were allocated in different categories as lean: BMI < 25 kg/m2; overweight: 25 ≤ BMI < 30 kg/m2, and obese: BMI ≥ 30 kg/m2. IOI353 Body Composition Analyzer (Jawon Medical, South Korea) was used to examine the whole-body composition and percentage of body fat (PBF). Fasting plasma glucose (FPG) and serum insulin measurements were used in the updated homeostasis model assessment (HOMA) index to evaluate insulin resistance (HOMA-IR), and insulin sensitivity [29].

2.3. Collection of Subcutaneous Adipose Tissue

Human adipose tissue biopsies (about 0.5 g) were collected from the abdominal subcutaneous fat pad just lateral to the umbilicus using standard sterile surgical methods as previously described [30]. Briefly, the periumbilical area was swabbed with ethanol and then locally anesthetized with 2% lidocaine (2 mL, Fresenius Kabi, LLC., Lake Zurich, IL, USA). Through a small superficial skin incision (0.5 cm), fat tissue was collected. After removal, biopsy tissue was further incised into smaller pieces (~50–100 mg) in RNAlater (Sigma-Aldrich Chemie GmbH, Taufkirchen, Germany) for RNA extraction, and then stored at −80 °C until use [31].

2.4. Measurement of Metabolic Markers

Peripheral blood was collected from overnight-fasted individuals and analyzed for FPG, fasting insulin, lipid profile, and HbA1c. FPG and lipid profiles including plasma triglycerides (TGL), low-density lipoproteins (LDL), high-density lipoproteins (HDL), and cholesterol levels were measured using Siemens Dimension RXL chemistry analyzer (Diamond Diagnostics, Holliston, MA, USA). HbA1c was measured using a Variant device (BioRad, Hercules, CA, USA).

2.5. RNA Extraction, cDNA Synthesis, and Detection of SRA1 and Inflammatory Markers by RT-qPCR

Total RNA was extracted from the adipose tissue samples using an RNeasy kit (Qiagen, Valencia, CA., USA) following the manufacturer’s protocol. The first-strand cDNA was synthesized from 0.5 µg RNA using a High-Capacity cDNA Reverse Transcription kit (Applied Biosystems, CA, USA) as previously described [30]. Real-time qRT-PCR was performed as we described previously [30]; cDNA samples (50 ng) were amplified using TaqMan Gene Expression Master Mix (Applied Biosystems, CA, USA) and gene-specific 20 × TaqMan gene expression assays containing forward and reverse primers (Table 1) and a target-specific TaqMan MGB probe labeled with FAM dye at the 5′-end and NFQ-MGB at the 3′-end of the probe using a 7500 Fast Real-Time PCR System (Applied Biosystems, CA, USA). Each cycle involved denaturation (15 s at 95 °C), annealing/extension (1 min at 60 °C) after UDG (2 min at 50 °C) and AmpliTaq gold enzyme (10 min at 95 °C) activation. Relative gene expression to control, lean AT, was calculated using the comparative Ct method as we previously described [32]. Results were normalized to GAPDH and expressed as mean ± standard error (SD) values relative to controls [33].

2.6. Statistical Analysis

Statistical analysis was performed using GraphPad Prism software (GraphPad, La Jolla, CA, USA) and SPSS for Windows version 19.01 (IBM SPSS Inc., Chicago, IL, USA). Unless otherwise indicated, data were shown as mean ± SD values. A non-parametric Mann–Whitney U test was used to compare means between groups. Spearman correlation and stepwise multivariable regression analysis were performed to determine associations between different variables. For all analyses, a p value < 0.05 was considered significant. Standard multivariable linear regression by the Enter method was used; variables that significantly correlated with SRA were selected as predictor variables and were entered simultaneously to generate the model. The F-test was used to assess whether the set of entered independent variables collectively predicted the dependent variable. R-squared was used to determine how much variance in the dependent variable could be accounted for by the set of independent variables. The t test, p value, and beta coefficients (β-value) were used to determine the significance and the magnitude of prediction for each independent variable, respectively.

3. Results

3.1. Demographic and Clinical Characteristics of the Study Population

The characteristics of 108 individuals that participated in this study are detailed in Table 2. Significant differences were observed between non-diabetic (n = 55) and diabetic (n = 53) participants for FPG, fasting insulin, TG, HbA1c, and HOMA-IR. No significant differences were found between non-diabetic vs. diabetic participants, comparing for weight, height, BMI, waist circumference, hip circumference, waist/hip ratio (WHR), and PBF. However, these parameters, except for height, differed significantly between lean, overweight, and obese non-diabetic or diabetic participants, as expected. The study participants were 34–58 years old, with a significant age difference between people with and without diabetes, but there was no significant age difference amongst NW, overweight, and obese participants. Total plasma cholesterol, LDL, and HDL levels were comparable between people with and without diabetes while triglycerides were significantly higher in diabetic and lower in lean non-diabetic participants, and HDL level was significantly higher in NW non-diabetic participants than in other groups (Table 2).

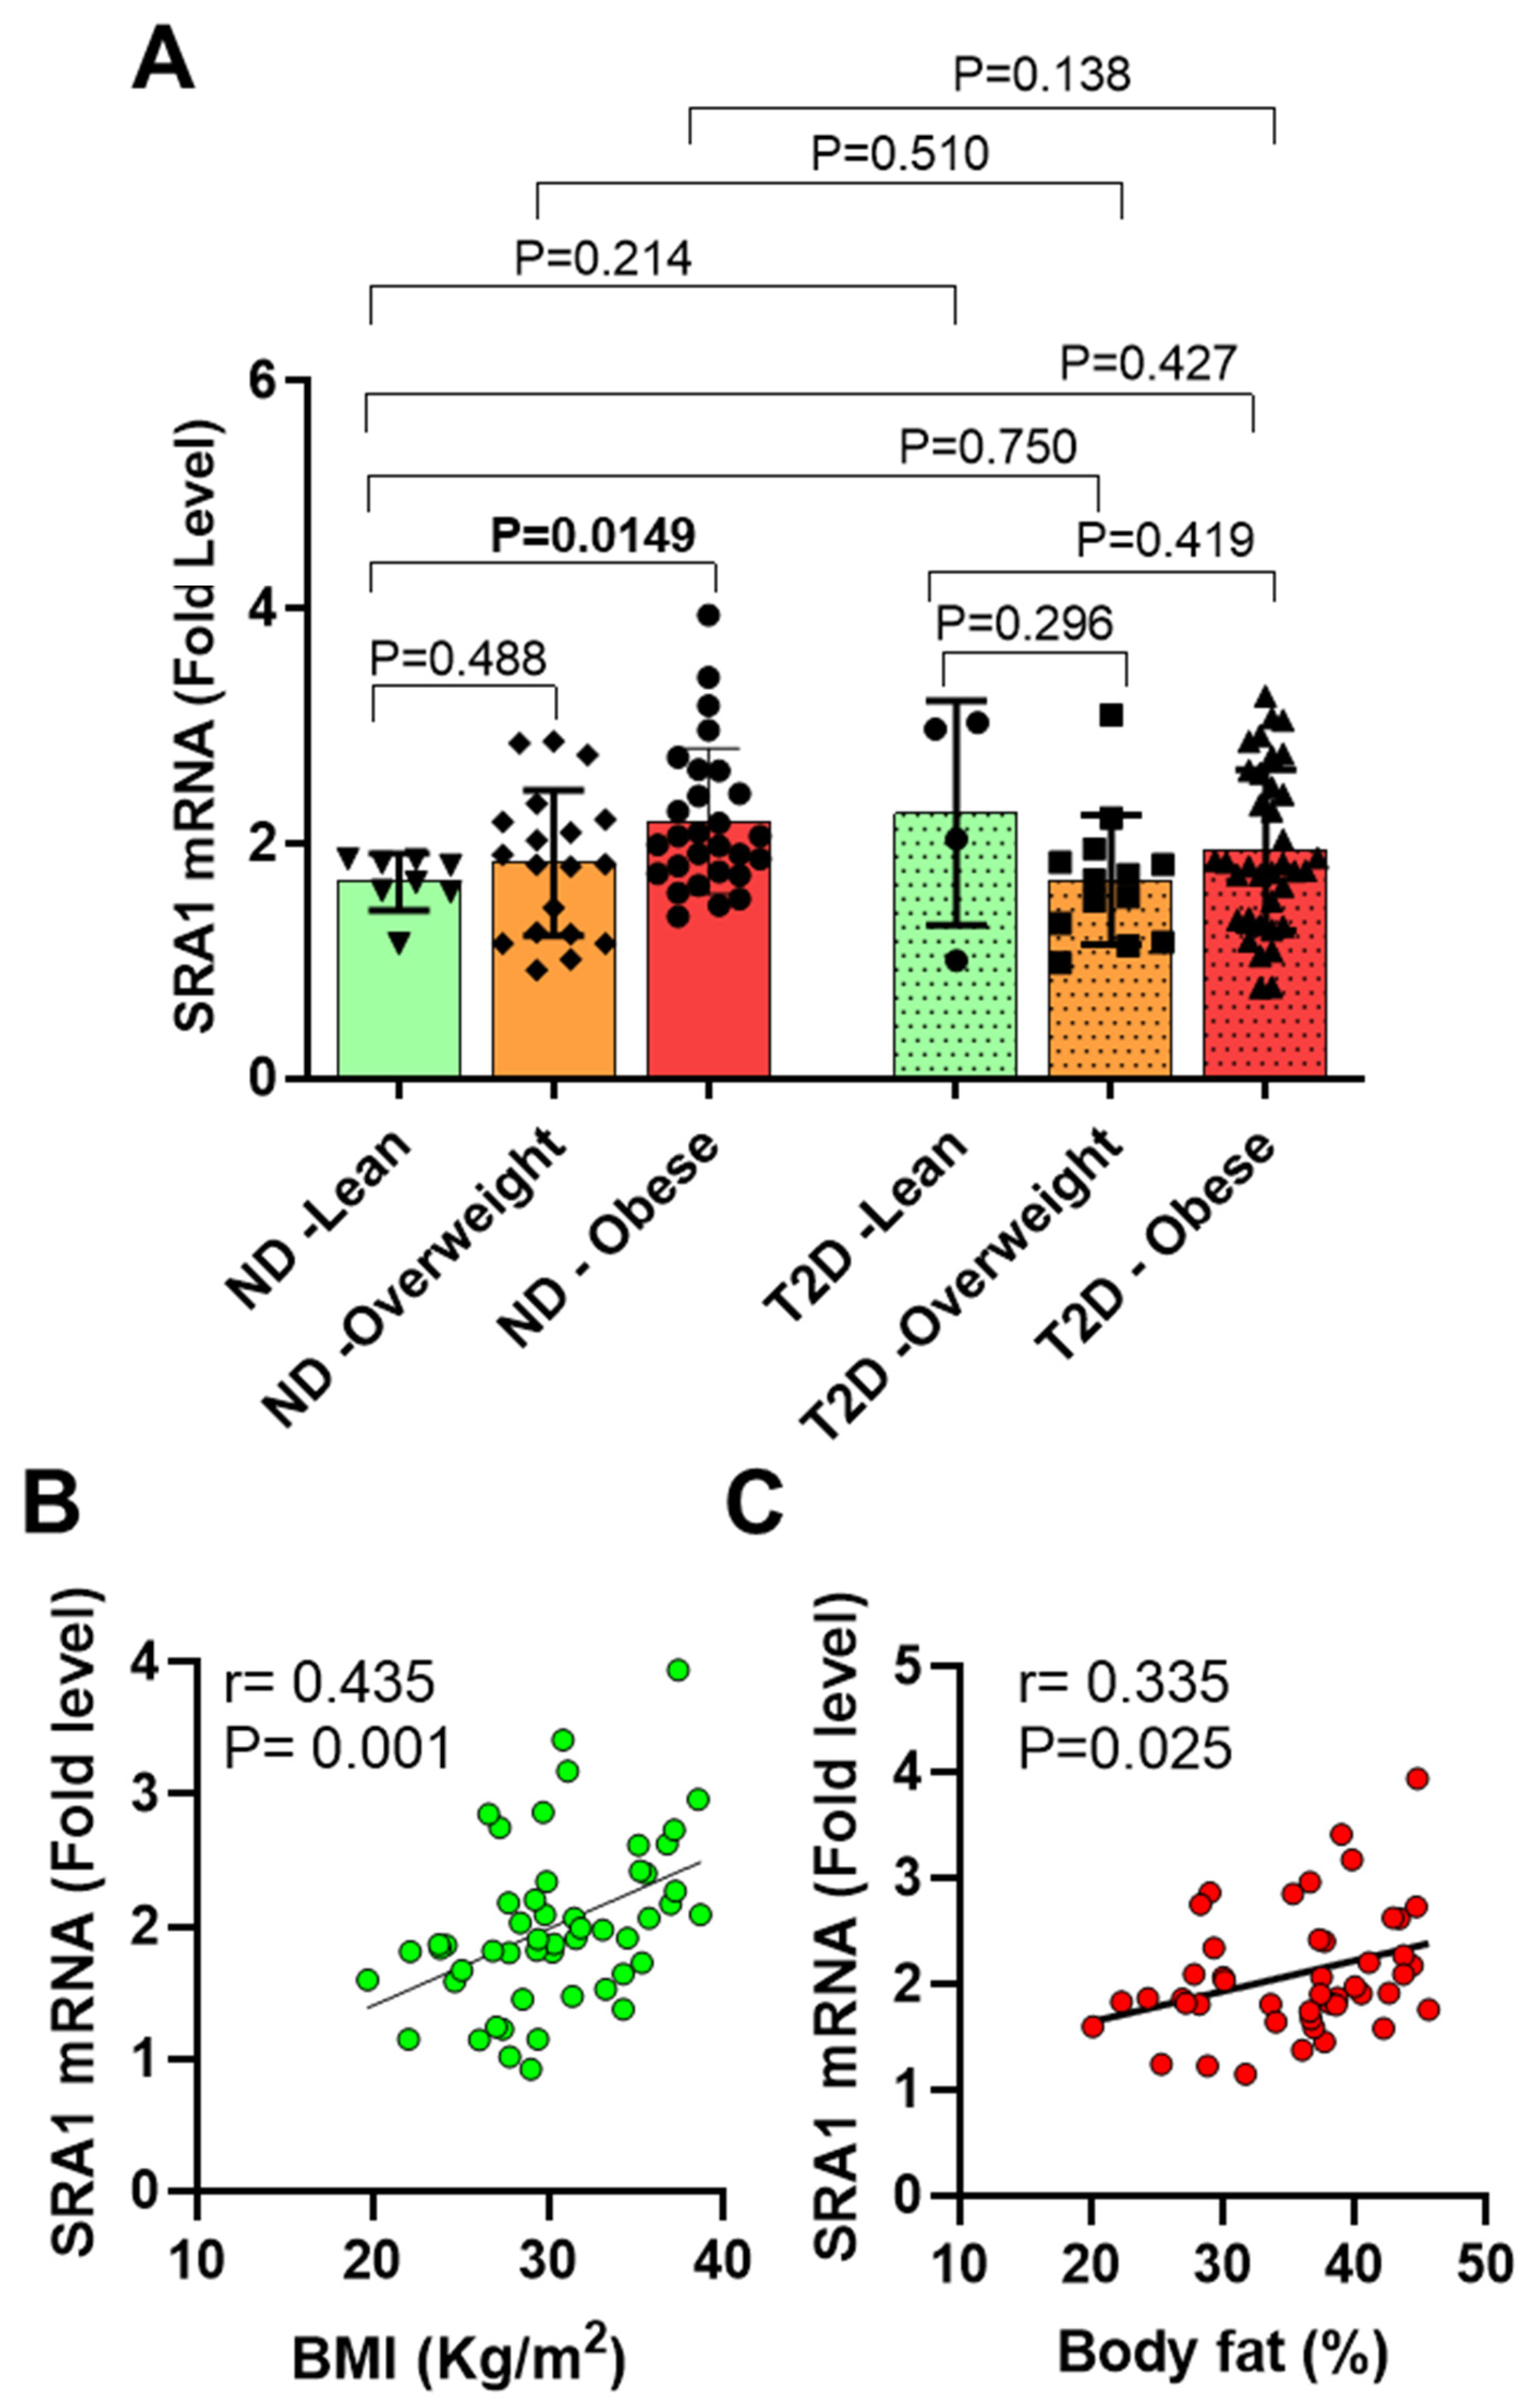
3.2. AT SRA1 Expression in Obesity and Type 2 Diabetes

In humans, the level of SRA1 adipose expression and its relationship with clinical and immunometabolic signatures of obesity and T2D are poorly understood. We therefore asked whether obesity and T2D affected the expression of SRA1 in the adipose tissue. We found that SRA1 expression was significantly higher (n = 28, 2.19 ± 0.62 fold, p = 0.015) in non-diabetic obese compared with non-diabetic NW (n = 8, 1.67 ± 0.24 fold) participants (Table 2, Figure 1A). In individuals without T2D, immunohistochemistry analysis showed high SRA1 protein expression in obese individuals when compared with NW (lean) (Figure 2A,B). Whereas SRA1 expression differed non-significantly between diabetic and non-diabetic participants (Table 2, Figure 1B). Additionally, no significant difference was detected between NW (1.87 ± 0.61 fold, n = 12), overweight (1.77 ± 0.59 fold, n = 32) and obese (2.04 ± 0.66 fold, n = 64), diabetic, and non-diabetic participants combined (Figure 1C). No difference in SRA1 protein expression was seen in individuals with diabetes (Supplementary Figure S1).
SRA1 expression was associated directly with BMI (r = 0.221, p = 0.022), PBF (r = 0.216, p = 0.044), fasting serum insulin (r = 0.0242, p = 0.026), and HOMA-IR (r = 0.235, p = 0.030) (Table 3). In non-diabetic participants SRA1 expression was associated directly with BMI (r = 0.435, p = 0.001), PBF (r = 0.335, p = 0.025) (Figure 1B,C), waist circumference (r = 0.291, p = 0.047), fasting serum insulin (r = 0.440, p = 0.005), and HOMA-IR (r = 0.433, p = 0.005). However, in individuals with T2D, only the HbA1c associated inversely with the levels of SRA1 expression. Correlational analysis of SAR1 adipose expression with clinico-metabolic signatures, after stratifying the study population based on BMI regardless of the diabetes status, indicated that SRA1 expression was associated directly with waist circumference (r = 0.0646, p = 0.043) in NW, and inversely with HbA1c (r = −0.417, p = 0.022) in overweight individuals (Table 3).

3.3. Association of AT SRA1 Expression with Inflammatory Signatures

The most significant change in the adipose tissue in obesity, from the immunological standpoint, is its increased infiltration by monocytes/macrophages and a phenotypic shift of resident macrophages from an anti-inflammatory M2 to an inflammatory M1 type, which explains the persistence of chronic low-grade inflammation in the adipose compartment. Since SRA1 adipose tissue expression was elevated in obesity, we next sought to determine the relationship of SRA1 expression with the inflammatory cytokines/chemokines in our study population. AT SRA1 expression in our total study population associated directly with several inflammatory markers in fat including CCL2 (r = 0.234, p = 0.017), CCL8 (r = 0.262, p = 0.011), CXCL9 (r = 0.215, p = 0.029), CXCL10 (r = 0.280, p = 0.004), CXCL11 (r = 0.368, p < 0.001), TNF-α (r = 0.413, p < 0.0001), TGF-β (r = 0.438, p < 0.0001), IL13 (r = 0.205, p = 0.044), IL18 (r = 0.371, p < 0.001), IL2RA (r = 0.197, p = 0.041), and CCR1 (r = 0.258, p = 0.009) (Table 4, Heat map shown in Figure 3). In people without diabetes SRA1 expression was associated with CCL3 (r = 0.298, p = 0.036), CCL8 (r = 0.344, p = 0.021), CXCL11 (r = 0.400, p = 0.003), TNF-α (r = 0.317, p = 0.030), TGF-β (r = 0.514, p < 0.0001), IL13 (r = 0.310, p = 0.028), and IL18 (r = 0.547, p < 0.0001). In people with T2D SRA1 expression was associated directly with the transcripts expression of CCL2 (r = 0.385, p = 0.006), CXCL9 (r = 0.379, p = 0.008), CXCL10 (r = 0.437, p = 0.002), CXCL11 (r = 0.421, p = 0.002), TNF-α (r = 0.505, p < 0.001), TGF-β (r = 0.348, p = 0.014), IL5 (r = 0.297, p = 0.040), IL2RA (r = 0.461, p = 0.001), and CCR1 (r = 0.299, p = 0.033). SRA1 adipose expression in overweight population had a direct association with CCL7 (r = 0.682, p = 0.021), TNF-α (r = 0.810, p = 0.015), and IL10 (r = 0.667, p = 0.050) and an inverse association with CCL19 (r = −0.427, p = 0.017), and CCR2 (r = −0.453, p = 0.009). In obese participants SRA1 expression was associated with a wide spectrum of inflammatory markers including CCL2 (r = 0.256, p = 0.043), CCL5 (r = 0.433, p = 0.002), CCL8 (r = 0.294, p = 0.027), CXCL9 (r = 0.408, p = 0.001), CXCL10 (r = 0.282, p = 0.028), CXCL11 (r = 0.440, p < 0.001), TNF-α (r = 0.504, p < 0.0001), TGF-β (r = 0.430, p = 0.001), IL5 (r = 0.264, p = 0.039), IL18 (r = 0.295, p = 0.021), IL23A (r = 0.379, p = 0.002), IL2RA (r = 0.274, p = 0.028), CCR1 (r = 0.417, p = 0.001), and CCR2 (r = 0.278, p = 0.046) (Table 4; Heat map shown in Figure 3).
We observed that inflammatory markers (TNF-α and IL-18) protein expression was positively correlated with SRA1 protein expression in individuals without diabetes (Supplementary Figure S2). We also observed inflammatory markers (IL-8, TNF-α and CCL2) protein expression was positively correlated with SRA1 protein expression in individuals with diabetes (Supplementary Figure S3).

3.4. Analysis of the Indipenedent Associations between SRA1 and Immune Metabolic Markers

In order to determine independent associations of SRA1 with immune metabolic markers, the markers having significant associations with SRA1 expression level were further analyzed by multivariable stepwise linear regression analysis (Table 5). In the total population (n = 108) IL-18, TGF-β, and CXCL11 were independently associated with SRA1 expression. TGF-β and IL18 in people without diabetes and TNF-α and IL2RA in people with diabetes were independent predictors of SRA1 expression. Regarding the obesity status, independent associations were found only for TNF-α and CCR2 with SRA1 expression in NW (n = 12), and overweight (n = 32) participants. In obese participants (n = 64), both TNF-α and IL18 were detected as independent predictors for SRA1 expression (Table 5).

4. Discussion

Adipose tissues function both as reservoirs of fuel and as endocrine cells, secreting adipokines, chemokines, and cytokines to regulate energy metabolism and glucose homeostasis [26,27]. Obesity induces a state of chronic, low-grade inflammation in the adipose tissue that is accompanied by the local secretion of several pro-inflammatory cytokines and chemokines, especially TNFα, attenuating insulin action and resulting in insulin resistance through activation of the JNK pathway [20,34]. Persistence of a low-grade inflammatory state from obesity, over time, leads to the onset of well-known obesity-associated inflammatory diseases including T2D, cardiovascular disease, atherosclerosis, hepatic steatosis, hypertension, sarcopenia, osteoarthritis, rheumatoid arthritis, and cancer.
In mammals, including humans, SRA1 gene expresses a long non-coding steroid receptor RNA activator 1 (SRA1) in high energy demand tissues such as adipose tissue, liver, heart, and muscle [1,2,3]. Identified in 1999 using a yeast two-hybrid assay for human B-cell library and the activation function one domain of progesterone receptor as bait, SRA1 is known to affect or regulate a wide variety of physiological and pathological processes including hepatic steatosis, mammary gland development, steroidogenesis, tumorigenesis, stem cell function, myocyte, and adipocyte differentiation [35]. It was shown that SRA1 is expressed at the highest levels in the adipocyte fraction of white adipose tissue, followed by brown adipose tissue, and the preadipocytes [36,37]. SRA1 has been shown to act as an RNA coactivator of nuclear receptors, involved in the regulation of adipocyte differentiation, and in glucose homeostasis and insulin sensitivity in adipocytes [5,8,13].
Based on our knowledge, this is the first study investigating the level of expression of SRA1 in the AT in humans with obesity/T2D. In this study, we found that adipose SRA1 expression was significantly higher in obese compared to lean non-diabetic participants. Nonetheless, no significant differences were detected between diabetic vs. non-diabetic participants, as well as among NW, overweight, and obese participants with diabetes. Regarding the association of SRA1 expression with metabolic markers, BMI, PBF, serum insulin, and HOMA-IR levels associated directly with SRA1 expression in the total study population as well as in non-diabetic participants. Waist circumference associated directly with SRA1 expression in non-diabetic and lean participants whereas HbA1c associated inversely with SRA1 expression in overweight participants. Similarly, Liu et al. found that expression of lncRNA GYG2P1 and Sun et al. found that expression of lncRNA p21015 were inversely associated with adiposity parameters including BMI, waist circumference, fasting serum insulin, and triglycerides [38,39]. Overall, our data showed varying association patterns of adipose SRA1 expression with the metabolic profile of individuals, differing with regard to the obesity and T2D status.
We further extended our analysis to assess the associations between adipose tissue SRA1 expression and local expression of a wide range of proinflammatory cytokines/chemokines and other immune markers. To this end, in most study populations, adipose SRA1 expression was directly associated with that of CXCL9, CXCL10, CXCL11, TNF-α, TGF-β, IL2RA, and IL18. Interestingly, we did not find any association between SRA1 and IL6 adipose expression in this study. SRA1 expression was associated inversely with that of CCL19 and CCR2.These findings suggest that SRA1 expression is associated, for the most part, with the expression of inflammatory immune markers in the fat. Similarly, several groups found that the expression of lncRNAs such as ANRIL and ASMER1/2 correlated directly with the proinflammatory factors and inflammatory pathways [40,41]. Gao et al. identified 86 differentially expressed lncRNAs between obese and non-obese persons while 44 lncRNAs were differentially expressed in individuals who were insulin-resistant versus insulin-sensitive and obese people [41].
Besides, TGF-β and IL18 independently predicted the SRA1 expression in non-diabetics as well as in the total (diabetic and non-diabetic) study population, while TNF-α and IL-2RA were the independent predictors of SRA1 only in people with diabetes. TNF-α also predicted SRA1 adipose expression in both NW and obese populations, regardless of diabetes status. These data revealed specific association patterns of adipose SRA1 expression with typical immune markers, mostly inflammatory by nature.
To investigate the functional role of SRA, a SRA knockout mouse model was developed [36]. Body composition analysis of this mouse model revealed significant differences in reduced total body weight, percentage of fat mass, epididymal white fat mass, subcutaneous white fat mass, and liver mass, with an increased percentage of lean mass [36]. The reduced fat mass was associated with small adipocytes compared with wild-type counterparts [36]. Interestingly, the SRA knockout mouse model displayed an improved insulin sensitivity and resistance to developing obesity in high-fat diet conditions, reduced fatty liver, and improved glucose tolerance [36,37]. The improvement of insulin sensitivity was associated with reduced inflammatory signaling, including reduced plasma TNFα levels and with a reduced expression of inflammation genes including TNF-α and CCl2 in white adipose tissue, but an unchanged level of IL6 [36,37]. In addition, microarray data obtained from an adipocyte cell line revealed several SRA-responsive genes including genes related to cell cycle, serum insulin, and TNF-α signaling pathways [37]. These results suggest an important role of SRA in adipose tissue development and function, providing a potential target to control obesity and metabolic syndrome. It is important to keep in consideration that the SRA knockout mouse model has a global loss of SRA expression in all tissues including liver and fat tissue, which may contribute to whole-body insulin sensitivity. Therefore, further studies using both gain of function and loss of function (tissue-specific knockout) models, targeting SRA expression exclusively in the liver, fat, or muscle will be indispensable to elucidate the role of SRA in regulating body metabolism and glucose homeostasis, as a potential target to control obesity and T2D. In a knock-out mouse model of SRA1 has displayed improved insulin sensitivity and resistance to developing obesity under high-fat diet conditions, but obesity and T2D themselves might have a non-significant influence on SRA1 expression levels, reflecting a plausible absence of reverse causation.
Our results support the opinion that adipose expression of SRA1 may be viewed as a potential new biomarker of obesity in humans, but caution should be considered in generalizing these findings as our study is limited by certain caveats. First, it is a cross-sectional study comprising a limited number of participants stratified by their obesity and diabetes status. Second, it is a clinical study and the results are exclusively based on a correlational analysis of the SRA1 expression versus immune–metabolic markers gene expression in the subcutaneous fat tissue. Therefore, the obesity/T2D-related changes in the visceral fat compartment which are more representative and indicative of the pathophysiological effects of obesity or diabetes remain unclear. Third, our data also lack information of the SRA1 and SRA protein (SRAP) expression in main insulin target tissues other than white subcutaneous adipose tissue in obesity. Indeed, the functions and mechanisms of action of most of the lncRNAs remain elusive thus far, while only a small number of lncRNAs have been well characterized to provide the mechanistic insights by which lncRNAs exert their diverse effects/functions. A substantial argument in favor of the pathophysiological significance of SRA1 as a regulatory molecular signal in obesity lies in its variable expression that we observed between non-diabetic NW and obese people, implying that further clinical studies, preferably longitudinal, and including larger cohorts as well as experimental studies of loss and gain of function approaches will be needed to understand the SRA1-associated underlying molecular mechanisms at the genetic and epigenetic levels that regulate metabolic disease pathogenesis.

5. Conclusion

In conclusion, we show for the first time that SRA1 adipose expression is elevated with obesity in humans, which correlates with specific metabolic parameters and/or adipose tissue immune markers. A potential link between elevated SRA1 expression and typical correlates of obesity/T2D implies that SRA1 may have significance as a potential new biomarker of metabolic disorders.

Supplementary Materials

The following are available online at https://www.mdpi.com/article/10.3390/cells10102602/s1, Figure S1: SRA1 protein expression in the adipose tissue of the individuals with diabetes. Figure S2: Increased TNF-α and IL-18 correlated with SRA1 protein expression in adipose tissue. Figure S3: IL-8, TNF-α and CCL2 protein expression in correlated with SRA1 protein expression in adipose tissue. Table S1: Correlation of SRA1 expression level with various clinical and biochemical markers.

Author Contributions

S.K. participated in performing experiments, collecting, analyzing data, and writing the manuscript; H.A. participated in collecting and analyzing data, interpretation and writing the manuscript; S.S. (Sardar Sindhu) participated in data analysis, interpretation and writing the manuscript; S.S. (Steve Shenouda) and R.T. participated performing experiments; J.T. and F.A.-M. reviewed, edited, and critically commented on the manuscript, and R.A. conceived the idea, guided the research study, provided material support, procured funds, and reviewed/edited the manuscript. All authors have read and agreed to the published version of the manuscript.

Funding

This study was supported by the Kuwait Foundation for Advancement of Sciences (KFAS) (Grants #: RA-2010-003; RA AH 2016-007).

Institutional Review Board Statement

The study was conducted according to the guidelines of the Declaration of Helsinki, reviewed, and approved by the ethics committee of the Dasman Diabetes Institute, Kuwait (No.: RA-2010-003).

Informed Consent Statement

Informed consent was obtained from all subjects involved in the study.

Data Availability Statement

The data presented in this study are available on request from the corresponding author.

Acknowledgments

The authors also thank Fahad Al-Ghamlas for help with patient recruitment.

Conflicts of Interest

The authors declare no conflict of interest.

References

  1. Lanz, R.B.; McKenna, N.J.; Onate, S.A.; Albrecht, U.; Wong, J.; Tsai, S.Y.; Tsai, M.-J.; O’Malley, B.W. A steroid receptor coactivator, sra, functions as an rna and is present in an src-1 complex. Cell 1999, 97, 17–27. [Google Scholar] [CrossRef] [Green Version]
  2. Emberley, E.; Huang, G.-J.; Hamedani, M.K.; Czosnek, A.; Ali, D.; Grolla, A.; Lu, B.; Watson, P.H.; Murphy, L.C.; Leygue, E. Identification of new human coding steroid receptor rna activator isoforms. Biochem. Biophys. Res. Commun. 2003, 301, 509–515. [Google Scholar] [CrossRef]
  3. Friedrichs, F.; Zugck, C.; Rauch, G.J.; Ivandic, B.; Weichenhan, D.; Müller-Bardorff, M.; Meder, B.; Mokhtari, N.E.E.; Regitz-Zagrosek, V.; Hetzer, R.; et al. Hbegf, sra1, and ik: Three cosegregating genes as determinants of cardiomyopathy. Genome Res. 2009, 19, 395–403. [Google Scholar] [CrossRef] [Green Version]
  4. Hubé, F.; Velasco, G.; Rollin, J.; Furling, D.; Francastel, C. Steroid receptor rna activator protein binds to and counteracts sra rna-mediated activation of myod and muscle differentiation. Nucleic Acids Res. 2011, 39, 513–525. [Google Scholar] [CrossRef] [Green Version]
  5. Colley, S.M.; Leedman, P.J. Steroid receptor rna activator—A nuclear receptor coregulator with multiple partners: Insights and challenges. Biochimie 2011, 93, 1966–1972. [Google Scholar] [CrossRef]
  6. Beato, M.; Vicent, G.P. A new role for an old player: Steroid receptor rna activator (sra) represses hormone inducible genes. Transcription 2013, 4, 167–171. [Google Scholar] [CrossRef] [PubMed] [Green Version]
  7. Leygue, E. Steroid receptor rna activator (sra1): Unusual bifaceted gene products with suspected relevance to breast cancer. Nucl. Recept. Signal. 2007, 5, e006. [Google Scholar] [CrossRef] [Green Version]
  8. Kotan, L.D.; Cooper, C.; Darcan, Ş.; Carr, I.M.; Özen, S.; Yan, Y.; Hamedani, M.K.; Gürbüz, F.; Mengen, E.; Turan, İ.; et al. Idiopathic hypogonadotropic hypogonadism caused by inactivating mutations in sra1. J. Clin. Res. Pediatr. Endocrino. 2016, 8, 125–134. [Google Scholar] [CrossRef]
  9. Lin, K.; Ma, J.; Wu, R.; Zhou, C.; Lin, J. Influence of ovarian endometrioma on expression of steroid receptor rna activator, estrogen receptors, vascular endothelial growth factor, and thrombospondin 1 in the surrounding ovarian tissues. Reprod. Sci. 2014, 21, 183–189. [Google Scholar] [CrossRef]
  10. Liu, Z.; Hao, C.; Huang, X.; Zhang, N.; Bao, H.; Qu, Q. Peripheral blood leukocyte expression level of lncrna steroid receptor rna activator (sra) and its association with polycystic ovary syndrome: A case control study. Gynecol. Endocrinol. 2015, 31, 363–368. [Google Scholar] [CrossRef]
  11. Caretti, G.; Schiltz, R.L.; Dilworth, F.J.; Di Padova, M.; Zhao, P.; Ogryzko, V.; Fuller-Pace, F.V.; Hoffman, E.P.; Tapscott, S.J.; Sartorelli, V. The rna helicases p68/p72 and the noncoding rna sra are coregulators of myod and skeletal muscle differentiation. Dev. Cell 2006, 11, 547–560. [Google Scholar] [CrossRef] [PubMed] [Green Version]
  12. Xu, B.; Yang, W.-H.; Gerin, I.; Hu, C.-D.; Hammer, G.D.; Koenig, R.J. Dax-1 and steroid receptor rna activator (sra) function as transcriptional coactivators for steroidogenic factor 1 in steroidogenesis. J. Mol. Cell Biol 2009, 29, 1719–1734. [Google Scholar] [CrossRef] [PubMed] [Green Version]
  13. Murphy, L.C.; Simon, S.L.; Parkes, A.; Leygue, E.; Dotzlaw, H.; Snell, L.; Troup, S.; Adeyinka, A.; Watson, P.H. Altered expression of estrogen receptor coregulators during human breast tumorigenesis. Cancer Res. 2000, 60, 6266–6271. [Google Scholar]
  14. Cooper, C.; Guo, J.; Yan, Y.; Chooniedass-Kothari, S.; Hube, F.; Hamedani, M.K.; Murphy, L.C.; Myal, Y.; Leygue, E. Increasing the relative expression of endogenous non-coding steroid receptor rna activator (sra) in human breast cancer cells using modified oligonucleotides. Nucleic Acids Res. 2009, 37, 4518–4531. [Google Scholar] [CrossRef] [Green Version]
  15. Kurisu, T.; Tanaka, T.; Ishii, J.; Matsumura, K.; Sugimura, K.; Nakatani, T.; Kawashima, H. Expression and function of human steroid receptor rna activator in prostate cancer cells: Role of endogenous hsra protein in androgen receptor-mediated transcription. Prostate Cancer Prostatic Dis. 2006, 9, 173–178. [Google Scholar] [CrossRef] [PubMed] [Green Version]
  16. Lanz, R.B.; Razani, B.; Goldberg, A.D.; O’Malley, B.W. Distinct rna motifs are important for coactivation of steroid hormone receptors by steroid receptor rna activator (sra). Proc. Natl. Acad. Sci. USA 2002, 99, 16081–16086. [Google Scholar] [CrossRef] [PubMed] [Green Version]
  17. Leygue, E.; Dotzlaw, H.; Watson, P.H.; Murphy, L.C. Expression of the steroid receptor rna activator in human breast tumors. Cancer Res. 1999, 59, 4190–4193. [Google Scholar] [PubMed]
  18. Gesta, S.; Tseng, Y.H.; Kahn, C.R. Developmental origin of fat: Tracking obesity to its source. Cell 2007, 131, 242–256. [Google Scholar] [CrossRef] [Green Version]
  19. Doria, A.; Patti, M.E.; Kahn, C.R. The emerging genetic architecture of type 2 diabetes. Cell Metab. 2008, 8, 186–200. [Google Scholar] [CrossRef] [Green Version]
  20. Olefsky, J.M.; Glass, C.K. Macrophages, inflammation, and insulin resistance. Annu. Rev. Physiol 2010, 72, 219–246. [Google Scholar] [CrossRef] [PubMed]
  21. Kawai, T.; Autieri, M.V.; Scalia, R. Adipose tissue inflammation and metabolic dysfunction in obesity. Am. J. Physiol. Cell Physiol. 2021, 320, C375–c391. [Google Scholar] [CrossRef] [PubMed]
  22. Rosa Neto, J.C.; Calder, P.C.; Curi, R.; Newsholme, P.; Sethi, J.K.; Silveira, L.S. The immunometabolic roles of various fatty acids in macrophages and lymphocytes. Int. J. Mol. Sci. 2021, 22, 8460. [Google Scholar] [CrossRef]
  23. Feijóo-Bandín, S.; Aragón-Herrera, A.; Moraña-Fernández, S.; Anido-Varela, L.; Tarazón, E.; Roselló-Lletí, E.; Portolés, M.; Moscoso, I.; Gualillo, O.; González-Juanatey, J.R.; et al. Adipokines and inflammation: Focus on cardiovascular diseases. Int. J. Mol. Sci. 2020, 21, 7711. [Google Scholar] [CrossRef]
  24. Abdelaal, M.; le Roux, C.W.; Docherty, N.G. Morbidity and mortality associated with obesity. Ann. Transl. Med. 2017, 5, 161. [Google Scholar] [CrossRef] [Green Version]
  25. Phelan, S.M.; Burgess, D.J.; Yeazel, M.W.; Hellerstedt, W.L.; Griffin, J.M.; van Ryn, M. Impact of weight bias and stigma on quality of care and outcomes for patients with obesity. Obes. Rev. 2015, 16, 319–326. [Google Scholar] [CrossRef]
  26. Rosen, E.D.; Spiegelman, B.M. Adipocytes as regulators of energy balance and glucose homeostasis. Nature 2006, 444, 847–853. [Google Scholar] [CrossRef] [Green Version]
  27. Arner, P. Resistin: Yet another adipokine tells us that men are not mice. Diabetologia 2005, 48, 2203–2205. [Google Scholar] [CrossRef]
  28. Sindhu, S.; Thomas, R.; Kochumon, S.; Wilson, A.; Abu-Farha, M.; Bennakhi, A.; Al-Mulla, F.; Ahmad, R. Increased adipose tissue expression of interferon regulatory factor (irf)-5 in obesity: Association with metabolic inflammation. Cells 2019, 8, 1418. [Google Scholar] [CrossRef] [Green Version]
  29. Hill, N.R.; Levy, J.C.; Matthews, D.R. Expansion of the homeostasis model assessment of β-cell function and insulin resistance to enable clinical trial outcome modeling through the interactive adjustment of physiology and treatment effects: Ihoma2. Diabetes Care 2013, 36, 2324–2330. [Google Scholar] [CrossRef] [Green Version]
  30. Kochumon, S.; Al-Rashed, F.; Abu-Farha, M.; Devarajan, S.; Tuomilehto, J.; Ahmad, R. Adipose tissue expression of ccl19 chemokine is positively associated with insulin resistance. Diabetes Metab. Res. Rev. 2019, 35, e3087. [Google Scholar] [CrossRef]
  31. Ahmad, R.; Shihab, P.K.; Thomas, R.; Alghanim, M.; Hasan, A.; Sindhu, S.; Behbehani, K. Increased expression of the interleukin-1 receptor-associated kinase (irak)-1 is associated with adipose tissue inflammatory state in obesity. Diabetol. Metab. Syndr. 2015, 7, 71. [Google Scholar] [CrossRef] [Green Version]
  32. Khadir, A.; Tiss, A.; Abubaker, J.; Abu-Farha, M.; Al-Khairi, I.; Cherian, P.; John, J.; Kavalakatt, S.; Warsame, S.; Al-Madhoun, A.; et al. Map kinase phosphatase dusp1 is overexpressed in obese humans and modulated by physical exercise. Am. J. Physiol. Endocrinol. Metab. 2015, 308, E71–E83. [Google Scholar] [CrossRef] [Green Version]
  33. Ahmad, R.; Al-Mass, A.; Al-Ghawas, D.; Shareif, N.; Zghoul, N.; Melhem, M.; Hasan, A.; Al-Ghimlas, F.; Dermime, S.; Behbehani, K. Interaction of osteopontin with il-18 in obese individuals: Implications for insulin resistance. PLoS ONE 2013, 8, e63944. [Google Scholar] [CrossRef] [Green Version]
  34. Lumeng, C.N.; Saltiel, A.R. Inflammatory links between obesity and metabolic disease. J. Clin. Investig. 2011, 121, 2111–2117. [Google Scholar] [CrossRef] [Green Version]
  35. Sheng, L.; Ye, L.; Zhang, D.; Cawthorn, W.P.; Xu, B. New insights into the long non-coding rna sra: Physiological functions and mechanisms of action. Front. Med. 2018, 5, 244. [Google Scholar] [CrossRef]
  36. Liu, S.; Sheng, L.; Miao, H.; Saunders, T.L.; MacDougald, O.A.; Koenig, R.J.; Xu, B. Sra gene knockout protects against diet-induced obesity and improves glucose tolerance*. J. Biol. Chem. 2014, 289, 13000–13009. [Google Scholar] [CrossRef] [PubMed] [Green Version]
  37. Xu, B.; Gerin, I.; Miao, H.; Vu-Phan, D.; Johnson, C.N.; Xu, R.; Chen, X.W.; Cawthorn, W.P.; MacDougald, O.A.; Koenig, R.J. Multiple roles for the non-coding rna sra in regulation of adipogenesis and insulin sensitivity. PLoS ONE 2010, 5, e14199. [Google Scholar] [CrossRef] [Green Version]
  38. Liu, Y.; Ji, Y.; Li, M.; Wang, M.; Yi, X.; Yin, C.; Wang, S.; Zhang, M.; Zhao, Z.; Xiao, Y. Integrated analysis of long noncoding rna and mrna expression profile in children with obesity by microarray analysis. Sci. Rep. 2018, 8, 8750. [Google Scholar] [CrossRef] [PubMed] [Green Version]
  39. Sun, J.; Ruan, Y.; Wang, M.; Chen, R.; Yu, N.; Sun, L.; Liu, T.; Chen, H. Differentially expressed circulating lncrnas and mrna identified by microarray analysis in obese patients. Sci. Rep. 2016, 6, 35421. [Google Scholar] [CrossRef] [Green Version]
  40. Zhou, X.; Han, X.; Wittfeldt, A.; Sun, J.; Liu, C.; Wang, X.; Gan, L.-M.; Cao, H.; Liang, Z. Long non-coding rna anril regulates inflammatory responses as a novel component of nf-κb pathway. RNA Biol. 2016, 13, 98–108. [Google Scholar] [CrossRef] [PubMed] [Green Version]
  41. Gao, H.; Kerr, A.; Jiao, H.; Hon, C.C.; Rydén, M.; Dahlman, I.; Arner, P. Long non-coding rnas associated with metabolic traits in human white adipose tissue. EBioMedicine 2018, 30, 248–260. [Google Scholar] [CrossRef] [PubMed] [Green Version]
Figure 1. Increased adipose tissue SRA expression in obese individuals without diabetes. Adipose tissue samples were obtained from individuals with various BMI. Samples were divided into lean, overweight, and obese sub-groups. Total cellular RNA was isolated from adipose tissue, and gene expression was determined by real time RT-PCR. Relative mRNA expression was presented as fold SRA1 change. Each dot represents the individual value of SRA1, and the line represents mean value. (A) SRA1 expression in lean, overweight, and obese individuals without and with diabetes. ND represents individuals without diabetes. T2D represents individuals with type 2 diabetes; (B) correlation between SRA1 gene expression and BMI (kg/m2) in ND population; (C) correlation between SRA1 gene expression and body fat (%) in ND population. Data are represented as mean ± SEM. Statistical analysis between groups was performed using two-tailed Student’s t-test. p < 0.05 was considered as statistically significant.
Cells 10 02602 g001
Figure 2. Increased SRA1 protein expression in obese adipose tissue. (A,B) Increased SRA1 protein expression in obese adipose tissue. Adipose SRA1 protein expression was determined by immunohistochemistry (IHC) in 8 lean, 6 overweight, and 9 obese individuals. The representative images obtained from five independent determinations with similar results show elevated adipose SRA1 protein expression in overweight and obese individuals compared with lean: (A) 40× magnification of IHC images. Statistical analysis between groups was performed using two-tailed Student’s t-test. p < 0.05 was considered as statistically significant.
Cells 10 02602 g002
Figure 3. Heat map of the correlation of SRA1 expression with inflammatory markers in adipose tissue.
Cells 10 02602 g003
Table 1. List of TaqMan gene expression assays.
Gene NameAssay IDGene NameAssay ID
SRA1Hs00398296_g1IL1βHs01555410_m1
CCL2Hs00234140_m1IL2Hs00174114_m1
CCL3Hs04194942_s1 IL5Hs01548712_g1
CCL5Hs00982282_m1IL6Hs00985639_m1
CCL7Hs00171147_m1IL8Hs00174103_m1
CCL8Hs04187715_m1IL10Hs00961622_m1
CCL11Hs00237013_m1IL12AHs01073447_m1
CCL15Hs00361122_m1IL13Hs00174379_m1
CCL18Hs00268113_m1IL18Hs01038788_m1
CCL19Hs00171149_m1 IL23AHs00900828_g1
CCL20Hs01011368_m1IL33Hs00369211_m1
CXCL9Hs00171065_m1IL1RL1Hs00545033_m1
CXCL10Hs01124251_g1IL2RAHs00907779_m1
CXCL11Hs04187682_g1CCR1Hs00928897_s1
TNF-αHs01113624_g1CCR2Hs00704702_s1
IFNβHs01077958_s1CCR5Hs99999149_s1
TGF-βHs00820148_g1GAPDHHs03929097_g1
Table 2. Demographic and clinical characteristics of study population.
Total Participants (n = 108)
Non-Diabetic (n = 55)Diabetic (n = 53)
LeanOverweightObeseLean vs. OverweightLean vs. ObeseLeanOverweightObeseLean vs. OverweightLean vs. ObeseNon-Diabetic vs. Diabetic
(n = 8)(n = 19)(n = 28)(n = 4)(n = 13)(n = 36)
(p)(p) (p)(p)(p)
Age (years)42.00 (36.00–50.25)42.00 (35.00–52.00)46.50 (36.00–59.00)0.6880.38756 (49.75–57.75)54.00 (53.00–57.00)53.00 (46.00–58.00)0.6080.557<0.001
Weight (kg)61.00 (58.40–77.33)79.00 (70.20–88.00)91.75 (84.83–105.70)0.004<0.000168.85 (57.9–69.75)77.7 (72.5–85.25)93.50 (83.08–99.70)0.0240.0010.327
Height (cm)1.66 (1.55–1.80)1.67 (1.59–1.76)1.65 (1.55–1.73)0.9060.4221.65 (1.538–1.665)1.66 (1.61–1.72)1.69 (1.58–1.73)0.4610.2230.784
BMI (kg/m2)23.81 (22.07–24.56)28.43 (27.26–29.4)35.20 (31.65–37.23)<0.0001<0.000124.99 (24.28–25.59)28.2 (27.13–28.87)33.35 (31.47–35.56)0.0130.0010.417
Waist circumference (cm)81.00 (77.00–97.00)96 (89–101.8)109.00 (99.00–117.00)0.014<0.000182 (76–87)98.00 (93.00–103.00)110 (104.5–114)0.0240.0050.052
HIP circumference (cm)103.00 (91.50–105.00)103.50 (97.00–111.5)120.00 (109.50–125.00)0.324<0.0001100.00 (93.00–106.00)104.00 (101.00–111.00)113.80 (110.00–120.80)0.2730.0150.768
WHR0.82 (0.74–0.94)0.95 (0.82–1.02)0.91 (0.81–1.00)0.1050.0720.8172 (0.78–0.87)0.93 (0.90–1.01)0.9571 (0.8789–1.018)0.0160.0210.089
Body fat (%)26.90 (22.30–36.70)30.9 (28.43–37.63)39.90 (36.78–43.63)0.074<0.000134.8 (27.70–36.50)30.7 (26.00–37.30)38 (32.2–41.85)0.9380.1810.984
Fasting plasma glucose (mM)4.90 (4.32–5.18)5.1 (4.9–5.43)5.20 (4.75–5.88)0.270.1867.7 (5.65–9.953)8.72 (6.92–11.13)8.15 (6.6–10.03)0.3620.471<0.0001
Triglycerides (mmol/L)0.62 (0.43–0.89)1.3 (0.64–1.65)1.05 (0.72–1.53)0.0140.0420.97 (0.47–1.88)1.79 (0.84–2.40)1.395 (1.113–1.818)0.2250.131<0.001
Total cholesterol (mmol/L)5.35 (3.88–6.04)5 (4.48–5.42)4.75 (4.16–6.05)0.7690.9434.48 (3.8–6.54)4.09 (3.85–5.56)4.94 (4.1–5.745)0.5440.7010.314
HDL cholesterol (mmol/L)1.59 (1.18–2.01)1.2 (1.08–1.36)1.16 (1.02–1.38)0.0330.0411.14 (0.97–1.3)1.03 (0.89–1.31)1.11 (0.95–1.36)0.6710.8350.096
LDL (mmol/L)3.55 (2.33–3.93)3.1 (2.6–3.7)3.25 (2.60–4.00)0.9950.7462.9 (2.38–4.63)2.3 (1.8–3.55)2.85 (2.275–3.75)0.2020.6860.069
HbA1c (%)5.50 (5.15–5.85)5.5 (5.18–5.73)5.83 (5.43–5.98)0.9460.4047.3 (5.90–8.70)7.7 (6.575–10.18)8.1 (7.35–9.175)0.5440.367<0.0001
Fasting insulin (mU/L)5.56 (5.04–11.51)6.08 (4.99–15.67)17.38 (7.32–34.58)0.4480.01513.37 (4.08–30.63)10.37 (6.277–17.16)17.15 (7.909–43.42)0.7350.480.008
HOMA-IR1.31 (1.00–2.53)1.351 (1.16–3.61)4.09 (1.89–10.91)0.4190.015.53 (1.11–7.49)3.03 (2.59–6.01)5.74 (3.078–17.69)0.7350.377<0.0001
SRA1 mRNA(Fold level)1.74 (1.59–1.85)1.822 (1.23–2.20)2.03 (1.75–2.57)0.4890.0152.51 (1.26–3.01)1.69 (1.24–1.90)1.814 (1.35–2.567)0.2960.4190.373
BMI, body mass index; WHR, Waist/Hip ratio; HDL, high-density lipoprotein; LDL, low-density lipoprotein; HbA1c, glycated hemoglobin.
Table 3. Correlation of SRA1 expression level with various clinical and biochemical markers.
All Participants
(n = 108)
Non-Diabetic
(n = 55)
Diabetic
(n = 53)
Lean
(n = 12)
Overweight
(n = 32)
Obese
(n = 64)
rprprprprprp
Age0.0520.5940.1020.4580.0750.5960.3510.2630.0470.800−0.0070.957
Weight0.0920.3440.2000.1430.0120.9300.664 *0.0180.1540.399−0.1360.285
Height −0.1090.263−0.1440.294−0.0820.5620.4230.1700.0940.608−0.280 *0.025
BMI0.221 *0.0220.435 **0.0010.1210.390.5520.0630.1920.2940.1250.327
PBF0.216 *0.0440.335 *0.0250.0270.863−0.2480.489−0.0950.6390.2140.128
Waist0.1210.260.291 *0.0470.020.9020.646 *0.0430.0770.698−0.0840.559
Hip0.1560.1410.1570.2870.150.3430.3340.3450.1760.371−0.0260.855
WHR−0.0040.9740.1630.274−0.0810.6120.3090.385−0.0530.791−0.0360.804
GLU−0.0250.7970.0750.586−0.0880.5350.2490.436−0.1380.46−0.0580.646
TGL0.0070.940.2000.143−0.0970.4950.0630.8460.0750.690−0.0760.548
Chol0.0040.9710.0230.866−0.0430.7620.0420.8970.0280.8820.0050.967
HDL0.0730.459−0.0150.9130.1640.249−0.4270.1670.0820.6610.1830.151
LDL−0.0170.863−0.0420.760−0.0060.9650.0740.819−0.0930.6190.0140.914
HbA1c−0.1630.0960.1640.235−0.349 *0.0110.3990.198−0.417 *0.022−0.2140.089
Insulin0.242 *0.0260.44 **0.0050.0650.6730.0090.9790.2770.1620.1790.229
HOMA-IR0.235 *0.030.433 **0.0050.1080.4810.3090.3550.1920.3370.1740.242
BMI, body mass index; PBF, percent body fat; WHR, waist/hip ratio; GLU, fasting plasma glucose; TGL, plasma triglycerides; Chol, cholesterol; HDL, high-density lipoprotein; LDL, low-density lipoprotein; HbA1c, glycated hemoglobin; HOMA-IR, homeostatic model assessment. * p < 0.05, and ** p < 0.01.
Table 4. Correlation of the SRA1 expression levels with inflammatory markers in adipose tissue.
All Participants
(n = 108)
Non-Diabetic
(n = 55)
Diabetic
(n = 53)
Lean
(n = 12)
Overweight
(n = 32)
Obese
(n = 64)
rprprprprprp
CCL20.234 *0.0170.1220.3840.385 **0.0060.5830.099−0.0450.8090.256 *0.043
CCL30.0910.3660.298 *0.0360.0110.9380.0360.9150.1320.470−0.0570.669
CCL50.1460.1700.0370.8100.2010.1800.2860.493−0.2910.1060.433 **0.002
CCL70.1200.2290.1610.2600.1870.1900.682 *0.021−0.1060.5830.0190.882
CCL80.262 *0.0110.344 *0.0210.2020.169−0.0330.9320.0410.8390.294 *0.027
CCL110.0650.5170.0750.6030.0930.5110.3820.276−0.1650.3750.0700.594
CCL15−0.0330.739−0.0780.5730.0360.799−0.0560.863−0.2340.1980.1480.246
CCL180.0920.3530.1880.1780.0750.600−0.3330.3470.1320.4720.0280.827
CCL19−0.1650.098−0.0850.550−0.1450.315−0.1120.729−0.427 *0.017−0.1010.446
CCL200.0370.7110.0390.7830.0660.6430.4910.150−0.2330.2080.0340.791
CXCL90.215 *0.0290.0690.6180.379 **0.0080.2640.433−0.2150.2450.408 **0.001
CXCL100.280 **0.0040.2320.0920.437 **0.0020.4790.162−0.0280.8820.282 *0.028
CXCL110.368 ***<0.0010.400 **0.0030.421 **0.0020.1120.7290.1110.5610.440 ***<0.001
TNF-α0.413 ****<0.00010.317*0.0300.505 ***<0.0010.810*0.0150.0010.9950.504 ****<0.0001
IFNβ0.0940.336−0.0360.7980.1890.175−0.0350.914−0.0440.8140.2090.100
TGF-β0.438 ****<0.00010.514 ****<0.00010.348 *0.0140.3210.3650.3170.0820.430 **0.001
IL1β0.0680.5470.0030.9830.1270.4360.2140.645−0.1020.6220.1190.422
IL20.0210.8340.0930.510−0.0020.9910.0980.762−0.1600.3900.0770.550
IL50.1320.191−0.0430.7640.297 *0.040−0.1450.670−0.1410.4830.264 *0.039
IL6−0.0890.3780.0330.820−0.1450.3090.0330.932−0.2940.115−0.0230.861
IL8−0.0750.465−0.0100.948−0.1000.484−0.1900.651−0.1080.561−0.1480.269
IL100.1520.1290.2260.1070.1630.2640.667 *0.0500.0430.8140.1730.186
IL12A0.0510.641−0.0360.8220.1260.4040.3210.482−0.2160.2700.0700.621
IL130.205 *0.0440.310 *0.0280.1580.2880.3210.3650.0910.6270.2360.080
IL180.371 ***<0.0010.547 ****<0.00010.2140.1440.4670.2050.3560.0580.295 *0.021
IL23A0.1120.2520.0560.6880.1690.227−0.2800.379−0.2050.2590.379 **0.002
IL330.0560.5720.0110.9400.0870.534−0.0980.762−0.0260.8880.1340.298
IL1RL10.0340.748−0.0240.8720.1290.3820.0001.000−0.2310.2190.1630.226
IL2RA0.197 *0.041−0.0980.4780.461 **0.001−0.0210.948−0.0330.8590.274 *0.028
CCR10.258 **0.0090.2460.0820.299 *0.0330.2480.489−0.0670.7170.417 **0.001
CCR20.0050.962−0.0660.6600.1320.4000.0290.957−0.453 **0.0090.278 *0.046
CCR50.1340.1760.1440.3010.2600.0710.4300.214−0.2270.2270.1940.129
CCL, Chemokine (C-C motif) ligand; CXCL, chemokine (C-X-C motif) ligand; TNF-α, tumor necrosis factor alpha; IFNβ,Interferon beta; TGF-β, transforming growth factor beta; IL, interleukin;. CCR, C-C chemokine receptor. * p < 0.05, ** p < 0.01, *** p < 0.001, and **** p < 0.0001.
Table 5. Multiple linear regression analysis.
Multiple Regression Analysis
All participants (n = 108)ANOVAR2 = 0.29p value < 0.0001
Predictor VariableTGF-ββ value = 0.287p value = 0.004
IL18β value = 0.286p value = 0.004
CXCL11β value = 0.237p value = 0.009
Non-Diabetic (n = 55)ANOVAR2 = 0.41p value < 0.0001
Predictor VariableTGF-ββ value = 0.419p value = 0.002
IL18β value = 0.326p value = 0.014
Diabetic (n = 53)ANOVAR2 = 0.24p value = 0.0001
Predictor VariableTNF-αβ value = 0.434p value = 0.001
IL2RAβ value = 0.259p value = 0.044
Lean (n = 12)ANOVAR2 = 0.79p value = 0.002
Predictor VariableTNF-αβ value = 0.90p value = 0.002
Overweight (n = 32)ANOVAR2 = 0.158p value = 0.014
Predictor VariableCCR2β value = −0.430p value = 0.014
Obese (n = 64)ANOVAR2 = 0.33p value < 0.0001
Predictor VariableTNF-αβ value = 0.412p value = 0.001
IL18β value = 0.311p value = 0.010
Publisher’s Note: MDPI stays neutral with regard to jurisdictional claims in published maps and institutional affiliations.

