Abstract
Tillage plays a major role in nutrient dynamics under dryland cropping systems, but there remains uncertainty regarding the long-term impacts of tillage on nutrient availability. The objective of this study was to examine the influence of tillage intensity and timing on micronutrient concentration of soils and winter wheat (Triticum aestivum L.) under dryland winter wheat–pea (Pisum sativum L.) or WW-P rotation. The treatments included moldboard tillage in fall (FT) and spring (ST), disk/chisel tillage (DT), and no-tillage (NT). The concentrations of Mehlich III extractable boron, manganese, zinc, copper, and iron in soil were unaffected by the tillage methods; however, a significant decline in extractable zinc in the top 10 cm soil was observed compared to an adjacent undisturbed grass pasture (GP) (NT: 2.3 mg kg−1 vs. GP: 6.0 mg kg−1). In the upper 10 cm soil surface, NT (123 mg kg−1) maintained the extractable manganese concentration with GP (175 mg kg−1) whereas FT (97 mg kg−1), ST (92 mg kg−1), and DT (113 mg kg−1) had lower manganese than GP. Soil pH declined in the upper 10 cm under NT more than in the rest of the WW-P treatments. The results suggest NT can play a vital role in sustaining micronutrient availability due to decreased soil pH and the greater amount of organic matter within the surface soil of NT compared to other tillage methods.
1. Introduction
The growing global population and demand for food have led to intensive agriculture production [1] and an increased percentage of dryland cultivation area [2]. Agricultural practices impact the nutrient supplying capacity of soil [3], and these impacts are more evident in drylands than in irrigated lands [4]. However, there is uncertainty about how these practices affect soil nutrients in the long-term. Therefore, it is essential to assess the potential impact of agricultural practices, such as tillage and crop rotation in drylands, as such lands will be a crucial resource for future global food supply [2].
Tillage intensities greatly influence macro- and micronutrient availability in soil [4]. The quantity of mineralizable organic forms of micronutrient increases with the accumulation of soil organic matter (SOM), whereas nutrients become unavailable or decline when SOM decreases [5]. Soil under conservation tillage (no-tillage, NT; or chisel plowing, CP) had a greater amount of SOM than soil under conventional moldboard tillage [6]. Consequently, greater concentrations of some soil-extractable micronutrients, such as Mn and Zn, were reported under NT compared to conventional tillage [7]. Other researchers have reported that NT enhanced the conversion of Fe and Mn oxides to exchangeable forms compared to conventional tillage, due to low soil pH and a high amount of SOM in NT plots than in conventionally tilled plots [8]. On the other hand, Hickman [9] reported that the tillage system did not affect extractable concentrations of soil Cu and Zn. These conflicting results encouraged us to investigate the long-term impact of tillage methods on the dynamics of micronutrients in the drylands of the Pacific Northwest (PNW).
Timing of tillage methods is another important factor in the dryland winter wheat cropping systems of the PNW because wheat is grown once in a 24-month period in the PNW [10]. In this traditional system, practiced over 100 years in the PNW, land is left bare for 14 months (if fallowed) or 10 months (if pea could be incorporated into the rotation, which depends on the amount of rainfall). Soils in this system are without crop or crop residue, and exposed to wind and water erosion due to lack of cover during this long period [10,11,12]. If tillage is delayed and implemented in spring instead of fall, there will be residue cover to protect the soil from erosion, and rainfall impacts can be reduced, water infiltration may increase, and evaporation may be reduced [10]. Consequently, the dynamics of SOM may be affected by tillage timing, which also impacts nutrient cycling.
The availability of micronutrients in soil significantly affects the productivity and quality of crops [3]. Therefore, changes in the plant-available micronutrients in the soil are not only important for plant nutrition, but also for livestock and human nutrition. The importance of the connection between plant–human nutrition is evident in studies that have documented Zn deficiency as the most widespread micronutrient deficiency limiting crop production [13]. Moreover, it was estimated that more than two billion people may have inadequate intake of Zn, and elevated CO2 levels may exacerbate the problem with Zn and other nutrient deficiencies [14]. A recent review reported that climate change and elevated CO2 concentration will influence the nutrients in food, possibly decreasing Zn and Fe concentrations in cereals and legumes [14].
Most studies on tillage systems investigated changes in the soil C, N, and P. Few studies have examined changes in micronutrients as influenced by tillage systems in long-term experiments [15,16]. Furthermore, very few studies examined changes in micronutrients concentrations with soil depths over time. No-tillage and reduced tillage systems have been adopted in the PNW region; however, there is no information on micronutrient dynamics in the winter wheat–dry pea rotation (WW-P) cropping system.
The objectives of the present study were to (i) examine the long-term impact of tillage timing and intensity on the concentration and distribution of plant essential micronutrients at four soil depths (0–10, 10–20, 20–30, and 30–60 cm), and in wheat grain and straw; and (ii) determine the change in plant essential micronutrients in soil after 52 years of continuous cultivation under WW-P by comparing micronutrient data from WW-P plots with that of nearby undisturbed grass pasture (GP) under a dryland of eastern Oregon. We hypothesized that tillage which leaves a greater amount of residue for a longer period of time on the soil surface and causes less soil disturbance will increase micronutrient levels, or at least reduce the severity of nutrient decline compared with tillage that incorporates residue early in the season and makes a greater soil disturbance.
2. Materials and Methods
2.1. Experimental Site and Design
A tillage experiment in field plots under a dryland winter wheat–dry pea rotation was established in 1962 at the experimental station (Columbia Basin Agricultural Research Center, CBARC) of Oregon State University in Adams, eastern Oregon (45°40′11″ N, 118°47′29″ W with 490 m elevation). The soil is a well-drained, coarse-silty, mixed, superactive, mesic Typic Haploxerolls soil derived from loess [17]. The average annual precipitation at the station is around 437 mm and 90% of its precipitation occurs during the winter (November–June) [17]. According to the CBARC station report, the 85-year average temperature of the site is 8 °C with hot dry summers and cool winters.
The winter wheat–pea long-term experiment (WP-LTE) is a randomized split-plot design with four replications. Each replication consisted of eight plots (two crops × four tillage methods), which each were 7.3 m wide and 37 m long. The reason for including two crops in each replication was to allow yearly data collection for wheat and pea. The location of the wheat and pea alternated within a replication year to year, and WW is grown once every two years. The wheat varieties grown were ‘Nugaines’ and ‘Hyslop’ during 1967–1974 and 1975–1978, respectively, and after that, ‘Stephens’ was used. Fresh pea was included in the rotation until 1991 and then replaced by dry pea. Winter wheat received 45 kg N ha−1 between 1967 and 1981. The N rate was increased to 67 kg N ha−1 in 1982, and it was further increased to 90 kg N ha−1 after 1985. Ammonium nitrate (34-0-0) was broadcast-applied as an inorganic N source until 1995, and urea ammonium nitrate (32-0-0) was shanked 12 cm deep before planting in WW phase after 1995. In pea phase, either ammonium sulfate (21-0-0-24) or ammonium phosphate sulfate (16-20-0-14) was broadcast-applied at 22 kg N ha−1.
The tillage treatments varied in timing and intensity, as discussed below:
Fall tillage (FT): This is the standard tillage management in eastern Oregon for WW-P. After the wheat harvest in fall, the wheat stubble was moldboard-plowed to a depth of ~20 cm. In the spring, the weeds were controlled by spraying with glyphosate at rates ranging from 314 to 628 g acid equivalent (a.e.) ha−1. Before seeding pea, plots were tilled twice to a depth of ~ 10–15 cm using spring-tooth harrow (John Deere CC, John Deere, Moline, IL, USA). A Dunham Cultipacker (Dunham Co., Dunham, OH, USA) was used to roller-pack the plots after seeding pea. In the summer, pea vines were moldboard-plowed again to a depth of ~20 cm, which was followed by disk harrowing to ~10 cm deep. The residue cover in the fall following pea harvest and in the fall following wheat harvest was approximately 1% and 5%, respectively.
Spring tillage (ST): Wheat stubble was left undisturbed until the spring, and it was then moldboard-plowed to a depth of ~20 cm. Secondary tillage and pea vine management were similar to those of FT. The residue cover in the fall following pea harvest and in the fall following wheat harvest was approximately 1% and 80%, respectively.
Disk/Chisel tillage (DT): Wheat stubble was roto-tilled to a depth of 10 cm in the fall after wheat harvest, with the purpose of breaking up the wheat stubble. A V-shaped Noble sweep (Noble Farms Ltd., Nobleford, AB, Canada) was used to sweep the weeds after glyphosate-spraying on the plots. After sowing pea, plots were roller packed. Pea vines were swept after pea harvest in July to stop pea vine growth and water use. In the following fall, a chisel plow was used twice to till to a depth of ~20 cm. The residue cover in the fall following pea harvest and in the fall following wheat harvest was approximately 10% and 40% respectively.
No-tillage (NT): This plot was under minimum tillage before 1995. Therefore, up to the date of this study, the NT plot is “only” 20 years old (compared with 52 years for other treatments). The plots were rotary-mowed to cut wheat stubble in the fall, and were swept once to a depth of ~5 cm before rod-weeding until 1995, when it was under minimum tillage. Pea vines were sprayed with glyphosate in the spring, if necessary, and rod-weeded twice. In the summer, pea vines were skew-treaded two to three times. Under this NT treatment, the residue cover in the fall following pea harvest and in the fall following wheat harvest was approximately 20% and 80%, respectively.
The WP-LTE treatments were compared to a nearby undisturbed perennial grass pasture (GP) to evaluate the changes brought by tillage over time. This plot has been serving as the baseline/reference for the LTEs at CBARC, and any differences in the micronutrient concentrations of soil samples from 2015 of this LTE from that of GP are considered 52-year effects of agricultural practices on soil micronutrients. The GP plot has been maintained since 1931 with native perennial grasses such as bluebunch wheatgrass (Agropyron spicatum Pursh) and Idaho fescue (Festuca idahoensis Pursh). We had studied tillage effects on macronutrients and soil pH as well from this LTE, which has been recently published [18]. Since soil pH plays a major role in determining micronutrient availability, we have included the data of soil pH from that recently published study [18] in this study.
2.2. Soil and Tissue Sampling and Laboratory Analysis
Soil cores from 1995, 2005, and 2015 were used in this study. Archived soil and tissue (wheat grain and straw) samples from 1995 and 2005 were provided by CBARC and additional samples were collected in the summer of 2015. Soil samples from four depths (0–10, 10–20, 20–30, and 30–60 cm) were used in this study. The soils were collected using a truck-mounted Giddings Hydraulic Probe (Giddings Machine Company, Inc., Windsor, CO, USA) and a steel sampling tube (internal diameter 3.6 cm) after wheat harvest in summer. Soil samples from two sides of each plot were composited. The soil samples were oven-dried for 24 h at 105 °C and were roller-milled for 4 h. Wheat grain and straw were removed from the center of each treatment and were ground.
The ground soil samples were analyzed for extractable B, Mn, Fe, Zn, and Cu; and tissue samples were analyzed for total B, Mn, Fe, Zn, and Cu concentration in grain and straw. The Mehlich III extraction method [19] was used to extract the micronutrients from the soil, whereas a dry-ash method [20] was used to extract the micronutrients from the tissue. The concentrations of micronutrients were determined by inductively coupled plasma optical emission spectroscopy (ICP-OES, Model #2100 DV, Waltham, Massachusetts, USA). The analyses were carried out in the Central Analytical Lab (CAL, Oregon State University). Soil pH was determined from 10 g samples in a 1:2 soil to 0.01 M CaCl2 solution using pH electrodes after a 30 min equilibrium time.
2.3. Statistical Analysis
Firstly, we analyzed the concentrations of micronutrients among the WP-LTE treatments (analysis not reported) and found no differences among the tillage methods. Secondly, we included the reference (GP) in the analysis as a treatment of the WP-LTE to detect the micronutrient changes in the WP-LTE over time. This has been the common statistical approach in the LTEs at CBARC to determine the impacts of agricultural practices on the dynamics of soil nutrients and has been used in several studies [18,21,22]. Data were analyzed as a repeated measures analysis (RMA) of a split-plot design with four blocks, where year (1995, 2005, 2015) was used as the whole-plot factor, treatment (five levels: GP, FT, ST, DT, and NT) as the subplot factor, and responses were measured repeatedly in space at four soil depths (0–10, 10–20, 20–30, and 30–60 cm). Analysis of wheat grain and straw was conducted as a split-plot design with four blocks where year (1995, 2005, and 2015) was a whole-plot factor and tillage treatment (FT, ST, DT, and NT) was a subplot factor. We used the mixed model in the “Repeated Measures” add-in in JMP Pro 13 to analyze the soil data, whereas wheat grain and straw were analyzed by the mixed-model procedure of JMP Pro 13 [23]. However, in repeated measures analysis, the independence assumption is likely to be violated, so the Akaike information criterion [24] was used to determine the most appropriate co-variance structure and was incorporated in the model. Letter groupings were generated using a 5% level of significance for the main effects and using a 1% level of significance for interaction effects to protect Type I experimentwise error rate from overinflation. Since the units of pH are on a logarithmic scale, we converted soil pH data to H+ concentration (μmol L−1) before analyses for ANOVA. However, multiple comparisons consist of original values.
3. Results and Discussion
3.1. Soil pH
Soil pH ranged from 5.65 to 6.76 and was influenced by the tillage methods, but only in the top 10 cm soil surface under WW-P rotation (Figure 1). This result is in line with a recent study from the same LTE [25]. The NT had the lowest soil pH in the upper 10 cm soil than the rest of the treatments (Figure 1). Greater acidity in the top 10 cm soil depth under NT than FT, ST, and DT could be attributed to no or less mixing of soil with N fertilizer and organic matter. The soil pH of the GP plot (the reference) was higher than under the tillage treatments at 0–10 and 10–20 cm soil depths (Figure 1). Overall, the data from this study revealed a decline in soil pH in the top 20 cm soil depth after 52 years of continuous winter wheat–dry pea rotation cropping (Figure 1). The removal of basic cations without replenishment and the continuous application of inorganic N fertilizer could be plausible reasons for the higher acidity observed in cultivated plots than in GP. The greater decline in soil pH was observed in the top 20 cm of the soil profile than in the 30–60 cm depth (Figure 1). The reason for high pH deeper in the soil profile may be due to the high CaCO3 content of these soils with depth, and moisture stress during summer [26].
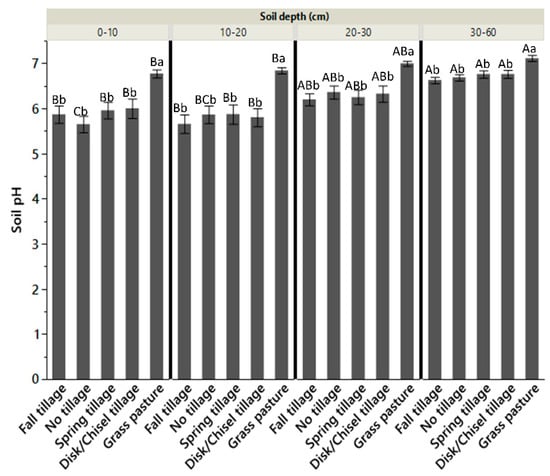
Figure 1.
The long-term effect of tillage and undisturbed grass pasture on soil pH. Uppercase letters show a comparison of each treatment across four soil depths and lowercase letters show a comparison of the treatments within each of the soil depths. Means sharing the same letter are not significantly different at 5% probability level. Error bars represent standard error of the least square mean.
The effect of soil pH on micronutrient availability is well-documented [8]. Tillage is another factor responsible for the dynamics of micronutrients [6], but the studies in this area are limited.
3.2. Mehlich III Extractable Zinc (Zn)
Table 1 shows the ANOVA of extractable micronutrients as affected by year, tillage methods, and soil depth. The concentration of Zn was comparable among the WP-LTE treatments within each soil depth (Figure 2). The concentration of Zn in the topsoil was lower under WP-LTE plots (1.5–2.4 mg kg−1) than under GP (6.0 mg kg−1), whereas at 10–20 cm soil depth, Zn under GP (2.8 mg kg−1) was greater than under NT (1.0 mg kg−1) and DT (0.96 mg kg−1), and was comparable with FT (1.4 mg kg−1) and ST (1.4 mg kg−1). The Zn concentration was greatest near the soil surface and decreased with depth (i.e., 20–30 and 30–60 cm) under NT, ST, and GP (Figure 2). This is in agreement with earlier reports on the influence of tillage on extractable Zn in the soil surface only, and was attributed to factors such as higher SOM levels and lower soil pH at the soil surface [13,27]. Furthermore, the immobility of Zn in soil could be another reason for greater Zn concentration near the soil surface than in deep soil profile.

Table 1.
ANOVA table of the main and interaction effects of year, treatment, and depth on the concentration Mehlich III extractable B, Mn, Zn, Fe, and Cu in the wheat–pea rotation long-term experiment.
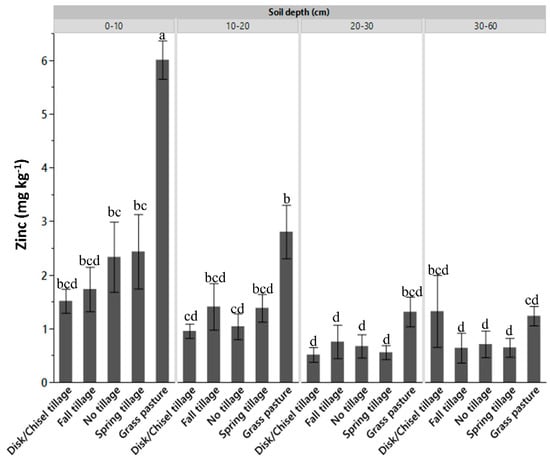
Figure 2.
The long-term effect of four tillage methods and undisturbed grass pasture on Mehlich III extractable zinc in different soil depths under winter wheat–dry pea rotation. Letters above the bars show a comparison of 20 combinations of treatment and soil depths. Bars sharing the same letter are not significantly different at 5% probability level. Error bars represent standard error of the least square mean.
3.3. Mehlich III Extractable Boron (B)
Over the 20-year period, boron concentration was comparable among the WP-LTE treatments (Table 2). Boron in the WP-LTE treatments was in the range of 4.5–4.9 mg kg−1 in 1995 and 2005 at all studied soil depths (Table 2), whereas in 2015, it increased modestly to 4.85–5.5 mg kg−1. In 2015, a significant redistribution in B was observed under FT deeper in the soil profile (20–30 and 30–60 cm) compared with the same depths in 1995 and 2005 (Table 2). This was likely due to the leaching of B or crop uptake over time (Table 2). Boron from GP was not included in the statistical analysis because B was only found in the top 10 cm depth under GP. Previous research had reported a decreased concentration of B in the soils that had a greater amount of organic matter [28]. Increased amount of SOM increases the B fixation in soil and results in less B availability [29].
Table 2.
Mean concentration of Mehlich III extractable boron obtained from the combinations of treatment, year and soil depth in the wheat–pea rotation long-term experiment (WP-LTE) at Pendleton.
3.4. Mehlich III Extractable Manganese (Mn)
No differences in Mn were observed over time between tillage methods at any of the studied soil depths. This result was in agreement with the study by Moreira et al. [30], who reported no differences in Mn between NT and moldboard tillage. However, except for NT, Mn markedly declined under WW-P long-term cultivation when compared to Mn under GP (Table 3). Averaged over the years, NT had greater Mn than that under other treatments, but when compared with GP, NT lost Mn in the top 20 cm soil depth. Although NT was the best of the WP-LTE plots, it still lost 22% Mn in 0–20 cm, after 20 years under continuous WW-P in comparison with GP. Retention of crop residue and improved SOM in the topsoil under NT were shown to improve Mn availability [30]. Continuous loss of Mn from the soil through harvest removal and without replenishment could possibly be the reason for lower Mn under WP-LTE plots than under GP. Additionally, greater accumulation of organic matter under GP could also have contributed to an increase of extractable Mn under GP than under WP-LTE plots.
Table 3.
Mean concentration of Mehlich III extractable manganese obtained from the combinations of treatment, year, and soil depth in the wheat–pea rotation long-term experiment (WP-LTE) at Pendleton.
3.5. Mehlich III Extractable Iron (Fe) and Copper (Cu)
There was no influence of tillage systems on the concentration of Fe and Cu over the time examined in this study. Edwards et al. [31] agree with our results on Cu, however, Franzluebbers and Hons [16] observed lower Cu and Fe under NT than under moldboard plow at the upper soil surface. The greater accumulation of SOM under GP could be the reason for not having greater Cu under GP than under cultivated plots because high organic matter content increases the complexation of Cu and decreases Cu availability in soil [16].
3.6. Micronutrient Accumulation in Wheat Straw and Grain over Time
Except for the concentration of B and Mn in wheat straw, no significant differences in studied micronutrients on wheat straw were observed over the examined time (Table 4). Similarly, micronutrient accumulation in wheat grain generally remained unaffected over this time (Table 4). Despite the relatively constant concentration of extractable soil B over time, tillage methods influenced the B concentration in wheat straw (Figure 3). The straw B concentration was greater under FT (6.7 mg kg−1) than under NT (5.6 mg kg−1) and DT (5.7 mg kg−1). The tillage methods did not affect straw Mn in 1995 and 2005; however, in 2015, NT and DT showed significantly (p < 0.05) greater straw Mn concentration than that in FT and ST (Figure 4). Srivastava and Gupta [29] reported that B uptake had an antagonistic impact on Mn uptake by plants as both compete for the common carrier molecule for nutrient translocation. This could be the reason for having lower straw Mn in the treatment with higher straw B in this study.
Table 4.
ANOVA table of the main and interaction effects of year and treatment on the accumulation of B, Mn, Zn, Fe, and Cu in the grain and straw of wheat–pea rotation long-term experiment (WP-LTE) at Pendleton.
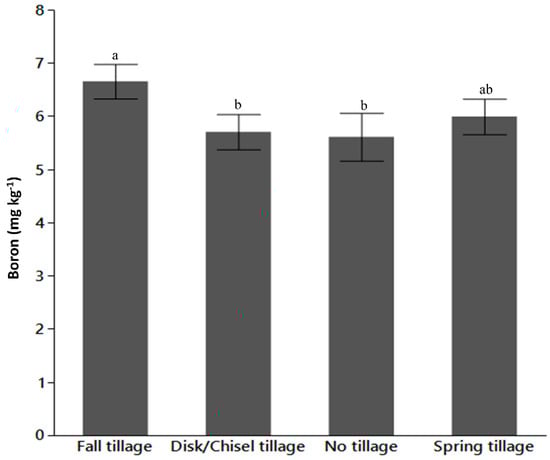
Figure 3.
The long-term effect of tillage on the boron concentration in wheat straw under winter wheat–dry pea rotation. Bars sharing the same letter are not significantly different at 5% probability level. Error bars represent standard error of the least square mean.
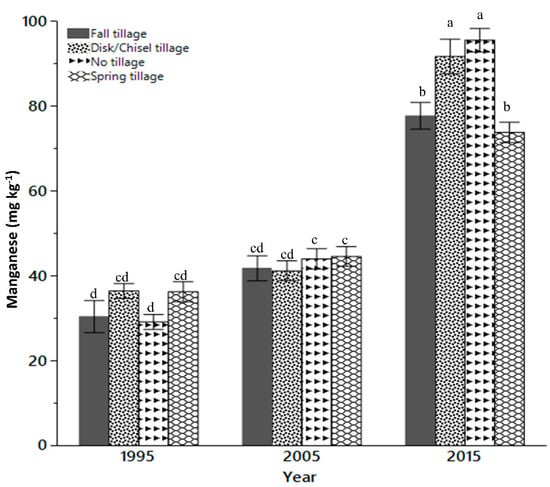
Figure 4.
Effect of tillage methods on the concentration of manganese in wheat straw over the 20-year time period. Letters above the bars show a comparison of 12 combinations of treatment and year. Bars sharing the same letter are not significantly different at 5% probability level. Error bars represent the standard error of the least square mean.
4. Conclusions
To our knowledge, this is the first study in this region that examined the concentration and distribution of the micronutrients at different soil depths as a function of tillage timing and intensities over time. Although there were similar effects of different tillage methods on extractable micronutrient availability, some positive signs of NT on micronutrient restoration in the topsoil have started to manifest. In the topsoil, only NT had a comparable concentration of manganese to the nearly undisturbed adjacent grass pasture. This suggests that a longer study is required to observe significant extractable Mn restoration in this LTE. The effect of nutrient stratification in the soil profile under NT is yet to be seen over period longer than 20 years. The decrease in micronutrient loss can be expected from a long-term no-tillage method due to the greater amount of crop residue, lower amount of soil disturbance (tillage intensity), and the low soil pH within top 10 cm soil surface. Corrective measures, such as liming, may need to be considered in NT systems to maintain soil pH over time.
Author Contributions
Conceptualization, V.D.Z.; methodology, V.D.Z., M.K., H.T.G., and B.X.; validation, V.D.Z., M.K., H.T.G., and B.X.; formal analysis, S.S.; investigation, S.S.; data curation, S.S.; writing—original draft preparation, S.S.; writing—review and editing, V.D.Z., M.K., H.T.G., and B.X.
Funding
This research was supported by Oregon State University startup funds awarded to Valtcho D. Jeliazkov (Zheljazkov).
Acknowledgments
We thank Karl Rhinhart and his crew for their help with the field soil sampling. Special thanks to Paul Rasmussen (retired), Chris Roager (retired) and coworkers at USDA Agricultural Research Service for collecting and archiving soils from long-term grass pasture plots and soil and tissue samples from wheat–pea rotation plots.
Conflicts of Interest
The authors declare no conflict of interest.
References
- Kopittke, P.M.; Dalal, R.C.; Menzies, N.W. Changes in exchangeable cations and micronutrients in soils and grains of long-term, low input cropping systems of subtropical Australia. Geoderma 2017, 285, 293–300. [Google Scholar] [CrossRef]
- Huang, J.; Ji, M.; Xie, Y.; Wang, S.; He, Y.; Ran, J. Global semi-arid climate change over last 60 years. Clim. Dyn. 2016, 46, 1131–1150. [Google Scholar] [CrossRef]
- Li, B.Y.; Zhou, D.M.; Cang, L.; Zhang, H.L.; Fan, X.H.; Qin, S.W. Soil micronutrient availability to crops as affected by long-term inorganic and organic fertilizer applications. Soil Tillage Res. 2007, 96, 166–173. [Google Scholar] [CrossRef]
- Schillinger, W.F.; Papendick, R.I. Then and now: 125 Years of dryland wheat farming in the Inland Pacific Northwest. Agron. J. 2008, 100, 166–182. [Google Scholar] [CrossRef]
- Carpenter-Boggs, L.; Stahl, P.P.D.; Lindstrom, M.J.; Schumacher, T.E. Soil microbial properties under permanent grass, conventional tillage, and no-till management in South Dakota. Soil Tillage Res. 2003, 71, 15–23. [Google Scholar] [CrossRef]
- Thomas, G.A.; Dalal, R.C.; Standley, J. No-till effects on organic matter, pH, cation exchange capacity and nutrient distribution in a Luvisol in the semi-arid subtropics. Soil Tillage Res. 2007, 94, 295–304. [Google Scholar] [CrossRef]
- Follett, R.F.; Peterson, G.A. Surface soil nutrient distribution as afected by wheat-fallow tillage systems. Soil Sci. Soc. Am. J. 1988, 52, 141–147. [Google Scholar] [CrossRef]
- Shuman, L.; Hargrove, W.L. Effect of organic matter on the distribution of manganese, copper, iron, and zinc in soil fractions. Soil Sci. 1988, 146, 1117–1121. [Google Scholar] [CrossRef]
- Hickman, M. V Long-term tillage and crop rotation effects on soil chemical and mineral properties. J. Plant Nutr. 2002, 25, 1457–1470. [Google Scholar] [CrossRef]
- Rasmussen, P.E.; Parton, W.J. Long-term effects of residue management in wheat-fallow: I. Inputs, yield, and soil organic matter. Soil Sci. Soc. Am. J. 1994, 58, 523–530. [Google Scholar] [CrossRef]
- Williams, J.D. Effects of long-term winter wheat, summer fallow residue and nutrient management on field hydrology for a silt loam in north-central Oregon. Soil Tillage Res. 2004, 75, 109–119. [Google Scholar] [CrossRef]
- Shiwakoti, S.; Zheljazkov, V.D.; Gollany, H.T.; Kleber, M.; Xing, B. Macronutrients in soil and wheat as affected by a long-term tillage and nitrogen fertilization in winter wheat-fallow rotation. Agronomy 2019, 9, 178. [Google Scholar] [CrossRef]
- Alloway, B.J. Soil factors associated with zinc deficiency in crops and humans. Environ. Geochem. Health 2009, 31, 537–548. [Google Scholar] [CrossRef] [PubMed]
- Myers, S.S.; Zanobetti, A.; Kloog, I.; Huybers, P.; Leakey, A.D.B.; Bloom, A.J.; Carlisle, E.; Dietterich, L.H.; Fitzgerald, G.; Hasegawa, T.; et al. Increasing CO2 threatens human nutrition. Nature 2014, 510, 139. [Google Scholar] [CrossRef] [PubMed]
- Mahler, L.R.; Hammel, J.E.; Harder, R.W. The influence of crop rotation and tillage methods on the distribution of extractable boron in Northern Idaho Soils. Soil Sci. 1985, 139, 67–73. [Google Scholar] [CrossRef]
- Franzluebbers, A.J.; Hons, F.M. Soil-profile distribution of primary and secondary plant-available nutrients under conventional and no tillage. Soil Tillage Res. 1996, 39, 229–239. [Google Scholar] [CrossRef]
- Gollany, H.T.; Allmaras, R.R.; Copeland, S.M.; Albrecht, S.L.; Douglas, J.C.L. Tillage and nitrogen fertilizer influence on carbon and soluble silica relations in a Pacific Northwest mollisol. Soil Sci. Soc. Am. J. 2005, 69, 1102–1109. [Google Scholar] [CrossRef]
- Shiwakoti, S.; Zheljazkov, V.D.; Gollany, H.T.; Kleber, M.; Xing, B. Effect of tillage on macronutrients in soil and wheat of a long-term dryland wheat-pea rotation. Soil Tillage Res. 2019, 190, 194–201. [Google Scholar] [CrossRef]
- Mehlich, A. Mehlich 3 soil test extractant: A modification of Mehlich 2 extractant. Commun. Soil Sci. Plant Anal. 1984, 15, 1409–1416. [Google Scholar] [CrossRef]
- Papp, C.S.E.; Harms, T.F. Comparison of digestion methods for total elemental analysis of peat and separation of its organic and inorganic components. Analyst 1985, 110, 237–242. [Google Scholar] [CrossRef]
- Awale, R.; Emeson, M.A.; Machado, S. Soil organic carbon pools as early indicators for soil organic matter stock changes under different tillage practices in inland Pacific Northwest. Front. Ecol. Evol. 2017, 5, 96. [Google Scholar] [CrossRef]
- Ghimire, R.; Machado, S.; Rhinhart, K. Long-term crop residue and nitrogen management effects on soil profile carbon and nitrogen in wheat–fallow systems. Agron. J. 2015, 107, 2230–2240. [Google Scholar] [CrossRef]
- SAS Institute Inc. SAS/STAT 9.4 User’s Guide; SAS Institute Inc.: Cary, NC, USA, 2014. [Google Scholar]
- Littell, R.C.; Henry, P.R.; Ammerman, C.B. Statistical analysis of repeated measures data using SAS procedures. J. Anim. Sci. 1998, 76, 1216–1231. [Google Scholar] [CrossRef] [PubMed]
- Awale, R.; Machado, S.; Rhinhart, K. Soil carbon, nitrogen, pH, and crop Yields in winter wheat–spring pea systems. Agron. J. 2018, 110, 1523–1531. [Google Scholar] [CrossRef]
- Unger, P.W. Organic matter, nutrient, and pH distribution in no- and conventional-tillage semiarid soils. Agron. J. 1991, 83, 186–189. [Google Scholar] [CrossRef]
- De Santiago, A.; Quintero, J.M.; Delgado, A. Long-term effects of tillage on the availability of iron, copper, manganese, and zinc in a Spanish Vertisol. Soil Tillage Res. 2008, 98, 200–207. [Google Scholar] [CrossRef]
- Nath, D.; Talukdar, M.; Chowdhury, P.; Deka, K. Forms of boron under different cropping systems in soils of Morigaon district of Assam. Int. J. Chem. Stud. 2018, 6, 1161–1166. [Google Scholar]
- Srivastava, P.C.; Gupta, U.C. Trace Elements in Crop Production; Science Publishers, Inc.: Lebanon, NH, USA, 1996; ISBN 1886106622. [Google Scholar]
- Moreira, S.G.; Prochnow, L.I.; De Castro Kiehl, J.; Pauletti, V.; Martin-Neto, L. Chemical forms in soil and availability of manganese and zinc to soybean in soil under different tillage systems. Soil Tillage Res. 2016, 163, 41–53. [Google Scholar] [CrossRef]
- Edwards, J.H.; Wood, C.W.; Thurlow, D.L.; Ruf, M.E. Tillage and crop-rotation effects on fertility status of a Hapludult soil. Soil Sci. Soc. Am. J. 1992, 56, 1577–1582. [Google Scholar] [CrossRef]
© 2019 by the authors. Licensee MDPI, Basel, Switzerland. This article is an open access article distributed under the terms and conditions of the Creative Commons Attribution (CC BY) license (http://creativecommons.org/licenses/by/4.0/).