Article

Interactive Effects of Water and Fertilizer on Yield, Soil Water and Nitrate Dynamics of Young Apple Tree in Semiarid Region of Northwest China

1
College of Agricultural Engineering, Henan University of Science and Technology, Luoyang 471003, China
2
Key Laboratory of Agricultural Soil and Water Engineering in Arid and Semiarid Areas, Ministry of Education, Northwest A&F University, Yangling 712100, China
3
School of Hydraulic and Ecological Engineering, Nanchang Institute of Technology, Nanchang 330099, China
4
Department of Plant Soils and Climate, Utah State University, Logan, UT 84322, USA
*
Authors to whom correspondence should be addressed.
Agronomy 2019, 9(7), 360; https://doi.org/10.3390/agronomy9070360
Submission received: 19 May 2019 / Revised: 25 June 2019 / Accepted: 5 July 2019 / Published: 8 July 2019
(This article belongs to the Special Issue Irrigation Strategies and Soil Management in Orchards)

Abstract

:
Exploring the interactive effect of water and fertilizer on yield, soil water and nitrate dynamics of young apple tree is of great importance to improve the management of irrigation and fertilization in the apple-growing region of semiarid northwest China. A two-year pot experiment was conducted in a mobile rainproof shelter of the water-saving irrigation experimental station in Northwest A&F University, and the investigation evaluated the response of soil water and fertilizer migration, crop water productivity (CWP), irrigation water use efficiency (IWUE), partial factor productivity (PFP) of young apple tree to different water and fertilizer regimes (four levels of soil water: 75%–85%, 65%–75%, 55%–65% and 45%–55% of field capacity, designated W1, W2, W3 and W4, respectively; three levels of N-P2O5-K2O fertilizer, 30-30-10, 20-20-10 and 10-10-10 g plant−1, designated F1, F2 and F3, respectively). Results showed that F1W1, F2W1 and F3W1 had the highest average soil water content at 0~90 cm compared with the other treatments. When fertilizer level was fixed, the average soil water content was gradually increased with increasing irrigation amount. For W1, W2, W3 and W4, high levels of water content were mainly distributed at 50~80 cm, 40~70 cm, 30~50 cm and 10~30 cm, respectively. There was no significant difference in soil water content at all fertilizer treatments. However, F1 and F2 significantly increased soil nitrate-N content by 146.3%~246.4% and 75.3%~151.5% compared with F3. The highest yield appeared at F1W1 treatment, but there was little difference between F1W1 and F2W2 treatment. F2W2 treatment decreased yield by 7.5%, but increased IWUE by 11.2% compared with F1W1 treatment. Meanwhile, the highest CWP appeared at F2W2 treatment in the two years. Thus, F2W2 treatment (soil moisture was controlled in 65–75% of field capacity, N-P2O5-K2O were controlled at 20-20-10 g·tree−1) reached the best water and fertilizer coupling mode and it was the optimum combinations of water and fertilizer saving.

1. Introduction

Apple is one of the most important cash crops in China, which plays an important role in increasing farmers’ income [1]. Semiarid northwest China is currently an important apple-growing region [2], but the shortage sources of water and the low utilization of fertilizers have restricted apple production [3]. Thus, the adoption of appropriate irrigation and fertilizer strategies is important to make full use of the soil reservoir and to improve water and nutrient use efficiency (WUE and NUE) in cultivated area of apple [4].
Water stress is the main factor limiting apple growth in semi-arid areas of China [2,3,4]. In the semi-arid areas of northwest China, almost 70% of rainfall usually occurs from July to September, and much of this is lost through evaporation because of seasonal high temperatures [5]. Due to more extensive root systems and canopy of apple than annual crops, evaporation may cause soil moisture deficits of various degrees when precipitation is limited during hot summers [3]. Thereby, highly effective utilization of precipitation and water balance are crucial for increasing apple yield and WUE in this area. Soil water condition is a dynamic process involving moisture content during a certain time and space [4]. In-depth understanding of soil moisture dynamics and balance can provide insights for developing irrigation strategies and promoting sustainable development of semi-arid area agriculture [4,6].
Fertilizer is another important factor, especially nitrogen (N) that affects crop yield, WUE and NUE [7,8,9]. In semi-arid areas, N fertilization was shown to increase crop production under dry conditions with poor water supply [10,11]. However, crop yield may be decreased with the excessive application of N fertilizer [12]. In addition, N fertilizer applied more than crop need can lead to nitrate accumulation in the soil profile and degrade both surface and groundwater resources, resulting in eutrophication and non-potable water supplies [13,14]. The different response of crop yield to fertilizer application, which occurs because of variable precipitation and differences in the fertilizer rate, might lead to loss of fertilizer under traditional farming systems [15]. Thus, it is important to explore the relationship between fertilizer rate and soil N dynamic.
However, previous studies mainly focused on the effects of single factors such as water and fertilizer on apple growth [2,16]. Water and fertilizer should be studied simultaneously to ensure better crop utilization and avoid wasting water and fertilizer. What is more, very little research has been done on water-fertilizer coupling of the young apple tree, because it is difficult to reflect the economic benefits of the seedling, which is a crucial stage in the growth process of fruit trees. The management of seedling growth directly determines the number, yield and quality of fruit in the future. Thus, the aim of the study was to evaluate the effects of water-fertilizer coupling on young apple trees yield, water and nitrate dynamics in soil profile in a semi-arid region of northwest China and provide a scientific basis for the effective management of irrigation and fertilization.

2. Materials and Methods

2.1. Description of Study Site and Materials

The experiment was conducted in a mobile rainproof shelter of the water-saving irrigation experimental station in Northwest A&F University, Yangling, Shaanxi, China (latitude 34°17’ N, longitude 108°04’ E and altitude 520 m) under natural light condition from March in 2012 to October in 2013. The station is located in a region with a semi-arid climate, the annual mean temperature is 12.5 °C, the annual mean precipitation is 500 mm and the annual mean pan evaporation is 1400 mm. The total annual sunshine duration is 2164 h with more than 210 frost-free days. There is a standard weather station with data from the National Meteorological Center of China in the experimental area, and the quality control of meteorological data has been carried out as reference [17].
The soil used in this study was taken from 0–20 cm soil profile and classified as loam type. The loam soil had pH of 7.8, soil bulk density of 1.30 g cm−3, field capacity (FC) of 24% (gravimetric), soil organic matter of 6.38 g kg−1, total-N content of 0.82 g N kg−1, total-P content of 0.55 g P kg−1, total-K content of 11.2 g K kg−1, alkali-hydrolyzable nitrogen of 48.3 mg N kg−1, available phosphorus of 13.68 mg P kg−1 and available potassium of 138.47 mg K kg−1.
The evapotranspiration barrels were used as experimental pots with a depth of 100 cm and diameter of 50 cm. They were filled homogeneously with 230 kg of air-dried soil that had been sieved with 2 mm diameter mesh. A polythene mesh (1 mm diameter), with 10 kg river sand uniformly laid on top, was positioned at the bottom of each barrel to allow for free drainage. There was no leaching from the barrel during the treatment period. To provide the similar experimental conditions with field or orchard, cement pipes (60 cm diameter, 100 cm height, 5 cm thickness) were installed vertically underground and their tops were level flat with the surface of the earth. All the experimental barrels were kept in the cement pipes under a mobile rainproof shelter covering the barrels when it rained.

2.2. Experimental Design and Treatments

The experiments consisted of four irrigation amounts and three levels of fertilization. Soil water content was actually controlled at four levels: 75%–85% FC (W1, sufficient irrigation), 65%–75% FC (W2, mild water stress), 55%–65% FC (W3, moderate water stress), 45%-55% FC (W4, severe water stress). The three levels of N-P2O5-K2O fertilizer (30-30-10: higher level, 20-20-10: medium level and 10-10-10 g tree−1: lower level, designated F1, F2 and F3, respectively) were applied to barrels. The nitrogen, phosphorus and potassium fertilizers used were urea, diammonium phosphate and potassium chloride. After all the fertilizers were dissolved in water, they were applied to the soil with the first irrigation when the experimental treatments began. The twelve treatments were replicated five times (60 experimental trees) in 2012 and three times (36 experimental trees) in 2013. The final value of water applied to each treatment was shown in Table 1.
Two-year-old young apple trees (Malus domestica Borkh., cv Runtai No. 1, on Malus sieversii Roem. rootstock), which is the new and high-yield varieties of columnar apple, were used as the experimental trees. Young apple trees were transplanted to evapotranspiration barrels on 10 March in 2012. Each barrel was irrigated to FC after transplanting and covered with vermiculite granulate on the soil surface to reduce evaporation losses of water. Plants were subjected to experimental treatments on 3 May in 2012 and 18 April in 2013 and stopped that at the end of the growth period each year. The irrigation amount was mainly controlled by oven drying method as well as assistance weighting method with an electronic hoist scale (measurement range: 4~500 kg, accuracy: 25 g, Tianchen electronic crane scales Equipment Co., Ltd, Hangzhou, China). Other management activities were conducted as local practice.

2.3. Measurements and Calculations

2.3.1. Soil Water Content

Soil moisture content in different vertical and horizontal soil layers was determined by soil-drawing and drying method, the depth interval spacing was 10 cm (from 0 to 90 cm) and the horizontal interval spacing was 5 cm (from 0 to 25 cm). The samples were oven-dried at 105 °C to a constant weight to determine soil gravimetric water content (gravimetric soil moisture, kg kg−1).

2.3.2. Nitrate-N Content

The soil nitrate-N content was measured using a spectrophotometer (UV–vis 8500II, Shanghai tianmei scientific instrument Co., Ltd, Shanghai, China). First, 0.5 g of fresh soil was placed in a 100 mL triangular flask. Then, 50 mL of a 2 mol L−1 potassium chloride solution was added. The solution was shaken for half an hour until uniformity was reached. The solution was filtered, and 5mL was placed in a spectrophotometer and examined at a wavelength of 210 nm [18]. The nitrate content was determined using colorimetric analysis. In order to determine the nitrate-N content in different soil layers, soil samples were taken from the location of 15 cm away from each experimental tree, at depth of 0 to 90 cm with intervals of 10 cm.

2.3.3. Dry Matter (DM), Evapotranspiration (ET), Crop Water Productivity (CWP)

The plant samples (24 young apple trees with the 12 treatments in each year) were oven-dried at 75 °C until they reached a constant weight in order to determine the total dry matter content (DM).
Crop evapotranspiration (ET) during the growth stage was calculated according to water balance equation outlined by Oweis et al. (2011) [19] as below:
ET = P + U + I − F − R − ΔW
where P is the precipitation; U is the groundwater recharge; I is the amount of irrigation; R is the runoff; F is the deep seepage; and ΔW is the change in soil moisture from the beginning to the end of the trial. According to the actual conditions during the experiments, the contributions of precipitation, groundwater recharge, runoff and deep seepage were negligible.
Crop water productivity (CWP, kg·m−3) was calculated as below:
CWP = DM/ET

2.3.4. Yield, Irrigation Water Use Efficiency (IWUE) and Partial Factor Productivity (PEP)

Apple was selected at crop maturity on 19 September in 2013 and weighted to obtain the fresh yield (Y).
The irrigation water use efficiency (IWUE, kg·m−3) was calculated as yield divided by ET.
IWUE = Y/ET
Partial factor productivity (PFP, kg·kg−1) was calculated as Ierna et al. (2011) [20].
PFP = Y/FT
where FT is the total amount of N-P2O5-K2O applied to young apple trees.

2.4. Data Analysis

The value of each indicator was the mean of five replicates per treatment. Using SPSS software (SPSS, Chicago, IL, USA), one-way analysis of variance (ANOVA) was conducted and multiple comparisons of means were performed using Duncan test at the 0.05 probability level (p < 0.05). Correlation and regression analysis were conducted using SigmaPlot 13.0 (Systat Software, Inc., San Jose, CA, USA).

3. Results

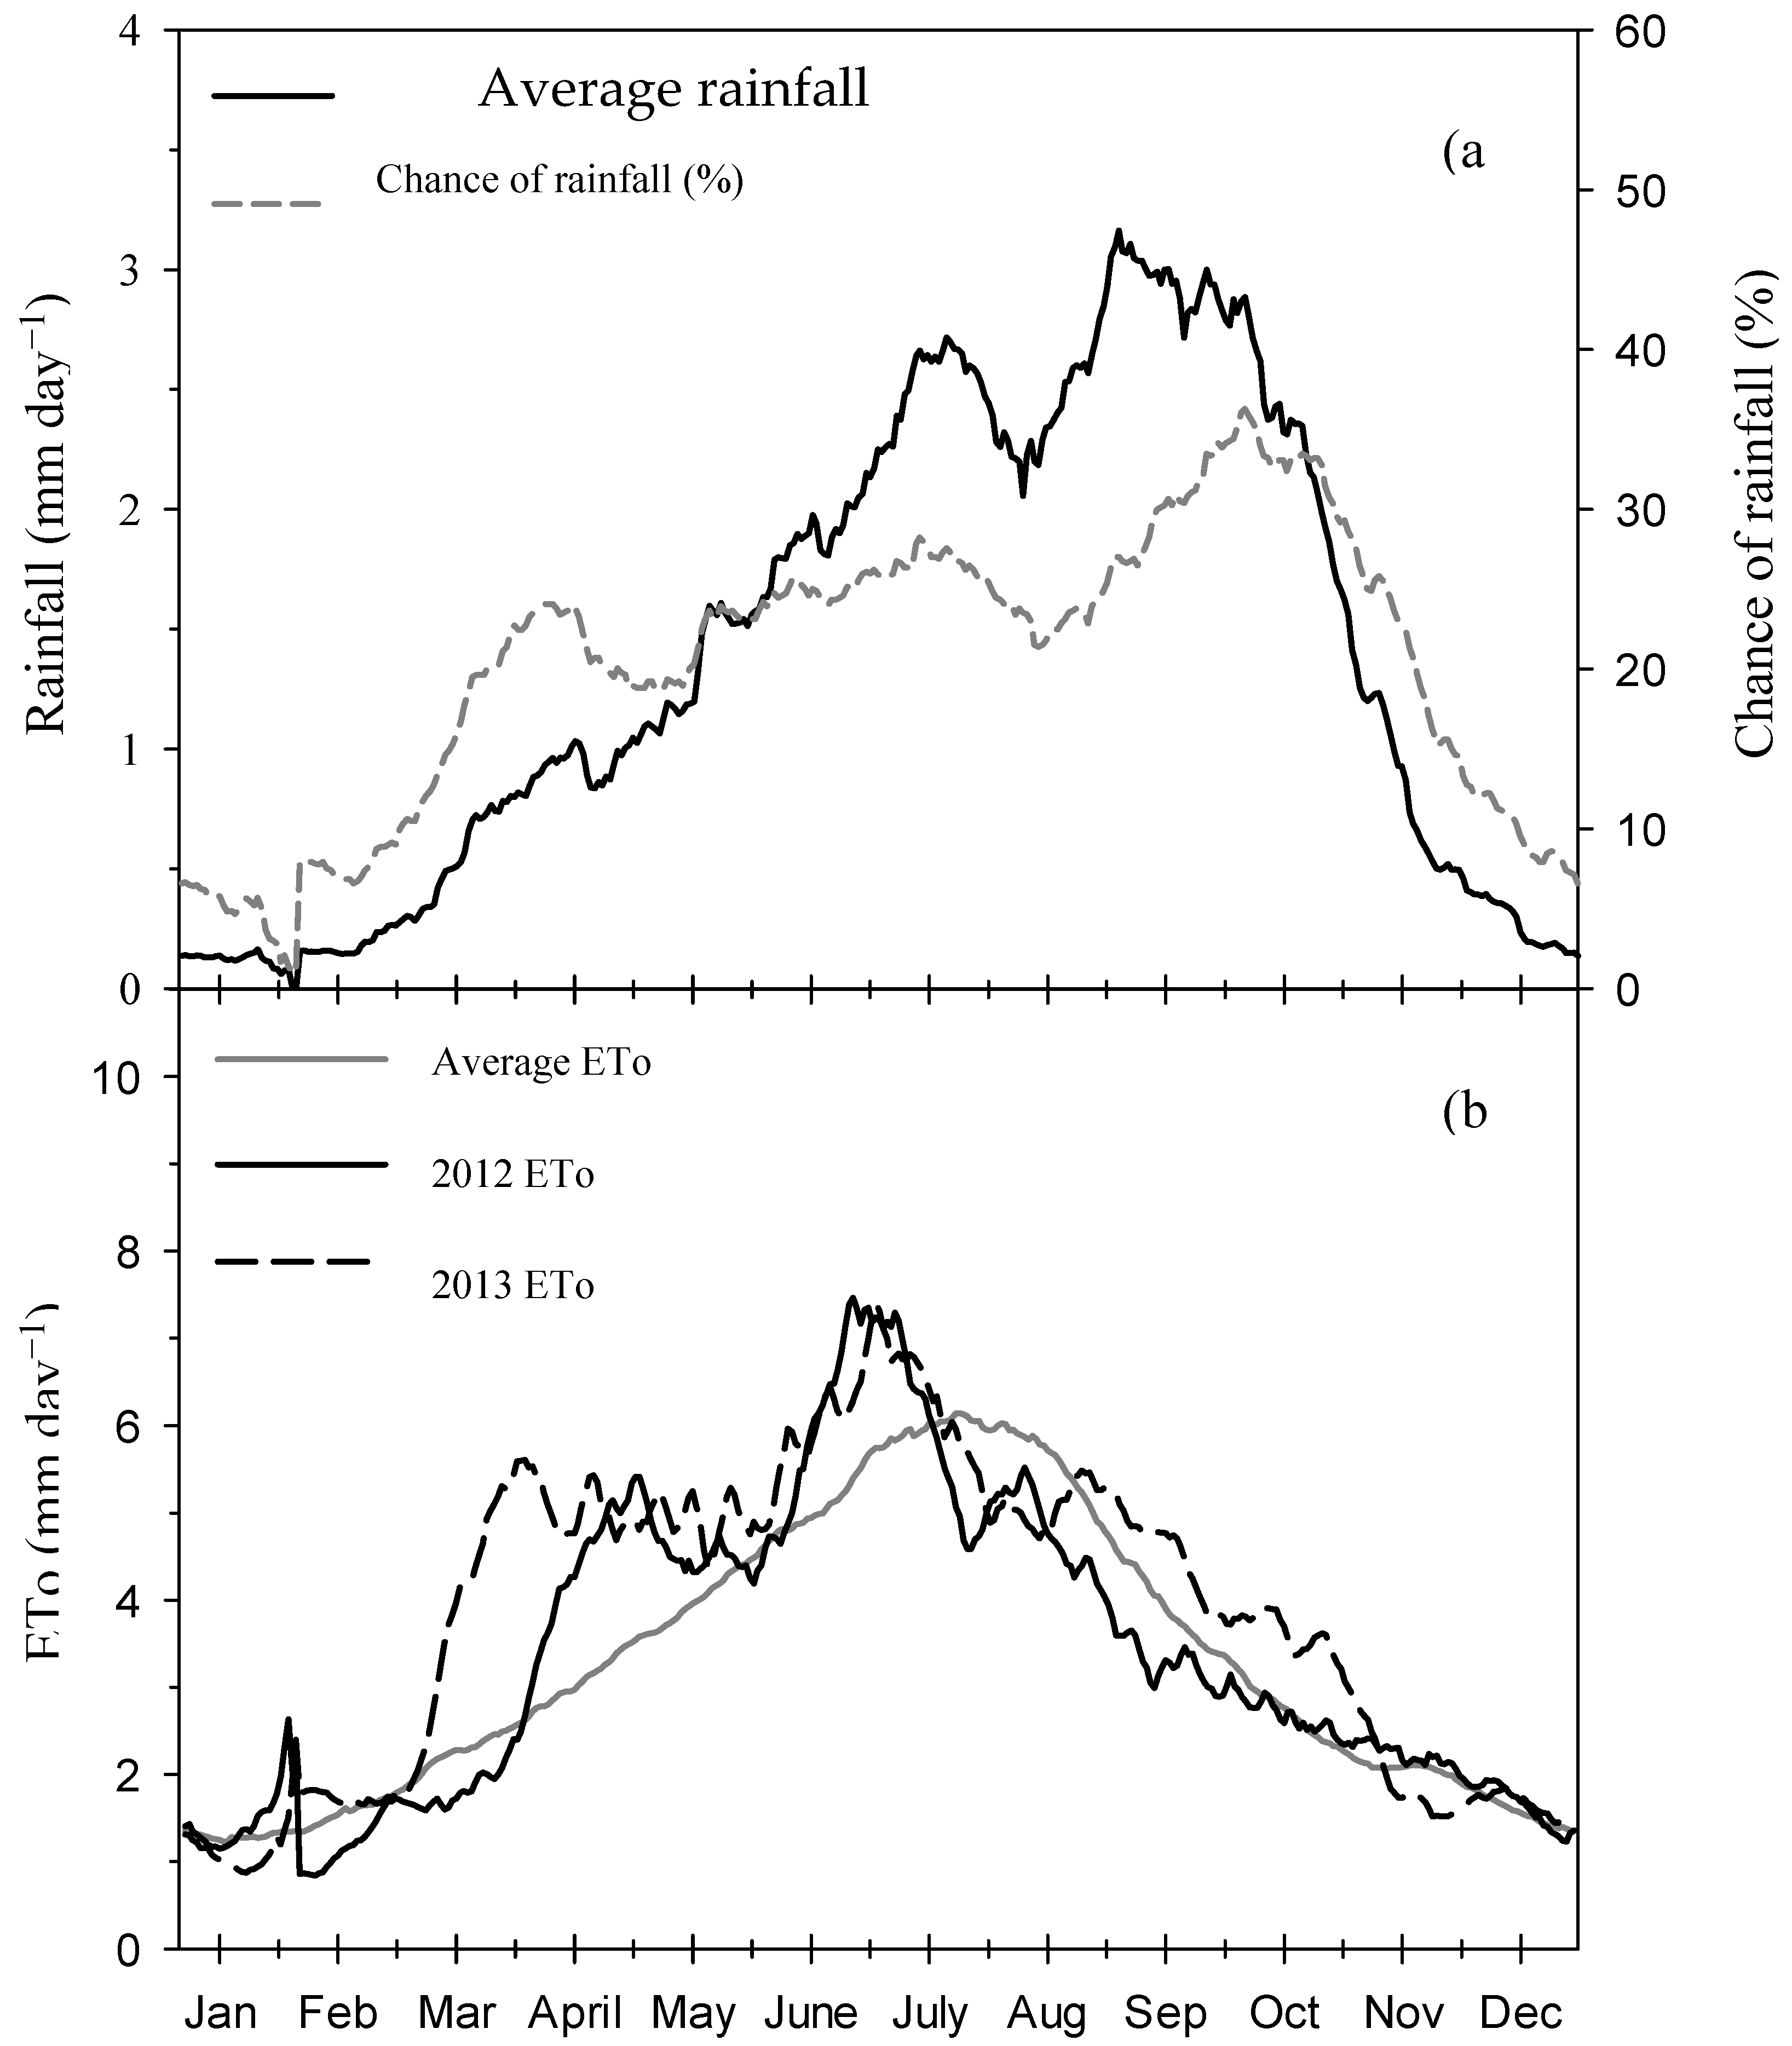
3.1. Weather Conditions and Growing Periods of CROPs

Daily meteorological data during the two experimental seasons in 2012 and 2013 are presented in Figure 1. During the critical growing stage (15 April–10 August) of the young apple trees, 24-year average daily rainfall and percentage chance of rain falling were 0.8–2.6 mm d−1 and 18%–25%, respectively. However, the cumulative reference evapotranspiration (ETo) was 4.2–7.8 mm d−1 in this period of 2012 and 2013, which was higher than the17-year average reference evapotranspiration except for July–August. Thus, precipitation during apple critical growing stage was significantly lower than the cumulative reference evapotranspiration. The heaviest precipitation mainly occurred in fruit maturation and post-harvest period, notably, a heavy rain occurred on 20 August (3.1 mm d−1, full maturation period) in 24-year average daily rainfall.

3.2. Soil Moisture Dynamics

We focused on the 2013 year to visualize the difference of soil moisture dynamics caused by water-fertilizer coupling, as shown in Figure 2 (the average of five measurements on 14 April, 15 May, 13 June, 17 July, 25 August). The F1W1, F2W1 and F3W1 had the highest average soil water content at 0~90 cm compared with the other treatments in vertical direction. When the fertilizer level was fixed, the average soil water content was gradually increased with increasing irrigation amount. For W1, W2, W3 and W4, high levels of water content were mainly distributed at 50~80 cm, 40~70 cm, 30~50 cm and 10~30 cm, respectively. There was no significant difference in soil water content at all fertilizer treatments. For all water-fertilizer coupling treatments, soil surface (0~10 cm) had lower water content compared with the other soil layers. In particular, the soil water content in F1W1, F2W1, F3W1, F1W2, F2W2 and F3W2 was expanded from 0 to 25 cm in a horizontal direction, but that was 0~20 cm in F1W3, F2W3 and F3W3 and 0~15 cm in F1W4, F2W4 and F3W4, respectively. For all treatments, the soil water content at 0~15 cm was significantly higher than that at 15~25 cm in horizontal direction.

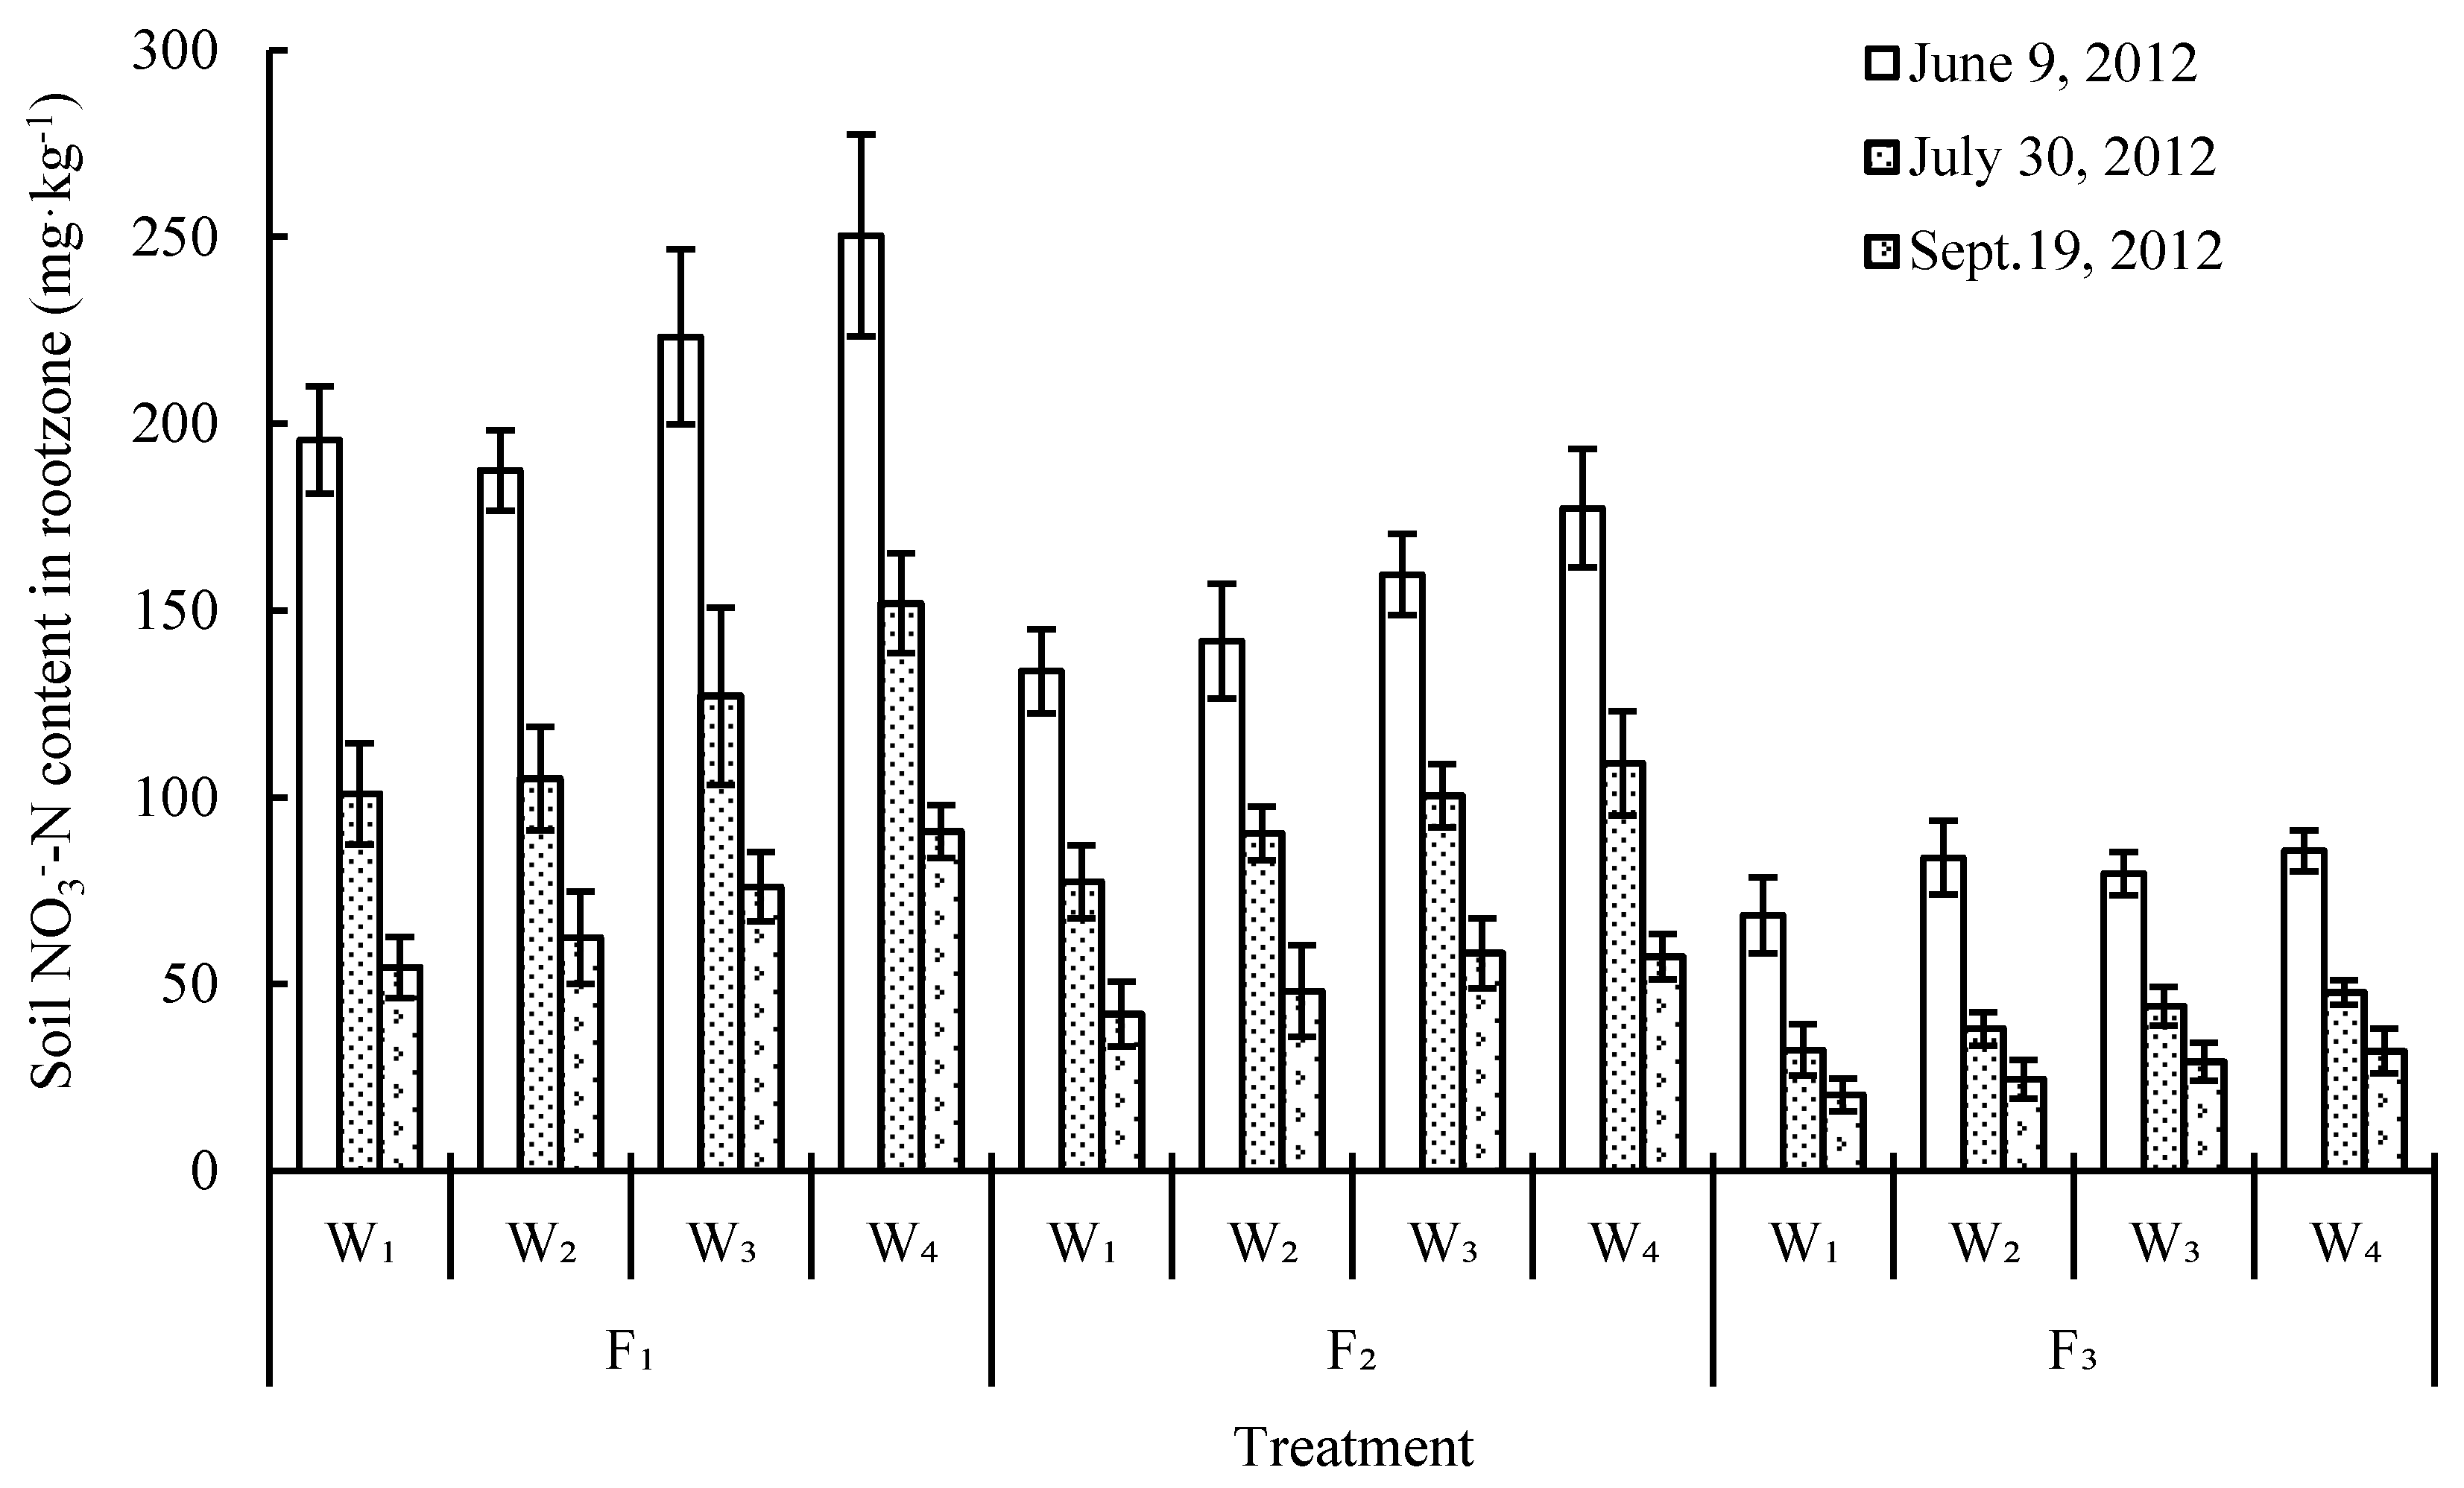
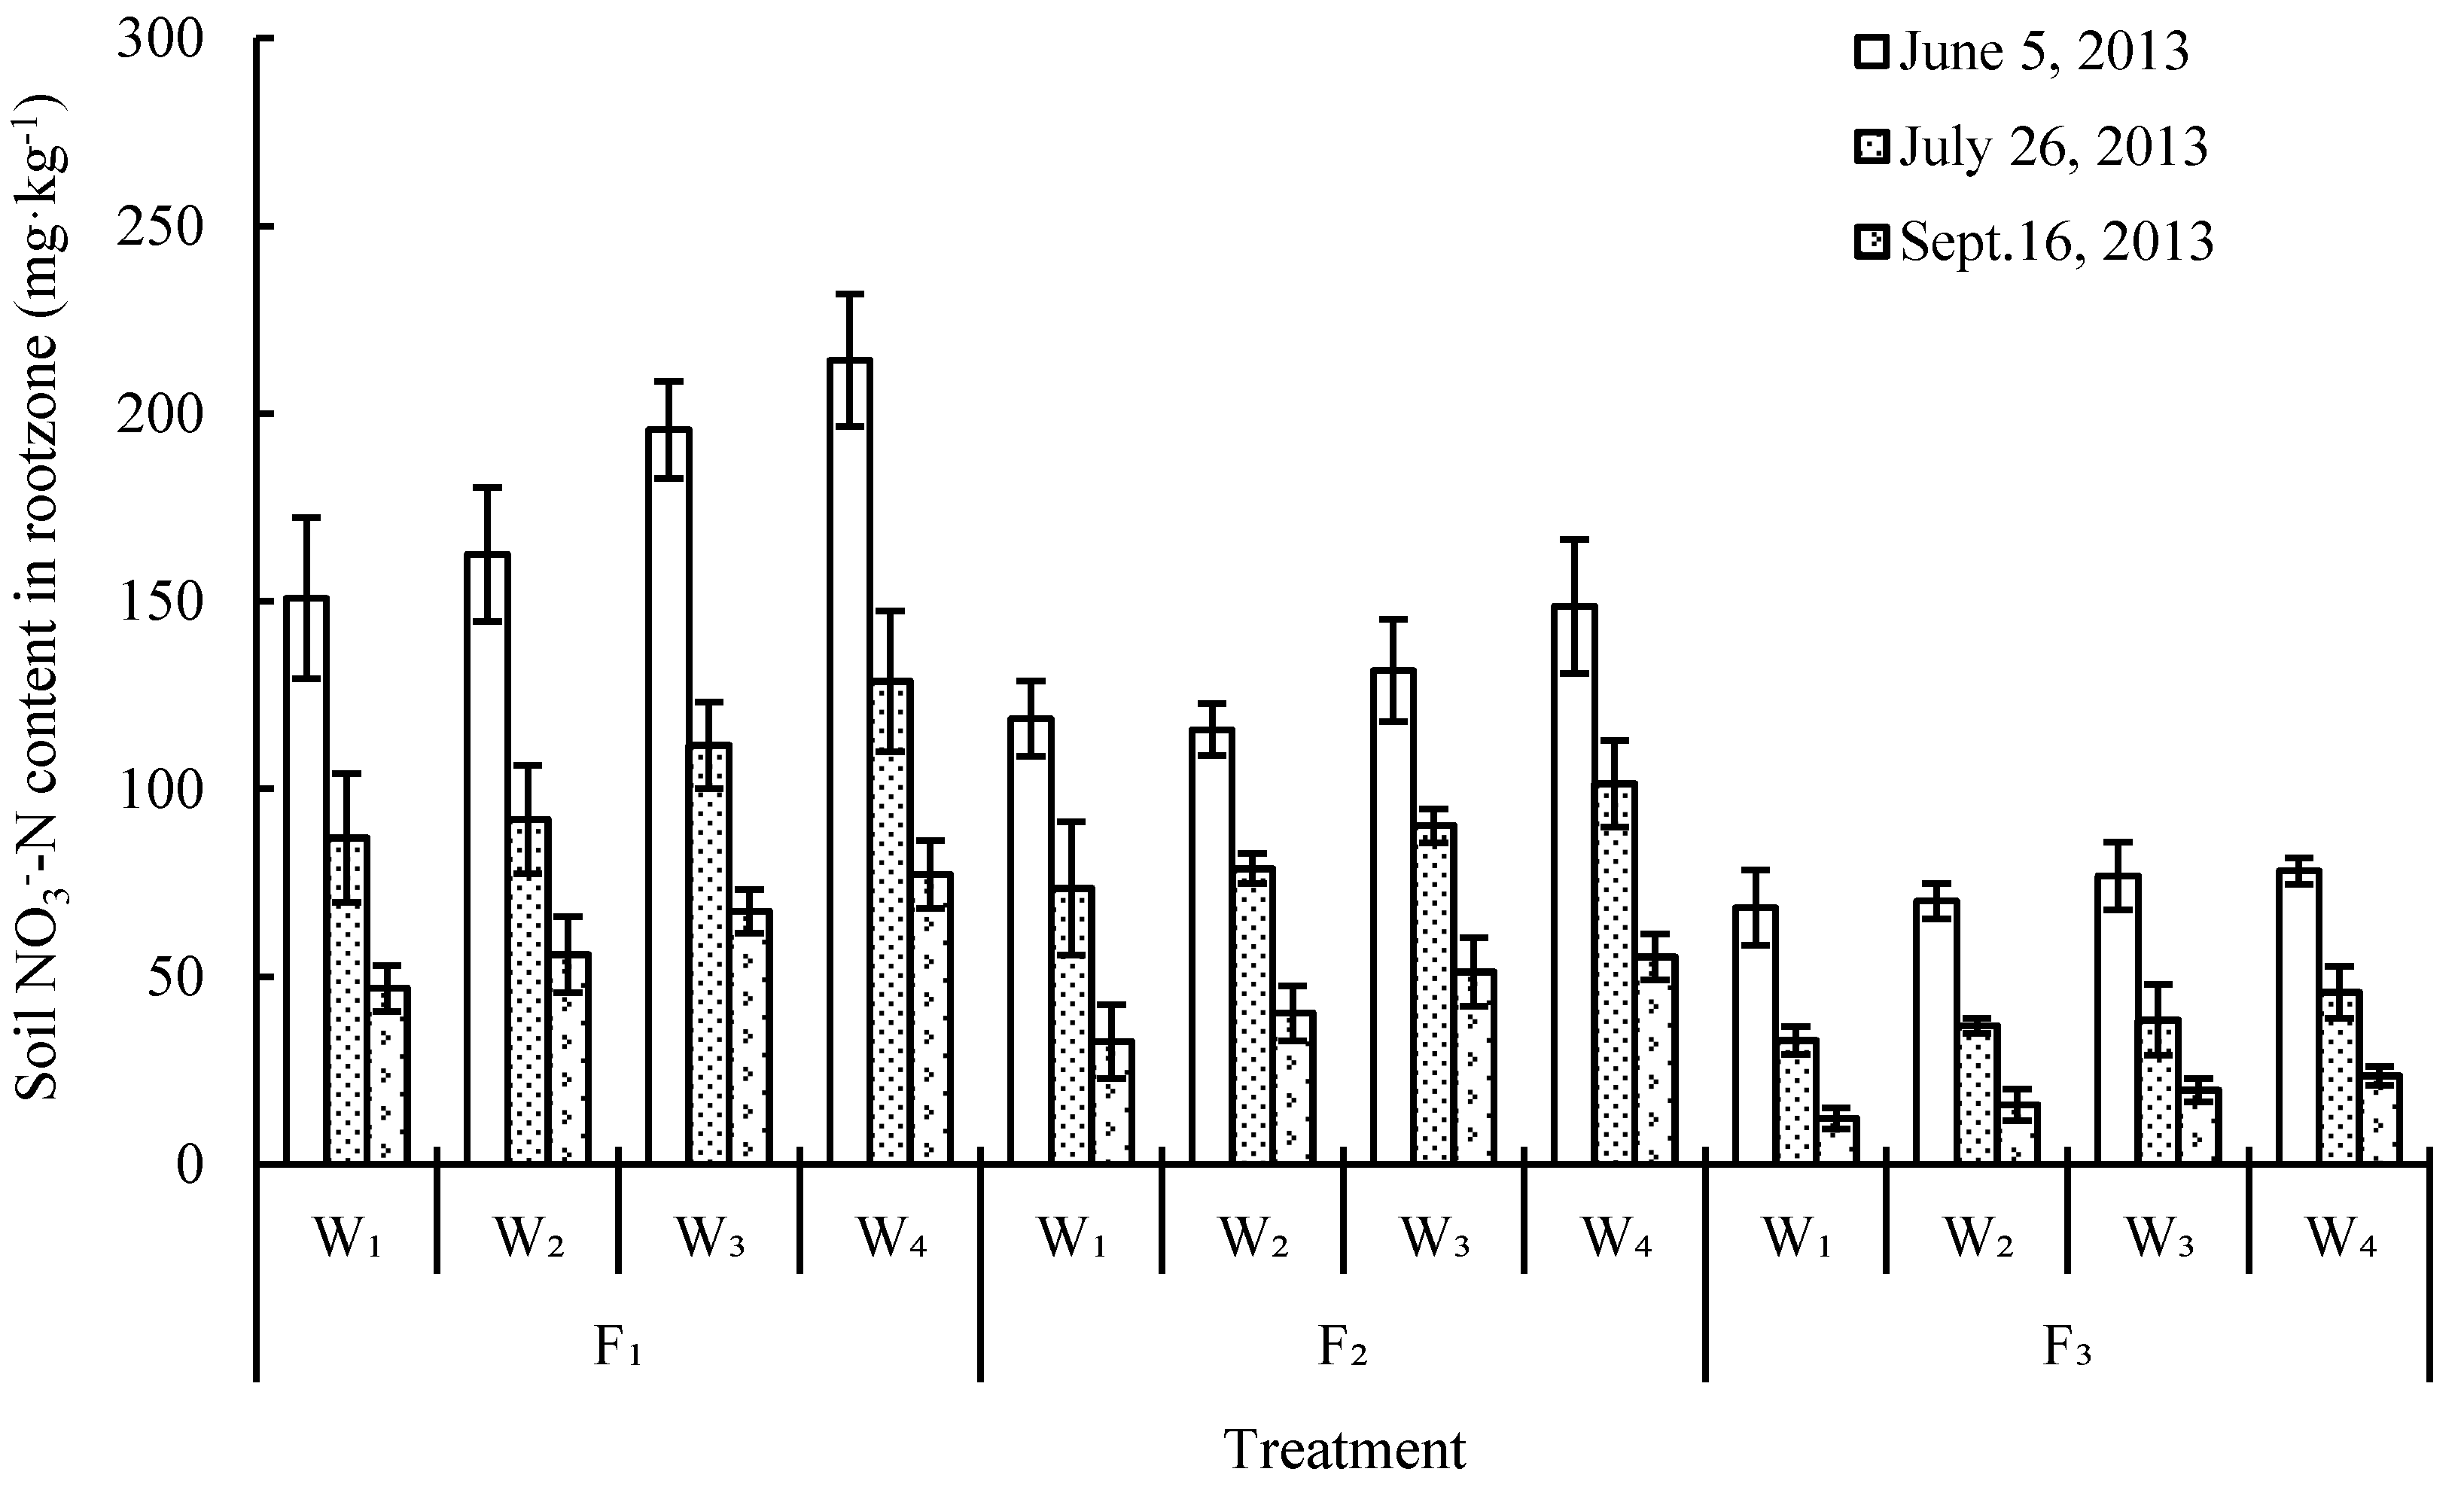
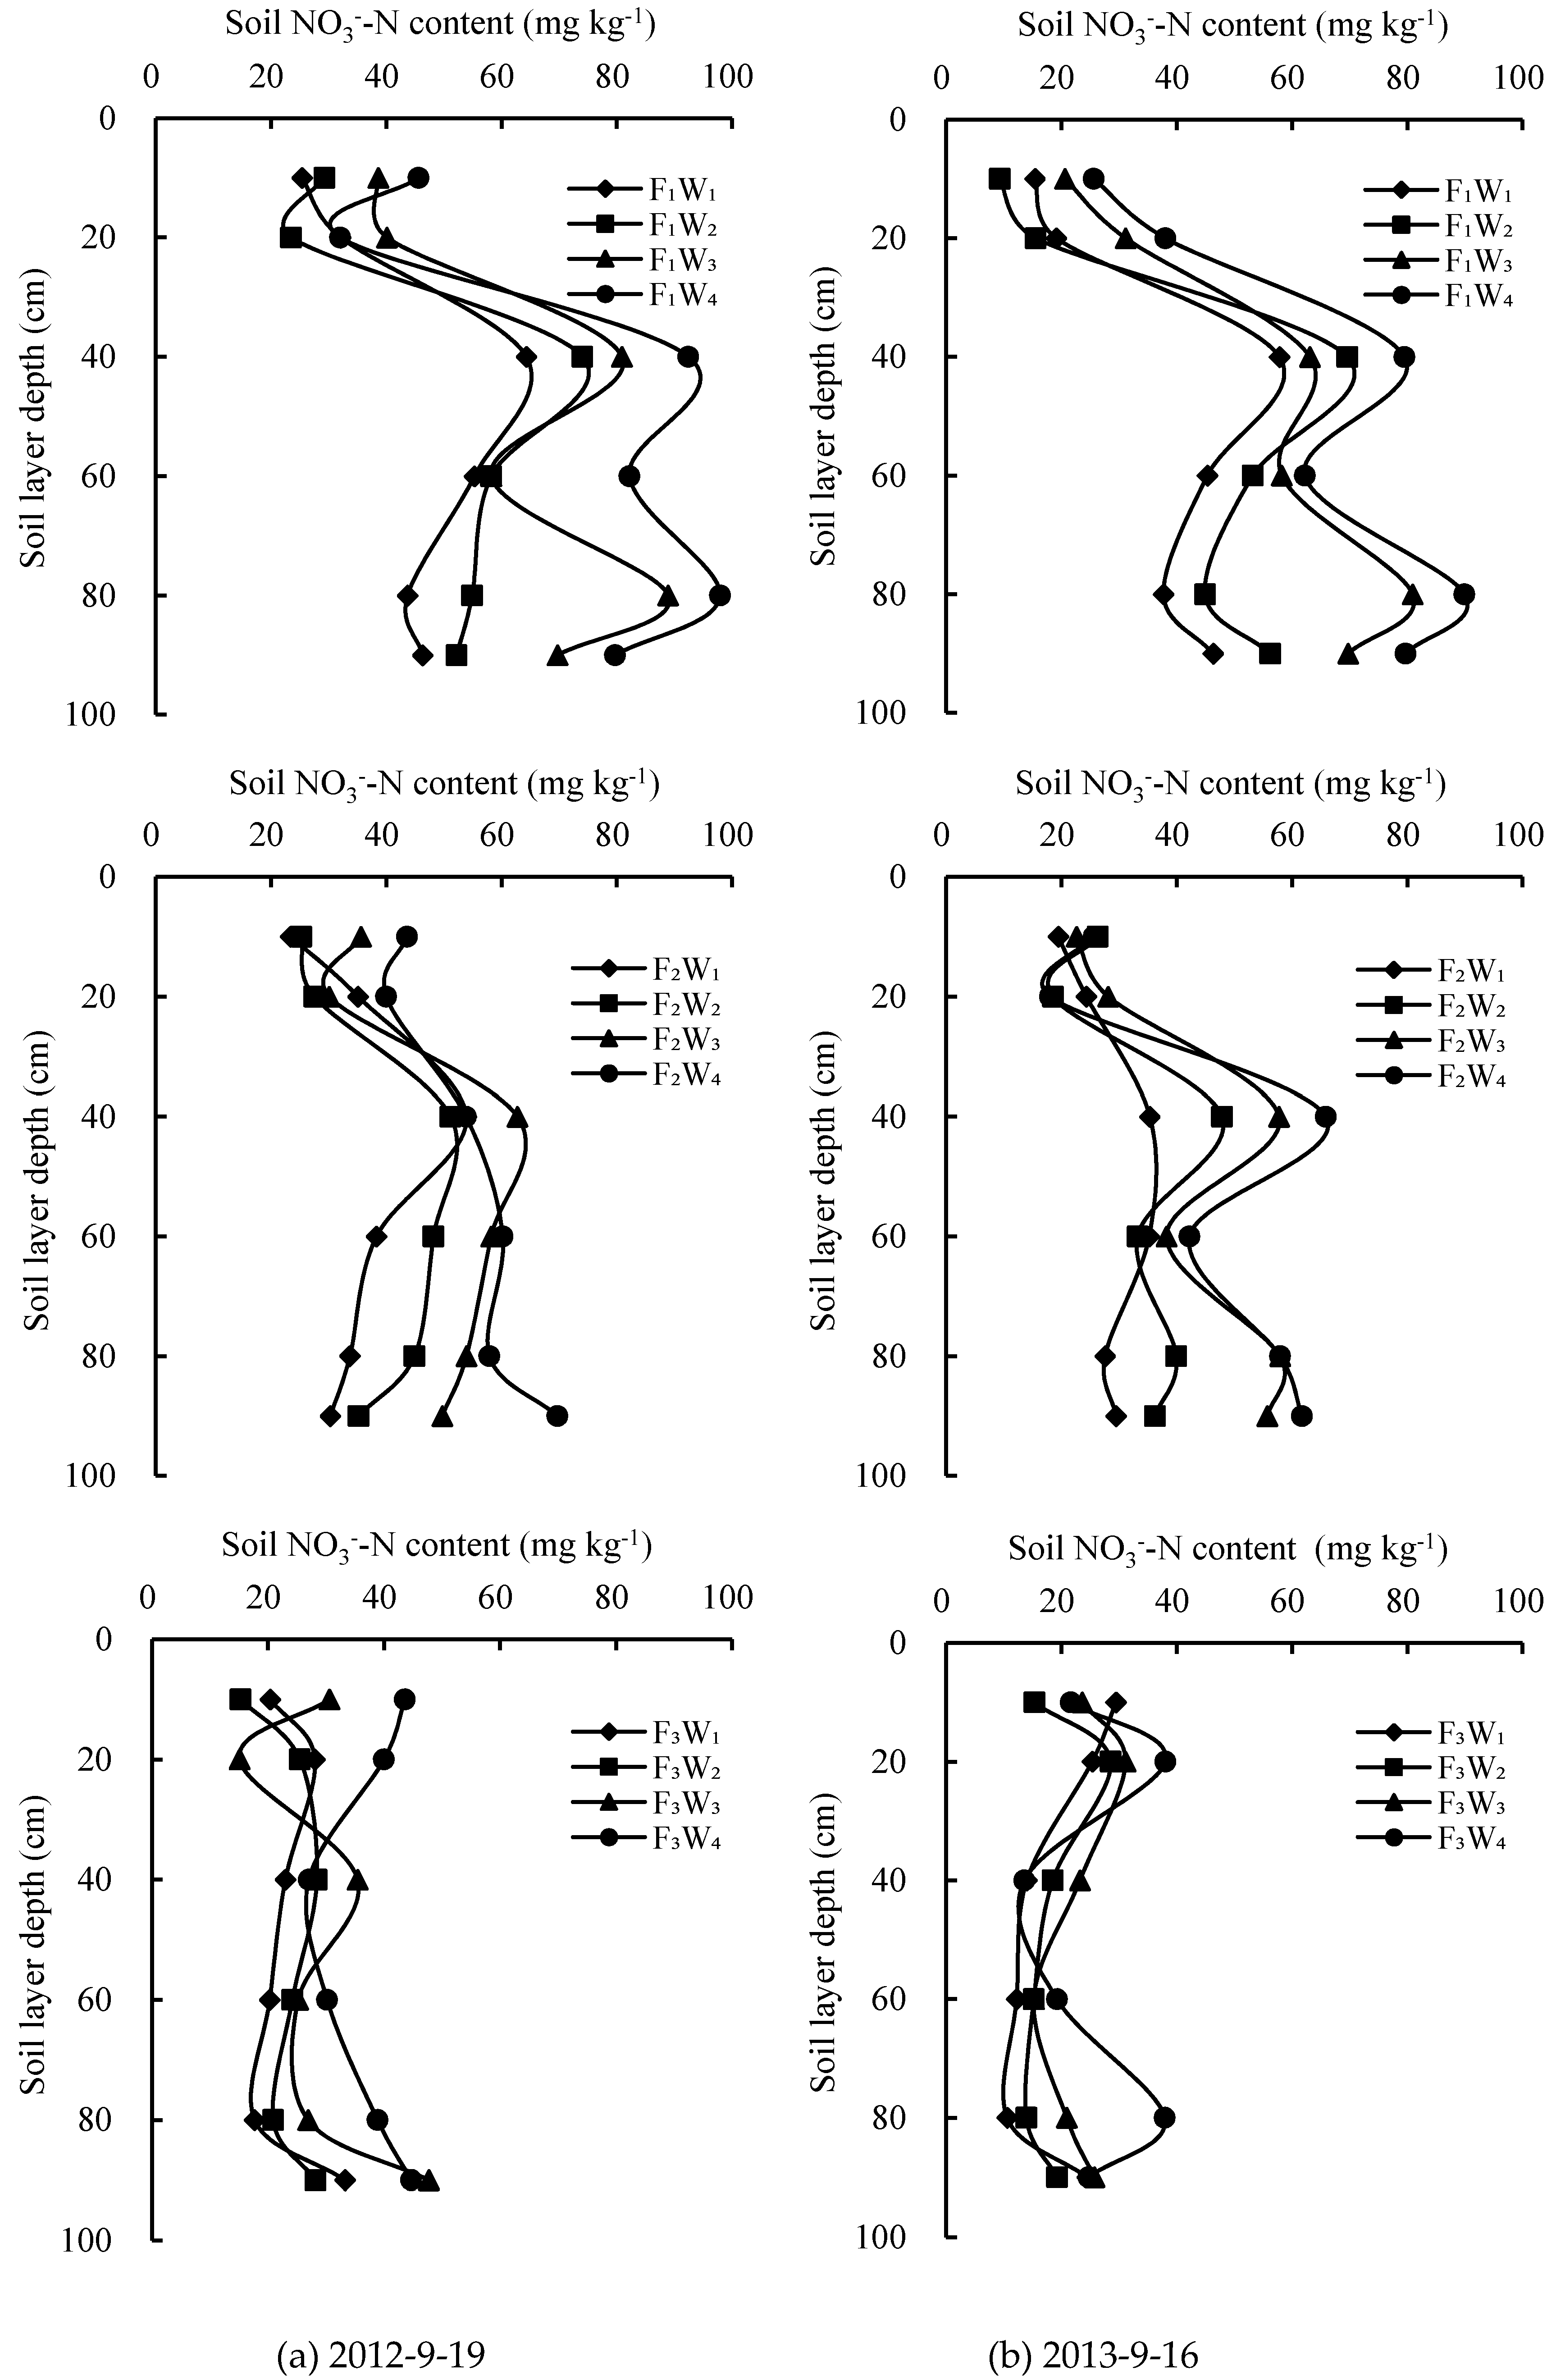
3.3. Soil Nitrate-N Dynamics

Irrigation and water-fertilizers coupling exhibited a significant effect on soil nitrate-N (rootzone, 40~60 cm) on 9 June (p < 0.05), 30 July (p < 0.01) and 19 September (p < 0.01) in 2012 (Figure 3), and the effect of fertilization on soil nitrate-N was very significant (p < 0.01). Under the same fertilizer level, W1, W2 and W3 significantly reduced soil nitrate-N content by 9.9%~22.5%, 12.0%~31.8% and 9.3%~35.2% compared with W4, respectively. Under the same irrigation amount, F1 and F2 significantly increased soil nitrate-N content by 167.4%~198.8% and 92.9%~132.4% compared with F3, respectively.
Irrigation exhibited a significant effect on soil nitrate-N (rootzone, 40~60 cm) on 5 June (p < 0.01), 26 July (p < 0.01) and 16 September (p < 0.05) in 2013 (Figure 4), and the effect of fertilization on soil nitrate-N was also significant on 5 June (p < 0.01), 26 July (p < 0.05) and 16 September (p < 0.01). Water-fertilizers coupling had a significant effect on soil nitrate-N on 26 July (p < 0.05), but there was no significant effect on 5 June (p > 0.05) and 16 September (p > 0.05). Under the same fertilizer level, W1, W2 and W3 significantly reduced soil nitrate-N content by 8.3%~23.3%, 12.9%~29.9% and 11.3%~41.4% compared with W4, respectively. Under the same irrigation level, F1 and F2 significantly increased soil nitrate-N content by 146.3%~246.4% and 75.3%~151.5% compared with F3, respectively. In addition, soil nitrate-N content in F1 was significantly reduced 12.3%~22.9%, 12.2%~15.3% and 10.4%~15.0% at 5 June, 26 July and 16 September in 2013 compared with that at three sampling times in 2012, respectively, and that was 11.2~18.3%, 5.1~12.8% and 3.5~22.1% in F2 and 3.3~16.3%, 3.1~21.2% and 26.5~39.7% in F3.
The dynamics of soil nitrate-N content in the root region under water-fertilizer coupling are shown in Figure 5. Under F1, W1 significantly decreased soil nitrate-N at 0~90 cm by 37.8% compared with W4 at 19 September in 2012, and that was 33.9% and 36.4% under F2 and F3, respectively. At 16 September in 2013, W1 significantly decreased soil nitrate-N at 0~90 cm by 41.0% compared with W4 under F1, and that was 36.9% and 25.2% under F2 and F3, respectively. The highest soil nitrate-N content was mainly distributed at 40~60 cm, and the nitrate-N content in F1 was significantly higher than other fertilizer treatments under the same irrigation condition. In addition, irrigation greatly reduced the topsoil nitrate-N content. A higher concentration area existed at a 40 cm and 80 cm depth in W3 and W4, but W1 and W2 had only a higher concentration at a 40 cm depth. The results indicate that the important drivers for soil mineral nitrogen migration are water movement and water vertical flow.

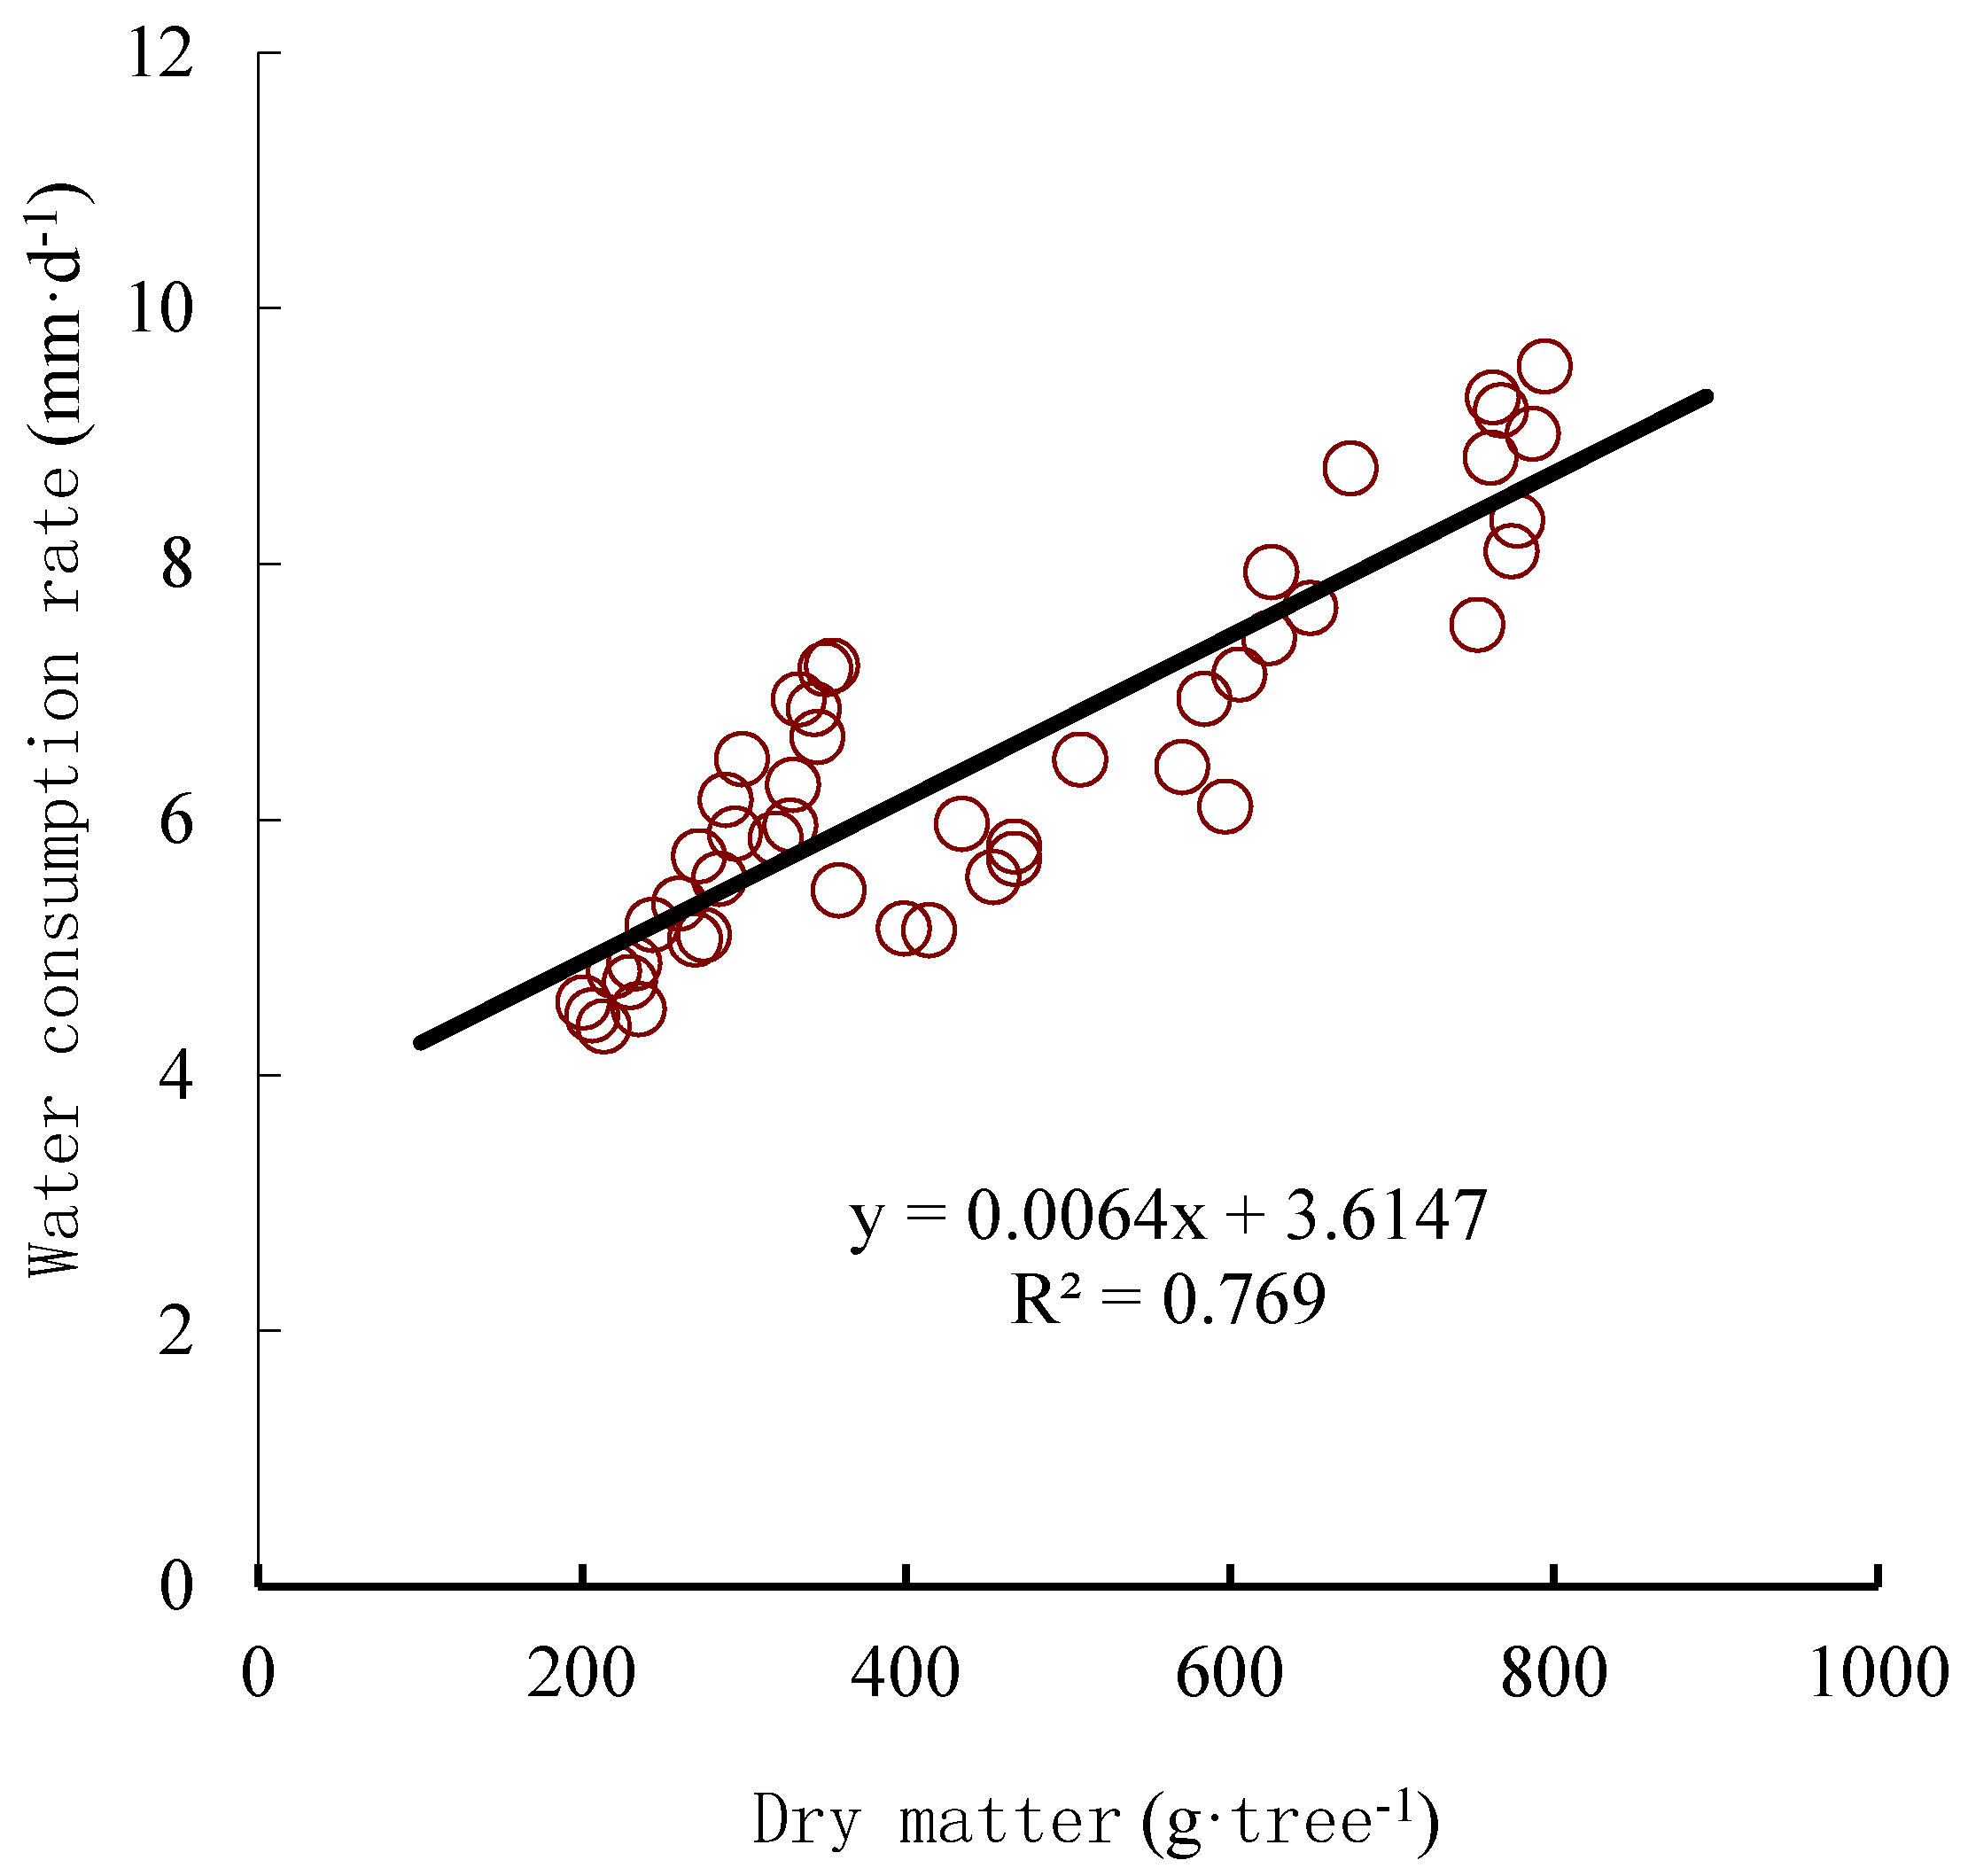
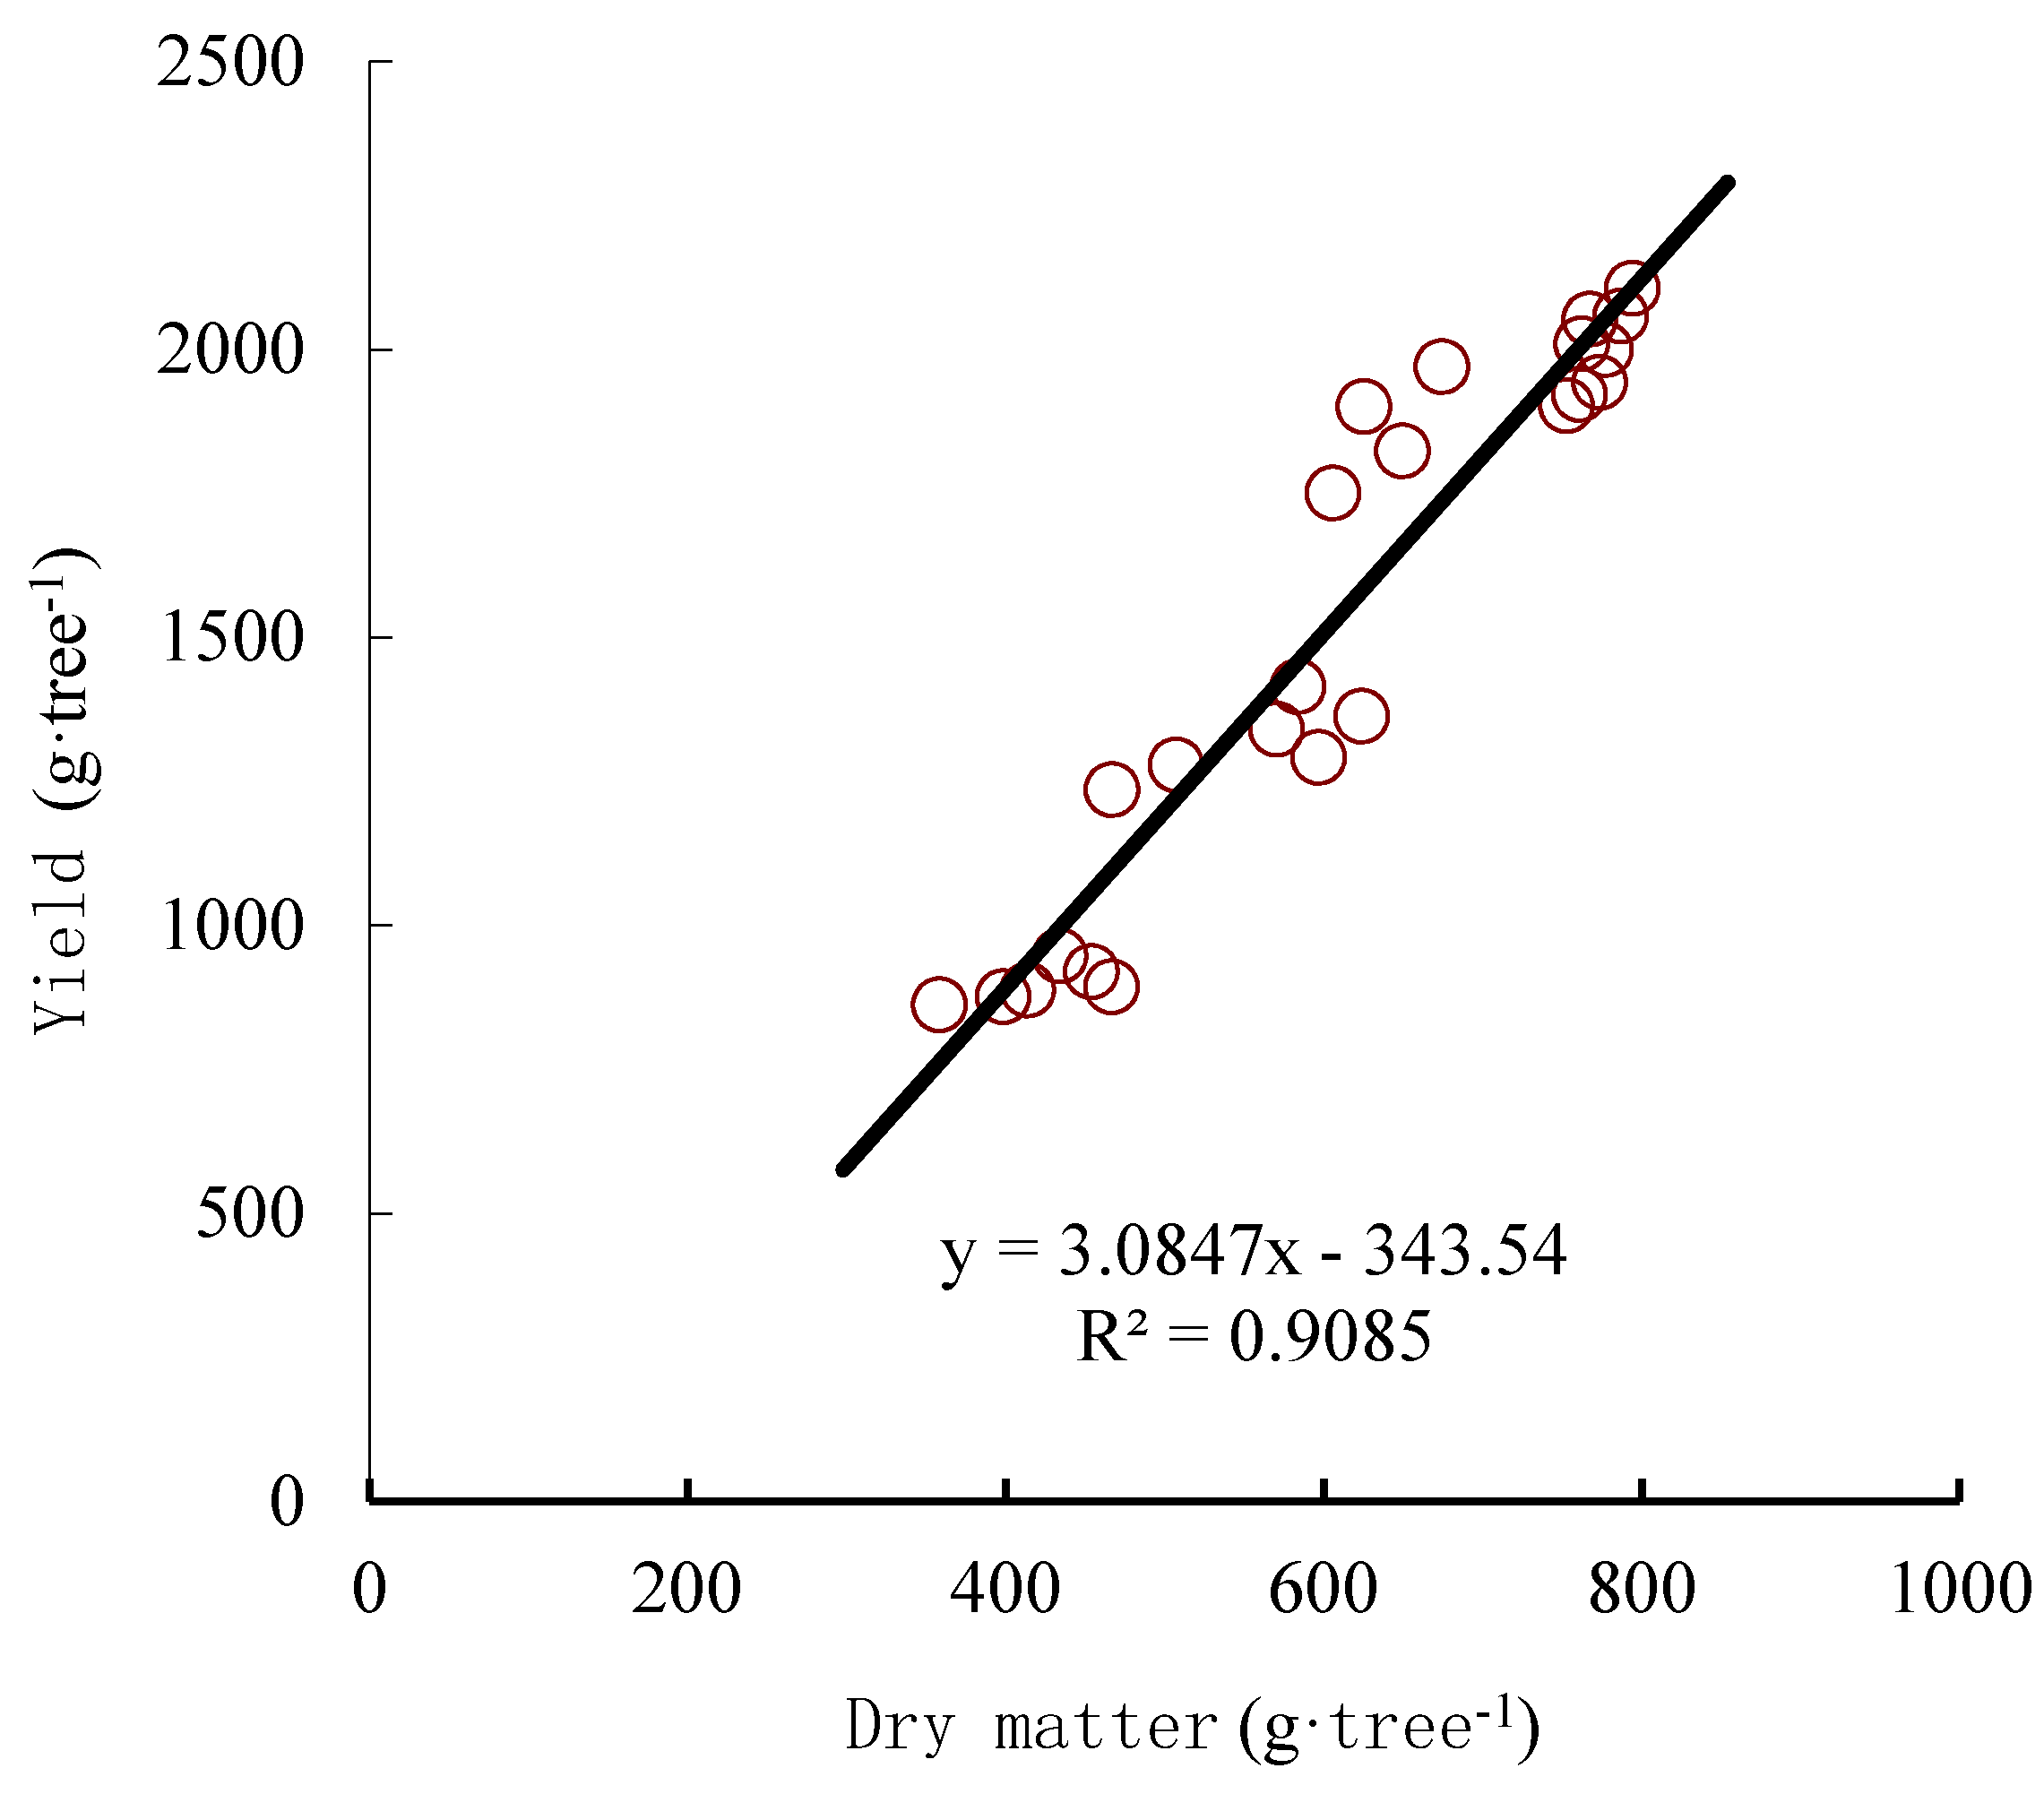
3.4. DM, ET, CWP (Dry Matter Accumulation, Evapotranspiration and Crop Water Productivity)

In 2012–2013, irrigation had a very significant impact on the amount of DM, ET and CWP (p < 0.01), and fertilization had a significant impact on DM and CWP (p < 0.05). Differently, the effects of the water-fertilizer interaction on the DM, ET and CWP were not significant (p > 0.05) (Table 2 and Table 3).
In 2012, under a low level of fertilizer (F2 and F3), the DM and ET increased with the increase of the irrigation amount (Table 2). Under the high level of fertilizer (F1), the DM with W1 and W2 was significantly higher than with W3 and W4, but it was not significantly different between W1 and W2. The change of ET with irrigation under F1 was similar with under F2 and F3. Under the four irrigation treatments, the DM under F3 was significantly lower than that under the other fertilizer levels (F1 and F2). Under W1, there was no significant difference in ET between F1 and F2, but those were higher than that of F3. Under W2 and W3, ET with F1 was significantly 8.6%~11.1% and 12.1%~14.4% higher than that of F2 and F3, respectively, but did not differ significantly between F2 and F3. Under W4, there was no significant difference in ET among F1, F2 and F3. Meanwhile, under F1 and F2, W2 and W3 significantly increased CWP compared with that in W4. Under F1, no significant difference between W1 and W3 was observed, but under F2, W3 significantly enhanced CWP by 7.7% compared with W1. Under F3, there was no significant difference among W1, W2 and W3, whereas W4 significantly reduced CWP.
In 2013, W1 and W2 significantly increased DM compared with W3 and W4, but no significant difference was found between W1 and W2 under the same fertilizer level (Table 3). When the irrigation amount was reduced, ET had also been significantly decreased by 8.4%~41.6%. Under F1 and F3, there was a similar trend in CWP with the irrigation amount. No significant difference in CWP was observed among W1, W2 and W3 or W1, W3 and W4. Under F2, CWP in W2 and W3 was significantly 17.2% and 13.2% higher than that in W4, respectively, but there was no significant difference between W1 and W3 or W3 and W4. When the effect of irrigation amount was fixed, the change trend of DM and ET with fertilizer level was similar with that in 2012. Under W1 and W4, there was no significant difference in CWP among F1, F2 and F3, but under W2 and W3, F2 significantly enhance CWP compared with F3, suggesting F1W2 and F2W2 can maintain higher dry matter accumulation and crop water productivity.

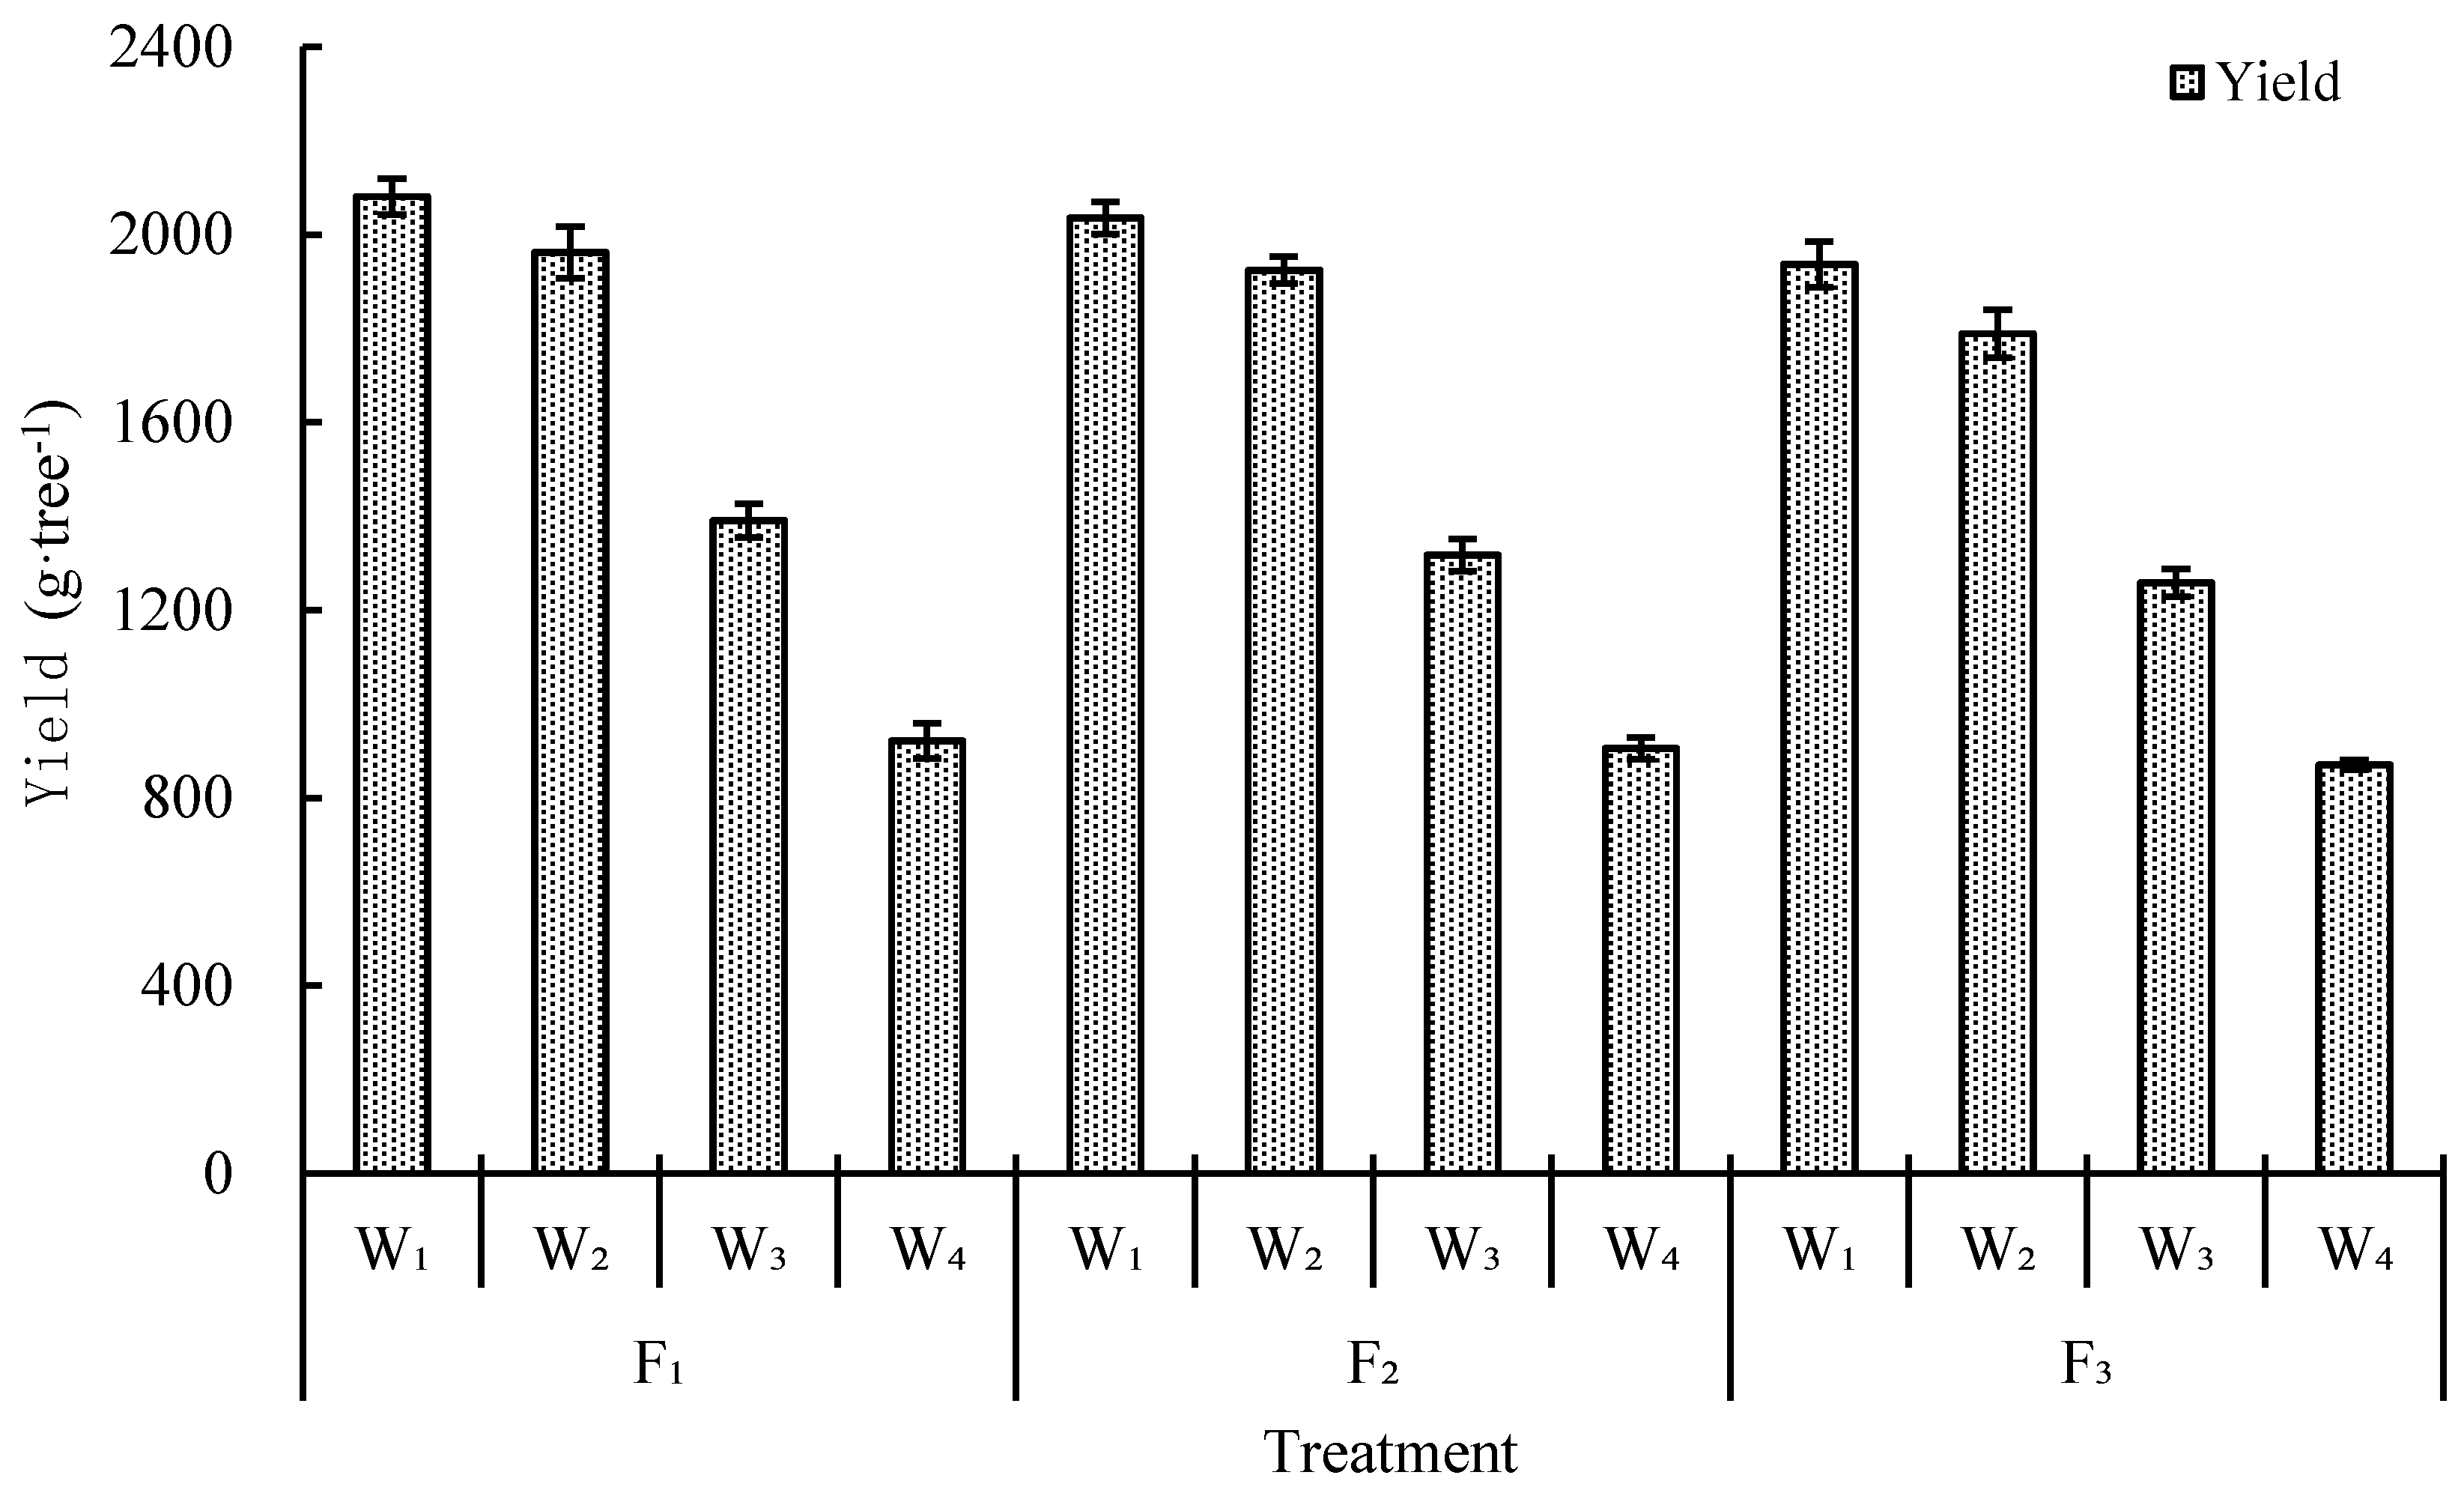
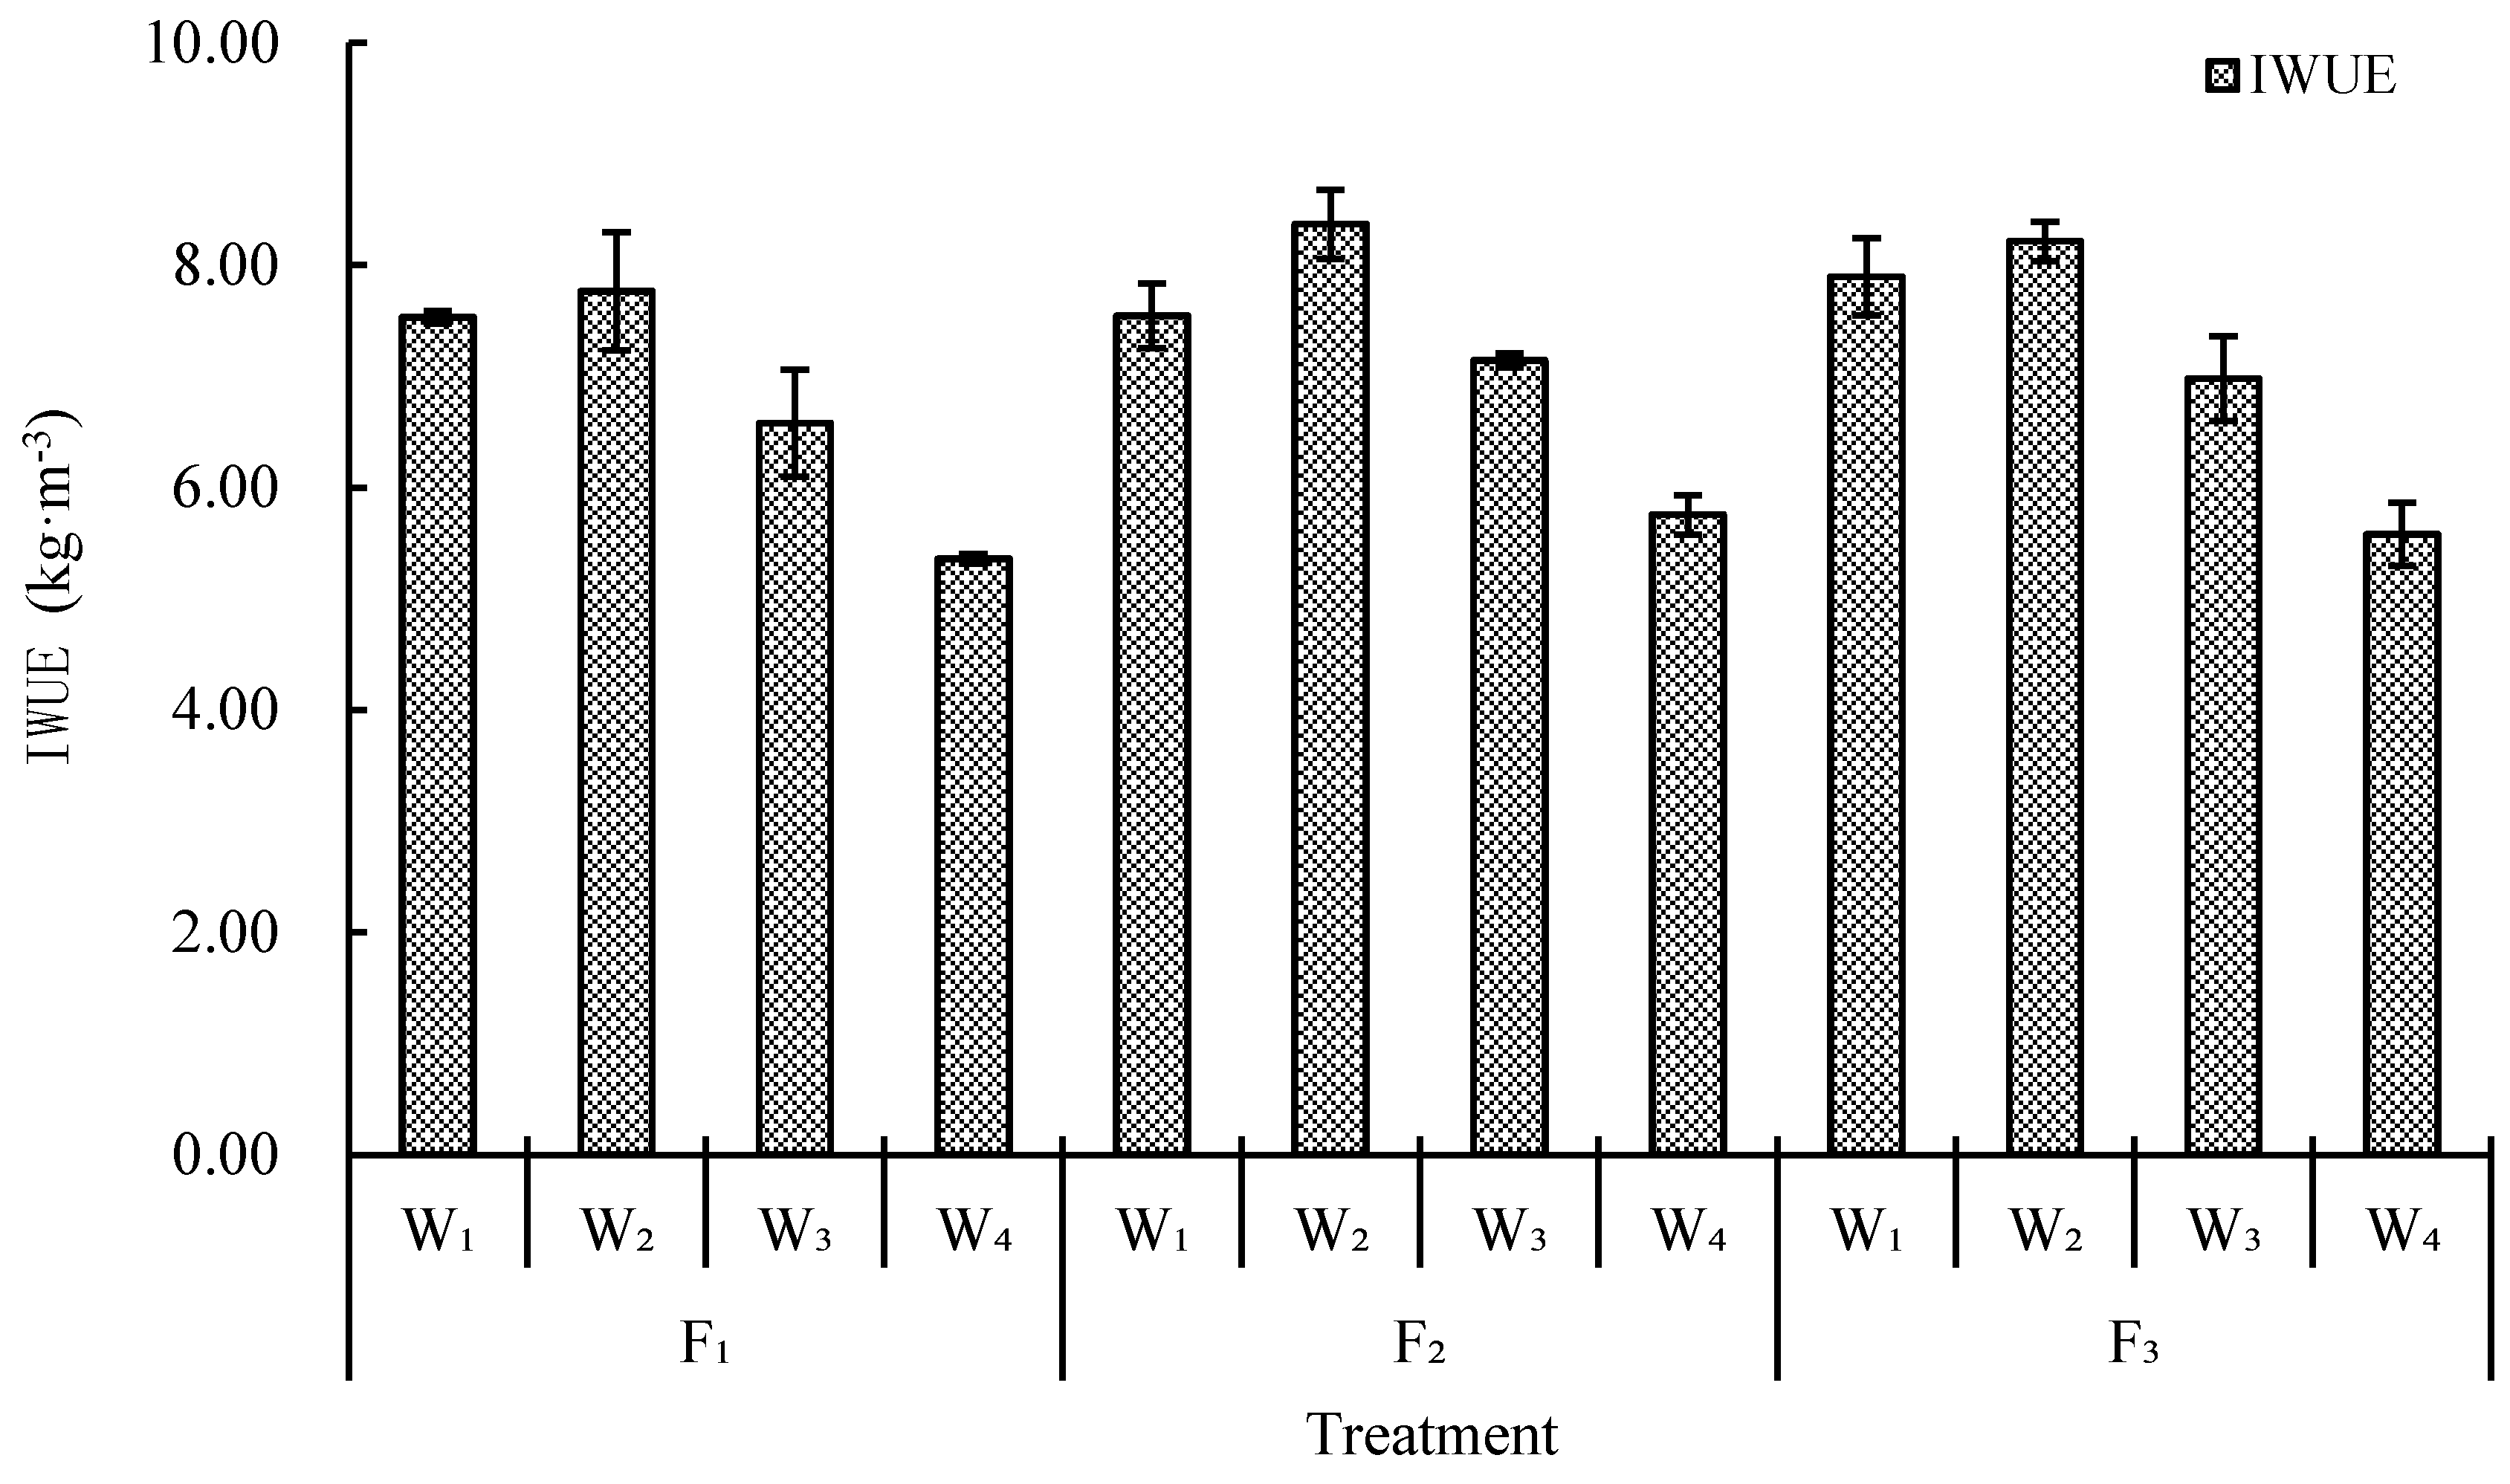
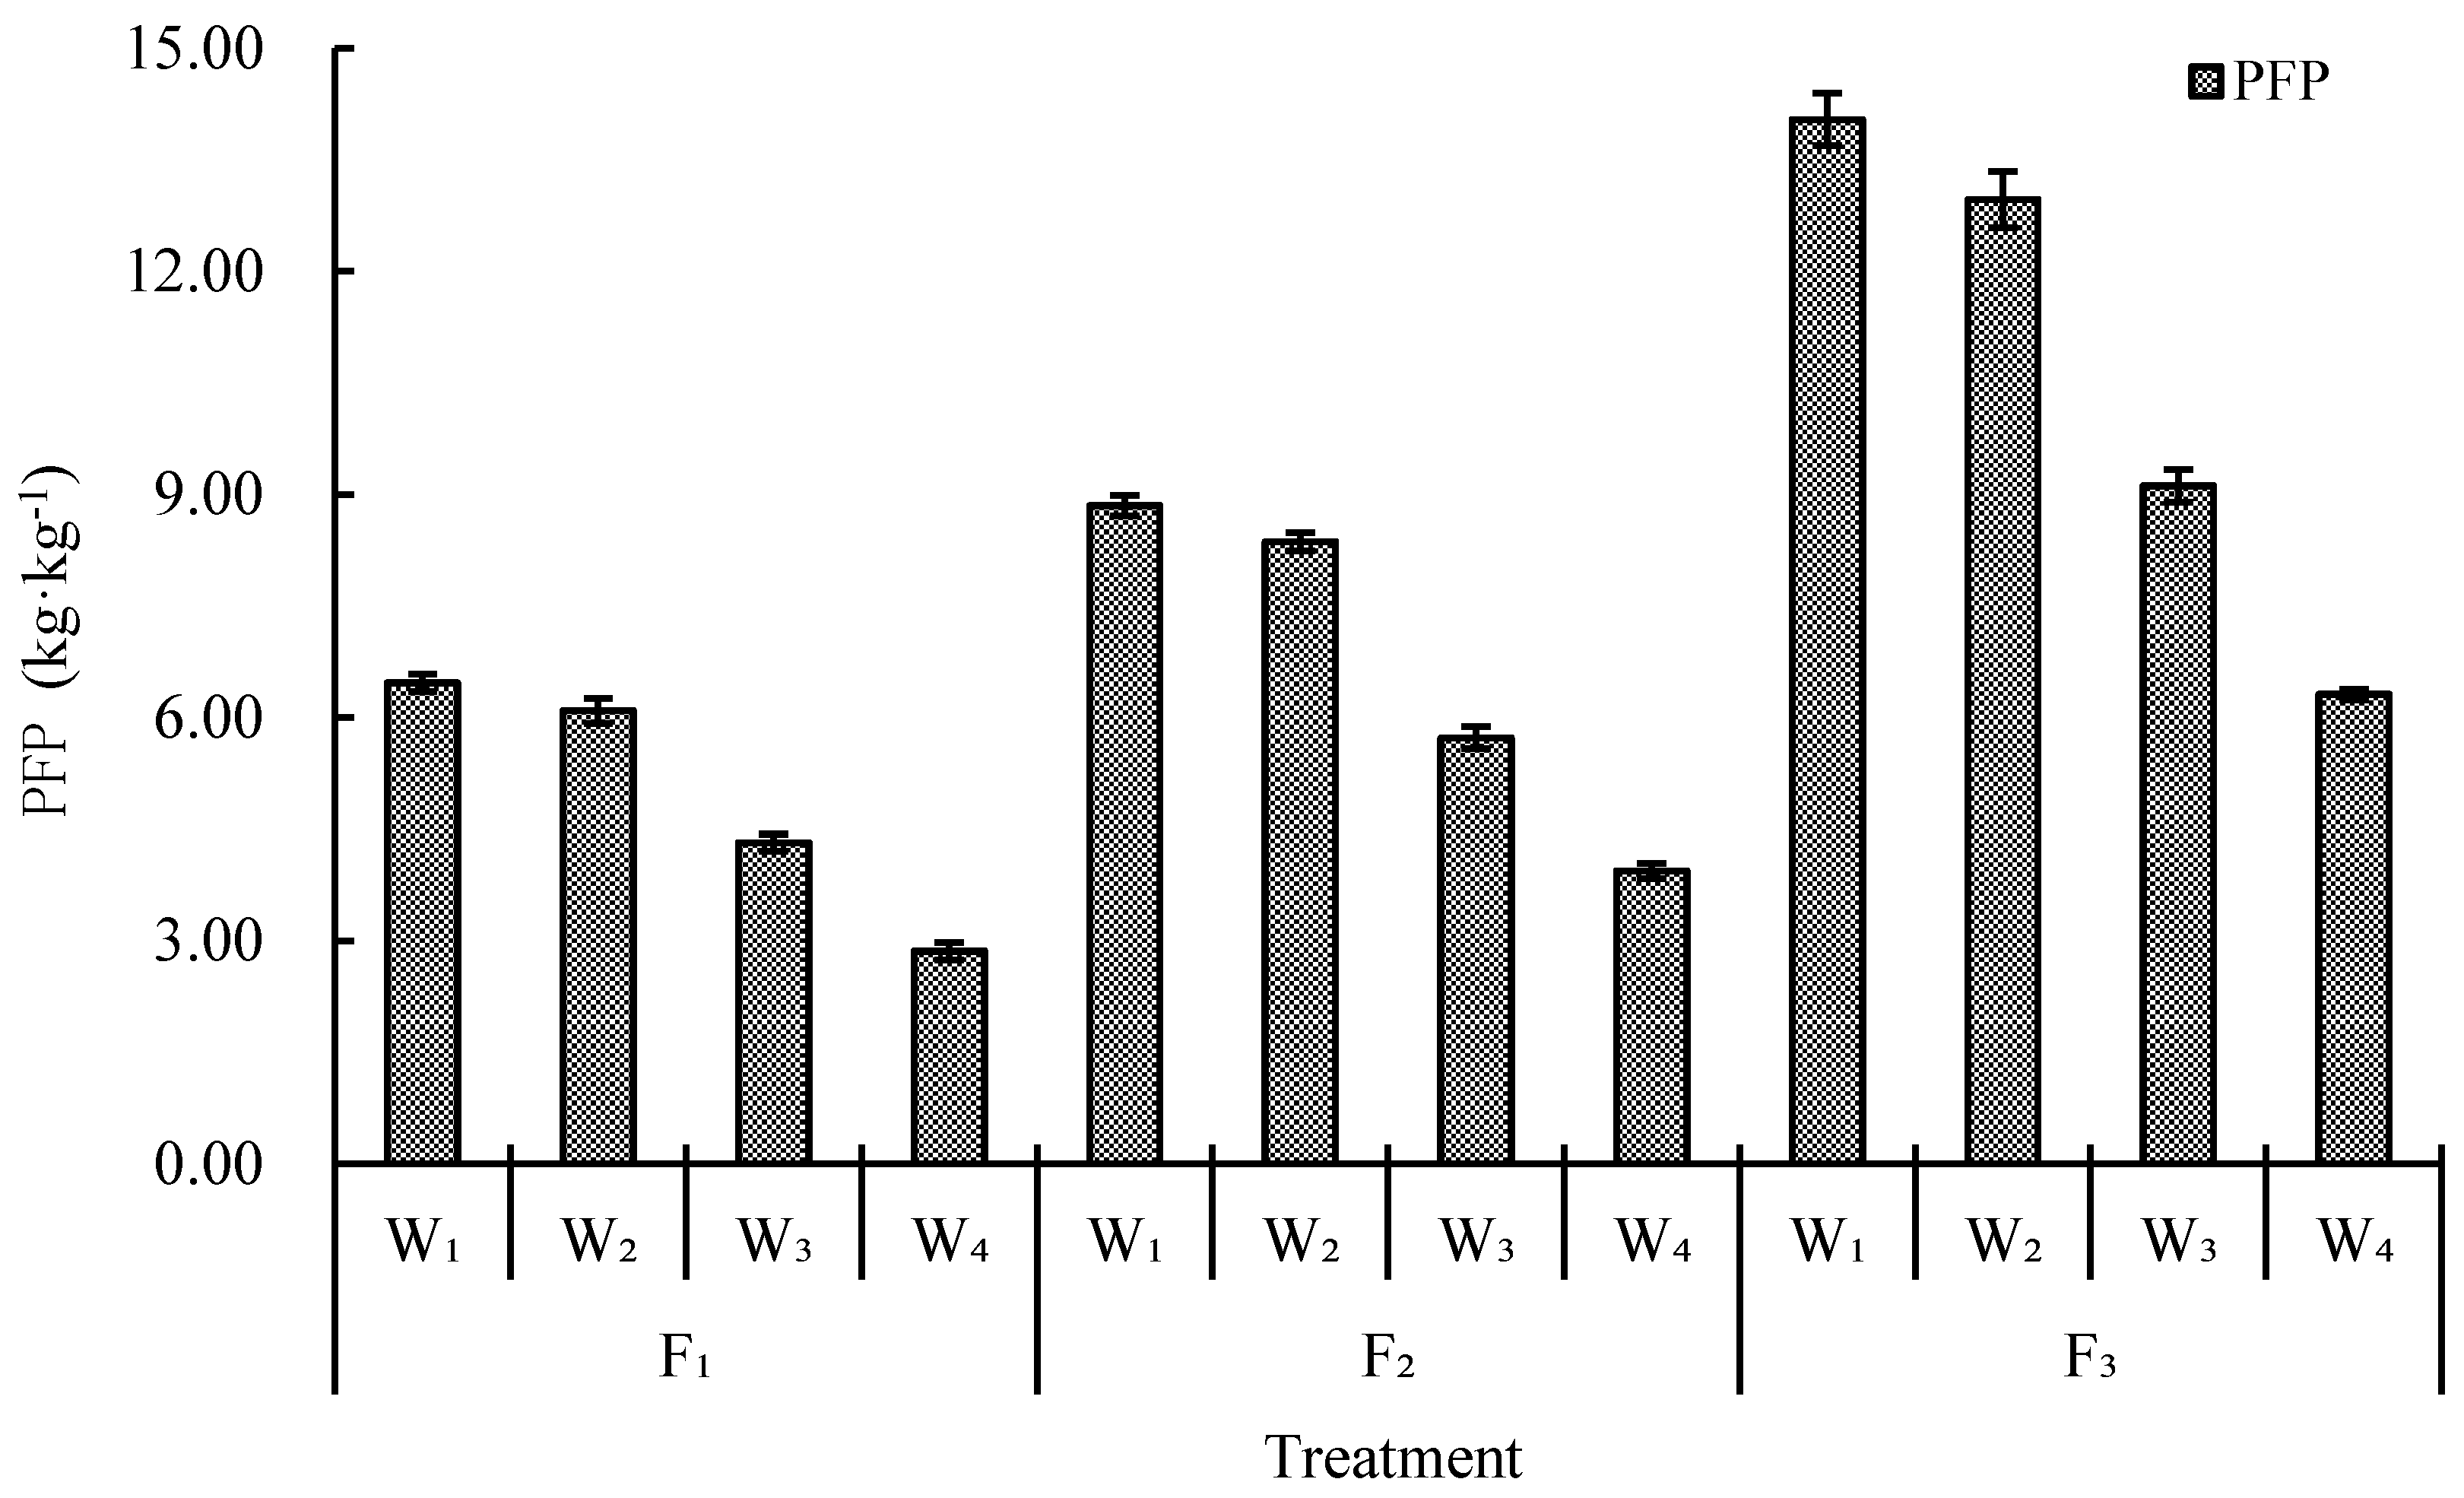
3.5. Yield, IWUE and PFP (Partial Factor Productivity)

Irrigation and fertilizer had a very significant impact on apple yield (p < 0.01), and the interaction of water and fertilizer was significant (p < 0.05) in 2013 (Figure 6). The yield of apple for W1, W2 and W3 was significantly higher than W4, with the order being W1 > W2 > W3 > W4. Compared with W4, W1 significantly increased apple yield by 124.4%. Moreover, the response of yield to irrigation was significantly higher than that to fertilizer, F1 merely increased yield by 8.5% compared with F3. Under the interaction effect of water and fertilizer, the yield increase was 139.1% in F1W1 compared with that in F3W4.
The effect of irrigation on IWUE was very significant in 2013 (p < 0.01), but it was not significant for the fertilizer and the interaction of water and fertilizer (p > 0.05) (Figure 7). When fertilizer levels were fixed, the order of irrigation on IWUE was W2 > W1 > W3 > W4. Mild deficit (W2) significantly increased IWUE by 6.0% and 45.9% compared with W1 and W4, respectively. Moreover, compared with F1W1, F2W2 reduced yield by 7.5%, but enhanced IWUE by 11.2%, further suggesting that F2W2 was the optimum combinations of water and fertilizer saving.
Irrigation, fertilizer and the interaction with water had a very significant impact on PFP in 2013 (p < 0.01) (Figure 8). When fertilizer levels were fixed, the increase of irrigation amount significantly enhanced PFP, with the order being (in kg kg−1) W1 > W2 > W3 > W4. PFP inW1 was 7.1%, 52.2% and 123.9% higher than that in W2, W3 and W4, respectively. When the irrigation amount was fixed, the increase of fertilizer level significantly reduced PFP, with the order being (in kg kg−1) F1 < F2 < F3. PFP in F3 was 115.0% and 57.8% higher than that in F1 and F2, respectively. In addition, F3W1 and F3W2 had the maximum and minimum PFP, and those were 14.04 kg kg−1 and 12.97 kg kg−1, respectively, suggesting that the interaction of high irrigation amount and low fertilizer level can gain higher PFP.

4. Discussion

Field management practices affect soil moisture and thermal status, which play an important role in crop yield and WUE in dryland farming [21]. This study found that the F1W1, F2W1 and F3W1 had the highest average soil water content at 0~90 cm compared with the other treatments. For W1, W2, W3 and W4, high levels of water content were mainly distributed at 50~80 cm, 40~70 cm, 30~50 cm and 10~30 cm, respectively. Moreover, the roots of young apple trees were mainly distributed in 40~60 cm, suggesting that under the moisture treatment of W1 and W2, it is more favorable to the absorption of water and nutrients by apple saplings. However, our research showed that there was no significant difference in soil water content at all fertilizer treatments (p > 0.05), which was different with previous study [11,13]. The reason needs further study.
Fertilizer utilization in crops was not only related to the amount of fertilizer applied, but also related to irrigation management measures (such as irrigation amount, irrigation time, irrigation method, etc.), and are largely influenced by climate (such as water, heat, etc.) [22,23,24,25,26]. Many studies have shown that irrigation and fertilization influence nitrate-N leaching in farmland ecosystems [27,28]. Yang and Wang (2011) [29] reported that excess N fertilizer and irrigation applied to crops caused more nitrate-N leaching. Nitrate-N mainly accumulated in the 0~60 cm soil layer, erosion as a process that frequently occurs in the semi-arid areas, and nitrates would be transported with soil particles over large distances to pollute remote ecosystems. Hence, nitrate accumulation in soils must be minimized [13]. Gärdenäs et al. (2005) [30] used a two-dimensional model to simulate nitrate-nitrogen transport in different drip irrigation fertilization strategies and showed that the appropriate frequency of water and nutrient supply for drip fertilization can provide crop water and nutrient absorption and reduce soil nitrogen. In this study, the highest soil nitrate-N content was mainly distributed at 40~60 cm, and the nitrate-N content in F1 was significantly higher than other fertilizer treatment. In addition, irrigation greatly reduced the topsoil nitrate-N content. A higher concentration area existed at the 40 cm and 80 cm depth in W3 and W4, but W1 and W2 had only a higher concentration at a 40 cm depth (W1 and W2 reduced the accumulation of nitrate in soil). These results indicated that under the condition of high fertilizer, the content of nitrate nitrogen in soil is relatively high, and the appropriate water and fertilizer ratio can not only meet the absorption and utilization of crops, but also enable the rapid transport of nitrate-N, so as to reduce the accumulation of nitrate in soil. Moreover, under the same fertilization conditions, more irrigation can promote the absorption of nitrate-N by crops and reduce the accumulation of nitrate in soil; On the contrary, less irrigation can slow the migration of nitrate in soil, which is not conducive to the growth of crops. So, the amount of irrigation is crucial to the accumulation of nitrates.
In general, crop yield and DM are greatly influenced by irrigation and fertilizer regimes as well as other agronomic measures [11,15,31,32]. This study showed that the overall DM, ET and yield of young apple tree were significantly increased with increasing irrigation amount under the same fertilization conditions for the two years, and the order was: W1 > W2 > W3 > W4 (Table 2 and Table 3; Figure 6). Apple yield and water consumption rate is directly related to the biomass at maturity (Figure 9 and Figure 10). Xue et al. (2006) [33] showed that higher biomass contributed to higher yield with different irrigation treatments. Improving biomass production is a highly promising approach to increase yield [33,34]. However, when water supply is sufficient, excessive vegetation growth may result in weaker root vigor, unhealthy canopy structure, and lower harvest ratio [35,36]. This means that high yields could be obtained by increased water, but the yield per unit crop water consumption was reduced. This study established the relationships between DM and water consumption rate (Figure 9), DM and yield (Figure 10), respectively. The correlation analysis between apple yield and dry matter content (Figure 10) showed that they presented a linear distribution rule and had a strong positive correlation and the coefficient of determination R2 = 0.9085. This suggested that the amount of dry matter could reflect apple yield during its sapling period. It also had a good correlation between DM and water consumption rate (R2 = 0.769), this indicated that the higher water consumption, the better the plant grew, and more dry matter accumulated in the end. Under the same conditions of fertilization for the two years, the overall performances of apple CWP and IWUE were as follows: W2 > W 3> W1 > W4, W2 > W1 > W3 > W4, respectively (Table 2 and Table 3; Figure 7), which was similar with previous reports [36,37]. The CWP is affected by biomass yield and total ET [36]. ET is affected by applying irrigation at different growth stage [33,37]. Appropriate irrigation can be achieved by improving the harvest index to both increase yield and IWUE [35,36].
Within a certain range of water and fertilizer inputs, the yield increased as irrigation and fertilization increased, but the yield decreased when the irrigation and fertilization exceeded a certain threshold [25]. Therefore, reasonable water and fertilizer inputs could achieve high yields [38,39]. The effect of N fertilizer on total above ground biomass depends on the availability of water in the soil [40]. The dry weight and yield of cotton has been shown to increase under high water and nitrogen conditions, but the CWP and IWUE can significantly decrease [9,25]. The greatest CWP and IWUE observed was with deficit irrigation treatments [41], which was similar to the results of this study. The two-year maximum value of CWP basically appeared in the F2W2 treatment. Compared with F1W1 in 2012 and 2013, although the DM in F2W2 was reduced by 5.2% and 2.3%, respectively, the ET was reduced by 16.4% and 16.7%, respectively, but the CWP increased by 13.4% and 17.3%, respectively. The IWUE maximum value also appeared in the F2W2 treatment. Compared with F1W1, although the yield in the F2W2 treatment was reduced by 7.5%, the ET was reduced by 16.7%, but the IWUE was increased by 11.2%. This also showed that the F1W1 treatment of high water and high fertilizer cannot be obtained by the best IWUE. F2W2 treatment achieved the most suitable coupling model of water and fertilizer saving.
PFP is an indicator that reflects the combined effects of local soil nutrient levels and fertilizer application rates. Fritschi et al. (2003) [42] believe that when the growth of vegetative growth and reproductive growth is well-balanced, the highest N use efficiency can be obtained under the condition of the highest N application rate. On the contrary, excess N application will break the vegetative and reproductive growth. The balance, which in turn leads to vegetative growth is too strong, delayed maturity and reduced production. Wu et al. (2014) [43] pointed out under field drip irrigation fertilization in Xinjiang, that fertilization and irrigation had a very significant interaction with PFP. Xing et al. (2015) [44] pointed out that PFP was significantly increased by reducing the fertilizer amount. These conclusions are basically consistent with the conclusions of this study. This study showed that PFP significantly increased with the increase of irrigation volume under the same fertilizer level and it was also increased with the decrease of fertilization amount under the same water level. Although a lower amount of fertilizer can achieve higher fertilizer efficiency, the production can also be significantly reduced. The middle fertilizer with high water treatment was more conducive to the balance between yield and fertilizer use efficiency, and it could achieve significant savings in fertilizer input while not affecting production.

5. Conclusions

Mild water deficit (W2) can store water in a 40~70 cm soil profile compared with other water treatments, but soil water content had no significant difference among all fertilizer treatments. In the F2W2 treatment, the optimum nitrate-N for apple utilization accumulated in 40~80 cm soil profile. Since the roots of the young apple trees were mainly distributed in 40~60 cm, suggesting that under the treatment F2W2, it is more favorable to the absorption of water and nutrients by apple saplings. Compared with F1W1 (apple yield reached the maximum value), although the yield in the F2W2 treatment was reduced by 7.5%, the IWUE was increased by 11.2%. Meanwhile, the highest CWP also appeared at F2W2 treatment. Thus, F2W2 treatment achieved the most suitable coupling model of water and fertilizer saving.

Author Contributions

Conceptualization, H.Z. and F.Z.; methodology, H.Z. and L.W.; software, H.Z. and L.W.; data curation, H.Y.; writing—original draft preparation, H.Z. and X.N.; writing—review and editing, H.Z., N.Z. and D.Y.; supervision, F.Z. and R.K.; project administration, F.Z.

Funding

This study was supported financially by the National Natural Science Foundation of China (51579211, 51709263), the Scientific and Technological Project of Henan province, China (182102310836), the Key Research Project of Universities in Henan Province, China (16A416005), the Initial Fund for Doctoral Research of Henan University of Science and Technology, China (13480016).

Conflicts of Interest

The authors declare no conflict of interest.

References

  1. Wang, N.; Wolf, J.; Zhang, F. Towards sustainable intensification of apple production in China—Yield gaps and nutrient use efficiency in apple farming systems. J. Integr. Agric. 2016, 15, 716–725. [Google Scholar] [CrossRef]
  2. Wang, D.; Wang, L. Dynamics of evapotranspiration partitioning for apple trees of different ages in a semiarid region of northwest China. Agric. Water Manag. 2017, 191, 1–15. [Google Scholar] [CrossRef]
  3. Huang, M.; Gallichand, J. Use of the SHAW model to assess soil water recovery after apple trees in the gully region of the Loess Plateau. China Agric. Water Manag. 2006, 85, 67–76. [Google Scholar] [CrossRef]
  4. Zhang, L.; Wang, Y.; Han, J.; Shi, Z.; Jiao, C.; Pang, G. Soil moisture dynamics and balance in apple (Malas domestica Borkh.) orchards in the Weibei rainfed highland, northwest China. J. Soil Water Conserv. 2017, 72, 374–381. [Google Scholar]
  5. Ren, X.; Cai, T.; Chen, X.; Zhang, P.; Jia, Z. Effect of rainfall concentration with different ridge widths on winter wheat production under semiarid climate. Eur. J. Agron. 2016, 77, 20–27. [Google Scholar] [CrossRef]
  6. Valipour, M.; Sefidkouhi, M.A.G.; Eslamian, S. Surface irrigation simulation models: A review. Int. J. Hydrol. Sci. Technol. 2015, 5, 51–70. [Google Scholar] [CrossRef]
  7. Hernández, M.; Echarte, L.; Della Maggiora, A.; Cambareri, M.; Barbieri, P.; Cerrudo, D. Maize water use efficiency and evapotranspiration response to N supply under contrasting soil water availability. Field Crops Res. 2015, 178, 8–15. [Google Scholar] [CrossRef]
  8. Li, S.X.; Wang, Z.H.; Li, S.Q.; Gao, Y.J. Effect of nitrogen fertilization under plastic mulched and non-plastic mulched conditions on water use by maize plants in dryland areas of China. Agric. Water Manag. 2015, 162, 15–32. [Google Scholar] [CrossRef]
  9. Martinez-Alcantara, B.; Quinones, A.; Angeles Forner-Giner, M.; Iglesias, D.J.; Primo-Millo, E.; Legaz, F. Impact of fertilizer-water management on nitrogen use efficiency and potential nitrate leaching in citrus trees. Soil Sci. Plant Nutr. 2012, 58, 659–669. [Google Scholar] [CrossRef]
  10. Miao, Y.F.; Wang, Z.H.; Li, S.X. Relation of nitrate N accumulation in dryland soil with wheat response to N fertilizer. Field Crops Res. 2015, 170, 119–130. [Google Scholar] [CrossRef]
  11. Wang, X.; Li, Z.; Xing, Y. Effects of mulching and nitrogen on soil temperature, water content, nitrate-N content and maize yield in the Loess Plateau of China. Agric. Water Manag. 2015, 161, 53–64. [Google Scholar]
  12. Li, T.; Liu, J.; Wang, S.; Zhang, Y.; Zhan, A.; Li, S. Maize Yield Response to Nitrogen Rate and Plant Density under Film Mulching. Agron. J. 2018, 110, 996–1007. [Google Scholar] [CrossRef] [Green Version]
  13. Liu, C.A.; Zhou, L.M.; Jia, J.J.; Wang, L.J.; Si, J.T.; Li, X.; Pan, C.C.; Siddique, K.H.M.; Li, F.M. Maize yield and water balance is affected by nitrogen application in a film-mulching ridge-furrow system in a semiarid region of China. Eur. J. Agron. 2014, 52, 103–111. [Google Scholar] [CrossRef]
  14. Nangia, V.; Gowda, P.H.; Mulla, D.J. Effects of changes in N-fertilizer management on water quality trends at the watershed scale. Agric. Water Manag. 2010, 97, 1855–1860. [Google Scholar] [CrossRef]
  15. Wang, X.B.; Dai, K.; Yan, W.; Zhang, X.M.; Zhao, Q.S.; Wu, X.P.; Cai, D.X.; Hoogmoed, W.B.; Oenema, O. Nutrient management adaptation for dryland maize yields and water use efficiency to long-term rainfall variability in China. Agric. Water Manag. 2010, 97, 1344–1350. [Google Scholar] [CrossRef]
  16. Zhou, H.M.; Zhang, F.C.; Kjelgren, R.; Wu, L.F.; Gong, D.Z.; Zhao, N.; Yin, D.X.; Xiang, Y.Z.; Li, Z.J. Peach yield and fruit quality is maintained under mild deficit irrigation in semi-arid China. J. Integr. Agric. 2017, 16, 1173–1183. [Google Scholar] [CrossRef]
  17. Fan, J.; Wu, L.; Zhang, F.; Cai, H.; Ma, X.; Bai, H. Evaluation and development of empirical models for estimating daily and monthly mean daily diffuse horizontal solar radiation for different climatic regions of China. Renew. Sustain. Energ. Rev. 2019, 105, 168–186. [Google Scholar] [CrossRef]
  18. Griffin, G.; Jokela, W.; Ross, D.; Pettinelli, D.; Morris, T.; Wolf, A. Recommended Soil Nitrate Tests. In Recommended Soil Testing Procedures for the Northeastern US, 3rd ed.; Northeastern Regional Publication No. 493; University of Delaware: Newark, DE, USA, 2009. [Google Scholar]
  19. Oweis, T.Y.; Farahani, H.J.; Hachum, A.Y. Evapotranspiration and water use of full and deficit irrigated cotton in the Mediterranean environment in northern Syria. Agric. Water Manag. 2011, 98, 1239–1248. [Google Scholar] [CrossRef]
  20. Ierna, A.; Pandino, G.; Lombardo, S.; Mauromicale, G. Tuber yield. Water and fertilizer productivity in early potato as affected by a combination of irrigation and fertilization. Agric. Water Manag. 2011, 101, 35–41. [Google Scholar] [CrossRef]
  21. Zhang, S.; Li, P.; Yang, X.; Wang, Z.; Chen, X. Effects of tillage and plastic mulch on soil water, growth and yield of spring-sown maize. Soil Till. Res. 2011, 112, 92–97. [Google Scholar] [CrossRef]
  22. Aziz, O.; Hussain, S.; Rizwan, M.; Riaz, M.; Bashir, S.; Lin, L.; Mehmood, S.; Imran, M.; Yaseen, R.; Lu, G. Increasing water productivity, nitrogen economy, and grain yield of rice by water saving irrigation and fertilizer-N management. Environ. Sci. Pollut. Res. Int. 2018, 25, 16601–16615. [Google Scholar] [CrossRef] [PubMed]
  23. Niang, A.; Becker, M.; Ewert, F.; Tanaka, A.; Dieng, I.; Saito, K. Yield variation of rainfed rice as affected by field water availability and N fertilizer use in central Benin. Nutr. Cycl. Agroecosys. 2018, 110, 293–305. [Google Scholar] [CrossRef]
  24. Pan, J.; Liu, Y.; Zhong, X.; Lampayan, R.M.; Singleton, G.R.; Huang, N.; Liang, K.; Peng, B.; Tian, K. Grain yield, water productivity and nitrogen use efficiency of rice under different water management and fertilizer-N inputs in South China. Agric. Water Manag. 2017, 184, 191–200. [Google Scholar] [CrossRef]
  25. Wang, H.; Wu, L.; Cheng, M.; Fan, J.; Zhang, F.; Zou, Y.; Chau, H.W.; Gao, Z.; Wang, X. Coupling effects of water and fertilizer on yield, water and fertilizer use efficiency of drip-fertigated cotton in northern Xinjiang, China. Field Crops Res. 2018, 219, 169–179. [Google Scholar] [CrossRef]
  26. Wang, X.; Xing, Y. Effects of Irrigation and Nitrogen Fertilizer Input Levels on Soil NO3-N Content and Vertical Distribution in Greenhouse Tomato (Lycopersicum esculentum Mill.). Scientifica 2016, 2016, 5710915. [Google Scholar] [CrossRef]
  27. Long, G.Q.; Sun, B. Nitrogen leaching under corn cultivation stabilized after four years application of pig manure to red soil in subtropical China. Agric. Ecosyst. Environ. 2012, 146, 73–80. [Google Scholar] [CrossRef]
  28. Wang, Q.; Li, F.; Zhao, L.; Zhang, E.; Shi, S.; Zhao, W.; Song, W.; Vance, M.M. Effects of irrigation and nitrogen application rates on nitrate nitrogen distribution and fertilizer nitrogen loss, wheat yield and nitrogen uptake on a recently reclaimed sandy farmland. Plant Soil 2010, 337, 325–339. [Google Scholar] [CrossRef]
  29. Yang, R.; Wang, X. Effects of nitrogen fertilizer and irrigation rate on nitrate present in the profile of a sandy farmland in Northwest China. Proc. Environ. Sci. 2011, 11, 726–732. [Google Scholar]
  30. Gärdenäs, A.I.; Hopmans, J.W.; Hanson, B.R.; Šimůnek, J. Two-dimensional modeling of nitrate leaching for various fertigation scenarios under micro-irrigation. Agric. Water Manag. 2005, 74, 219–242. [Google Scholar] [CrossRef]
  31. Geng, Y.J.; Chen, L.; Yang, C.; Jiao, D.Y.; Zhang, Y.H.; Cai, Z.Q. Dry-season deficit irrigation increases agricultural water use efficiency at the expense of yield and agronomic nutrient use efficiency of Sacha Inchi plants in a tropical humid monsoon area. Ind. Crop Prod. 2017, 109, 570–578. [Google Scholar] [CrossRef]
  32. Li, Y.; Wang, F.; Sun, J.S.; Liu, H.; Yang, J.Q.; Xian, F.; Su, H. Coupling effect of water and nitrogen on mechanically harvested cotton with drip irrigation under plastic film in arid area of western Inner Mongolia, China. J. Appl. Ecol. 2016, 27, 845–854. (In Chinese) [Google Scholar]
  33. Xue, Q.; Zhu, Z.; Musick, J.T.; Stewart, B.A.; Dusek, D.A. Physiological mechanisms contributing to the increased water-use efficiency in winter wheat under deficit irrigation. J. Plant Physiol. 2006, 163, 154–164. [Google Scholar] [CrossRef] [PubMed]
  34. Reynolds, M.; Foulkes, J.; Furbank, R.; Griffiths, S.; King, J.; Murchie, E.; Parry, M.; Slafer, G. Achieving yield gains in wheat. Plant Cell Environ. 2012, 35, 1799–1823. [Google Scholar] [CrossRef] [PubMed]
  35. Wang, B.; Zhang, Y.; Hao, B.; Xu, X.; Zhao, Z.; Wang, Z.; Xue, Q. Grain Yield and Water Use Efficiency in Extremely-Late Sown Winter Wheat Cultivars under Two Irrigation Regimes in the North China Plain. PLoS ONE 2016, 11, e0153695. [Google Scholar] [CrossRef] [PubMed]
  36. Xu, X.; Zhang, M.; Li, J.; Liu, Z.; Zhao, Z.; Zhang, Y.; Zhou, S.; Wang, Z. Improving water use efficiency and grain yield of winter wheat by optimizing irrigations in the North China Plain. Field Crop Res. 2018, 221, 219–227. [Google Scholar] [CrossRef]
  37. Ali, M.H.; Hoque, M.R.; Hassan, A.A.; Khair, A. Effects of deficit irrigation on yield, water productivity, and economic returns of wheat. Agric. Water Manag. 2007, 92, 151–161. [Google Scholar] [CrossRef]
  38. Wu, L.; Zhang, F.; Fan, J.; Zhou, H.; Liang, F.; Gao, Z. Effects of water and fertilizer coupling on cotton yield, net benefits and water use efficiency. Trans. Chin. Soc. Agric. Mach. 2015, 46, 164–172. (In Chinese) [Google Scholar]
  39. Zheng, Z.; Ma, F.; Mu, Z.; Li, J.; Yang, H. Effects of factors of water and fertilizers under mulch drip irrigation on cotton canopy structure and yield. Agric. Res. Arid Areas 2001, 19, 42–47. (In Chinese) [Google Scholar]
  40. Gheysari, M.; Mirlatifi, S.M.; Bannayan, M.; Homaee, M.; Hoogenboom, G. Interaction of water and nitrogen on maize grown for silage. Agric. Water Manag. 2009, 96, 809–821. [Google Scholar] [CrossRef]
  41. Kisekka, I.; Aguilar, J.; Lamm, F.; Rogers, D. Using soil water and canopy temperature to improve irrigation scheduling for corn. In Proceedings of the 2014 Irrigation Association Conference, Phoenix, AZ, USA, 3–6 November 2014. [Google Scholar]
  42. Fritschi, F.B.; Roberts, B.A.; Travis, R.L.; Rains, D.W.; Hutmacher, R.B. Response of Irrigated Acala and Pima Cotton to Nitrogen Fertilization This research was supported in part by grants from Cotton Incorporated, the California Department of Food and Agriculture Fertilizer Research and Education Program, and the California Crop Improvement Association. Agron. J. 2003, 95, 133–146. [Google Scholar]
  43. Wu, L.; Zhang, F.; Zhou, H.; Suo, Y.; Xue, F.; Zhou, J.; Liang, F. Effect of drip irrigation and fertilizer application on water use efficiency and cotton yield in North of Xinjiang. Trans. Chin. Soc. Agric. Eng. 2014, 30, 137–146. (In Chinese) [Google Scholar]
  44. Xing, Y.; Zhang, F.; Wu, L.; Fan, J.; Zhang, Y.; Li, J. Determination of optimal amount of irrigation and fertilizer under drip fertigated system based on tomato yield, quality, water and fertilizer use efficiency. Trans. Chin. Soc. Agric. Eng. 2015, 31, 110–121. (In Chinese) [Google Scholar]
Figure 1. Precipitation and evapotranspiration (ETo) at Yangling, Shaanxi, China. To eliminate extreme variations, daily values are averaged over the previous 30 days. (a) 24-year average daily rainfall and percentage chance of rain falling on that day, both expressed as 30-day running average. (b) 17-year average ETo also expressed as a 30-day running average, overlaid with 2012 and 2013.
Agronomy 09 00360 g001
Figure 2. Effects of different water and fertilizer treatments on soil water content of young apple trees. The soil water content was measured using the gravimetric method, the depth interval spacing was 10 cm (from 0 to 90 cm) and the horizontal interval spacing was 5 cm (from 0 to 25 cm). a,b,c,d = F1 (W1,W2,W3,W4); e,f,g,h = F2 (W1,W2,W3,W4); i,j,k,l = F3 (W1,W2,W3,W4).
Agronomy 09 00360 g002
Figure 3. Effects of different water and fertilizer treatments on soil NO3-N content in rootzone (40~60 cm) of young apple trees on 9 June, 30 July and 19 September in 2012.
Agronomy 09 00360 g003
Figure 4. Effects of different water and fertilizer treatments on soil NO3-N content in rootzone (40~60 cm) of young apple trees on 5 June, 26 July and 16 September in 2013.
Agronomy 09 00360 g004
Figure 5. Effects of different water and fertilizer treatments on soil NO3-N content (0~90 cm) of young apple trees on 19 September in 2012 (a) and 16 September in 2013 (b).
Agronomy 09 00360 g005
Figure 6. Effects of different water and fertilizer treatments on yields of young apple trees in 2013. Irrigation and fertilizer had a very significant impact on apple yield (p < 0.01), and the interaction of water and fertilizer was significant (p < 0.05).
Agronomy 09 00360 g006
Figure 7. Effects of different water and fertilizer treatments on irrigation water use efficiency (IWUE) of young apple trees in 2013. The effect of irrigation on IWUE was very significant in 2013 (p < 0.01), but it was not significant for fertilizer and the interaction of water and fertilizer (p > 0.05).
Agronomy 09 00360 g007
Figure 8. Effects of different water and fertilizer treatments on partial factor productivity (PFP) of young apple trees in 2013. Fertilizer and the interaction with water had a very significant impact on PFP (p < 0.01).
Agronomy 09 00360 g008
Figure 9. Relationship between water consumption rate and dry matter of young apple trees (R2 = 0.769, n = 48).
Agronomy 09 00360 g009
Figure 10. Relationship between yield and dry matterof young apple trees (R2 = 0.9085, n = 24).
Agronomy 09 00360 g010
Table 1. The final value of water applied to each treatment of young apple trees in 2012 and 2013.
Fertilizer
Treatment
Water
Treatment
Water Applied in 2012/(L·tree−1)Water Applied in 2013/(L·tree−1)
F1W1211.13 ± 6.07a280.97 ± 7.32a
W2192.16 ± 8.72b254.95 ± 10.01bc
W3171.71 ± 8.45d214.51 ± 11.27d
W4143.43 ± 3.41fgh174.44 ± 7.71efg
F2W1209.70 ± 5.57a271.28 ± 5.56ab
W2176.88 ± 4.25cd232.53 ± 14.62cd
W3152.94 ± 3.22ef187.23 ± 8.49e
W4134.53 ± 4.52h161.31 ± 9.96fg
F3W1188.10 ± 6.84bc248.75 ± 15.03bc
W2165.71 ± 7.78de220.81 ± 11.07d
W3150.10 ± 7.39fg184.60 ± 13.11ef
W4136.34 ± 3.94gh159.21 ± 7.86g
Test of significance (F value)
Water715.653**913.45**
Fertilizer10.7818.803
Water × Fertilizer1.9710.851
Note: ** means a very significant difference (p < 0.01). a, b, c et al. means significant difference in Duncan (p = 0.05).
Table 2. Effects of different water and fertilizer treatments on dry matter, evapotranspiration and crop water productivity (CWP) of young apple trees in 2012.
Fertilizer TreatmentWater
Treatment
Dry Matter/(g·tree−1)Evapotranspiration/(L·tree−1)CWP/(kg·m−3)
F1W1341.47 ± 11.60ab208.01 ± 4.95a1.64 ± 0.01def
W2337.27 ± 10.61ab190.33 ± 7.78b1.77 ± 0.01bc
W3288.93 ± 7.07cd168.45 ± 7.35c1.72 ± 0.04cd
W4224.13 ± 7.07f140.71 ± 1.81de1.59 ± 0.07efg
F2W1348.21 ± 7.78a207.32 ± 7.07a1.68 ± 0.01de
W2323.67 ± 6.36b173.95 ± 2.12c1.86 ± 0.01a
W3271.97 ± 3.75de149.7 ± 0.72d1.82 ± 0.01ab
W4223.68 ± 15.20f131.22 ± 2.83e1.71 ± 0.08cd
F3W1293.18 ± 7.07c186.06 ± 6.65b1.58 ± 0.02fg
W2265.52 ± 8.64e162.93 ± 7.78c1.63 ± 0.03def
W3237.32 ± 7.92f148.14 ± 6.31d1.60 ± 0.01efg
W4203.01 ± 3.90g133.24 ± 2.12e1.53 ± 0.05g
Test of significance (F value)
Water4143.262**1510.599**81.435**
Fertilizer65.238*11.18519.803*
Water × Fertilizer2.6062.5031.228
Note: * means a significant difference (p < 0.05), while ** means a very significant difference (p < 0.01). a, b, c et al. means significant difference in Duncan (p = 0. 05). The same as below.
Table 3. Effects of different water and fertilizer treatments on dry matter, evapotranspiration and crop water productivity (CWP) of young apple trees in 2013.
Fertilizer
Treatment
Water
Treatment
Dry Matter/(g·tree−1)Evapotranspiration/(L·tree−1)CWP/(kg·m−3)
F1W1780.44 ± 19.09a276.23 ± 7.17a2.83 ± 0.11cd
W2768.78 ± 11.44a252.97 ± 10.19bc3.04 ± 0.17abc
W3603.63 ± 28.26bc28.26 ± 9.90d2.85 ± 0.10bcd
W4450.14 ± 22.88d171.82 ± 5.73ef2.63 ± 0.22de
F2W1774.26 ± 17.38a269.91 ± 5.96ab2.87 ± 0.13bcd
W2762.82 ± 14.83a230.16 ± 12.01cd3.32 ± 0.11a
W3583.34 ± 18.79c184.44 ± 6.43e3.17 ± 0.21ab
W4433.58 ± 28.16d157.50 ± 8.70f2.75 ± 0.13cde
F3W1649.44 ± 34.64b245.83 ± 16.91c2.64 ± 0.14de
W2627.37 ± 30.94bc217.94 ± 10.90d2.88 ± 0.10bcd
W3486.73 ± 28.66d180.65 ± 14.14e2.70 ± 0.15de
W4378.11 ± 28.42e156.20 ± 6.20f2.43 ± 0.28e
Test of significance (F value)
Water162.653**1699.485**10.482*
Fertilizer64.605*8.39142.924*
Water×Fertilizer1.4111.0570.490
Note: * means a significant difference (p < 0.05), while ** means a very significant difference (p < 0.01). a, b, c et al. means significant difference in Duncan (p = 0. 05). The same as below.

