Article

Labile Carbon Additions Reduce Soil Nitrate but Can Increase Maize Fertilizer N Needs

by
Stephen W. Potter
,
John E. Sawyer
and
Marshall D. McDaniel
*
Department of Agronomy, Iowa State University, Ames, IA 50011, USA
*
Author to whom correspondence should be addressed.
Agronomy 2026, 16(9), 933; https://doi.org/10.3390/agronomy16090933
Submission received: 29 March 2026 / Revised: 20 April 2026 / Accepted: 22 April 2026 / Published: 4 May 2026

Abstract

Winter cover crops (WCCs) are effective at reducing N losses from temperate agroecosystems. Although extensive research on WCCs has demonstrated numerous benefits, overall adoption rates in the Midwest U.S. remain low. We evaluated an alternative to WCC’s ability to reduce nitrate (NO3)-N leaching; that is, adding an inexpensive, easy-to-apply, form of labile carbon (C) as a soil amendment intended to immobilize N and mitigate leaching. In the autumn in a typical maize–soybean rotation, we added crude glycerol (a C-rich, biodiesel byproduct) and hypothesized that glycerol carbon (Cglyc) would immobilize N and have no effect on crop growth. More specifically, Cglyc was broadcast applied at three rates (0, 216, and 866 kg C ha−1 y−1) and combined factorially with six spring-applied fertilizer N rates (0, 56, 112, 168, 224, and 280 kg N ha−1) at two sites. In response, we measured: soil profile NO3-N, leached NO3-N, crop health (via SPAD), yield, and maize agronomic optimum N rate (AONR). Cglyc reduced spring soil profile NO3-N by 14–24% across site-years, but had highly variable and non-significant effects on NO3-N leaching. Cglyc had an inconsistent impact on crop SPAD and yield, with Cglyc increasing AONR by ~63 kg N ha−1 (or 31–40%) at one of two sites. Our results show promise for using labile C as a “liquid cover crop” soil amendment. Future studies should explore greater labile C application rates and alternate application timing in order to fine-tune the balance between environmental benefits and crop productivity.

1. Introduction

Enhancing global food security while minimizing environmental degradation remains a formidable agriculture challenge for the 21st Century. Nutrient losses are one of the major concerns, especially Nitrogen (N), which limits crop growth; thus, supplemental fertilizer is required for most annual cereal crops [1,2]. However, surplus inorganic soil N not taken up by the crop can be lost as a gas or leached, resulting in less-than-desirable environmental outcomes.
When leached from agricultural soils, N is primarily lost as its most mobile form, nitrate (NO3-N), which can have deleterious impacts on water quality [3,4]. In many temperate agroecosystems, soil NO3-N losses peak in the spring after soil thaws and when the ground is fallow, including after autumn N fertilizer applications [5,6]. These losses directly impact freshwater ecosystems and lead to negative environmental impacts such as eutrophication, human health concerns, as well as an economic loss to the grower, since N lost via leaching is not available for that year’s crop. One common practice to mitigate the effects of spring NO3-N leaching are winter cover crops (WCC).
Winter cover crops are planted in the autumn near row-crop maturity or after cash crop harvest. In the Midwest U.S., the most common WCC is cereal rye (Secale cereale) due to its winter hardiness and accessible seeds. Cereal rye is effective at taking up and temporarily immobilizing NO3-N, thus reducing leaching by as much as 30 to 70% compared to control treatments [7,8,9]. Alongside the reduction in leached NO3-N, WCCs also: reduce soil erosion [10], provide plant diversity [11,12], suppress weeds [13], improve water infiltration [14], and increase soil C [15,16,17].
While these benefits seem overwhelming and comprehensive, WCCs do have negative effects. Excessive WCC biomass or poor termination timing can decrease maize yields, sometimes colloquially referred to as “yield drag” [2,11,18,19], and grass species used as WCCs, like cereal rye, can be vectors for seedling diseases when planted prior to maize [20]. There are also socioeconomic barriers that lower WCC adoption rates in the Midwest U.S. [21,22]. Adoption rates are estimated at only 7.2% as of 2021 in the continental U.S., up only 1.8% from a decade earlier [23]. These low adoption rates alone suggest that alternative practices to WCCs are needed for effective NO3-N leaching reduction. Among these alternatives, one potential solution is adding labile C as a soil amendment to promote microbial immobilization of NO3-N.
Labile C is a small, but critical, fraction of the total soil organic carbon (SOC) pool. Labile C is an energy source readily metabolized by soil microorganisms which regulates many microbial processes (including nutrient cycling). While making up less than 10% of the total SOC pool [24], labile C is a primary driver in soil microbial processes due to C being the primary limiting element to most soil microorganisms during most of the year [24]. When labile C is added to soils in sufficient quantities, >500 mg C kg−1 dry soil according to Cheng et al. (2017) [25], it invariably causes soil microorganisms to take up bioavailable N (dissolved and exchangeable), also called net N immobilization. This begs the question: Can labile C be added to agricultural soils to temporarily immobilize soil NO3-N during winter and early spring, thereby reducing N leaching, similar to the function of WCCs?
While there are many potential sources of labile C within agricultural regions, one specific, easily available, and inexpensive source of labile C is glycerol (or glycerin) C (Cglyc) from biodiesel production. In controlled laboratory settings, adding Cglyc to soils reduced soil NO3-N concentrations between 30–61% on average [26,27], delayed the release of inorganic N depending on Cglyc rate [28], increased SOC by up to 0.2% [26], and showed no or slight negative impacts on plant health, with the application timing being the main reason for any adverse effects [26]. Despite this potential for rapid NO3-N immobilization, most studies of Cglyc on soils and plants are in laboratory or greenhouse settings, and only one short-term field study exists to our knowledge [29].
In Potter et al. (2023) [29], glycerol was shown to strongly reduce soil profile NO3-N and this related directly to microbial immobilization or uptake of Cglyc. Applying 216 and 866 kg Cglyc ha−1 in autumn, after soybean harvest, reduced soil profile NO3-N by 13 to 57% when measured 19 d later and down to a depth of 45 cm. These results demonstrate potential for Cglyc as a labile C source to immobilize NO3-N, thus reducing leaching during late autumn and early spring, and potentially releasing it over time [28].
To test the long-term potential of Cglyc to reduce N leaching, we implemented a field study where Cglyc was broadcast applied in two successive years after maize and soybean harvest. Our primary objective was to examine the effect of Cglyc on spring profile soil NO3-N and shallow NO3-N leaching, and secondarily, to study the impact of Cglyc on maize and soybean production and response to glycerol and N application. We hypothesized that adding Cglyc to maize–soybean rotation would: (a) reduce NO3-N leaching from the soil profile (driven by NO3-N immobilization), (b) reduce spring soil profile NO3-N and plant-root simulator NO3-N—both indicators of early, plant-available N, and (c) have a neutral or negative impact on maize and soybean yields due to increased NO3-N immobilization.

2. Materials and Methods

2.1. Site Description and Field Plot Layout

This study was carried out at two sites: Iowa State University’s Agriculture Engineering and Agronomy Farm (Central site) in Boone County, IA, USA (42.020950, −93.773854) and Northwest Research and Demonstration Farm (NW site) in O’Brien County, IA, USA (42.924590, −95.539041). Based on a 50-year average, the mean annual temperature for the Central site is 8.6 °C with a mean annual rainfall of 974 mm; the NW site has a mean temperature of 7.2 °C with a mean annual rainfall of 762 mm [30]. The Central site soils are Mollisols, predominately from soil series Nicollet loam, Clarion loam, Webster clay loam, and Canisteo clay loam (Table 1). The NW site soils are Mollisols from soil series Primghar silty clay loam and Galva silty clay loam (Table 1).
The Central site had been in a maize–soybean rotation since 2011 and the NW site had been in a maize–soybean rotation since 2006. The study began at both sites with the cultivation of maize during the first season and concluded with the cultivation of soybean in the second season. Soil samples (0–15 cm depth) for routine soil tests were collected in the autumn before treatment applications, as described in further detail in Potter et al. (2023) [29]. Phosphorus and potassium fertilizers were applied in the autumn 2018 as needed based on soil test results [31].
We used a randomized complete block design with four replications at both sites. The individual main plot treatments were Cglyc rate, with 12.2 × 45.6 m plots. The split- or sub-plot treatments were N rate, with 6.1 × 15.2 m plots (8 crop rows, 76 cm width). Each block contained three glycerol treatments of 0, 561, and 2244 L ha−1 of crude glycerol product. The crude glycerol used in this study was provided by the Renewable Energy Group, Inc. (REG, Ames, IA, USA), in which the biodiesel feedstock source was predominately soybean oil (Table S1). Glycerol C comprised approximately 79% of the liquid by mass, with the remainder being mostly water. This crude glycerol corresponded to application rates of 0, 216, and 866 kg Cglyc ha−1, hereafter referred to as 0C, 216C, and 866C. These rates were derived from estimated glycerol costs to producers; the 216C rate is approximately equivalent to the cost of cereal rye CC seed (at current market value), while 866C is simply approximately 4× the lower rate to determine if a more prominent effect occurs at higher rates.
Glycerol was broadcast applied to the soil surface after soybean harvest on 26 October 2018 and after corn harvest 5 November 2019 at the Central site with an AGCO SpraCoupe applicator (Model 4660; AGCO, Duluth, GA, USA), and after soybean harvest on 31 October 2018 and after corn harvest 4 November 2019 at the NW site with a Hagie applicator (Model 284; Hagie, Clarion, IA, USA). Applications were the width of two N rate subplots (12.2 m). Glycerol was applied to the same plot each autumn. Due to the viscosity of the crude glycerol, applications required some modification: line and nozzle screens were removed, flat fan or flood nozzles were used for low or high rates, two passes were made for the high rate, or the glycerol was diluted to a 1:1 ratio with water.
The maize hybrids used in this study included Pioneer PO825 AMXT (Corteva Agriscience (Pioneer Brand), Wilmington, DE, USA) at the Central site with a seeding rate of 84,015 seeds ha−1 on 16 May 2019, and Pioneer PO157 AMXT at the NW site with a seeding rate of 86,677 seeds ha−1 on 14 May 2019. Spring N fertilizer was applied as urea fertilizer (SUPERU®; Koch Agronomic Services; Wichita, KS, USA; 46% N). This N fertilizer was applied by hand at six rates (0, 56, 112, 168, 224, and 280 kg N ha−1) on 16 May 2019 immediately after maize planting at the Central site, and 20 May 2019 at the NW site. The soybean varieties used in this study included Pioneer P25A96L at the Central site with a seeding rate of 338,533 seeds ha−1 on 13 May 2020, and Pioneer P23A15X at the NW site with a seeding rate of 345,947 seeds ha−1 on 4 May 2020. The hybrids/varieties and seeding rates were determined to be suitable for that specific region of IA by the ISU farm managers that assisted with the project. There was no soil tillage after the prior-crop harvest or after glycerol application, and both maize and soybean were no-till planted.

2.2. Soil Sampling and Analysis

Soils from the Central site were sampled on 16 April 2019, before N fertilizer application and maize planting. Soils from the NW site were sampled 7 June 2019, after N fertilizer application and maize planting but only in the 0N plots, due to a weather delay. During the 2020 season, soils were sampled from the Central site on 10 April 2020, and 21 April 2020 for the NW site, both of which were sampled before soybean planting. During the 2020 season, soil samples were taken to represent all three glycerol rates and three of the spring 2019 fertilizer N rates (0, 112, and 280 kg N ha−1). Five soil cores were sampled to a depth of 45 cm in plots that were representative of all three crude glycerol rates. The soil cores from both sites were divided into four depth increments in the field (0–5, 5–15, 15–30, and 30–45 cm), homogenized, and bagged. Soils were kept on ice until they were transported back to the laboratory. Once in the laboratory, soils were refrigerated at 4 °C until they were processed (10 to 18 d after sampling).
Soil cores were first sieved through an 8 mm sieve to break up larger clods or plant matter. Soils were then sieved through a 2 mm sieve and homogenized. Then sub-samples were split into two: one for fresh analyses and the rest air-dried at room temperature (22 °C). Fresh soils (5 g) were extracted with 25 mL of 0.5 M potassium sulfate (K2SO4), shaken for 1 h at 200 rpm, centrifuged at 1200 rpm for 3 min, and filtered through Whatman #1 filter paper (Whatman plc, Maidstone, UK) into 20 mL polyethylene scintillation vials. Samples were kept frozen at −20 °C until inorganic N analysis. Salt extractable NO3 was analyzed using the vanadium (III) chloride method read at a wavelength of 540 nm ([32]). Samples were analyzed in duplicate. Calibration curves for NO3 standards were made using the same extraction matrix. Salt-extractable NH4+ was analyzed using the ammonium salicylate and cyanurate methods read at a wavelength of 595 nm ([33]). Calibration curves for NH4+ standards were made using the same extraction matrix. Colorimetric reactions were measured on a Biotek SynergyHTXTM plate reader (BioTek©, Winooski, VT, USA).

2.3. Plant Root Simulator N—Proxy of Net N Mineralization

Plant root simulator (PRS) probes were buried as an integrative measure of plant available nutrients to a depth of 15 cm (Western Ag Group, Saskatoon, SK, Canada; [34]; [35]. Within the eight-row maize plots, six maize plants were removed (not consecutive within a row) at an early growth stage (V2–V4) and replaced with a PRS probe. PRS probes were placed vertically into the top 15 cm of the soil as per the installation method provided by Western Ag Group. Of the six probes placed into the treatment plot, three were anion and three were cation ion-exchangeable membranes. The probes were distributed along rows two and seven in the plots as these rows would not be included for final yield measurements. After 30 d, the PRS probes were recovered, washed with Deionized water, and mailed to Western Ag Group for analysis. The procedure to analyze the nutrients from the probes included: submerging the probes in 0.5 N HCl for 1 h, then analyzing the solution using automated colorimetry and inductively-coupled plasma spectrometry [35].

2.4. Inorganic N Leaching (Nitrate + Ammonium)

Ion-exchange resin lysimeter cartridges were constructed and installed at the Central site on 26 October 2018 after 2018 soybean harvest to measure annual inorganic N leaching. The lysimeters were recovered on 24 October 2019, after maize harvest, and replaced with new lysimeters for the following soybean year, which were recovered 16 October 2020 after soybean harvest. Ion-exchange resin lysimeters were constructed using 7.62 cm diameter PVC and 25 g of ion exchange resin beads [36,37]. Lysimeters were installed in plots representing all three Cglyc rates and three of the fertilizer N rates (0, 112, and 280 kg N ha−1) at 50 cm depth with two analytical replicates in each plot.
Once recovered, lysimeters were cleaned of any soil and the resin extracted with 200 mL of 2 M KCl solution, shaken for 1 h, and vacuum extracted through 0.45-micron filter paper. This extraction method was adapted from Susfalk and Johnson (2002) [37]. These salt-extracted NO3 and NH4+ samples were analyzed using the same methods as the inorganic N extracted from soil samples discussed previously (see above).

2.5. Maize and Soybean SPAD Measurements and Yield

Both maize and soybeans were analyzed for leaf chlorophyll content twice during the growing season to detect any stress. Chlorophyll approximation was measured with a handheld Soil Plant Analysis Development (SPAD) Minolta-502 Chlorophyll Meter (Spectrum® Technologies, Inc., Aurora, IL, USA). The ability of SPAD measurements to approximate chlorophyll content have been validated in several studies across a variety of crops concentration [38,39,40]. SPAD readings are often used to detect N limitations in maize and can also be used to determine fertilizer N application rates [41,42].
Maize SPAD readings were taken twice at both sites, at the V10 stage and once at the R1 growth stage [43]. Stages were chosen based on the likelihood of being able to successfully measure N stress, as N uptake in maize increases closer to the later vegetative stages [44,45]. Measurements on maize were taken in the middle rows of the plots with approximately 20 plants contributing to a plot average SPAD value. Measurements were taken approximately in the middle of the maize leaf, halfway between the leaf edge and the midrib. At the V10 stage, measurements were collected from the uppermost fully developed leaf with the leaf collar showing, and at the R1 stage from the leaf immediately below and opposite the ear leaf. Leaves that indicated damage were skipped and not included in the plot average. Soybean SPAD measurements were taken twice during the 2020 season, with the first measurement at R2 and second at R5 growth stages [46,47]. Measurements at each stage were from one of the three uppermost fully developed leaves on 20 randomly selected plants. Damaged leaves were skipped and not represented in the plot average.
Maize was harvested on 17 October 2019 at the Central site with a four row combine, using the middle four rows as a representative measurement of plot yield. The maize at the NW site was harvested on 30 October 2019 with a six row combine, using the middle six rows as a representative measurement of plot yield. Soybeans were harvested on 7 October 2020 at the Central site with a six row combine, using the middle six rows as a representative measurement of plot yield, and on 30 September 2020 at the NW site, also with a six row combine.

2.6. Statistical Analysis

Statistical analyses were conducted in R (version 4.0.3). Data were checked for normality and heterogeneity of variances using the ggResidpanel package (version 0.3.0) and outliers that exceeded the calculated 1.5 interquartile range were removed. Data that violated the normality and equal variance assumptions were transformed accordingly. Leached inorganic N, soil extracted inorganic N, maize and soybean SPAD, and maize and soybean yield were analyzed with linear mixed models, with glycerol C rate, N rate, soil depth, and interactions as fixed effects, and replication as a random effect [48]. Linear mixed-effect models were created using the lme4 package (version 1.1–26). Estimated marginal means were computed for the linear mixed-effect models using the emmeans package (version 1.5.4), and an analysis of variance (ANOVA) test was run for each model to determine significant factor variable effects and interactions on each measured response using type-III sums of squares, with α ≤ 0.05 for statistically significant and α = 0.1 for marginal significance. Pairwise contrast comparisons from the emmeans package were used to determine where any significant treatment effects occurred using the Tukey test for multiple comparisons where appropriate. Maize agronomic optimum N rate (AONR) was calculated from quadratic plateau models with the nlraa (version 1.9.3) and soiltestcorr package (version 2.2.1).

3. Results

3.1. Weather and Growing Conditions

The annual average temperature at the Central IA site was recorded as 9.5 °C in 2018, 9.0 °C in 2019, and 10.4 °C in 2020 [30] (Figure S1). Mean annual temperature at the NW site was recorded as 7.3 °C in 2018, 6.9 °C in 2019, and 8.6 °C in 2020. Annual precipitation varied at both research sites, with 2018 considered as a wet year in Iowa and 2020 being a dry year. The total annual precipitation at the Central site was 1264 mm in 2018, 917 mm in 2019, and 586 mm in 2020. The total annual precipitation at the NW site was 973 mm in 2018, 1041 mm in 2019, and 589 mm in 2020.

3.2. Spring Soil Profile NO3-N (Both Sites) and Plant-Root-Simulator® N (Central IA Site)

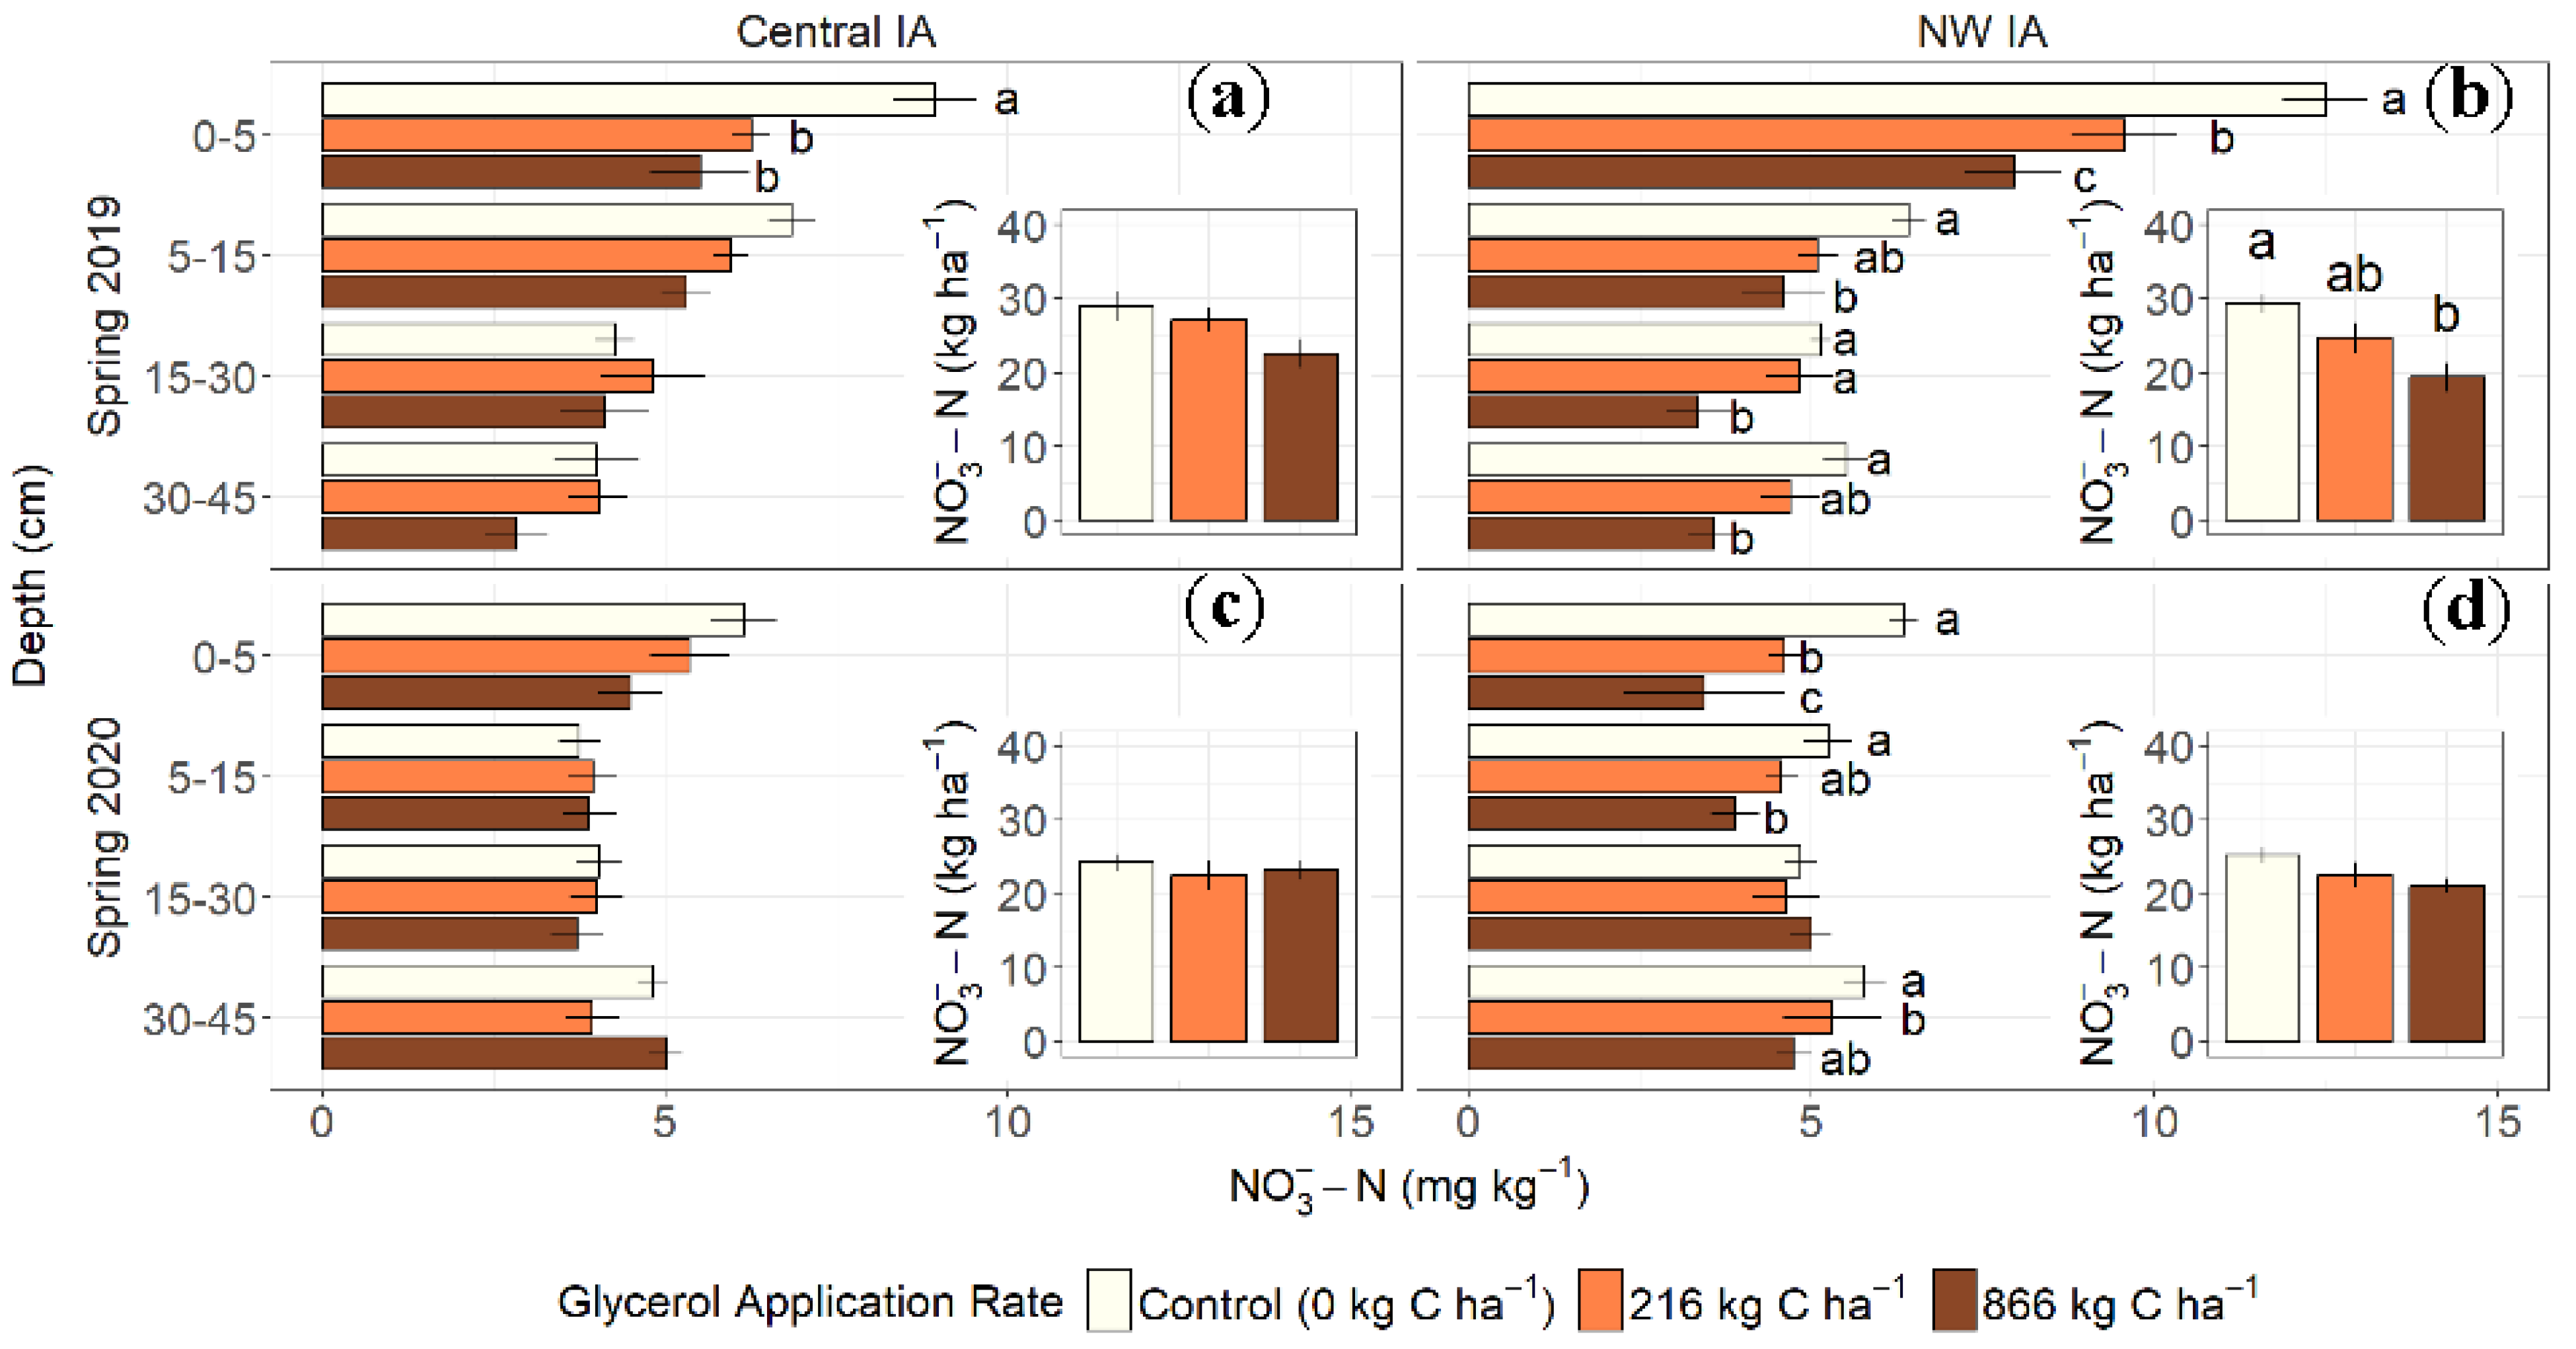
Spring profile soil NO3-N varied by depth across the four site-years (Figure 1, Table 2), and Cglyc had inconsistent effects. Soil NO3-N concentrations ranged from 0.5 to 16 mg N kg−1 across depths and site-years, and on average NO3-N concentration was 12% greater at NW site compared to Central site. The effects of Cglyc on soil NO3-N were also greater at the NW compared to the Central site, and 866C kg C ha−1 tended to have greater effect on reducing soil NO3-N than 216C. This is opposite of what we expected, since the sampling of NW site was delayed due to weather. We would have expected the Cglyc effect to be more prominent closer to its application in autumn 2018.
In spring 2019, Cglyc significantly decreased soil NO3-N in surface soil (0–5 cm) by between 26 to 37% across both sites and Cglyc rates (p < 0.01). This effect was consistent to a depth of 45 cm at the NW site; however, it diminished with increasing depth at the Central site, with NO3-N consistently lowest at 866C (Figure 1). When summed as a total soil profile (0 to 45 cm), Cglyc decreased NO3-N stock by 11 to 28% across both sites and rates, though only significant at the NW site.
In spring 2020, the Cglyc significantly decreased soil NO3-N in surface soils at various depths at the NW site (p < 0.05), but not at the Central site (Figure 1). At the NW site, 866C significantly decreased soil profile NO3-N to a depth of 15 cm, and 216C only decreased NO3-N at 0–5 and 30–45 cm depths. When summed across the total soil profile (0 to 45 cm), Cglyc decreased NO3-N stock by 9 to 11% across both sites and all Cglyc and N rates.
Glycerol C did not affect any of the plant-available nutrients measured via PRS probes (Table S2). However, fertilizer N rate (112 and 280 kg N ha−1) did affect bioavailable nutrient concentrations. Increasing N rate resulted in an increase of NO3-N, calcium, potassium, phosphorus, iron, copper, zinc, sulfur, aluminum, and lead (p < 0.05, Table S1).

3.3. Inorganic Nitrogen Leaching (Central IA Site Only)

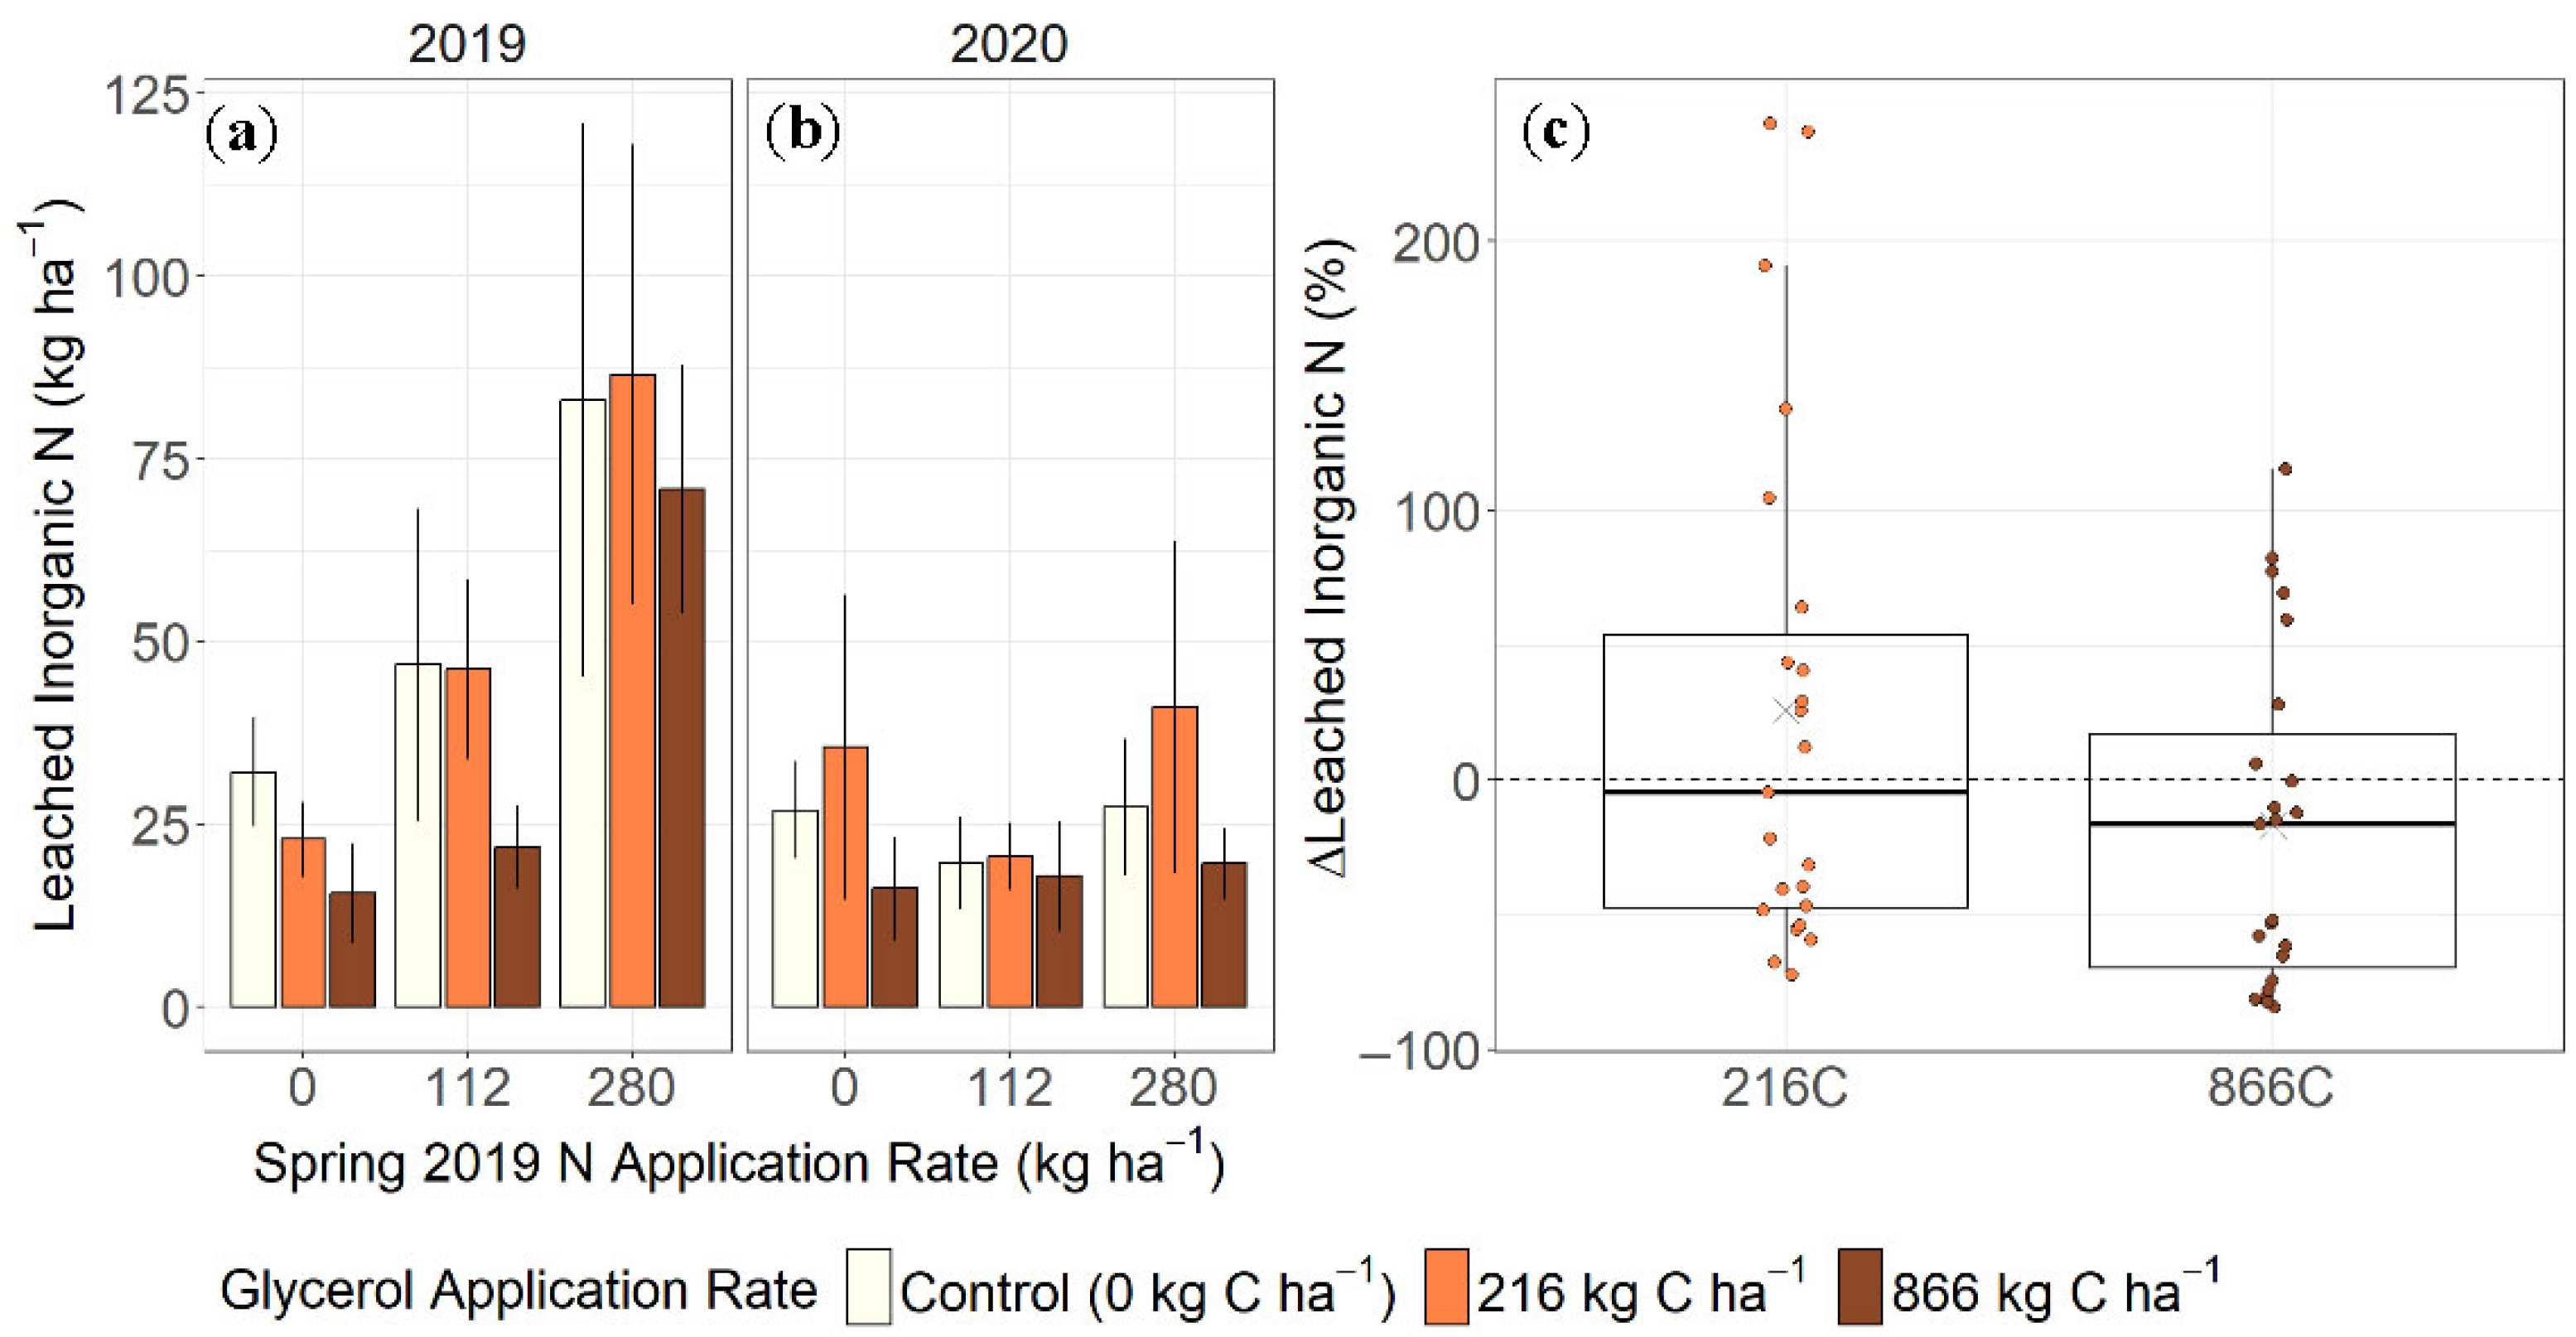
Leached inorganic N (NO3-N plus NH4+-N), measured in the resin lysimeters only at the Central site, was highly variable across years and treatments (Figure 2, Table 2). Fluxes of N leaching ranged from as low as 4 to as high as 229 kg N ha−1 y−1. There was no significant Cglyc effect on N leaching. In the maize year (autumn 2018 to autumn 2019); however, N leaching was significantly increased by N fertilizer regardless of Cglyc addition (p < 0.01). For every 1 kg N fertilizer added, about 0.1 kg N ha−1 leached to 50 cm depth (R2 = 0.1, Figure S2). The soybean year (autumn 2019 to autumn 2020) was particularly dry (Figure S1), N leaching was low, and there was no effect from the previous maize year’s N fertilizer or Cglyc.

3.4. Glycerol C Impact on Maize and Soybean Crops

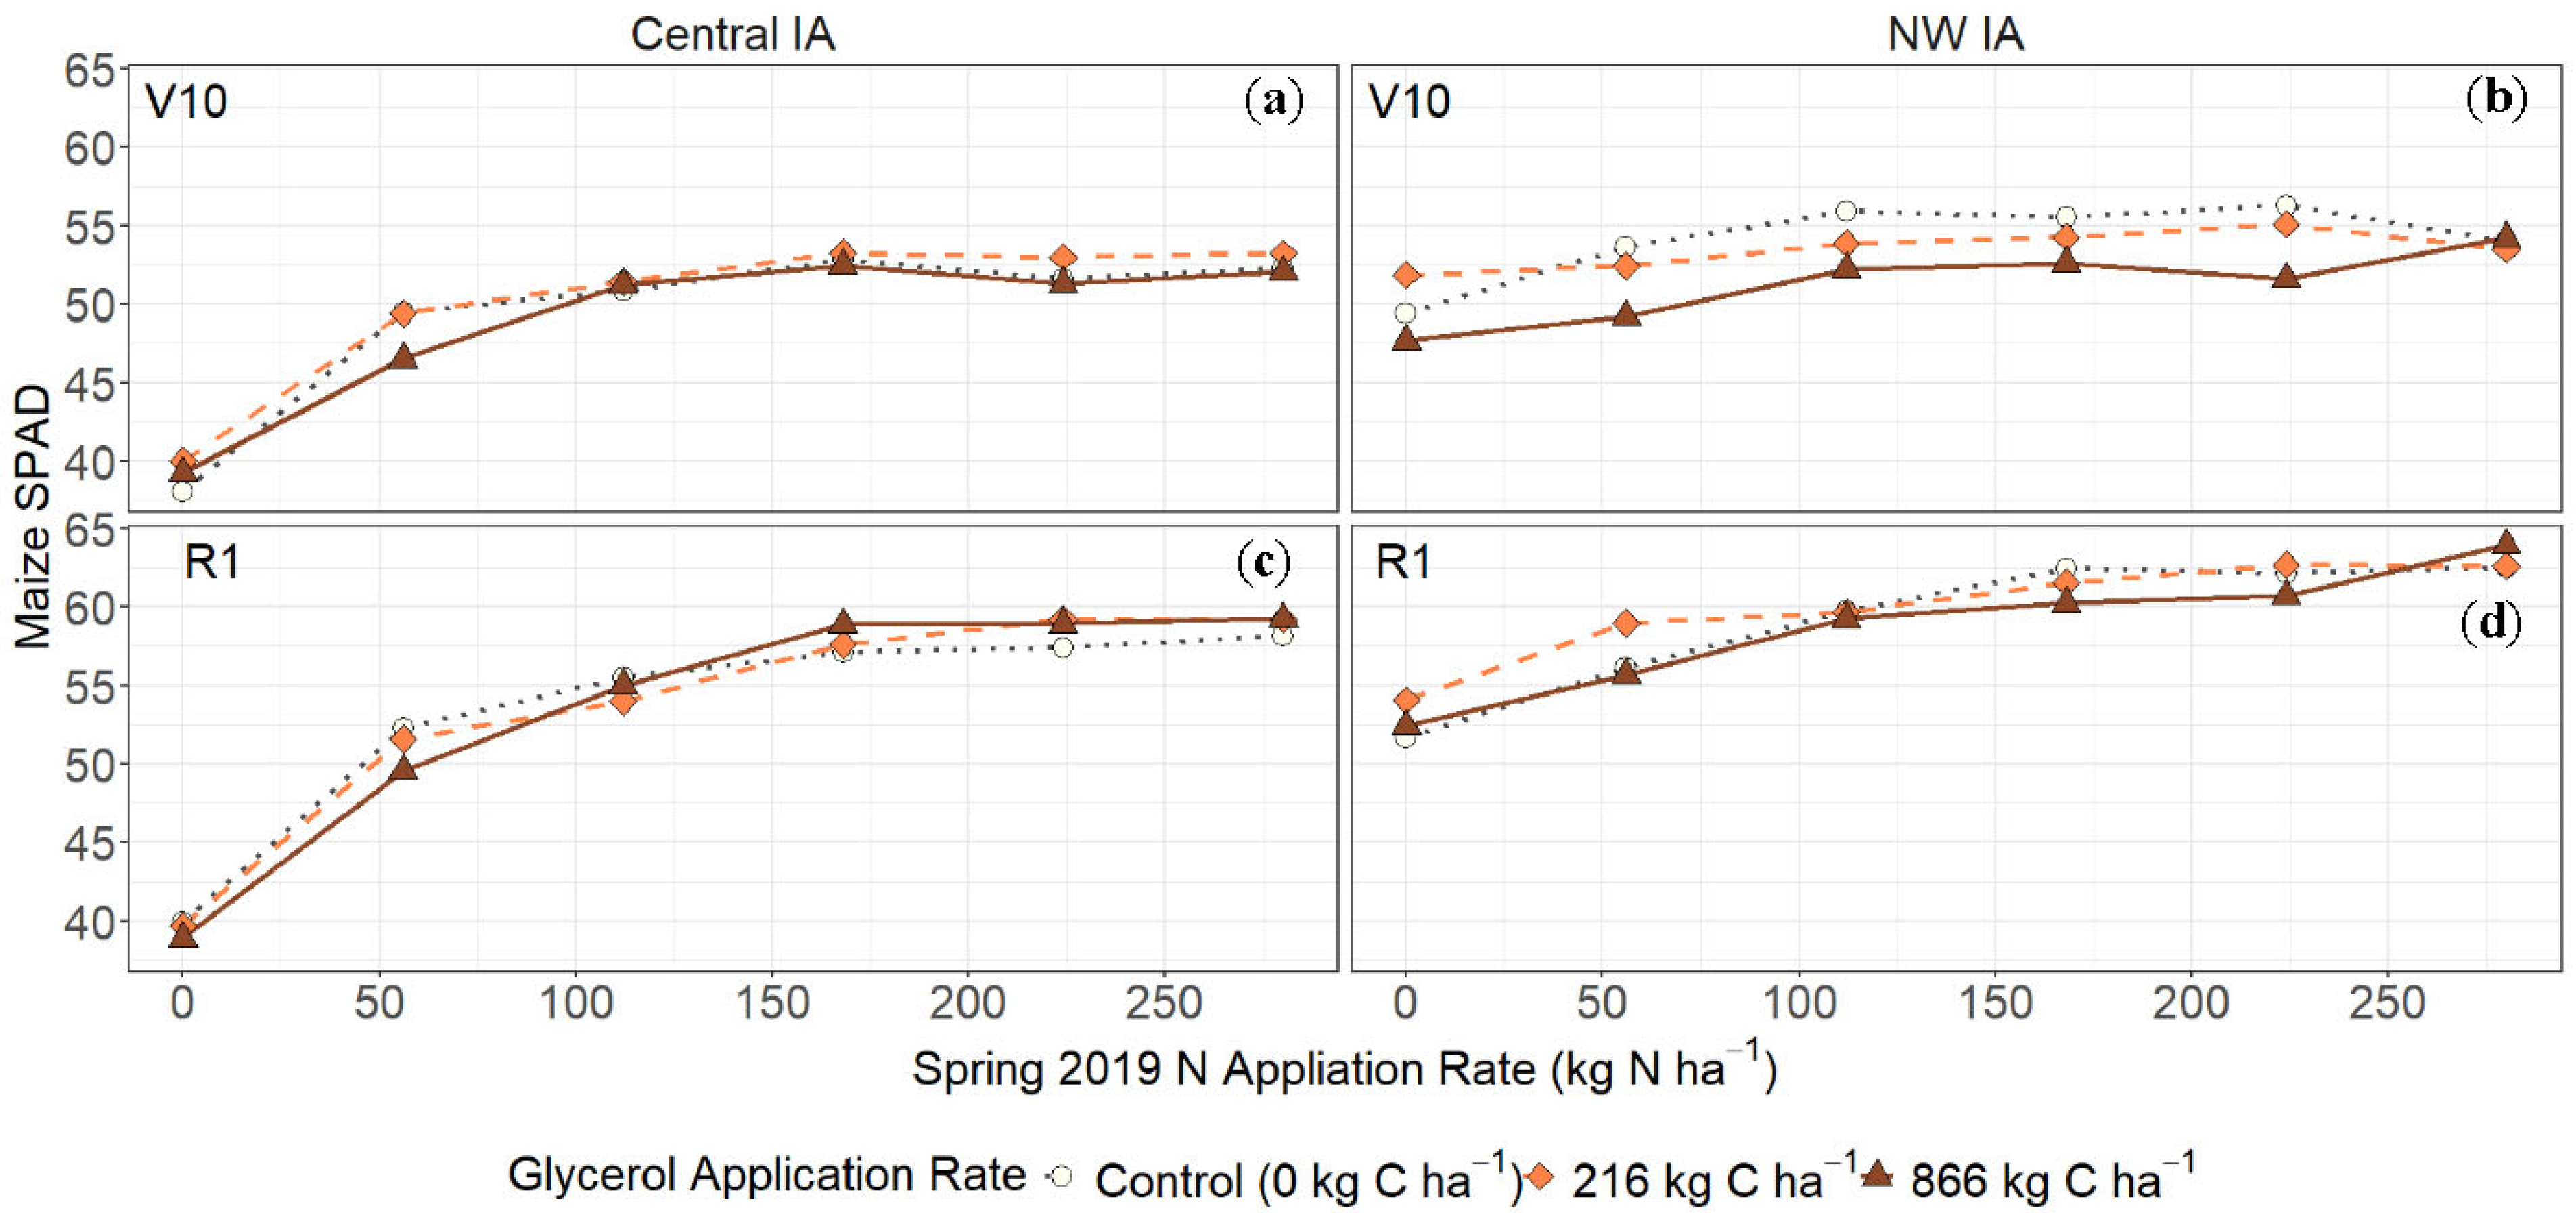
Maize SPAD readings ranged from 31 to 66 and increased with fertilizer N (Figure 3, Table 3). The “flat” SPAD curves at NW suggest that maize was less responsive to fertilizer N compared to Central site (Figure 3), indicating greater soil N supply at the NW site. Adding Cglyc had little effect on maize SPAD at either crop stage. The one exception, however, was that as compared to 0C, the 216C rate, and especially the 866C rate, decreased V10 maize SPAD at the NW site (p < 0.05) across all N rates except the highest. Adding Cglyc had no effect on soybean SPAD readings (Figure S3, Table 2).
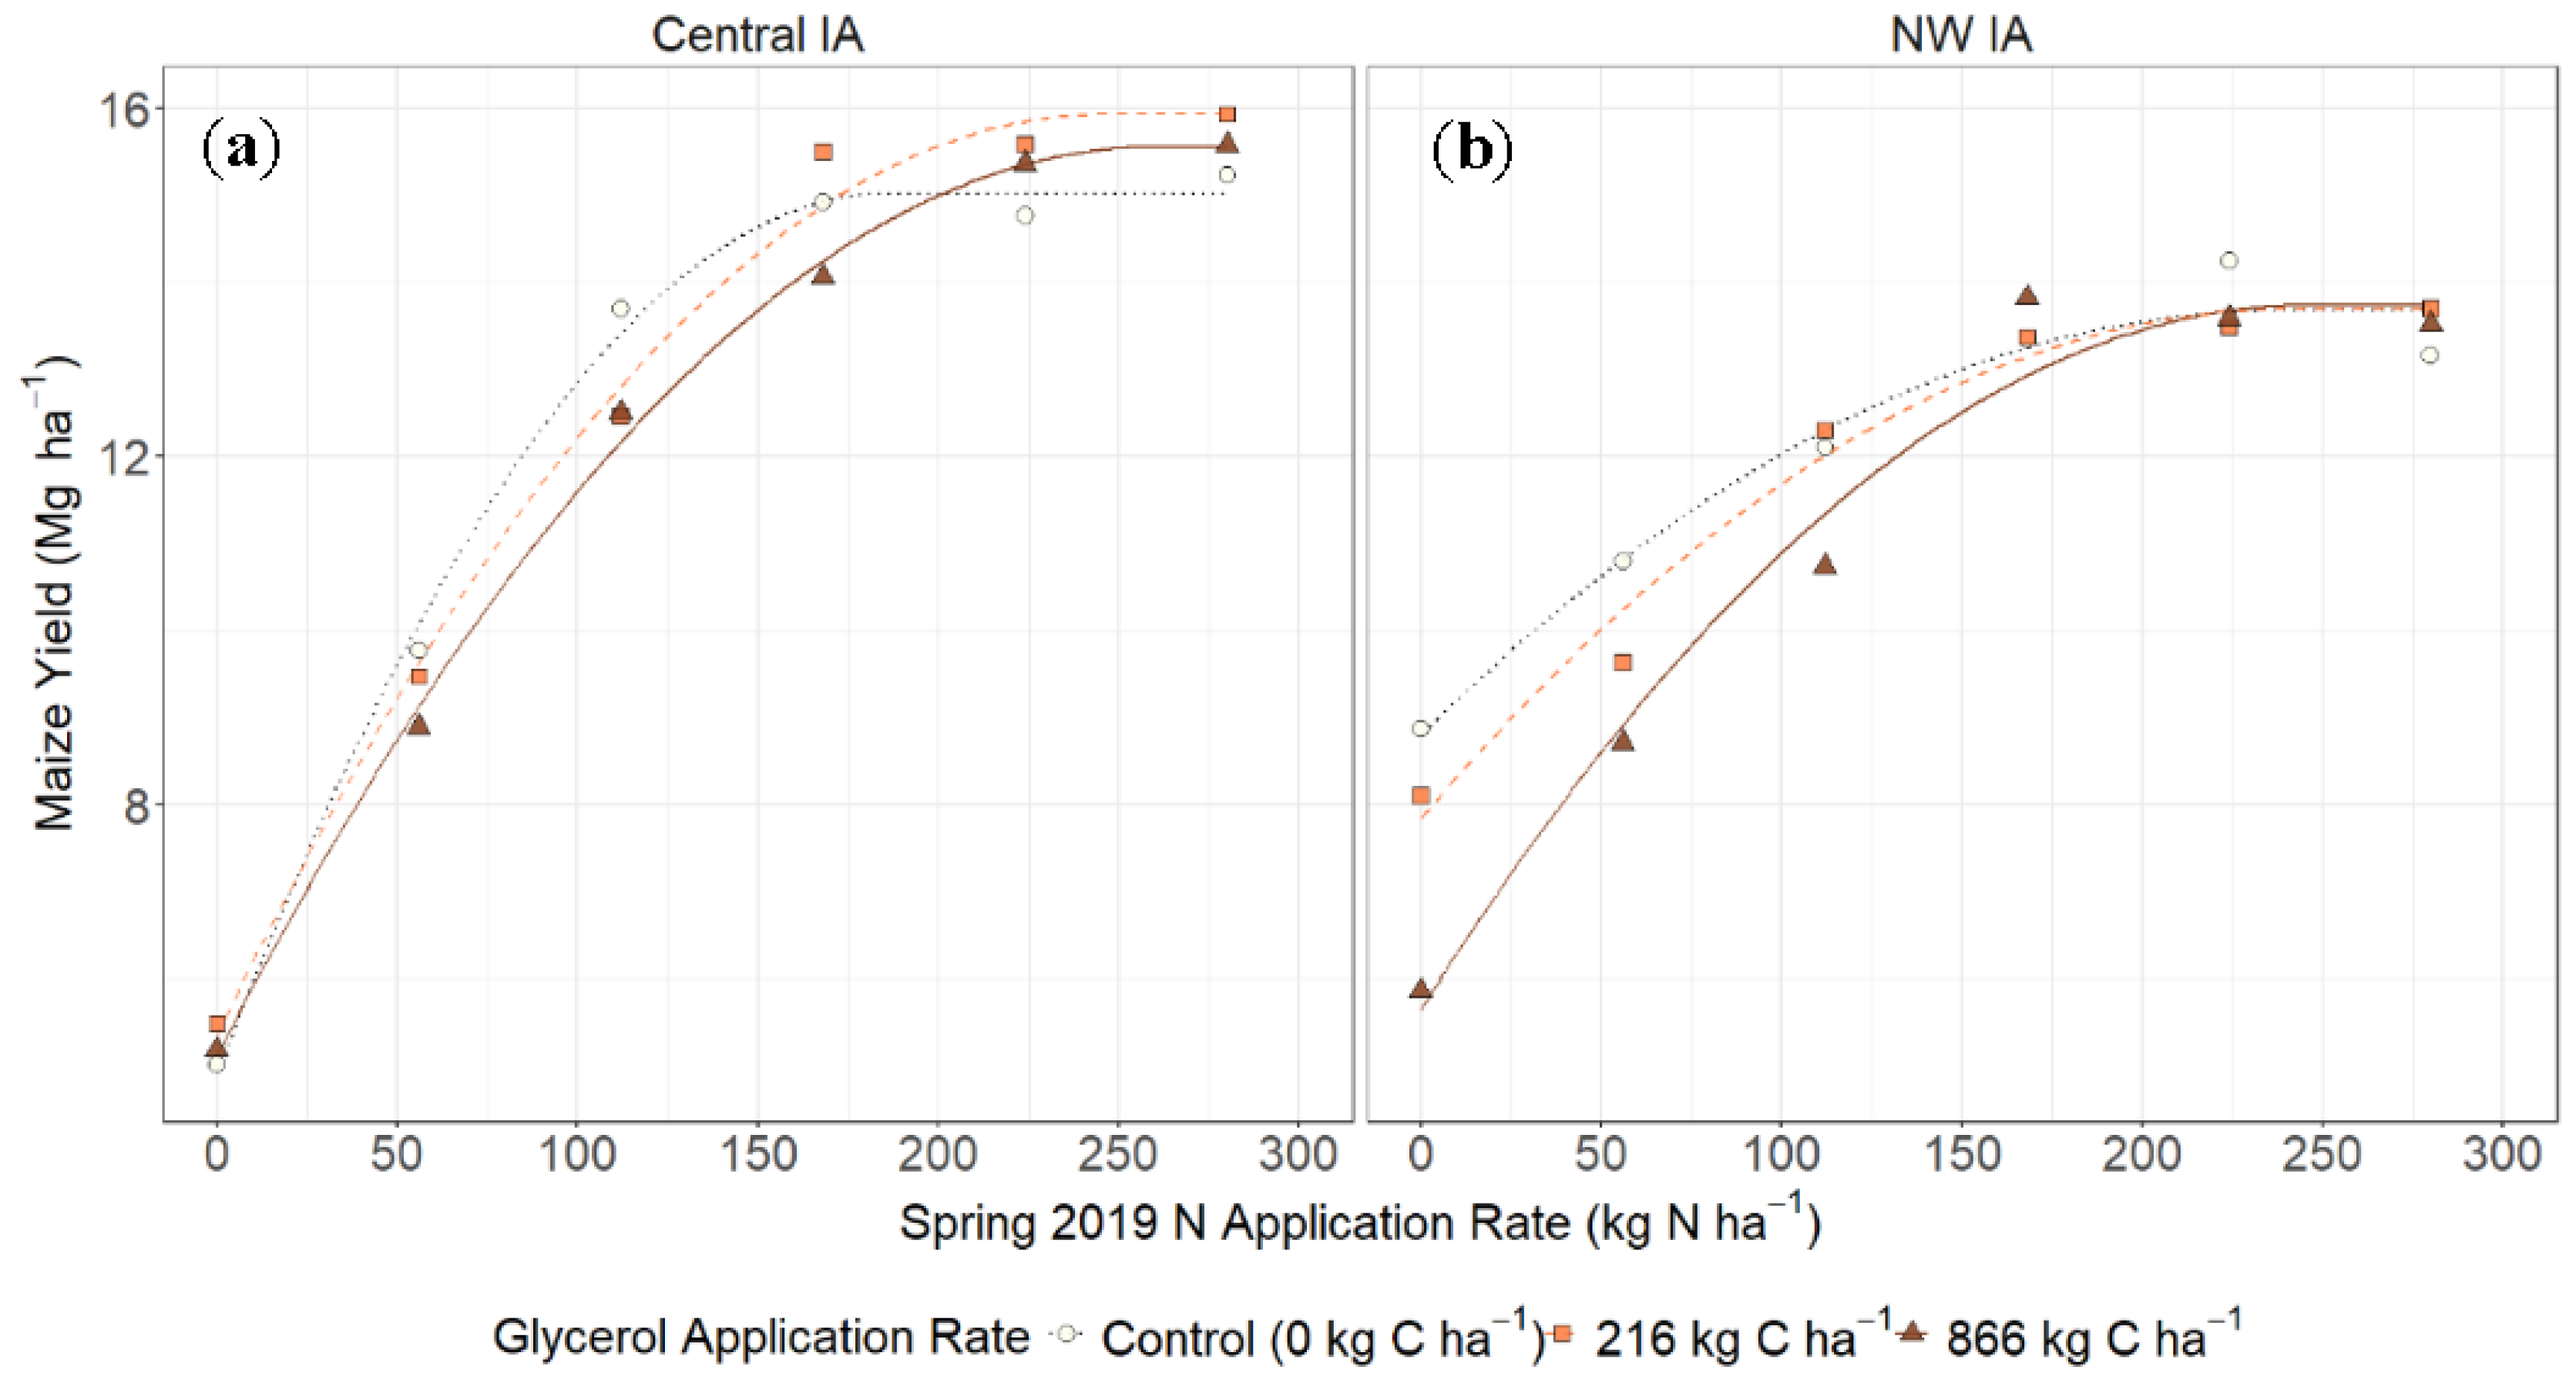
Maize yield ranged from 4.3 to 18.0 Mg ha−1 and was responsive to fertilizer N at both sites (Figure 4, Table 2). For example, the 0N yield was 34 to 57% of the maximum, non-N-limited yields at both sites and Cglyc rates. Supporting the SPAD data, the Central site was more responsive to fertilizer N than the NW site.
Adding Cglyc had differing effects on maize N-responses within each site (Figure 4, Table 2). At the NW site, there was a marginally significant interaction between N and Cglyc rates and a significant Cglyc main effect (Table 2). Adding Cglyc decreased NW maize yield at the two lowest N rates (0N and 56N, p < 0.01). When no N was added, 866C decreased maize yield by 3.1 Mg ha−1 on average compared to 0C. The same Cglyc rate also decreased maize yield by 2.1 Mg ha−1 at the next lowest N rate (i.e., 56N). Despite these significant within-N-rate differences among Cglyc treatments, the AONR coefficient results were fairly similar (Figure 4, Table 3).
A quadratic plateau model was best-fit common model for all the N rate response curves (Figure 4, Table 3), although the fit was better at Central (R2 = ~0.94) compared to NW (R2 = ~0.75). Maize AONR, determined from the regression model fits, ranged from 197 to 261 kg N ha−1, and yield at AONR ranged from 13.7 to 16.2 Mg ha−1. Maize AONR increased with Cglyc application rate at the Central site at 197, 257, and 261 kg N ha−1 for 0C, 216C, and 866C, respectively. At Central, the greatest yield at AONR was in the 216C treatment. However, at NW, Cglyc had no effect on AONR nor yield at AONR.
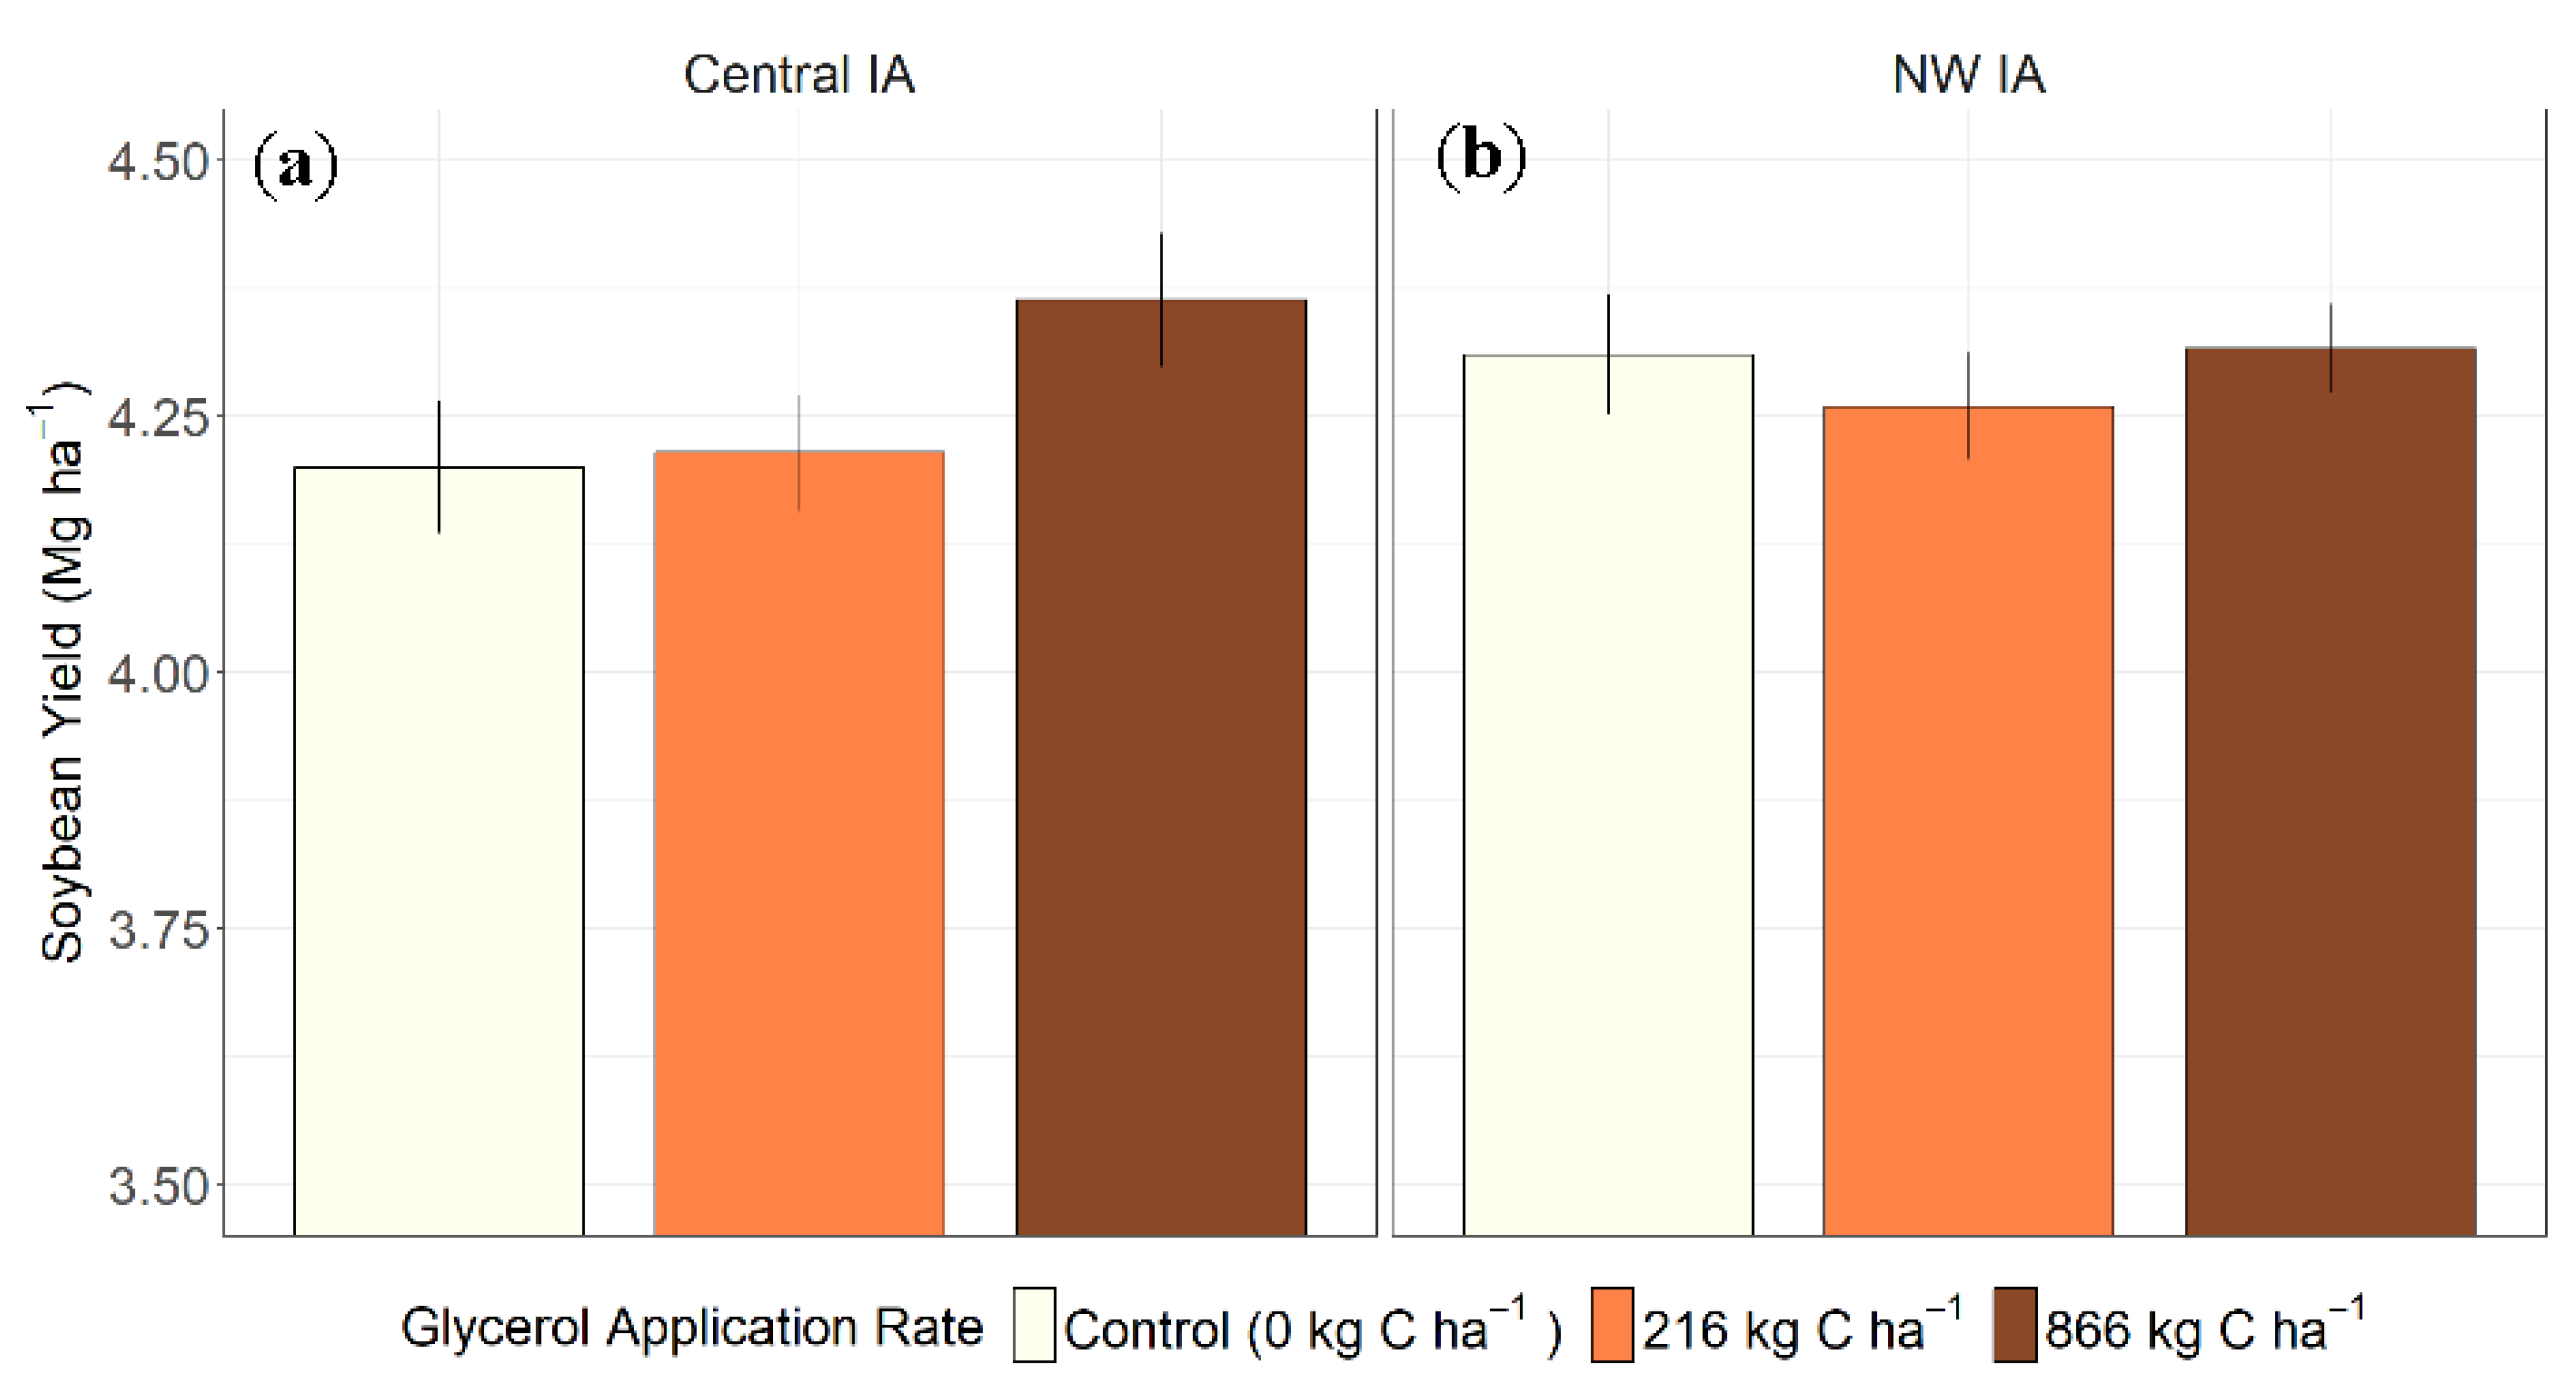
Soybean yields were very similar across both sites and there was only a marginal effect of previous maize N rates at the Central site (Table 2); therefore, the main Cglyc effects were analyzed across N rates (Figure 5). Glycerol had no significant effect on soybean yields (Figure 5, Table 2).

4. Discussion

Nitrate leaching in agroecosystems remains a major challenge for Midwest U.S. land managers, and how this challenge is addressed has both regional and global consequences. While planting WCCs such as cereal rye works for some land managers, the urgency of the problem and low overall adoption rates necessitate alternative strategies. We tested whether a labile C source could act as an alternative for the N scavenging function of WCCs by leveraging microbial N immobilization. Our primary objective was to determine if applying a C-rich byproduct of biodiesel production, crude glycerol, would decrease spring soil profile NO3-N availability and thereby decrease NO3 leaching. Our secondary objective was to determine the impact of Cglyc on crop health, yield, and maize fertilizer N needs. The concerns were not only due to Cglyc creating too great a N demand (via microbial net N immobilization) and reducing plant-available N in the spring, but also due to other chemical characteristics of the biodiesel byproduct that may be detrimental to crop yield, for example salts and traces of methanol (Table S1; [49]).

4.1. Did Cglyc Reduce Plant-Available N in Spring and N Leaching?

Soil microorganisms are strong competitors with plants for NO3-N and NH4+-N [50] and have been documented to be rather C-limited, especially in early spring, in agroecosystems [51,52]. Therefore, we hypothesized that adding a labile C source in autumn after crop harvest would reduce spring soil NO3-N, the most mobile but also most plant-available N form. Glycerol, which is 39% C, was effectively incorporated into microbial biomass to a soil depth of 45 cm and caused net NO3-N immobilization 19 d after autumn application, especially at the 866C rate [29].
Here we showed this N immobilization effect from Cglyc extended beyond the late autumn application, also lowering spring soil profile NO3-N (Figure 1). For every 100 kg Cglyc ha−1 added, spring soil profile NO3-N was decreased by 0.6 kg N ha−1 (from 0–45 cm profile). Previous laboratory studies also demonstrated the ability of adding labile C to drive N immobilization and reduce soil NO3-N in agroecosystems [25,53], including a handful of laboratory and greenhouse studies that also used raw glycerol [26,27,28]. These studies show that for every 100 units of Cglyc, NO3-N is reduced between 0.4 to 3.4 mg N kg−1 [26,28,54]. However, timing of inorganic N release is largely dependent on Cglyc concentration [28].
We could not isolate the impact of weather versus previous crop effects as causing the year-to-year differences; either, or a combination of both, could have contributed to variation across site-years. Soil N mineralization dynamics differ after maize versus soybean [55], and this is likely a result of microbial supply/demand of C relative to N [25]. It is important to note the few studies that test supplemental labile C on agricultural soils have shown this immobilization is temporary, and that N stored in microbial bodies is eventually mineralized, with timing regulated mostly by climate and C rate [25,28,53]. De et al. (2022) [28], for example, showed that N release can be delayed from 7 to >98 d (past length of their incubation) by adding 117 to 1872 mg Cglyc kg dry soil−1, respectively. They also found significant interactions between Cglyc and N fertilizer rates which, when N was added along with Cglyc, hastened the release of inorganic N.
We expected that annual NO3-N leaching would relate to NO3-N captured in the soil profile in early spring, because the majority of N loss occurs during the “shoulder seasons” in Midwest U.S. agroecosystems [5]. Indeed, the measured average trends were somewhat similar—with greater soil profile NO3, there was greater inorganic N in the resin lysimeters (Figure S4), but the leached inorganic N was much more variable than profile inorganic N and not as consistently responsive to Cglyc (Figure 2 and Figure S4). When normalizing for position in the field (or block) and calculating effect size, a more discernable trend emerged (Figure 2,Figures S2 and S4). On average, across years and fertilizer N rates, 216C increased N leaching by 6%, while 866C decreased N leaching by 14%, though variability was high and neither were statistically significant from 0C. The high variability might be due in part to the ion resin method for measuring N leaching—it has been shown to be quite variable ([36,37]; Figure S5).
From our field study, it is apparent that if more Cglyc were to have been applied, there could have been a stronger, more consistent effect on inorganic N leaching. A laboratory study conducted by Redmile-Gordon (2014) [27] determined that crude glycerol prevented more than 99% of inorganic N from leaching when the application rate equaled 1500 mg Cglyc kg−1. This aligns with a meta-analysis that reported that simple C substrate additions would need to exceed 500 mg C kg−1 to enhance the microbial immobilization of NO3-N [25]. Future fine-tuning the Cglyc application rate to match this C concentration threshold, and at multiple soil depths, is challenging by itself, let alone balancing the timing of N release (which too is dependent on C concentration [28]). In other words, enough C needs to be added to drive microbial demand for N, immobilize it temporarily, and then ideally release it during peak maize demand (late spring in Midwest U.S.). Similar to traditional WCCs, there are inevitable tradeoffs between desirable environmental outcomes and productivity.

4.2. Did Cglyc Affect Crop Nutrient Demand and Yields?

We hypothesized that both maize and soybean yield would be unaffected or decrease with Cglyc addition due to increased NO3-N immobilization, and that the decrease in maize yield would be at lower N rates. This hypothesis was partially supported (Figure 4 and Figure 5). However, there are nuances and complex Cglyc × N fertilizer × site interactions that warrant further exploration.
One remarkable result, and partially contrary to our hypothesis, is the difference in maize response to N at both sites under the three Cglyc rates (Figure 4). The soil N supplying power was greater at the NW site compared to Central site, as evidenced by SPAD and the greater 0N maize yields (Figure 3 and Figure 4). In support of our hypothesis, and at the greater N-supplying power site (NW site), adding any Cglyc decreased maize yield by 2.1 to 3.0 Mg ha−1 at the lower N rates (<112N). When sufficient fertilizer N was added at this site, however, the maize yield differences disappeared.
Adding Cglyc had little-to-no effect on AONR or yield at AONR at the NW site, as we hypothesized; however, at the Central site, Cglyc increased AONR (Table 3). At the Central site, 216C may have even increased maize yields at AONR by ~1 Mg ha−1 (~+7%, Table 3). These contrasting findings confirm the complexity of factors that regulate AONR and maximum yield [43,56,57,58]. Our study demonstrates that labile C availability should be considered among these important interacting factors.
Studies that have examined the effects of labile C amendments on plant response have observed negative effects due to the rapid immobilization of nutrients after incorporation. A study by Qian (2011) [26] saw reductions in canola (B. napus L.) yield and nutrient uptake with increasing Cglyc additions. These negative effects were compensated for with supplemental N addition up to the 400 mg C kg−1 rate, with their highest rate of 4000 mg Cglyc kg−1 reducing yield and nutrient uptake even with fertilizer N. The main difference between our study and previous studies using Cglyc as a soil amendment is that previous work added the Cglyc during or after planting, leading to rapid N immobilization and N deficiency in crops [26], whereas we applied Cglyc in autumn 182 to 202 d prior to planting. Altogether, this study and previous studies point to complex, dynamic interactions between plants and soil microbes when nutrient availability is altered by adding labile C.
Conducting a first-of-its-kind experiment has benefits and drawbacks. If more resources were available, and in hindsight of this study’s results, we would have liked to: (i) include more Cglyc rates exceeding 866C, since there seem to be better environmental outcomes (i.e., lowering mobile NO3-N and leaching) with greater Cglyc; (ii) include multiple timings for the same Cglyc rates, since, for example, adding Cglyc in early spring just prior to or at soybean planting may have the same if not better environmental outcomes and may boost soybean yields, as some studies show lower plant-available N in soybeans increases nodulation and perhaps even yield [59,60]; (iii) conduct the study over individually tile-drained plots to get more accurate measures of N leaching (compared to resin lysimeters). Although expensive, individually tile-drained plots are probably the best method to monitor N leaching in agroecosystems [9,61].

4.3. Comparing and Contrasting “Liquid Cover Crop” with Cereal Rye WCC

The incorporation of WCC into agronomic systems has been documented to reduce inorganic N leaching, albeit dissimilarly. Waring et al. (2020) [9] demonstrated that WCC, in the form of cereal rye, reduced NO3-N in tile drainage by more than 30% in a chisel-plow system when compared to the no WCC control. In the no-till system, WCC was shown to have a negligible impact, likely due to the already low leaching potential of NO3-N from the lack of tillage [9].
During the 2018–2019 season, a WCC study was performed 2.56 km away from the Central site that included cereal rye ahead of maize in a no-till, maize-soybean agroecosystem [62]. Inorganic N leaching was measured using resin lysimeters in the exact same method used in this study. The WCC decreased N leaching by 43% on average when at the low WCC seeding rate (0.82 M seeds ha−1), but similar to Cglyc, high variability precluded any statistically significant differences (Figure S5). This mostly highlights the variability of the resin lysimeter method, but also that Cglyc is on the same order of magnitude of N leaching reduction as WCCs.
Maize and soybean yields can vary in response to WCCs depending on many factors, such as climate, management practices, and soil type. Winter cover crops have been documented to negatively impact crop yield, creating a yield drag, and reasons for this are: decreased water availability for the cash crop in drought years [63], soil N immobilization [12,64], and seedling diseases [65], amongst others. Maize yield tends to decrease as the WCC biomass increases [62]. Complementary to this evidence, there are numerous reports of WCC having a neutral or positive impact on the following cash crop. Marcillo and Miguez (2017) [66] report that WCCs have more of a neutral or positive impact on maize and soybean with practices such as no-tillage and late termination. The variable impact of WCC on yields can be of concern for farmers as they consider adopting them.
Adoption of WCC in the Midwest U.S. remains low, roughly 7% of agronomic farmland as of 2021 [23], and one barrier to adoption is the financial cost of the practice. Farm profitability for those including WCCs in their rotations tends to decrease, on average, for a variety of potential reasons depending on regional and economic factors. Additional costs, including seed, equipment, fuel, crop insurance availability, and labor, can influence a land manager’s decision whether or not it may be worth adopting WCCs. These costs can vary, but generally input costs increase with purchasing of seed, application, termination, labor, and fuel.
There are some advantages and disadvantages of using a “liquid cover crop” compared to WCCs (Table 4). Probably one of the best benefits is the reduction in herbicide costs and application in spring. Furthermore, using conservative costs for glycerol, it is comparable if not less expensive if there is a convenient source of labile C. Probably the largest drawback to using labile C is that it does not confer some of the other soil health improvements that WCCs have been reported to offer, such as increased soil organic carbon [15], improved soil water dynamics [67], weed suppression [68], and others. For broader use of glycerol, a wider risk assessment is needed that includes human health.

5. Conclusions

Labile C is an important driver of soil microbial activity, and thus unsurprisingly, has a strong influence on the N dynamics in agroecosystems. The goal of this study was to understand how adding a source of labile C in the form of crude glycerol from biodiesel production would influence the soil–plant N dynamics in a typical maize–soybean agroecosystem in the Midwest U.S. Cglyc added to the soil was shown to be effective at reducing soil profile NO3-N, especially following soybean in the maize–soybean rotation, but effects on N leaching were more variable. The Cglyc was shown to have no or slight negative effects on crop growth, yield, and optimal N rate, but negative effects on maize at one site were alleviated when optimal fertilizer N was added (rates typical to producers in the region).
Most studies adding labile C to agricultural soils have been in controlled laboratory or greenhouse settings. This study is among the rare few, if not the first, to broadcast apply labile C source with typical farm equipment and monitor the effects on soil–plant N dynamics and crop yield. While these findings show promise for adding labile C to soils as a “liquid cover crop,” more research is needed. One key conclusion is that adding more Cglyc, or changing the timing, could result in greater environmental outcomes. Also, glycerol does not have to be the only inexpensive, accessible form of labile C used as a soil amendment. Other agricultural by- or co-products could serve as a “liquid cover crop” alternative for growers unwilling or unable to use WCCs.

Supplementary Materials

The following supporting information can be downloaded at: https://www.mdpi.com/article/10.3390/agronomy16090933/s1, Table S1. Summary of the crude glycerol chemical characteristics (mean ± standard deviation). Table S2. Summary of 2-way analysis of variance (ANOVA) test on the effects of glycerol carbon (Cglyc) rate, spring fertilizer N application rate, and interaction, on bioavailable nutrients recovered by the Plant Root Simulator (PRS)® probes. Figure S1. Climate shown for Central, IA (a,c) and Northwest (NW), IA (b,d) sites. Figure S2. Leached inorganic N (ammonium-N + nitrate-N) in maize (Spring 2019) with fertilizer N application rates (Central site only). Figure S3. Soybean Soil Plant and Analysis Development (SPAD) measurements for Central, IA (a,c) and Northwest (NW), IA (b,d) sites. Figure S4. Leached inorganic N (ammonium-N + nitrate-N) by sampled Spring 2019 Inorganic N (ammonium-N + nitrate-N) soil stock to a depth of 45 cm for each year of the study at the Central site. Figure S5. Leached Total N (nitrate-N + ammonium-N) from a Central Iowa site in 2019 for a cereal rye winter cover crop trial going into maize as reported.

Author Contributions

Conceptualization: M.D.M. and J.E.S.; Methodology: S.W.P., J.E.S. and M.D.M.; Formal Analysis: S.W.P.; Investigation: S.W.P., J.E.S. and M.D.M.; Resources: J.E.S. and M.D.M.; Data Curation: S.W.P.; Writing—Original Draft Preparation: S.W.P. and M.D.M.; Writing—Review & Editing: S.W.P., J.E.S. and M.D.M.; Visualization: S.W.P.; Supervision: J.E.S. and M.D.M.; Project Administration: M.D.M.; Funding Acquisition: J.E.S. and M.D.M. All authors have read and agreed to the published version of the manuscript.

Funding

This work was funded by Renewable Energy Group, Inc.

Data Availability Statement

Data will be made available upon publication on a university digital repository and available upon request.

Acknowledgments

We are thankful to the ISU farm staff, Michael Fiscus, Zachary Koopman, and Terry Tuttle, for their help with farm operations and managing these two two-year experiments. We want to thank everyone in the McDaniel and Sawyer labs for assistance with field and laboratory work. Finally, we would like to thank Jon Scharingson and Derek Huser from Renewable Energy Group, Inc., for logistical support and supplying the raw glycerol.

Conflicts of Interest

The authors declare no conflicts of interest.

Abbreviations

AONR = agronomic optimum nitrogen rate, Cglyc = glycerol carbon, NO3-N = nitrate nitrogen, SPAD = soil plant analysis and development, WCC = winter cover crop.

References

  1. Sinclair, T.R.; Rufty, T.W. Nitrogen and water resources commonly limit crop yield increases, not necessarily plant genetics. Glob. Food Secur. 2012, 1, 94–98. [Google Scholar] [CrossRef]
  2. Wittwer, R.A.; Dorn, B.; Jossi, W.; van der Heijden, M.G. Cover crops support ecological intensification of arable cropping systems. Sci. Rep. 2017, 7, 41911. [Google Scholar] [CrossRef]
  3. Power, J.F.; Schepers, J.S. Nitrate contamination of groundwater in North America. Agric. Ecosyst. Environ. 1989, 26, 165–187. [Google Scholar] [CrossRef]
  4. Rabalais, N.N.; Turner, R.E. Gulf of Mexico Hypoxia: Past, Present, and Future. Limnol. Oceanogr. Bull. 2019, 28, 117–124. [Google Scholar] [CrossRef]
  5. Dinnes, D.L.; Karlen, D.L.; Jaynes, D.B.; Kaspar, T.C.; Hatfield, J.L.; Colvin, T.S.; Cambardella, C.A. Nitrogen management strategies to reduce nitrate leaching in tile-drained midwestern soils. Agron. J. 2002, 94, 153–171. [Google Scholar] [CrossRef]
  6. Noland, R.L.; Wells, M.S.; Sheaffer, C.C.; Baker, J.M.; Martinson, K.L.; Coulter, J.A. Establishment and function of cover crops interseeded into corn. Crop Sci. 2018, 58, 863–873. [Google Scholar] [CrossRef]
  7. Daigh, A.L.; Zhou, X.; Helmers, M.J.; Pederson, C.H.; Horton, R.; Jarchow, M.; Liebman, M. Subsurface drainage nitrate and total reactive phosphorus losses in bioenergy-based prairies and corn systems. J. Environ. Qual. 2015, 44, 1638–1646. [Google Scholar] [CrossRef] [PubMed]
  8. Tonitto, C.; David, M.B.; Drinkwater, L.E. Replacing bare fallows with cover crops in fertilizer-intensive cropping systems: A meta-analysis of crop yield and N dynamics. Agric. Ecosyst. Environ. 2006, 112, 58–72. [Google Scholar] [CrossRef]
  9. Waring, E.R.; Lagzdins, A.; Pederson, C.; Helmers, M.J. Influence of no-till and a winter rye cover crop on nitrate losses from tile-drained row-crop agriculture in Iowa. J. Environ. Qual. 2020, 49, 292–303. [Google Scholar] [CrossRef]
  10. Langdale, G.W.; Blevins, R.L.; Karlen, D.L.; McCool, D.K.; Nearing, M.A.; Skidmore, E.L.; Thomas, A.W.; Tyler, D.D.; Williams, J.R. Cover crop effects on soil erosion by wind and water. Cover. Crops Clean. Water 1991, 15–22. [Google Scholar]
  11. Dabney, S.M.; Delgado, J.A.; Reeves, D.W. Using winter cover crops to improve soil and water quality. Commun. Soil Sci. Plant Anal. 2001, 32, 1221–1250. [Google Scholar] [CrossRef]
  12. Kaspar, T.C.; Bakker, M.G. Biomass production of 12 winter cereal cover crop cultivars and their effect on subsequent no-till corn yield. J. Soil Water Conserv. 2015, 70, 353–364. [Google Scholar] [CrossRef]
  13. Nichols, V.; Martinez-Feria, R.; Weisberger, D.; Carlson, S.; Basso, B.; Basche, A. Cover crops and weed suppression in the US Midwest: A meta-analysis and modeling study. Agric. Environ. Lett. 2020, 5, e20022. [Google Scholar] [CrossRef]
  14. Yu, Y.; Loiskandl, W.; Kaul, H.P.; Himmelbauer, M.; Wei, W.; Chen, L.; Bodner, G. Estimation of runoff mitigation by morphologically different cover crop root systems. J. Hydrol. 2016, 538, 667–676. [Google Scholar] [CrossRef]
  15. McClelland, S.C.; Paustian, K.; Schipanski, M.E. Management of cover crops in temperate climates influences soil organic carbon stocks: A meta-analysis. Ecol. Appl. 2021, 31, e02278. [Google Scholar] [CrossRef] [PubMed]
  16. McDaniel, M.D.; Tiemann, L.K.; Grandy, A.S. Does agricultural crop diversity enhance soil microbial biomass and organic matter dynamics? A meta-analysis. Ecol. Appl. 2014, 24, 560–570. [Google Scholar] [CrossRef] [PubMed]
  17. Poeplau, C.; Don, A. Carbon sequestration in agricultural soils via cultivation of cover crops–A meta-analysis. Agric. Ecosyst. Environ. 2015, 200, 33–41. [Google Scholar] [CrossRef]
  18. Deines, J.M.; Guan, K.; Lopez, B.; Zhou, Q.; White, C.S.; Wang, S.; Lobell, D.B. Recent cover crop adoption is associated with small maize and soybean yield losses in the United States. Glob. Change Biol. 2023, 29, 794–807. [Google Scholar] [CrossRef]
  19. Wyland, L.J.; Jackson, L.; Chaney, W.E.; Klonsky, K.; Koike, S.T.; Kimple, B. Altering surface soil dynamics with winter cover crops in a vegetable cropping system: Impacts on yield, nitrate leaching, pests and management costs. Agric. Ecosyst. Environ. 1996, 59, 1–17. [Google Scholar] [CrossRef]
  20. Bakker, M.G.; Acharya, J.; Moorman, T.B.; Robertson, A.E.; Kaspar, T.C. The potential for cereal rye cover crops to host corn seedling pathogens. Phytopathology 2016, 106, 591–601. [Google Scholar] [CrossRef]
  21. Roesch-Mcnally, G.E.; Basche, A.D.; Arbuckle, J.G.; Tyndall, J.C.; Miguez, F.E.; Bowman, T.; Clay, R. The trouble with cover crops: Farmers’ experiences with overcoming barriers to adoption. Renew. Agric. Food Syst. 2018, 33, 322–333. [Google Scholar] [CrossRef]
  22. Wallander, S.; Smith, D.; Bowman, M.; Claassen, R. Cover Crop Trends, Programs, and Practices in the United States; U.S. Department of Agriculture: Washington, DC, USA, 2021.
  23. Zhou, Q.; Guan, K.; Wang, S.; Jiang, C.; Huang, Y.; Peng, B.; Chen, Z.; Wang, S.; Hipple, J.; Schaefer, D.; et al. Recent Rapid Increase of Cover Crop Adoption Across the U.S. Midwest Detected by Fusing Multi-Source Satellite Data. Geophys. Res. Lett. 2022, 49, e2022GL100249. [Google Scholar] [CrossRef]
  24. Zhang, Y.; Zou, J.; Meng, D.; Dang, S.; Zhou, J.; Osborne, B.; Ren, Y.; Liang, T.; Yu, K. Effect of soil microorganisms and labile C availability on soil respiration in response to litter inputs in forest ecosystems: A meta-analysis. Ecol. Evol. 2020, 10, 13602–13612. [Google Scholar] [CrossRef] [PubMed]
  25. Cheng, Y.; Wang, J.; Wang, J.; Chang, S.X.; Wang, S. The quality and quantity of exogenous organic carbon input control microbial NO3− immobilization: A meta-analysis. Soil Biol. Biochem. 2017, 115, 357–363. [Google Scholar] [CrossRef]
  26. Qian, P.; Schoenau, J.; Urton, R. Effect of soil amendment with thin stillage and glycerol on plant growth and soil properties. J. Plant Nutr. 2011, 34, 2206–2221. [Google Scholar] [CrossRef]
  27. Redmile-Gordon, M.A.; Armenise, E.; Hirsch, P.R.; Brookes, P.C. Biodiesel Co-product (BCP) decreases soil nitrogen (N) losses to groundwater. Water Air Soil Pollut. 2014, 225, 1831. [Google Scholar] [CrossRef]
  28. De, M.; Sawyer, J.E.; McDaniel, M.D. Crude glycerol, a biodiesel byproduct, used as a soil amendment to temporarily immobilise and then release nitrogen. Eur. J. Soil Sci. 2022, 73, e13241. [Google Scholar] [CrossRef]
  29. Potter, S.W.; Kin, C.; Hall, S.J.; Sawyer, J.E.; McDaniel, M.D. Field-applying an inexpensive, 13C-depleted, labile carbon source to study in situ fate and short-term effects on soils. J. Plant Nutr. Soil Sci. 2023, 186, 428–440. [Google Scholar] [CrossRef]
  30. IA Mesonet. Iowa Environmental Mesonet. Iowa State University. Available online: https://mesonet.agron.iastate.edu/ (accessed on 2 October 2020).
  31. Mallarino, A.P.; Stewart, B.M.; Baker, J.L.; Downing, J.D.; Sawyer, J.E. Phosphorus indexing for cropland: Overview and basic concepts of the Iowa phosphorus index. J. Soil Water Conserv. 2002, 57, 440–447. [Google Scholar] [CrossRef]
  32. Doane, T.A.; Horwath, W.R. Spectrophotometric determination of nitrate with a single reagent. Anal. Lett. 2003, 36, 2713–2722. [Google Scholar] [CrossRef]
  33. Sinsabaugh, R.L.; Reynolds, H.; Long, T.M. Rapid assay for amidohydrolase (urease) activity in environmental samples. Soil Biol. Biochem. 2000, 32, 2095–2097. [Google Scholar] [CrossRef]
  34. Hangs, R.D.; Greer, K.J.; Sulewski, C.A.; Hicks, D. Plant Root Simulator™-Probes: An effective alternative for routine soil testing. In Soils and Crops Workshop; University of Saskatchewan: Saskatoon, SK, Canada, 2002. [Google Scholar]
  35. Ochoa-Hueso, R.; Delgado-Baquerizo, M.; Risch, A.C.; Ashton, L.; Augustine, D.; Bélanger, N.; Bridgham, S.; Britton, A.J.; Bruckman, V.J.; Camarero, J.J.; et al. Bioavailability of macro and micronutrients across global topsoils: Main drivers and global change impacts. Glob. Biogeochem. Cycles 2023, 37, e2022GB007680. [Google Scholar] [CrossRef]
  36. Studt, J.E.; McDaniel, M.D.; Tejera, M.D.; VanLoocke, A.; Howe, A.; Heaton, E.A. Soil net nitrogen mineralization and leaching under Miscanthus× giganteus and Zea mays. GCB Bioenergy 2021, 13, 1545–1560. [Google Scholar] [CrossRef]
  37. Susfalk, R.B.; Johnson, D.W. Ion exchange resin based soil solution lysimeters and snowmelt solution collectors. Commun. Soil Sci. Plant Anal. 2002, 33, 1261–1275. [Google Scholar] [CrossRef]
  38. Bullock, D.G.; Anderson, D.S. Evaluation of the Minolta SPAD-502 chlorophyll meter for nitrogen management in corn. J. Plant Nutr. 1998, 21, 741–755. [Google Scholar] [CrossRef]
  39. Markwell, J.; Osterman, J.C.; Mitchell, J.L. Calibration of the Minolta SPAD-502 leaf chlorophyll meter. Photosynth. Res. 1995, 46, 467–472. [Google Scholar] [CrossRef] [PubMed]
  40. Yamamoto, A.; Nakamura, T.; Adu-Gyamfi, J.J.; Saigusa, M. Relationship between chlorophyll content in leaves of sorghum and pigeonpea determined by extraction method and by chlorophyll meter (SPAD-502). J. Plant Nutr. 2002, 25, 2295–2301. [Google Scholar] [CrossRef]
  41. Edalat, M.; Naderi, R.; Egan, T.P. Corn nitrogen management using NDVI and SPAD sensor-based data under conventional vs. reduced tillage systems. J. Plant Nutr. 2019, 42, 2310–2322. [Google Scholar] [CrossRef]
  42. Lindsey, A.J.; Steinke, K.; Rutan, J.; Thomison, P.R. Relationship of DGCI and SPAD Values to Corn Grain Yield in the Eastern Corn Belt. Crop Forage Turfgrass Manag. 2016, 2, 1–9. [Google Scholar] [CrossRef]
  43. Woli, K.P.; Boyer, M.J.; Elmore, R.W.; Sawyer, J.E.; Abendroth, L.J.; Barker, D.W. Corn era hybrid response to nitrogen fertilization. Agron. J. 2016, 108, 473–486. [Google Scholar] [CrossRef]
  44. Barker, D.W.; Sawyer, J.E. Using active canopy sensors to quantify corn nitrogen stress and nitrogen application rate. Agron. J. 2010, 102, 964–971. [Google Scholar] [CrossRef]
  45. Scharf, P.C.; Wiebold, W.J.; Lory, J.A. Corn yield response to nitrogen fertilizer timing and deficiency level. Agron. J. 2002, 94, 435–441. [Google Scholar] [CrossRef]
  46. Fritschi, F.B.; Ray, J.D. Soybean leaf nitrogen, chlorophyll content, and chlorophyll a/b ratio. Photosynthetica 2007, 45, 92–98. [Google Scholar] [CrossRef]
  47. Thompson, J.A.; Schweitzer, L.E.; Nelson, R.L. Association of specific leaf weight, an estimate of chlorophyll, and chlorophyll concentration with apparent photosynthesis in soybean. Photosynth. Res. 1996, 49, 1–10. [Google Scholar] [CrossRef]
  48. Dixon, P.M. Should Blocks Be Fixed or Random? In Statistics Conference Proceedings, Presentations and Posters. Available online: https://newprairiepress.org/agstatconference/ (accessed on 2 October 2023).
  49. Ciriminna, R.; Pina CDella Rossi, M.; Pagliaro, M. Understanding the glycerol market. Eur. J. Lipid Sci. Technol. 2014, 116, 1432–1439. [Google Scholar] [CrossRef]
  50. Kaye, J.P.; Hart, S.C. Competition for nitrogen between plants and soil microorganisms. Trends Ecol. Evol. 1997, 158, 1426–1432. [Google Scholar] [CrossRef] [PubMed]
  51. Ekblad, A.; Nordgren, A. Is growth of soil microorganisms in boreal forests limited by carbon or nitrogen availability? Plant Soil 2002, 242, 115–122. [Google Scholar] [CrossRef]
  52. McDaniel, M.D.; Grandy, A.S. Soil microbial biomass and function are altered by 12 years of crop rotation. Soil 2016, 2, 583–599. [Google Scholar] [CrossRef]
  53. Romero, C.M.; Engel, R.; Chen, C.; Wallander, R. Microbial immobilization of nitrogen-15 labelled ammonium and nitrate in an agricultural soil. Soil Sci. Soc. Am. J. 2015, 79, 595–602. [Google Scholar] [CrossRef]
  54. Redmile-Gordon, M.A.; Evershed, R.P.; Kuhl, A.; Armenise, E.; White, R.P.; Hirsch, P.R.; Goulding, K.W.T.; Brookes, P.C. Engineering soil organic matter quality: Biodiesel Co-Product (BCP) stimulates exudation of nitrogenous microbial biopolymers. Geoderma 2015, 259–260, 205–212. [Google Scholar] [CrossRef][Green Version]
  55. Hall, S.J.; Russell, A.E.; Moore, A.R. Do corn-soybean rotations enhance decomposition of soil organic matter? Plant Soil 2019, 444, 427–442. [Google Scholar] [CrossRef]
  56. McDaniel, M.; Walters, D.; Bundy, L.; Li, X.; Drijber, R.; Sawyer, J.; Castellano, M.; Laboski, C.; Scharf, P.; Horwath, W. Combination of biological and chemical soil tests best predict maize nitrogen response. Agron. J. 2020, 112, 1263–1278. [Google Scholar] [CrossRef]
  57. Puntel, L.A.; Sawyer, J.E.; Barker, D.W.; Dietzel, R.; Poffenbarger, H.; Castellano, M.J.; Moore, K.J.; Thorburn, P.; Archontoulis, S.V. Modeling long-term corn yield response to nitrogen rate and crop rotation. Front. Plant Sci. 2016, 7, 1630. [Google Scholar] [CrossRef] [PubMed]
  58. Tremblay, N.; Bouroubi, Y.M.; Bélec, C.; Mullen, R.W.; Kitchen, N.R.; Thomason, W.E.; Ebelhar, S.; Mengel, D.B.; Raun, W.R.; Francis, D.D.; et al. Corn response to nitrogen is influenced by soil texture and weather. Agron. J. 2012, 104, 1658–1671. [Google Scholar] [CrossRef]
  59. Lyu, X.; Xia, X.; Wang, C.; Ma, C.; Dong, S.; Gong, Z. Effects of changes in applied nitrogen concentrations on nodulation, nitrogen fixation and nitrogen accumulation during the soybean growth period. Soil Sci. Plant Nutr. 2019, 65, 479–489. [Google Scholar] [CrossRef]
  60. Xia, X.; Ma, C.; Dong, S.; Xu, Y.; Gong, Z. Effects of nitrogen concentrations on nodulation and nitrogenase activity in dual root systems of soybean plants. Soil Sci. Plant Nutr. 2017, 63, 470–482. [Google Scholar] [CrossRef]
  61. Lawlor, P.A.; Helmers, M.J.; Baker, J.L.; Melvin, S.W.; Lemke, D.W. Nitrogen application rate effect on nitrate-nitrogen concentration and loss in subsurface drainage for a corn-soybean rotation. Trans. ASABE 2008, 51, 83–94. [Google Scholar] [CrossRef]
  62. Marcos, F.M.; Acharya, J.; Parvej, M.R.; Robertson, A.E.; Licht, M.A. Cereal rye cover crop seeding method, seeding rate, and termination timing effects corn development and seedling disease. Agron. J. 2023, 115, 1356–1372. [Google Scholar] [CrossRef]
  63. Munawar, A.; Blevins, R.L.; Frye, W.W.; Saul, M.R. Tillage and cover crop management for soil water conservation. Agron. J. 1990, 82, 773–777. [Google Scholar] [CrossRef]
  64. Dougherty, B.W.; Pederson, C.H.; Mallarino, A.P.; Andersen, D.S.; Soupir, M.L.; Kanwar, R.S.; Helmers, M.J. Midwestern cropping system effects on drainage water quality and crop yields. J. Environ. Qual. 2020, 49, 38–49. [Google Scholar] [CrossRef]
  65. Acharya, J.; Moorman, T.B.; Kaspar, T.C.; Lenssen, A.W.; Robertson, A.E. Cover crop rotation effects on growth and development, seedling disease, and yield of corn and soybean. Plant Dis. 2020, 104, 677–687. [Google Scholar] [CrossRef]
  66. Marcillo, G.S.; Miguez, F.E. Corn yield response to winter cover crops: An updated meta-analysis. J. Soil Water Conserv. 2017, 72, 226–239. [Google Scholar] [CrossRef]
  67. Basche, A.D.; Kaspar, T.C.; Archontoulis, S.V.; Jaynes, D.B.; Sauer, T.J.; Parkin, T.B.; Miguez, F.E. Soil water improvements with the long-term use of a winter rye cover crop. Agric. Water Manag. 2016, 172, 40–50. [Google Scholar] [CrossRef]
  68. Osipitan, O.A.; Dille, J.A.; Assefa, Y.; Radicetti, E.; Ayeni, A.; Knezevic, S.Z. Impact of cover crop management on level of weed suppression: A meta-analysis. Crop Sci. 2019, 59, 833–842. [Google Scholar] [CrossRef]
  69. Pantoja, J.L.; Woli, K.P.; Sawyer, J.E.; Barker, D.W. Winter rye cover crop biomass production, degradation, and nitrogen recycling. Agron. J. 2016, 108, 841–853. [Google Scholar] [CrossRef]
  70. Sustainable Agriculture Research Extension. Annual Report 2019-2020: National Cover Crop Survey. 2020. Available online: https://www.sare.org/wp-content/uploads/2019-2020-National-Cover-Crop-Survey.pdf (accessed on 2 October 2020).
  71. Anuar, M.R.; Abdullah, A.Z. Challenges in biodiesel industry with regards to feedstock, environmental, social and sustainability issues: A critical review. Renew. Sustain. Energy Rev. 2016, 58, 208–223. [Google Scholar] [CrossRef]
  72. Plastina, A.; Johanns, A.; Magwaba, K. Iowa Farm Custom Rate Survey. File A3-10, FM1698. 2024. Available online: https://crops.extension.iastate.edu/files/inline-files/a3-10.pdf (accessed on 2 October 2020).
Figure 1. Soil profile NO3-N concentrations by depth and stock (figure inserts) in spring 2019 ((a,b), going into maize) and spring 2020 ((c,d), going into soybean); with Central, Iowa (IA), and Northwest, IA, sites shown in (a,c) and (b,d), respectively. The graph inserts represent calculated stock soil NO3-N at each site. For both figures and figure inserts, means and standard error are shown, with lowercase letters indicating significant differences (α ≤ 0.05).
Agronomy 16 00933 g001
Figure 2. Leached Total N (nitrate-N + ammonium-N) from the Central, Iowa site in 2019 ((a), maize) and 2020 ((b), soybean). For these two panels, means and standard error (n = 4) are shown. Shown in (c) is plot-level, relative N leached (measured as Δ Leached N or % relative difference from control) across both years (n = 24). The horizontal bold solid lines in the boxplots represent the median, the ‘×’ represents the mean, and the points are the individual observations. Differences between the Cglyc treatments were not significant (α > 0.05).
Agronomy 16 00933 g002
Figure 3. Maize Soil Plant Analysis and Development (SPAD) measurements at Central, IA, (a,c) and Northwest (NW), IA, (b,d) sites. Maize SPAD readings were collected at V10 (a,b) and R1 (c,d).
Agronomy 16 00933 g003
Figure 4. Maize grain yield response to N fertilizer (spring 2019) at Central, IA, (a) and Northwest (NW), IA, (b) sites. Individual yield means at each N rate shown in the symbols, with lines showing quadratic plateau response curves for each glycerol C rate. The regression models are listed in Table 3.
Agronomy 16 00933 g004
Figure 5. Soybean grain yield (spring 2020) at Central, IA, (a) and Northwest (NW), IA, (b) sites averaged over all N rates. Calculated mean and standard error for each Cgly rate are shown. The difference in means across Cgly rates at each site were not statistically significant (p > 0.05).
Agronomy 16 00933 g005
Table 1. Baseline, ancillary soil measurements from samples collected per replicate in the autumn 2018 before treatments (mean ± standard deviation).
Soil Parameter (Units)CentralNW
Organic Matter (g kg−1)3.0 ± 0.64.1 ± 0.4
Bray 1 P (mg L−1)30 ± 16.4150 ± 137
K (mg L−1)186 ± 40481 ± 262
Mg (mg L−1)275 ± 76595 ± 111
Ca (mg L−1)3188 ± 8343883 ± 429
pH6.6 ± 0.17.3 ± 0.5
Buffer pH7.4 ± 0.37.5 ± 0.0
Soluble Salts0.3 ± 0.050.3 ± 0.02
Na (ppm)13 ± 0.810 ± 2.2
Sand (%)26 ± 1.016 ± 0.2
Silt (%)40 ± 1.953 ± 0.6
Clay (%)34 ± 2.931 ± 0.7
Table 2. Summary of ANOVA p-values for main effects [glycerol carbon (Cglyc) rate, fertilizer N rate, and soil depth] and interactions.
Soil or Plant ParameterSite in Iowa, USA (IA)Time of Year (or Crop Stage)Depth
(df = 3)
Cglyc Rate
(df = 2)
N Rate (df = 2) ¥Cglyc Rate × Depth
(df = 6)
N Rate × Depth
(df = 6)
Cglyc Rate × N Rate (df = 4) Cglyc Rate × N Rate × Depth
(df = 6)
Corresponding Figure Showing Data
Spring Soil Profile NO3-NCentralSpring 2019<0.01<0.01 0.02 Figure 1
Spring 2020<0.010.760.990.030.320.630.97Figure 1
NWSpring 2019<0.01<0.01 <0.01 Figure 1
Spring 2020<0.01<0.010.66<0.010.670.090.35Figure 1
Leached inorganic N (NH4+-N plus NO3--N)CentralYear 1 (Maize) 0.26<0.01 0.56 Figure 2
Year 2 (Soybean) 0.620.86 0.45 Figure 2
Maize SPADCentralV11 0.26<0.01 0.95 Figure 3
VT/R1 0.96<0.01 0.43 Figure 3
NW IAV10 0.03<0.01 0.66 Figure 3
R1 0.30<0.01 0.73 Figure 3
Soybean SPADCentralR2 0.530.07 0.17 Figure S2
R5 0.550.24 0.96 Figure S2
NW IAR2 0.770.55 0.74 Figure S2
R5 0.350.54 0.07 Figure S2
Maize YieldCentralFall 2019 harvest 0.31<0.01 0.46 Figure 4
NWFall 2019 harvest 0.05<0.01 0.10 Figure 4
Soybean YieldCentralFall 2020 harvest 0.260.09 0.46 Figure 5
NWFall 2020 harvest 0.540.50 0.46 Figure 5
Bold numbers signify values of statistical significance (α ≤ 0.05). Italicized numbers signify values of marginal significance (0.05 ≤ α ≤ 0.1). df = degrees of freedom. ¥ N rate degrees of freedom are 5 for Yield and SPAD measurements. Cglyc rate × N rate degrees of freedom are 10 for yield and SPAD measurements.
Table 3. Quadradic plateau regression models of maize response to fertilizer N (see Figure 4).
SiteGlycerol Rate
(kg C ha−1)
Quadratic Plateau Regression Parameters ¥R2P > F
abcAONR
(kg N ha−1)
Yield at AONR (Mg ha−1)
Central04.96 (0.36)0.106 (0.010)−2.9 × 10⁻⁴ (0.5 × 10⁻⁴)19715.20.94<0.01
2165.32 (0.22)0.088 (0.008)−1.8 × 10⁻⁴ (0.3 × 10⁻⁴)25716.20.94<0.01
8665.08 (0.54)0.082 (0.007)−1.6× 10⁻⁴ (0.3× 10⁻⁴)26115.60.96<0.01
NW08.70 (0.82)0.046 (0.011)−1.2 × 10⁻⁴ (0.5 × 10⁻⁴)23313.70.67<0.01
2167.80 (1.16)0.057 (0.011)−1.4 × 10⁻⁴ (0.0001)21513.70.70<0.01
8665.60 (0.52)0.069 (0.003)−1.5 × 10⁻⁴ (0.2 × 10⁻⁴)24213.80.87<0.01
¥ Values in parentheses are standard errors. Joint point of linear and quadratic equations (Agronomic Optimal Nitrogen Rate, AONR) and yield at that point are reported.
Table 4. Comparing and contrasting cereal rye (Secale cereale) as a winter cover crop versus adding glycerol C as a “liquid cover crop”.
Comparison CategoryCereal Rye Winter Cover Crop (WCC)Glycerol C as a “Liquid Cover Crop”
Cost a$37–$193 ha−1 (USD)$19–$406 ha−1 (USD)
Application TimingNeeds to occur in fall, before or after harvest, to provide sufficient WCC growth before freezing temperatures.More versatile. Can be applied in fall after harvest but could be applied in spring or even at planting (esp. with soybean).
Application EquipmentHigh-clearance seeder to seed above mature/senesced maize or soybean. Small airplane or unmanned aerial vehicles to broadcast seed onto fields. Small seed drill to plant seed after harvest.Typical sprayer equipment. Some modification of pump, supply line, and nozzles may be needed. Dilution with water may be necessary.
Maize Yield bMinimal effect on maize yield with proper management, although 5–6% maize “yield drag” from large Midwest U.S. dataset.Neutral or slight negative effect on maize yield, negated with proper management (Figure 4).
N fertilizer application rate (with maize) bTypically no adjustment is necessary for Iowa maize AONR [69].Needed to add 63 kg N ha−1 more to achieve AONR (at only one site).
Soybean Yield b3–4% soybean “yield drag” from large Midwest U.S. dataset.Minimal effect on soybean yield (Figure 5).
Reduction in NO3 Leaching Effectiveness cVariable (Figure S5), but tile-drained studies show NO3 reduction of up to 30% on average, with potential for as high as 70%.Variable (Figure 2), but greater potential at rates > 866 kg Cglyc ha−1
Additional Benefits
  • Reduced erosion
  • Weed suppression
  • Plant biomass inputs (increased soil organic C)
  • Increase water infiltration
  • Possible mulch or grazing material
  • Increased microbial activity [29]
  • Re-use of agricultural byproduct (circular economy)
  • Other benefits yet to be measured
Other ConsiderationsMust be terminated prior to spring crop planting, usually with herbicide, tillage, or sometimes mowing. Well researched.Research for long term soil/crop effects is lacking/non-existent.
a Cereal rye based on recommended seeding rates for Midwest U.S. and cost range assumptions include $10–$50 for seed, $5–$18 for seeding costs, and $0–$10 for termination (herbicide) per acre [70]. Glycerol based on [71,29], cost ranging from $0 to $0.17 USD per liter, with 79% of raw glycerol assumed to be C and an application rate of 866 kg Cglyc ha−1. Application cost for glycerol of $7.50 was taken from [72], which was the median cost per acre for broadcast herbicide application. b According to Pantoja et al. (2015) [69]; Deines et al. (2023) [18]. c Data from nearby IA experiments: this study (Figure S5), Waring et al. (2020) [9], and Daigh et al. (2015) [7].
Disclaimer/Publisher’s Note: The statements, opinions and data contained in all publications are solely those of the individual author(s) and contributor(s) and not of MDPI and/or the editor(s). MDPI and/or the editor(s) disclaim responsibility for any injury to people or property resulting from any ideas, methods, instructions or products referred to in the content.