Article

Tomato Ripeness Detection Model Based on Improved RT-DETR Lightweight Model

School of Electrical Engineering and Automation, Jiangxi University of Science and Technology, Ganzhou 341000, China
*
Author to whom correspondence should be addressed.
Agronomy 2026, 16(9), 932; https://doi.org/10.3390/agronomy16090932
Submission received: 10 April 2026 / Revised: 30 April 2026 / Accepted: 1 May 2026 / Published: 4 May 2026
(This article belongs to the Topic Digital Agriculture, Smart Farming and Crop Monitoring)

Abstract

Accurate tomato ripeness detection is crucial for automated harvesting; however, complex greenhouse environments—characterized by dynamic light interference, foliage occlusion, and dense fruit overlapping—severely hinder detection performance and lead to frequent misdetections. This study aims to develop a high-precision, lightweight detection model that simultaneously addresses these three core challenges, thereby providing a technically deployable algorithmic foundation for resource-constrained agricultural edge devices. To this end, we propose CFD-DETR, a lightweight tomato ripeness detection model based on the RT-DETR architecture. The model incorporates a CAEfficientViT backbone for the lightweight extraction of multi-scale color and texture features. Furthermore, a Focused Efficient Additive Attention (FEAA) mechanism is integrated to capture fine-grained local ripening traits with minimal computational overhead. During feature reconstruction, a Deep Dynamic Upsampling (DwDySample) operator is utilized to preserve semantic integrity. Additionally, we designed the Wise-SIoU loss function, which dynamically penalizes low-quality samples to enhance boundary fitting and robustness against background noise. Experimental evaluations demonstrate that CFD-DETR achieves 90.2% mAP@0.5, outperforming the baseline model by 2.1 percentage points while significantly reducing the parameter count and computational complexity by 47.2% and 52.5%, respectively. Cross-dataset validation on the publicly available Laboro Tomato and RaUTD datasets confirms the model’s superior generalization capabilities. Overall, CFD-DETR provides a highly efficient and robust solution for real-time agricultural robotics.

1. Introduction

Tomatoes are globally cultivated and consumed, holding considerable economic value due to their distinct flavor and rich nutritional profile [1]. Currently, harvesting operations remain predominantly manual, characterized by high labor intensity and low efficiency, which severely hinders the improvement of industry quality and productivity [2]. To alleviate the conflict between labor-intensive picking and rising labor costs, harvesting robots have emerged as a core focus in smart agricultural equipment research [3]. However, in authentic orchard environments, fruits such as tomatoes and peaches typically grow in dense clusters and are easily obscured by branches and foliage. This complex, unstructured environment leads to persistently high rates of missed harvests, causing fruits to be picked past their optimal ripeness window [4]. Such delays not only reduce the marketability and flavor quality of the crop but also result in severe economic losses for farmers [5]. Therefore, enhancing the precision and speed of tomato ripeness recognition is crucial for ensuring product freshness, optimizing real-time transportation, and advancing automated agricultural logistics.
Early machine vision methodologies [6,7,8] and machine learning methods based on color analysis [9] are highly sensitive to dynamic light interference, frequently introducing subjective errors and exhibiting poor generalization capabilities in unstructured environments. To address complex foliage occlusion, deep learning frameworks have been progressively introduced. For instance, Ko et al. [10] fused multiple pure convolutional neural network (CNN) streams for maturity sorting, achieving an Average Precision (AP) of 0.96; however, this method imposes a significant computational burden and high inference latency. Furthermore, its performance degrades markedly under dynamic light interference and foliage occlusion, making it difficult to meet the practical deployment requirements of complex agricultural fields. Ni et al. [11] evaluated the application of lightweight CNNs in greenhouse tomato leaf disease classification and found that although EfficientNet-B0 achieved an accuracy of 70.40%, its performance was significantly constrained by background clutter and illumination variability. Consequently, the You Only Look Once (YOLO) series [12] has emerged as a dominant paradigm for balancing efficiency and performance. For example, Liu et al. [13] proposed YOLO-Tomato-A based on YOLOv3, attaining a detection accuracy of 98.3%; nonetheless, the model demonstrates insufficient capability in detecting small-sized tomatoes and performs poorly in dense fruit-overlapping scenarios. Subsequently, Gao et al. [14] combined YOLOv5 with transfer learning for greenhouse tomato detection, reaching a 93.6% accuracy, yet this model still encounters substantial limitations when confronting complex backgrounds and dynamic light interference. More recently, Yang et al. [15] proposed an improved YOLOv8 model for tomato ripeness recognition, achieving a precision of 95.8% and an accuracy of 91.7% on the test set. Despite these advancements, a critical bottleneck persists: to maintain high-speed localization, these single-stage architectures fundamentally rely on non-maximum suppression (NMS). When confronting dense fruit overlapping, NMS frequently and incorrectly suppresses the valid bounding boxes of adjacent tomatoes, resulting in severe missed detections. Fundamentally, pure CNN architectures lack the global long-range dependencies necessary to accurately distinguish heavily occluded and densely overlapping fruits within cluttered greenhouse backgrounds.
To overcome the inherent limitations of pure CNN architectures in complex agricultural environments, the Transformer model proposed by Vaswani et al. [16] has garnered significant attention due to its exceptional global modeling capabilities. Nahak et al. [17] compared Vision Transformer (ViT) with CNN models for tomato ripeness detection and found that ViT achieved an accuracy of 98.6%, significantly outperforming the CNN baseline. Carion et al. [18] proposed the DEtection TRansformer (DETR) paradigm. By utilizing the Hungarian matching algorithm to achieve direct end-to-end set prediction, DETR structurally eliminates the reliance on NMS post-processing. This fundamentally addresses the missed detection dilemma in dense fruit overlapping scenarios, where NMS frequently and incorrectly suppresses adjacent bounding boxes. The practical advantages of this architecture have been empirically validated in various agricultural tasks. Liu et al. [19] developed an optimized Deformable-DETR for green apple detection, reaching a precision of 80.4% under conditions where fruit appearance is similar to the foliage background and positions vary dynamically. To address dynamic light interference and foliage occlusion, Yao et al. [20] proposed EG-DETR, a tomato ripeness detection model based on the DETR architecture. When evaluated on a multimodal tomato dataset containing diverse dynamic lighting conditions, the model maintained an accuracy of 83.7% in complex agricultural scenes, further verifying DETR’s capability to effectively aggregate global contextual information for severely occluded fruits. In summary, by virtue of end-to-end set prediction, global self-attention, and an NMS-free design, DETR and its variants exhibit structural superiorities over CNN/YOLO architectures in addressing the three major greenhouse challenges: dynamic light, severe occlusion, and dense overlapping. Furthermore, Gao et al. [21] integrated CT-DETR with a ReID module to significantly enhance pedestrian tracking performance (94.8% precision, 92.8% accuracy), corroborating the architectural strength of DETR in handling object overlap and re-identification from a general target association perspective. However, the original DETR suffers from slow training convergence and high inference latency. To mitigate these issues, Zhao et al. [22] proposed Real Time DEtection TRansformer (RT-DETR), successfully extending the DETR paradigm to real-time detection scenarios. For instance, Zhao et al. [23] combined RT-DETR with Swin Transformer to develop RT-DETR-Tomatoes-BS, achieving an mAP@0.5 of 88.7% by better capturing wide-range global dependencies and contextual information while balancing training costs and detection performance. Gu et al. [24] further introduced an improved RT-DETR method for automated tomato detection, integrating machine learning and graphics processing techniques to reach an mAP@0.5 of 86% (a 3% improvement over the baseline), enabling precise real-time phenotype computation. Nevertheless, despite these advantages, standard RT-DETR still imposes a significant computational burden on resource-constrained agricultural edge devices due to its massive parameter count and computational overhead, necessitating further lightweight optimization.
Consequently, the urgent demand for deploying models on resource-constrained agricultural edge devices has accelerated the development of lightweight object detection networks. Wang [25] proposed a lightweight two-stage detection network that achieved an inference speed of 130 FPS and an mAP@0.5 of 75.87% on the KITTI dataset, establishing a high-speed baseline for real-time detection. Recent studies have made significant progress in agricultural vision tasks that balance efficiency and accuracy. For instance, Gao et al. [26] proposed a lightweight tomato ripeness detection model, YOLOv8n-FDE, which achieved a 97.6% mAP@0.5 with its parameter count drastically reduced to 1.56 M; however, its accuracy still experienced a noticeable decline under conditions of severe occlusion and dynamic lighting. Song et al. [27] presented an improved instance segmentation model, FGS-YOLOv8s-seg, for tomato detection and ripeness grading in greenhouse environments. Experimental results demonstrated that, compared to the YOLOv8s-seg baseline, the model improved precision and mAP@0.5 by 2.6% and 5.1%, respectively, achieving a favorable balance between accuracy and speed while maintaining high computational efficiency. Ma et al. [28] developed TMSDDet, a lightweight tomato ripeness detection model based on YOLO11n that integrates ADown, SlimNeck, and Efficient-Head modules. This model was successfully deployed on edge devices and achieved 80.4% mAP@0.5. Furthermore, Wang et al. [29] proposed PDSI-RTDETR, a lightweight tomato ripeness detection model based on an improved RT-DETR. Compared to the standard RT-DETR baseline, it increased mAP@0.5 and FPS by 3.9% and 38.7%, respectively, further validating the immense application potential of the RT-DETR architecture in tomato ripeness detection tasks.
In summary, although existing models are capable of performing tomato ripeness classification, their applicability remains highly limited in unstructured greenhouse environments characterized by dynamic light interference, fruit overlapping, and foliage occlusion. Furthermore, they struggle to meet the urgent demand for deployment on resource-constrained agricultural edge devices. To address this, the present study adopts the Transformer-based RT-DETR as a baseline framework and proposes a lightweight tomato ripeness detection model, CFD-DETR. Under complex real-world greenhouse backgrounds, this model achieves an optimal balance among mAP@0.5, GFLOPs, and inference speed, and its superior generalization capability has been validated on the public Laboro Tomato and RauTD datasets. The proposed model not only overcomes the critical challenges faced by existing algorithms in fine-grained tasks but also significantly reduces model parameters and computational overhead, thereby providing a highly efficient and deployable algorithmic foundation for agricultural robotic harvesting. The primary objectives and contributions of this study are as follows:
(1)
To meet the requirements of lightweight deployment and mitigate dynamic light interference, a lightweight backbone network, CAEfficientViT, is designed based on the EfficientViT architecture. By embedding the CAEViTBlock, the model’s capacity to extract tomato fruit color features is enhanced, enabling the highly efficient capture of subtle, fine-grained ripeness traits.
(2)
To overcome severe foliage occlusion, a Focused Efficient Additive Attention (FEAA) mechanism is proposed. Utilizing global weighted attention scores and an additive attention paradigm, this mechanism effectively directs the model’s focus toward local feature regions crucial for ripeness classification while simultaneously reducing computational overhead, facilitating its deployment on resource-constrained agricultural edge devices.
(3)
To resolve the issues of fruit blurring and artifacts caused by traditional upsampling, a depthwise dynamic upsampling module, DwDySample, is designed. This module ensures that critical information, such as maturity-related color transitions and occlusion boundaries, is prominently preserved within the upsampled feature maps.
(4)
To improve the accuracy of tomato boundary fitting and effectively handle low-quality greenhouse tomato samples, this study integrates Wise-IoUv3 with SIoU to design the Wise-SIoU loss function. This enhances the model’s high-precision fitting capability and strong robustness in complex scenarios.
This study is organized as follows: Section 2 introduces the materials and methods; Section 3 presents and discusses the experimental results; Section 4 summarizes the conclusions.

2. Materials and Methods

2.1. Dataset Reconstruction

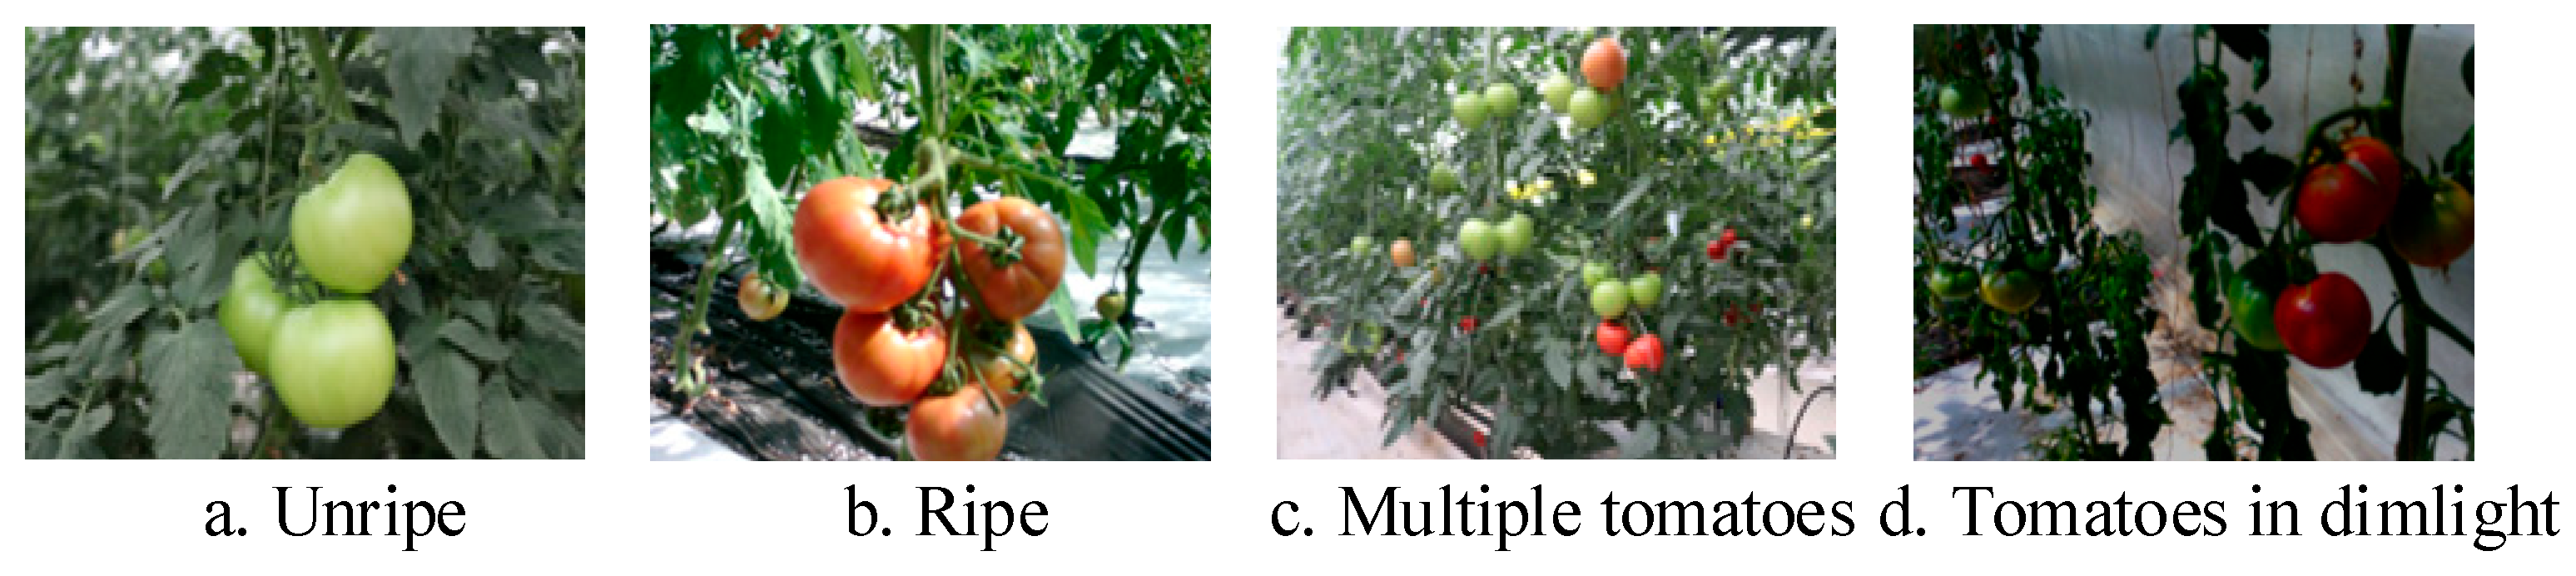
The greenhouse tomato images utilized in this study were sourced from the public dataset released by Liu et al. [30]. To simulate the authentic challenges of unstructured greenhouse environments, we rigorously selected 1613 complex scene images encompassing dynamic lighting, severe occlusions, and multi-scale perspectives. Sample images from the dataset are illustrated in Figure 1. To address the issues of missing annotations and wide distribution variance for small objects (instance pixel area < 1024) in the original dataset, manual supplementary annotations were conducted. The changes in the scale distribution of the dataset before and after the supplementary annotation are detailed in Table 1. Following the re-annotation, the number of small objects increased from 474 to 728, with their proportion rising from 5.8% to 8.7%. Medium objects accounted for 49.6%, and large objects for 41.7%. This significantly ameliorated the scale bias problem caused by the excessively low proportion of small objects and the disproportionately high proportion of large objects in the initial data. The reconstructed dataset is not only characterized by a “high occlusion rate, high proportion of small objects, and high annotation difficulty,” but it also effectively mitigates the distribution imbalance of “large-object dominance and small-object sparsity” present in the original data. Consequently, it provides more comprehensive supervision information for the model to learn features of deeply occluded and distant clustered objects.
Furthermore, based on the United States Department of Agriculture (USDA) tomato color classification standards [31] and the specific practical engineering requirements of automated harvesting robots, tomatoes with entirely green surfaces were categorized as “GreenTomato,” whereas those exhibiting light red or fully red surfaces were categorized as “RedTomato.” As shown in Table 2, among the 14,879 re-annotated bounding boxes, 6755 instances were classified as unripe (45.40%), and 8124 instances were classified as ripe (54.60%). This highly balanced binary classification not only effectively supports the automated harvesting task but also provides the model with distinct visual features for ripeness recognition while avoiding severe class imbalance issues.

2.2. Dataset Preprocessing

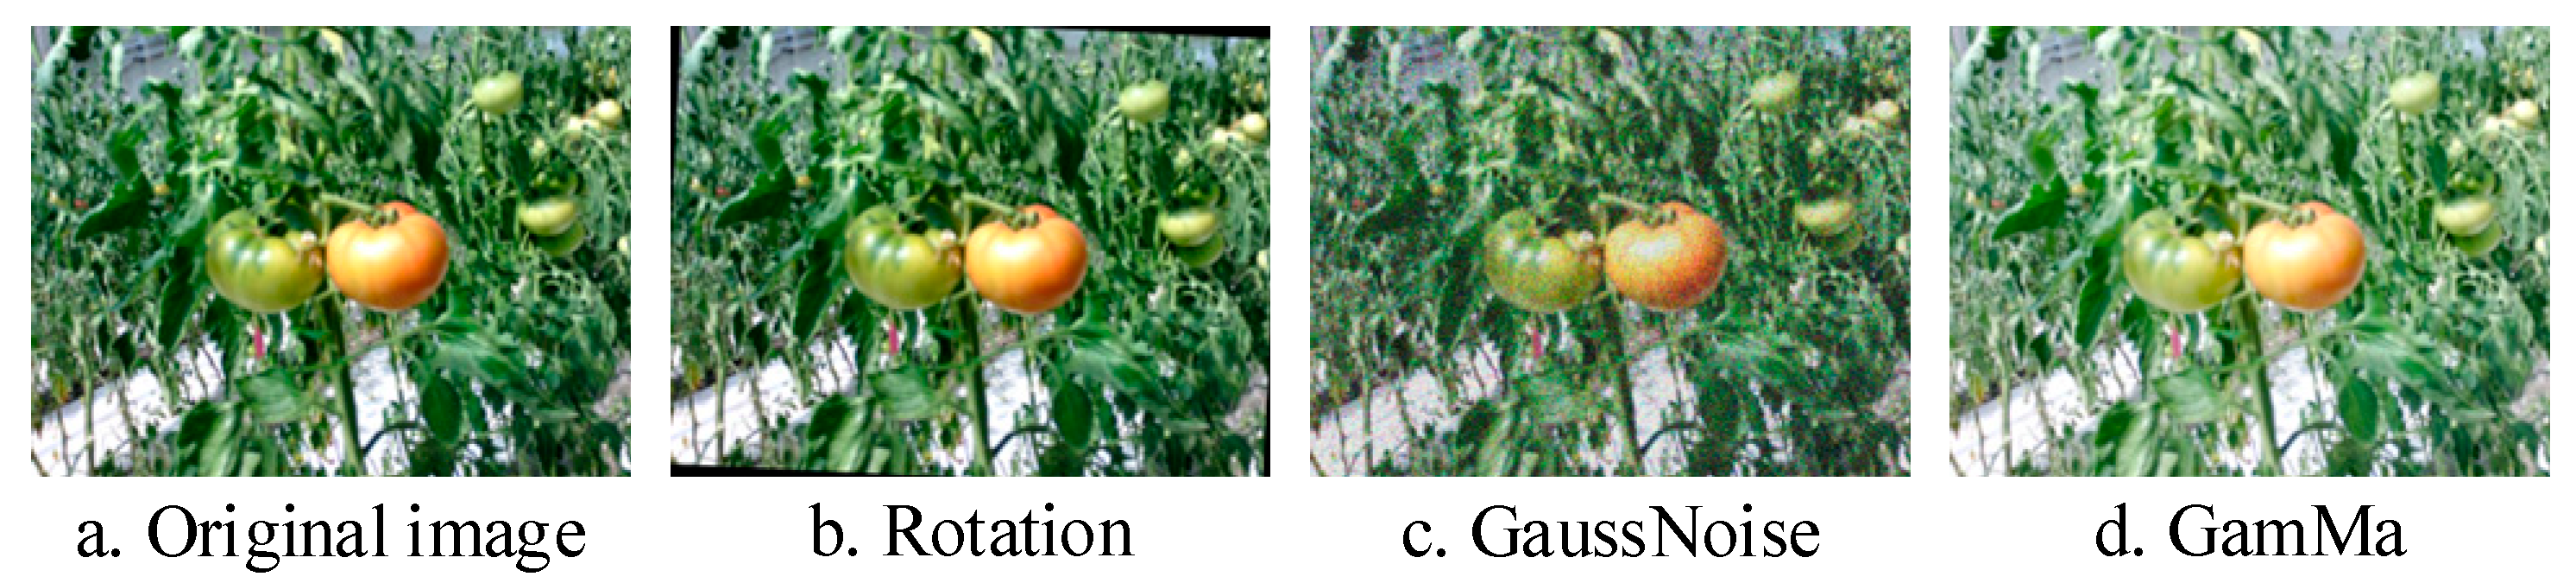
To ensure the objectivity of the model evaluation, the dataset was first divided into training, validation, and test sets at a ratio of 8:1:1. Subsequently, to enhance the model’s robustness against environmental variations in complex greenhouse scenarios and to mitigate the risk of overfitting, a multi-dimensional static data augmentation strategy was implemented. This strategy comprehensively utilized image rotation, Gaussian noise addition, and gamma transformation, thereby improving the model’s adaptability under extreme conditions. Examples of the augmented images are presented in Figure 2. Ultimately, the total number of images in the dataset was expanded to 3224.

2.3. Experimental Environment and Parameter Setting

The configuration of the experimental environment is detailed in Table 3. The model was trained for 100 epochs, utilizing an input image resolution of 640 × 640 pixels and the AdamW optimizer. The primary hyperparameters were set as follows: a batch size of 4, an initial learning rate of 0.0001, and a weight decay coefficient of 0.0001.

2.4. Evaluation Metrics

The evaluation metrics for tomato ripeness target detection include parameters, model size, frames per second (FPS), recall ( R ), precision ( P ), mean average precision ( m A P ), and GFLOPs.
R = T P T P + F N × 100 %
P = T P T P + F P × 100 %
m A P = 1 M k = 1 M A P ( k )
where T P denotes the number of positive samples correctly identified as positive; F N denotes the number of positive samples incorrectly identified as negative; F P denotes the number of negative samples incorrectly identified as positive; A P indicates the average precision; M denotes the total number of target categories.

2.5. Construction of CFD-DETR Model

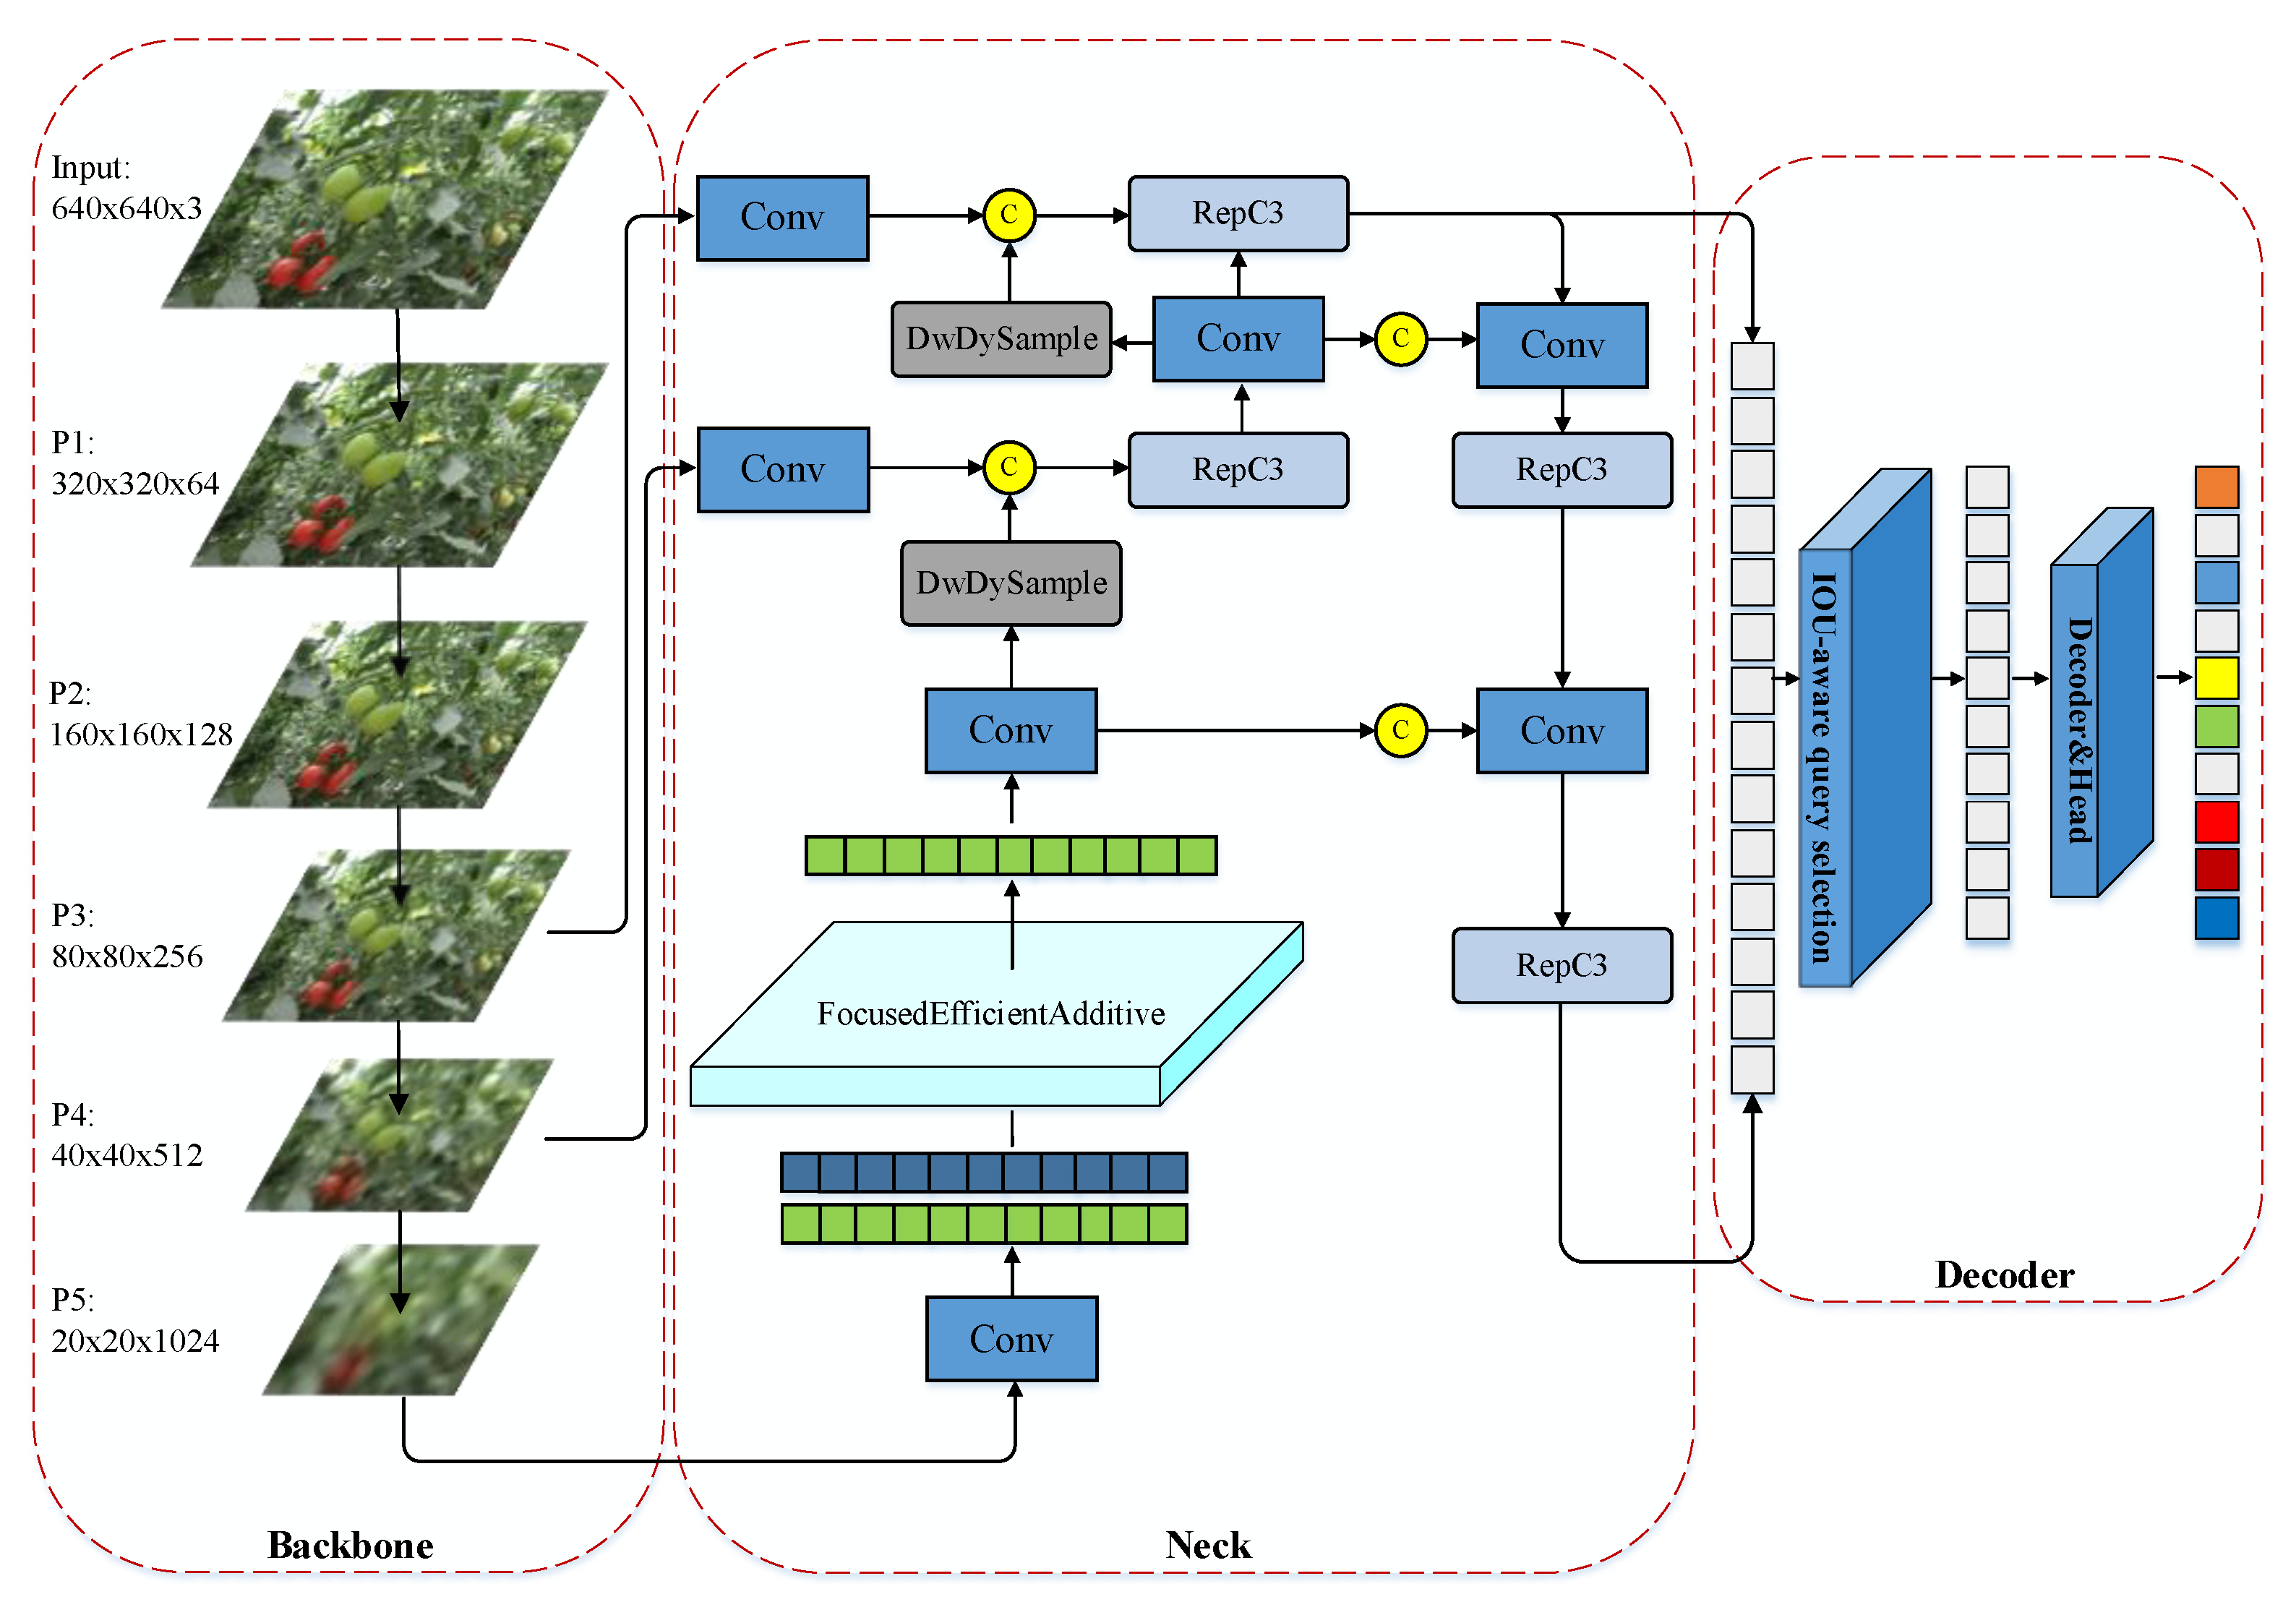
To address the inherent challenges of the standard RT-DETR model in complex greenhouse scenes—such as its large model scale, high computational complexity, slow inference speed, and inadequate feature extraction for occluded or small tomatoes—this study proposes an improved, lightweight tomato ripeness detection model named CFD-DETR. First, a lightweight multi-scale feature extraction backbone, CAEfficientViT, is constructed based on the EfficientViT architecture. By embedding a custom CAEViTBlock tailored for tomato ripeness, this backbone enhances the extraction of nuanced fruit color features. Second, a Focused Efficient Additive Attention (FEAA) mechanism is designed and integrated with the AIFI module to replace the original Multi-Head Attention (MHA). This integration balances global context and local detail perception, improving classification accuracy while maintaining a deployment-friendly architecture. Third, a Deep Dynamic Upsampling (DwDySample) operator is introduced to replace standard bilinear interpolation. It can accurately capture key variations in the surface features of greenhouse tomatoes, enabling more precise semantic restoration during feature upsampling. Finally, the Wise-SIoU loss function is formulated by synergizing Wise-IoUv3 and SIoU. It leverages the precise bounding box regression of SIoU alongside the robust handling of occluded and low-quality samples by Wise-IoUv3. Ultimately, this approach effectively mitigates missed and false detections, reduces the parameter count, accelerates inference speed, and lowers hardware requirements without compromising detection accuracy. The overall architecture of the CFD-DETR model is illustrated in Figure 3.

2.5.1. Baseline Selection

To justify the selection of RT-DETR-R18 as the baseline architecture for complex greenhouse environments, we compared it against mainstream CNN-based detectors—Faster-RCNN, SSD, and YOLOv10s—under identical experimental conditions (Table 4). The results reveal the inherent limitations of traditional CNN architectures in challenging agricultural scenarios. Classic detectors such as Faster-RCNN and SSD are computationally prohibitive for resource-constrained edge devices, achieving only 84.3% and 84.0% mAP@0.5, respectively. Although YOLOv10s offers a significantly more lightweight design, its inherently limited local receptive field restricts its discriminative capacity under severe foliage occlusion and dense fruit overlapping, yielding a modest mAP@0.5 of 86.8%. In contrast, RT-DETR-R18 leverages the self-attention mechanism to capture global contextual information and adopts an NMS-free end-to-end set prediction paradigm. This structural advantage effectively mitigates the challenges posed by occlusion and overlapping, attaining the highest detection accuracy (88.1% mAP@0.5) while maintaining a low computational cost (56.9 GFLOPs). These results conclusively demonstrate that RT-DETR-R18 fundamentally outperforms CNN-based architectures in balancing high-precision detection with lightweight deployment feasibility, thereby providing a solid empirical foundation for the subsequent optimizations undertaken in this study.

2.5.2. RT-DETR

The RT-DETR architecture consists of a backbone network, a hybrid encoder, and a Transformer decoder equipped with auxiliary prediction heads. Specifically, the encoder takes the output features from the final three stages of the backbone, transforming these multi-scale features into an image feature sequence via an attention-based intra-scale feature interaction (AIFI) module and a cross-scale feature-fusion module (CCFM). Subsequently, an IoU-aware query selection module extracts a fixed number of features from the encoder’s output to serve as initial object queries for the decoder. Finally, the decoder iteratively optimizes these queries to generate bounding boxes and confidence scores. While the standard RT-DETR framework provides various backbone options, such as ResNet and HGNet, RT-DETR-R18 was selected as the baseline network in this study to optimally balance network complexity and detection precision for practical tomato ripeness assessment.

2.5.3. CAEfficientViT Backbone

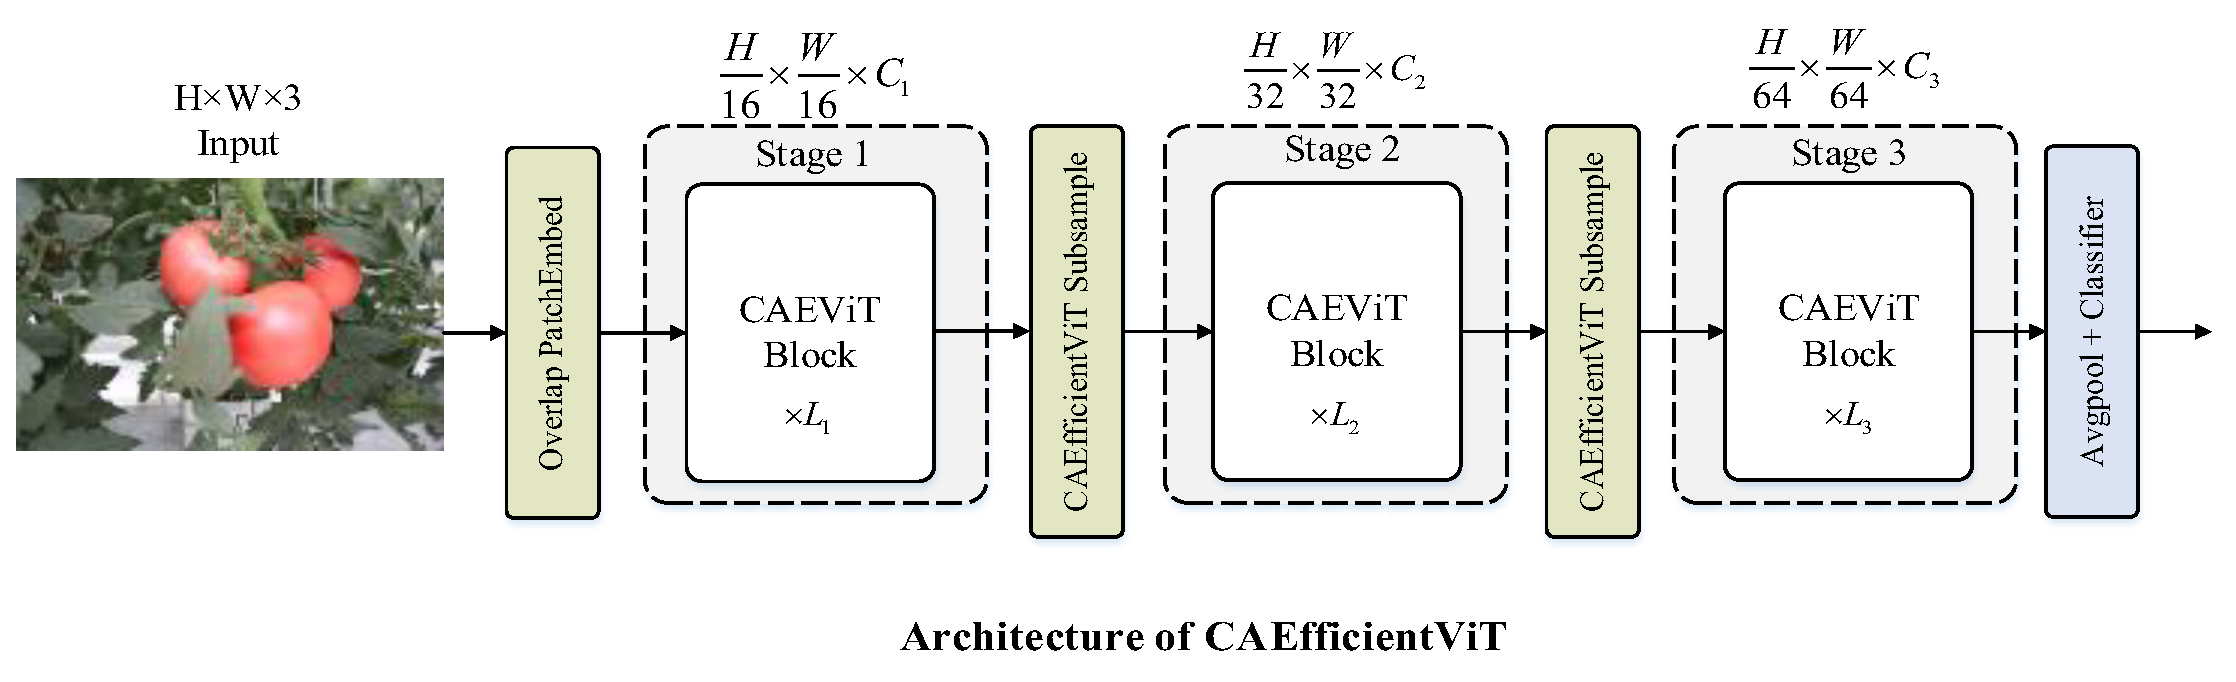
For tomato ripeness detection, lightweight backbones must strike an optimal balance among low parameter complexity, real-time inference capabilities, and high sensitivity to fruit color. EfficientViT employs hybrid spatial-channel attention to efficiently extract multi-scale features and capture color dependencies, perfectly aligning with these requirements. Therefore, a lightweight multi-scale backbone named CAEfficientViT, built upon the EfficientViT architecture, is proposed in this study. As illustrated in Figure 4, the architecture comprises Overlap PatchEmbed, CAEfficientViT Subsample, Classifier modules, and CAEViTBlock, where H and W denote the height and width of the input image, respectively. Through the stacking of CAEViTBlocks, the network extracts S3 (80 × 80 × 64), S4 (40 × 40 × 128), and S5 (20 × 20 × 192) feature maps, which subsequently serve as multi-scale inputs for the hybrid encoder. The specific architectural configurations of CAEfficientViT are detailed in Table 5.
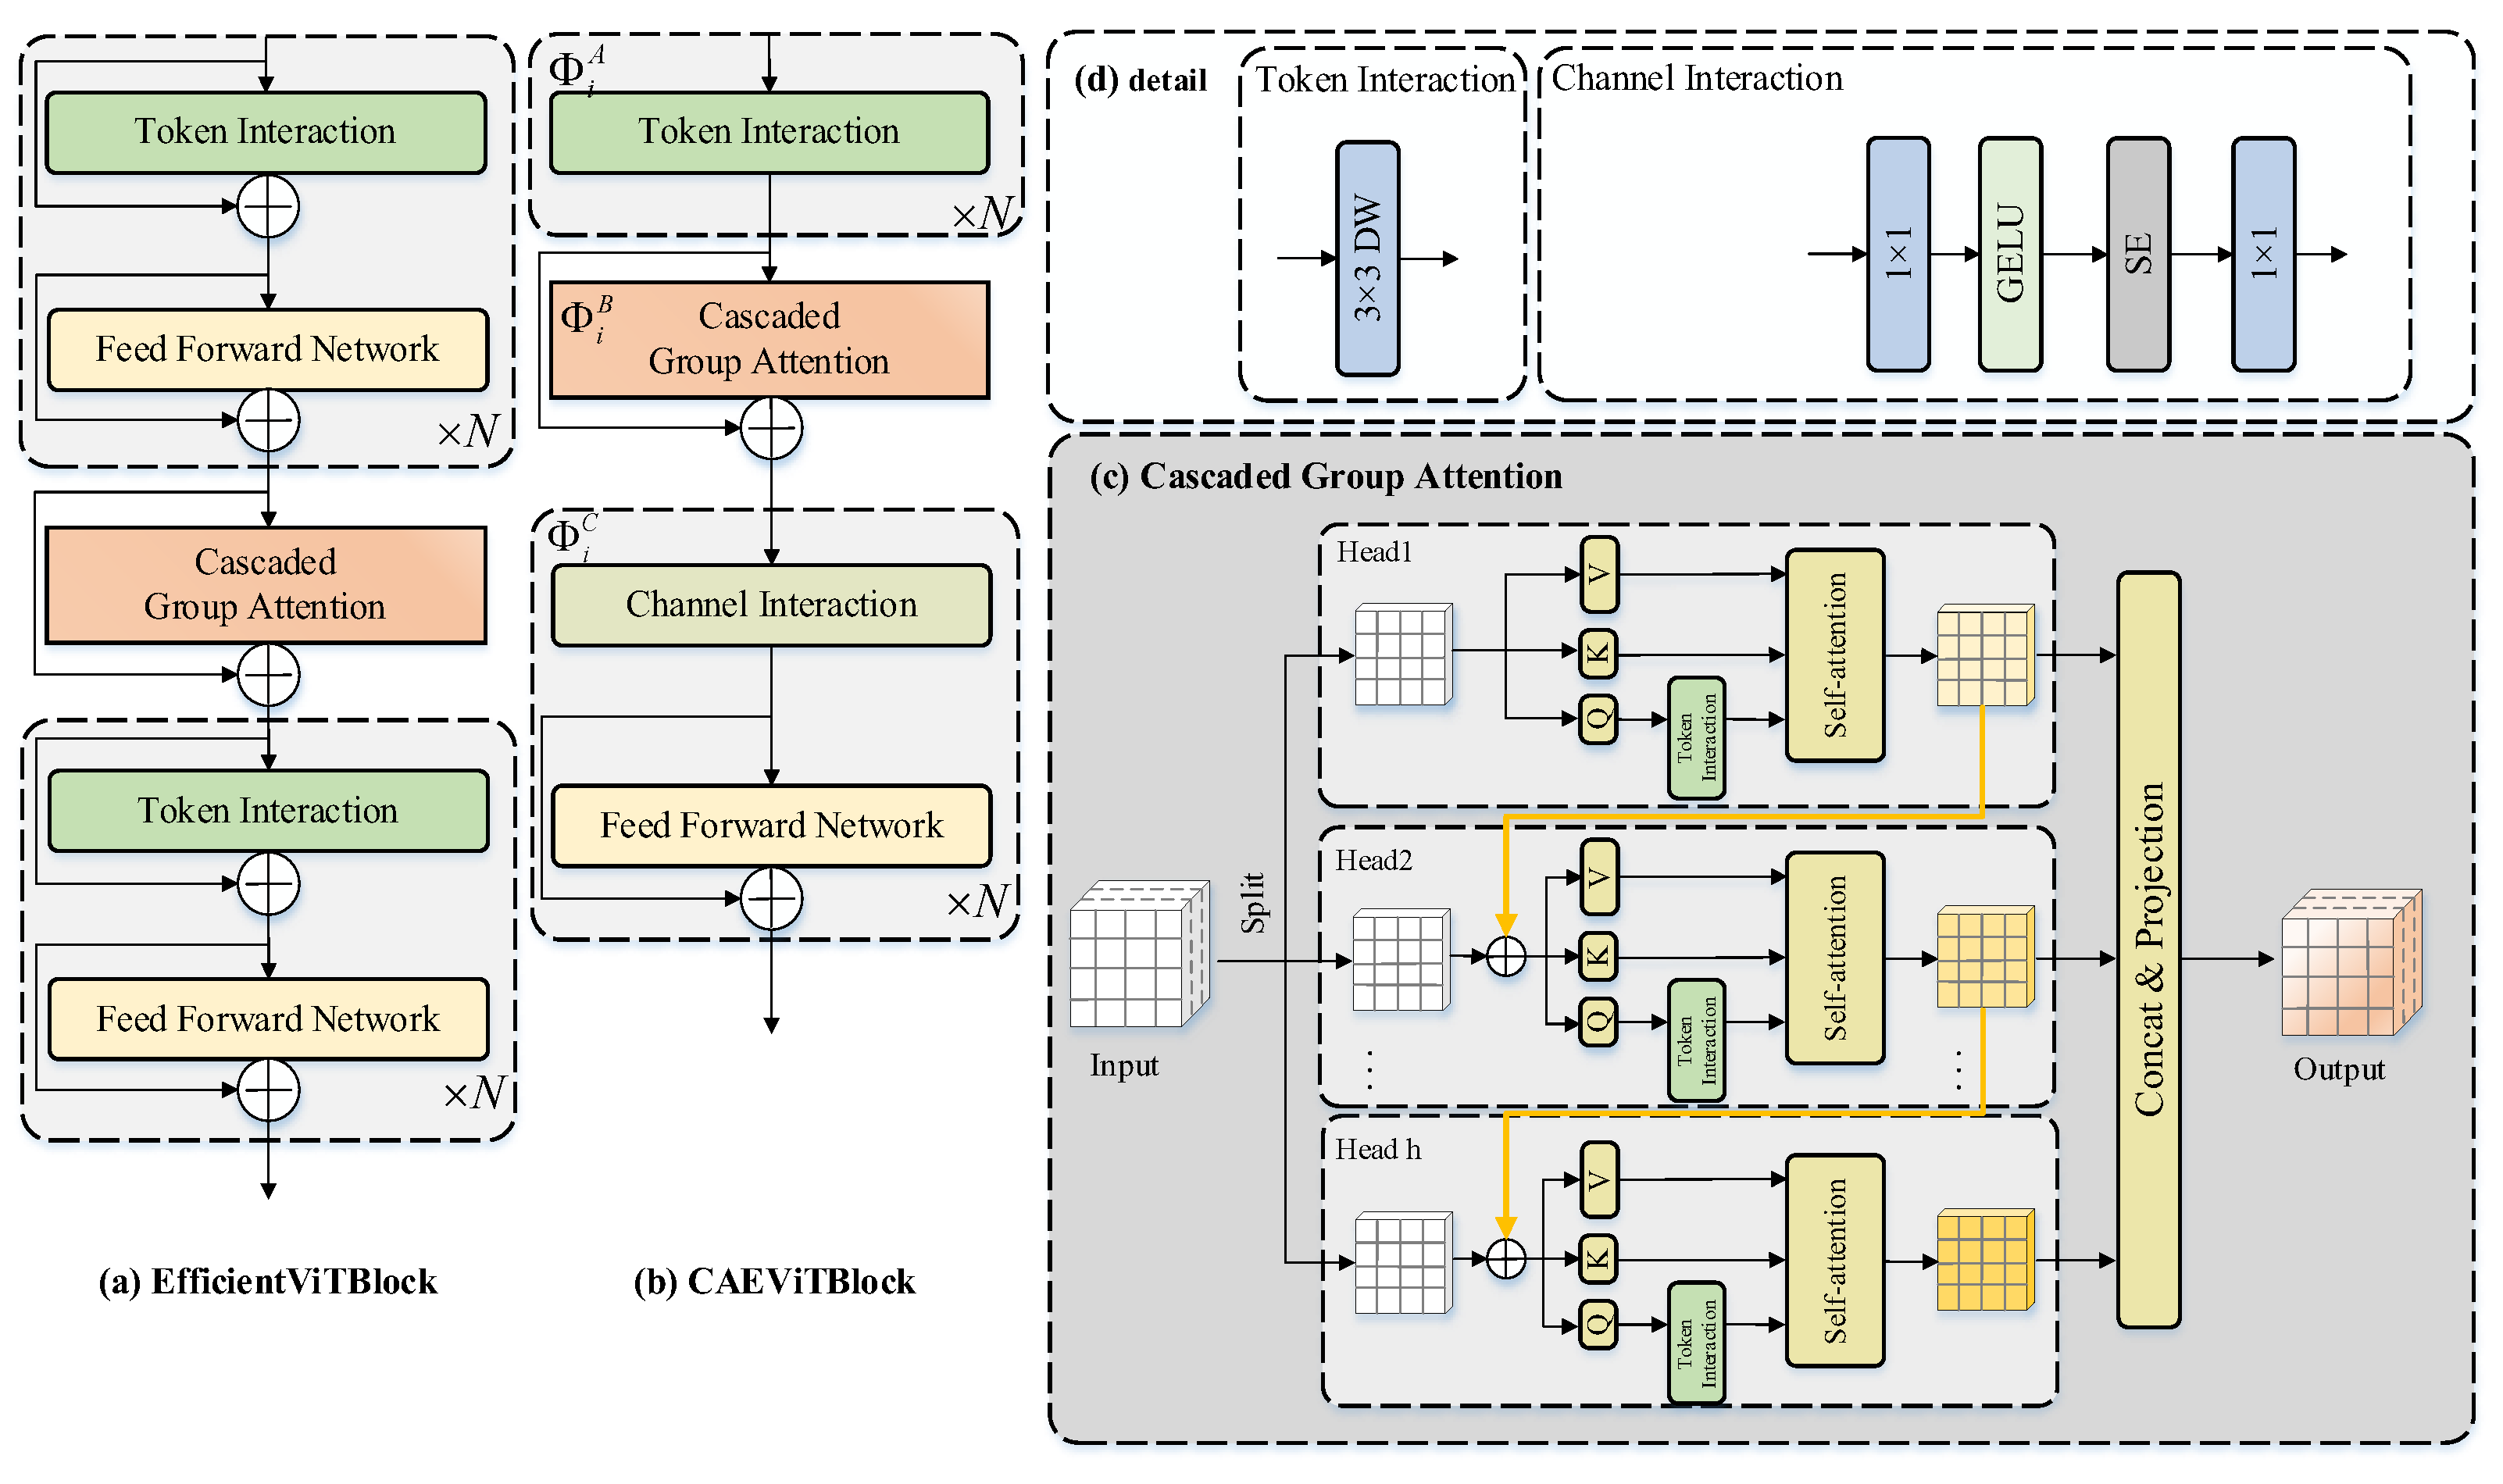
In the CAEfficientViT network, the shallow feature map S3 focuses on target details, whereas the deep feature maps S4 and S5 prioritize semantic information. During feature integration, S3 and S4 are fed into the CCFM for multi-scale complementary enhancement. This process preserves the lightweight efficiency of CAEfficientViT and significantly boosts its capacity for tomato ripeness feature discrimination by strengthening cross-scale color-texture correlations. Simultaneously, S5 serves the subsequent intra-scale feature interaction modules, providing high-quality deep semantic support for maturity classification. For robust tomato ripeness detection, the model must accurately capture specific visual features, particularly color variations. Although the standard EfficientViTBlock (as illustrated in Figure 5a) performs well in general detection tasks, it lacks a targeted color calibration mechanism for tomatoes, leading to suboptimal performance in this specific application. To overcome this limitation, the proposed CAEViT module (as illustrated in Figure 5b) streamlines feature extraction, incorporates a channel interaction module, and enhances multi-scale representational capabilities. This structural optimization improves computational efficiency and enables the precise distinction of tomato maturity levels, thereby satisfying practical agricultural requirements.
The architectural design of the proposed CAEViT module is driven by the specific intuition to extract fine-grained ripening features under constrained computational budgets. First, to efficiently capture local textural patterns of the fruit surface with minimal parameter overhead, the input feature X i is processed by a depthwise separable convolution. Subsequently, to establish robust global spatial dependencies among densely clustered fruits and mitigate the feature fragmentation caused by foliage occlusion, the module employs Cascaded Group Attention (CGA). Crucially, given that color variation serves as the primary physiological indicator of tomato ripeness, a specialized Channel Interaction module was developed. By integrating a Squeeze-and-Excitation (SE) mechanism, the module adaptively recalibrates channel weights to amplify feature responses of maturity-related color spectra while suppressing homogeneous green background noise. The comprehensive computational process of the module is formalized in Equations (1)–(5).
X i + 1 = N Φ i C ( Φ i B ( N Φ i A ( X i ) ) )
Φ i A ( X i ) = T oken _ Interaction ( X i )
Φ i B ( X i ) = C G A ( X i )
C hannel _ Interaction ( X i ) = Conv SE GELU Conv X i
Φ i C ( X i ) = F F N ( C hannel _ Interaction ( X i ) )
where X i represents the complete input features of the i-th block, Φ i A ( X i ) denotes the results of Token Interaction calculations, Φ i B ( X i ) reflects the feature calculations from cascaded group attention fusion, Φ i C ( X i ) indicates the feature calculations from Channel Interaction and Feedforward Network, and X i + 1 signifies the output of the current block. The computational process of the CGA (cascaded group attention) module is as follows:
X ^ i + 1 = A t t e n t i o n ( X i , j W i , j Q , X i , j W i , j K , X i , j W i , j V ) X ^ i + 1 = C o n c a t [ X ^ i , j ] j = 1 : h W i P
where X ^ i + 1 represents the j -th self-attention head computing X i , j , X i , j denotes the j -th partition of the input feature X i , i.e., X i = X i , 1 , X i , 2 , , X i , h and 1 j h . h is the total number of self-attention heads. W i , j Q , W i , j K , and W i , j V are projection layers mapping the input features to different subspaces. W i P is a linear layer that projects the concatenated output features back to the same dimension as the input.
The CAEfficientViT network is proposed by integrating a Channel Interaction module and optimizing the standard EfficientViTBlock architecture. This architectural refinement not only enhances the multi-scale feature extraction capabilities of the network but also effectively reduces computational complexity while maintaining robust representational capacity.

2.5.4. Focused Efficient Additive Attention Mechanism

Although the Multi-Head Attention (MHA) mechanism in RT-DETR excels at capturing spatial dependencies, it exhibits two significant limitations for agricultural applications. First, its computational complexity scales quadratically with input sequence length ( O N 2 ), creating a substantial bottleneck for real-time processing of high-resolution greenhouse images. Second, it tends to diffuse attention globally, often overlooking fine-grained local visual cues—such as subtle color transitions and texture patterns—which are critical for distinguishing tomato ripeness levels.
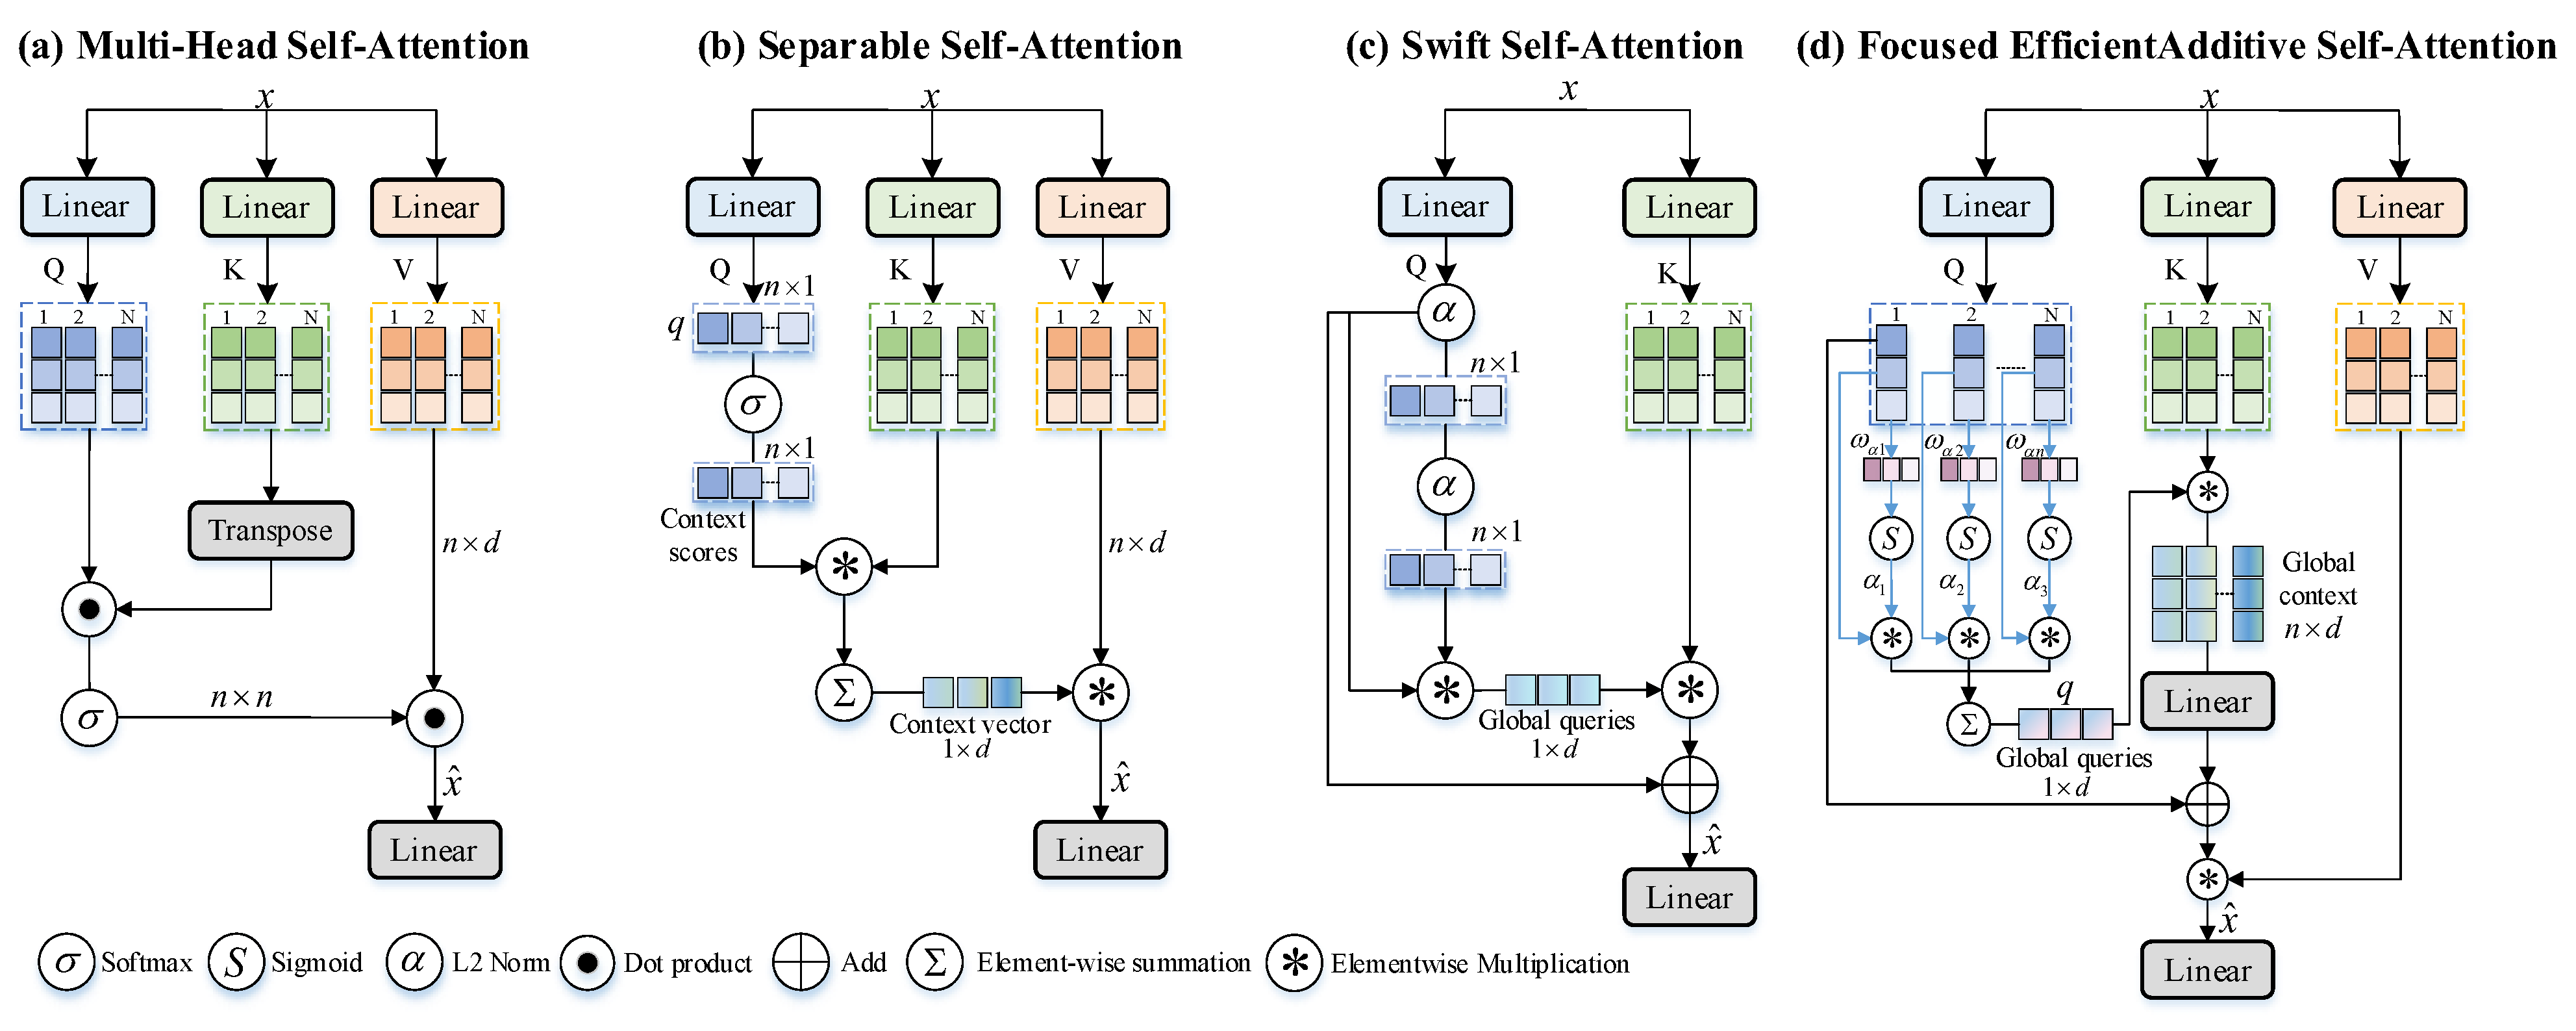
To address these limitations, we propose the FEAA mechanism. While traditional mechanisms, such as standard MHA (Figure 6a), separable self-attention (Figure 6b) [32], and swift self-attention (Figure 6c) [33], rely on complex matrix multiplications, our proposed FEAA adopts an additive attention paradigm [34] to reduce computational complexity to O N while maintaining global context awareness.
As illustrated in Figure 6d, an input feature map x undergoes linear projections through three weight matrices W Q , W K , and W V to yield the query ( Q ), key ( K ), and value ( V ) representations. Unlike the computationally intensive and resource-demanding N × N attention matrix, FEAA learns a unified ‘global focus’ to specifically highlight localized ripening traits across the entire image. Specifically, the query matrix is multiplied by a learnable parameter vector ω a R d , which acts as a global ‘ripening detector’. Following Sigmoid activation, this operation generates a global attention weight map α ( α R n ) that functions as an adaptive spatial filter. It selectively assigns higher weights to local regions exhibiting critical maturity transitions while actively suppressing irrelevant foliage backgrounds. The calculation process is as follows:
α = S igmoid Q ω a / d
Subsequently, to integrate scattered local features into a unified global representation, the learned global attention weights α are utilized to perform weighted aggregation on the query matrix, generating a single global query vector q R d . Essentially, this vector q distills the most discriminative ripening-related traits across the entire visual scene. The formal calculation is presented as follows:
q = i = 1 n α i Q i .
Finally, to redistribute this highly distilled semantic information back to individual spatial locations, the global query vector q interacts with the key matrix K R n × d via broadcast element-wise multiplication, and the resulting context representation is subsequently multiplied by the value matrix V R n × d . This specific design ensures that even severely occluded tomatoes receive contextual enhancement guided by the global ripeness information. This computational process is expressed in Equation (9).
x ^ = V Q ^ + T K q
where Q ^ denotes to the normalized query matrix, T denotes to the linear transformation.
By leveraging sigmoid-weighted attention scores, FEAA effectively directs the model’s focus toward local feature regions critical for ripening stage classification. Furthermore, by exploiting the linear properties of additive attention, it successfully minimizes computational overhead, enabling seamless deployment on resource-constrained agricultural edge devices without compromising detection accuracy.

2.5.5. DwDySample Module

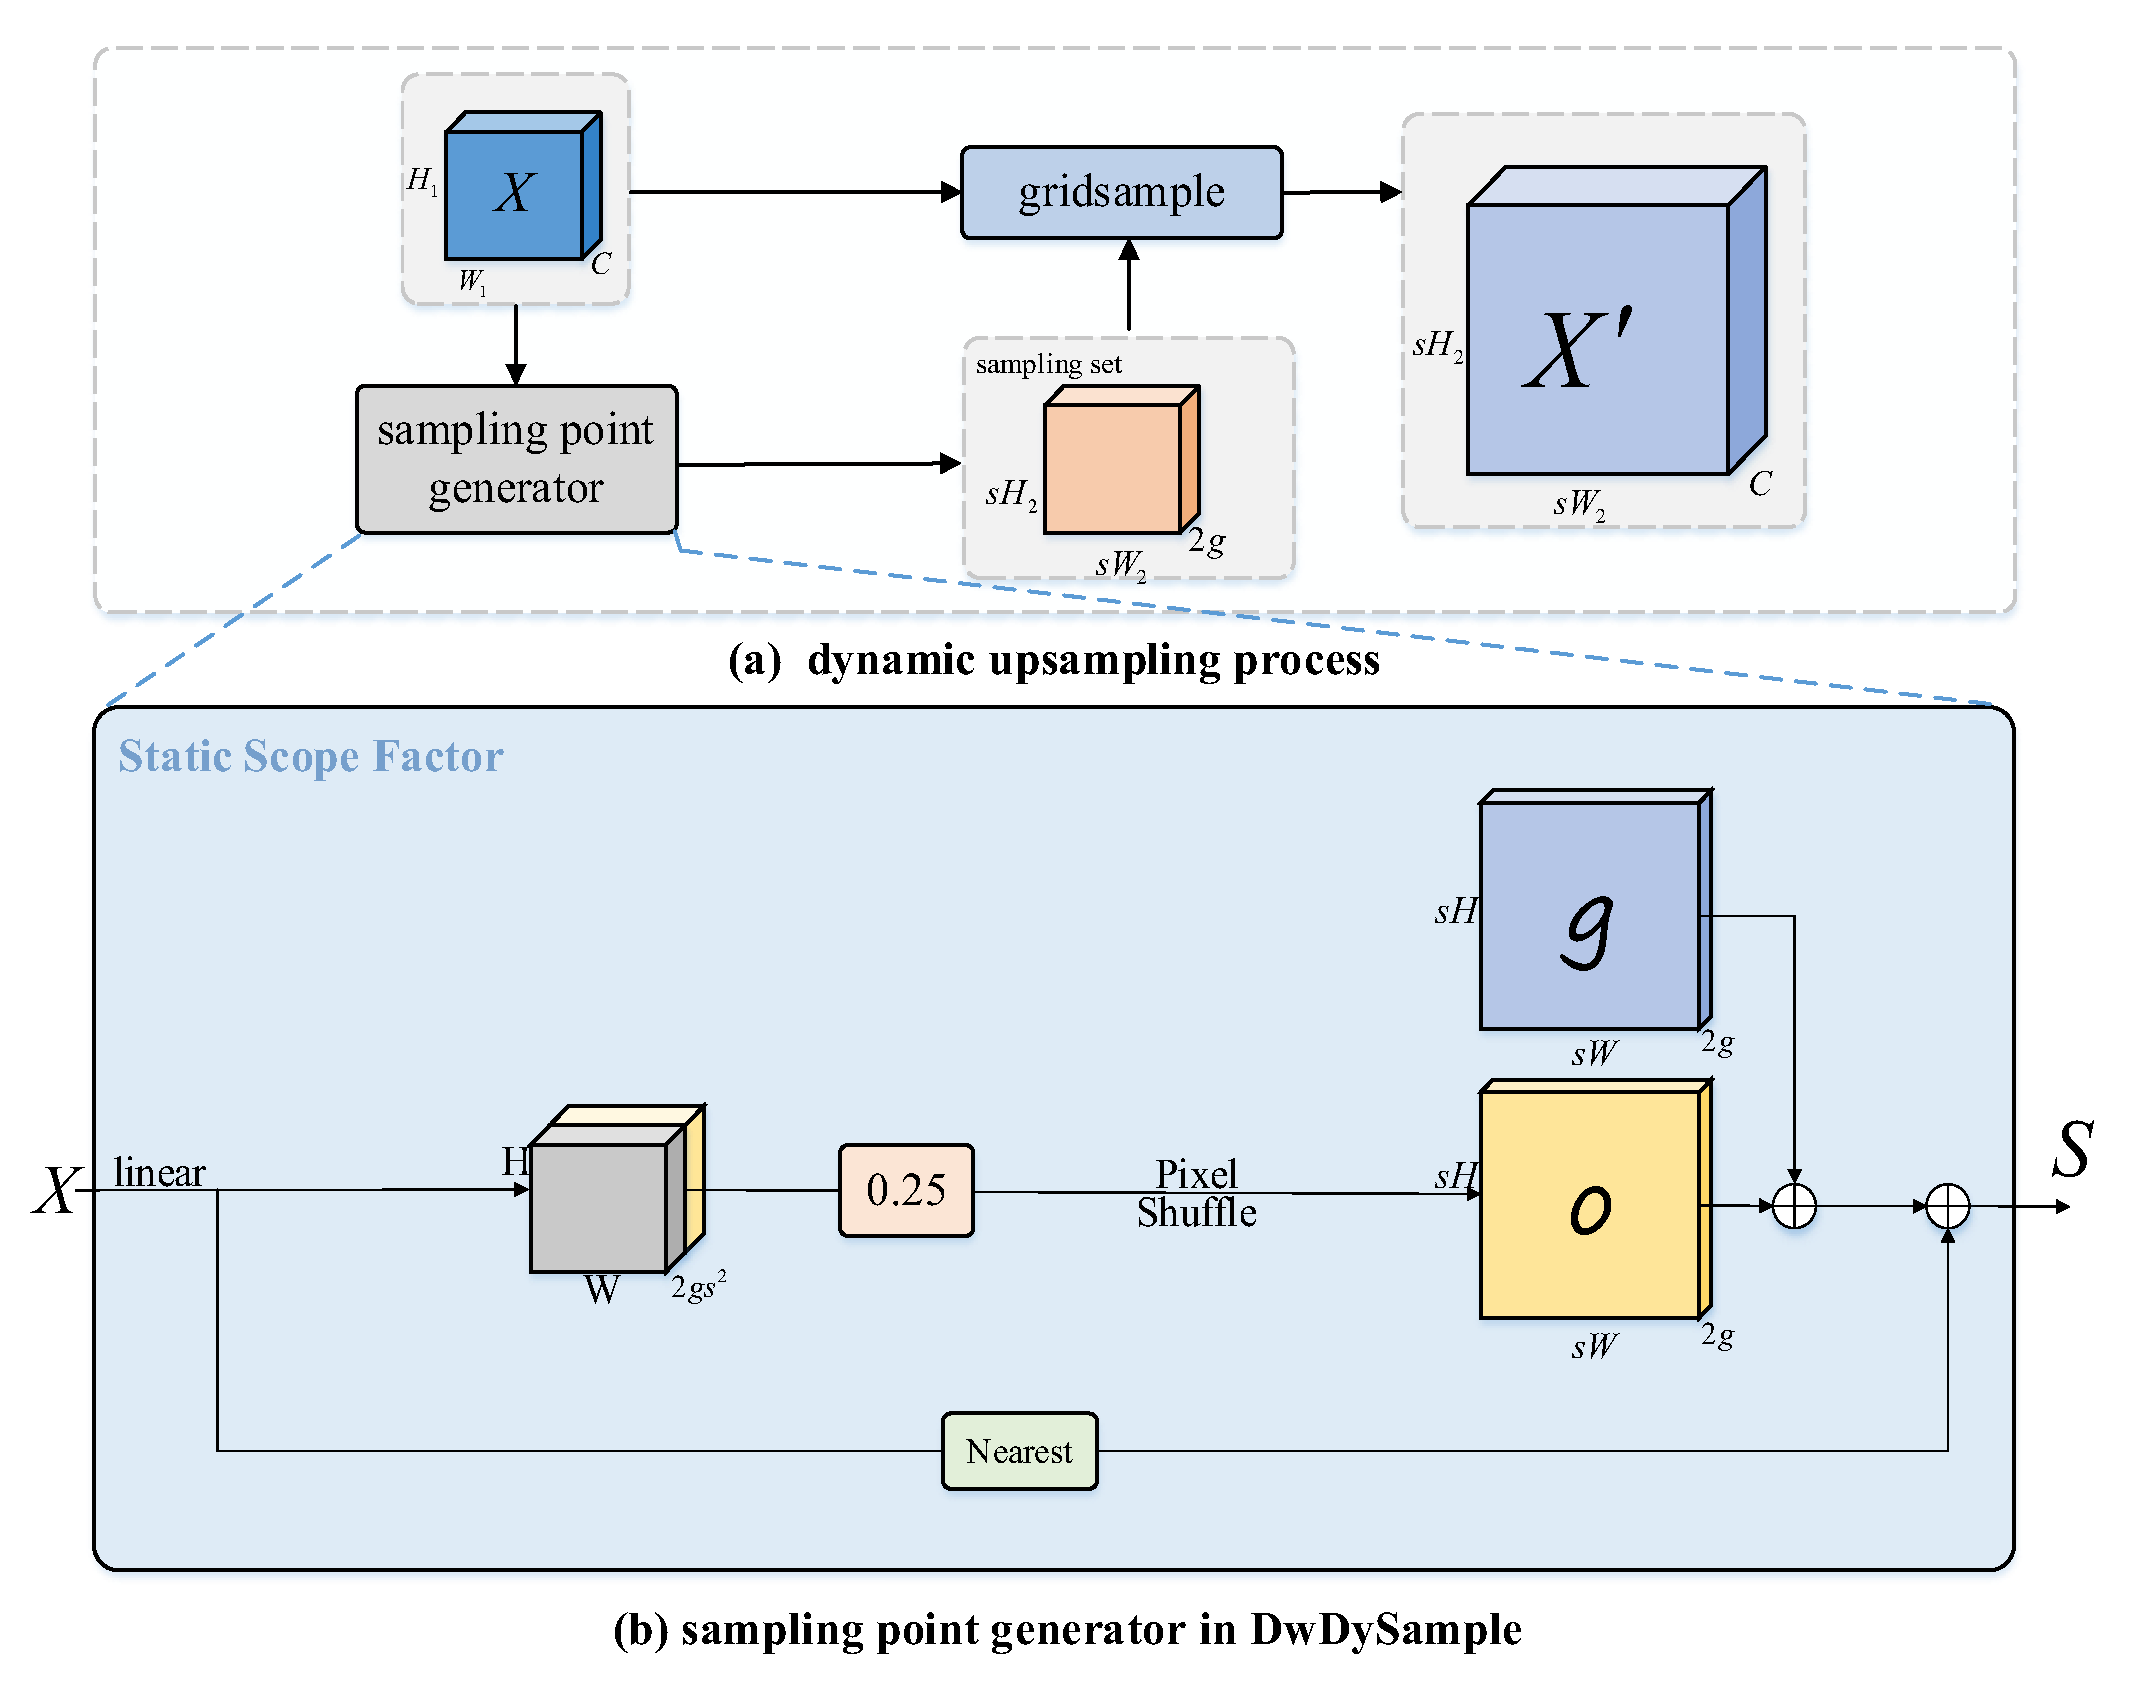
Bilinear interpolation, the default upsampling method in RT-DETR, is widely utilized in image processing due to its simplicity and computational efficiency. However, when processing complex tomato scene images, it often introduces jagged edges and blurring effects, which subsequently degrade image quality and the precision of ripeness grading. The DySample operator, a dynamic sampling method that significantly outperforms traditional upsampling techniques [35], relies on a learning-based dynamic adjustment mechanism and offers two offset generation styles: “linear + pixel shuffle” (as shown in Figure 7a) and “pixel shuffle + linear” (as illustrated in Figure 7b). DySample dynamically calculates offsets via convolutional layers to adaptively adjust upsampling positions and weights by input feature content; its core framework is illustrated in Figure 8a. While this adaptability facilitates the capture of intricate image details and boosts detection performance, the standard DySample operator introduces high parameter complexity and exhibits limited feature representation capabilities specifically for tomato ripeness detection.
To address these limitations, the DwDySample module is proposed in this study. It is built upon the static range factor algorithm in the DySample operator’s sampling point generator and the “linear + pixel shuffle” offset generation style. The structure of the proposed module is illustrated in Figure 8b.
To optimize parameter complexity, DwDySample utilizes DSConv for offset computation. Decomposing the standard convolution into depthwise and pointwise operations significantly reduces the computational overhead. Furthermore, residual connections are introduced to enhance gradient flow and feature retention. This is achieved by first adjusting the input size via nearest-neighbor interpolation and subsequently superimposing it onto the output features. This mechanism preserves low-level tomato details (e.g., surface textures, subtle color transitions) prone to loss during upsampling. Ultimately, DwDySample inherits the learnable properties of DySample and optimizes semantic adaptability through dynamic sampling. With the integration of DSConv and residual connections, it effectively overcomes the limitations of traditional upsampling, demonstrating superior efficiency, feature expressiveness, and scene adaptability for tomato ripeness detection.
The DwDySample dynamic upsampling process is illustrated in Figure 8a. Specifically, given an input feature map X of size C × H 1 × W 1 and a specified scale factor s ( s = 0.25 ), the module first employs DSConv to generate a set of context-dependent resampling offsets O for each spatial location. This design enables independent spatial modeling for each channel. Since the heterogeneous visual features of greenhouse tomatoes—such as ripening color transitions and irregular physical boundaries—are typically distributed across different channels, this channel-wise processing effectively decouples these heterogeneous cues and produces more targeted and adaptive sampling displacements. The corresponding formulas are as follows.
O = 0.25 linear ( X )
Subsequently, the offset O is reshaped into dimensions of 2 g × s H 2 × s W 2 via a pixel shuffle operation, where 2g denotes the coordinate displacements in both the x and y directions, and s represents the upsampling scale factor. The sampling set S is collaboratively constructed by integrating the static sampling grid g , the learned offsets, and the intrinsic content of the input feature map. This design liberates the sampling points from a rigid uniform grid, allowing them to be dynamically distributed based on the intensity of maturity-related features within the current feature map. Specifically, in regions exhibiting critical maturity transitions, the sampling points are adaptively densified to preserve finer details; conversely, in homogeneous background regions, the sampling points become sparse, thereby minimizing redundant computations. The computational formulation is presented as follows:
S = g + O + X
Finally, using the grid_sample function and the sampling set S , an oversampled feature map X of size C × s H × s W can be generated, as shown in Equation (12).
X = gridsample ( X , S )
The DwDySample module effectively mitigates the blurring and artifacts typically induced by conventional upsampling during tomato ripeness detection. This ensures that the maturity-related color transitions and occlusion boundaries of the fruit remain distinctly resolvable within the upsampled feature maps, thereby providing high-quality feature representations for subsequent precise ripeness classification in occluded and densely overlapping scenarios.

2.5.6. Wise-SIoU Loss Function

While RT-DETR adopts GIoU [36] as its default bounding box loss function, it exhibits limitations in accurately capturing the circular boundaries of tomatoes. Furthermore, it is susceptible to redundant background interference in low-quality greenhouse images—such as green tomatoes under backlighting or obscured by leaves. To simultaneously achieve high-precision bounding box fitting and strong robustness in complex scenarios, this study proposes a novel Wise-SIoU loss function by synergizing the precise geometric regression capabilities of SIoU with the robust performance of Wise-IoUv3.
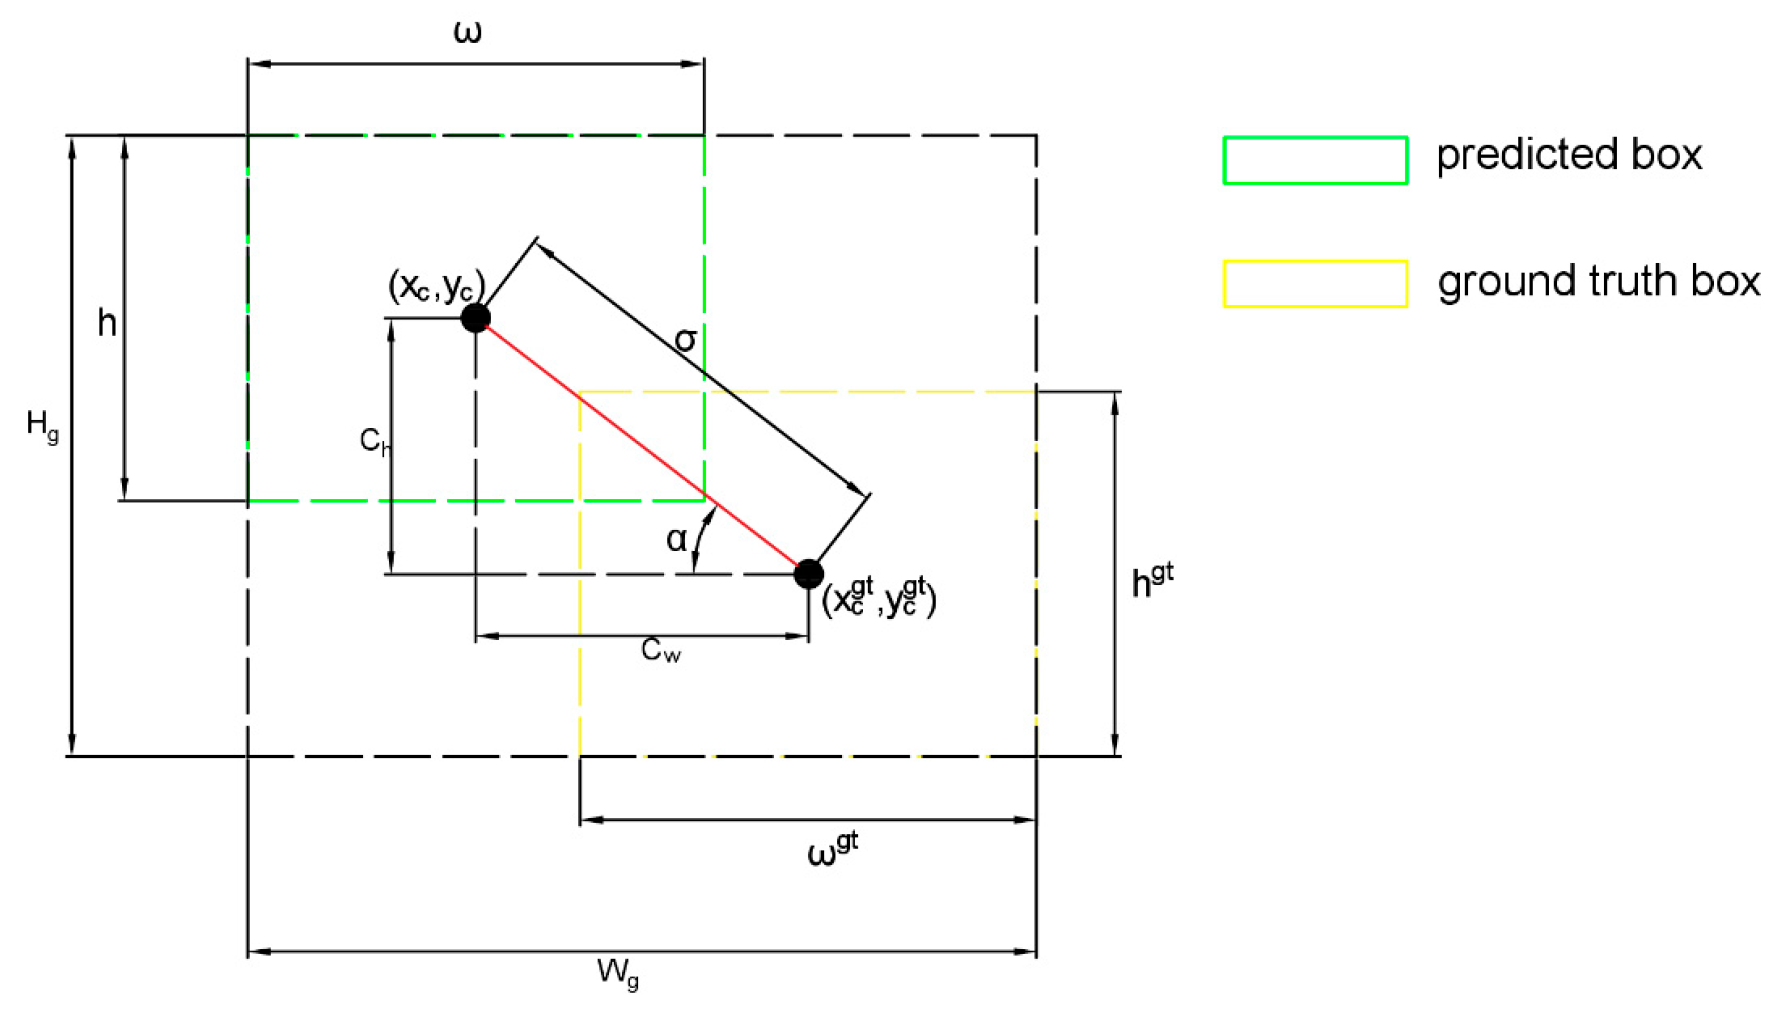
Specifically, the SIoU [37] loss introduces a three-fold penalty mechanism comprising angle, distance, and shape costs. This effectively addresses the inability of GIoU to accurately delineate circular contours, thereby significantly enhancing boundary fitting accuracy, as illustrated in Figure 9. The SIoU loss is expressed as:
x = c h σ = sin ( α ) Λ = 1 2 sin 2 arcsin ( x ) π 4 λ = 2 Λ ,   ρ x = C w W g 2 ,   ρ y = C g H g 2 Δ = t = x , y ( 1 e λ ρ t ) Ω = i = k ( 1 e ω t ) υ ,   ω w = ω ω gt max ( ω , ω gt ) ,   ω h = h h gt max ( h , h gt ) L S I o U = 1 IoU + Δ + Ω 2
where c w and c h represent the distances between the center points of the predicted bounding box and the ground truth box along the x -direction and y -direction respectively; σ denotes the Euclidean distance between these center points; and α indicates the angle between the line connecting the two center points and the x -direction. The parameter v defines the shape cost. Because its optimal experimental value approaches 4, v is empirically set to 4 in this study. Additionally, W g and H g denote the width and height of the minimum enclosing box covering both the predicted and ground truth boxes, respectively. The variables ω and h represent the width and height of the predicted box, whereas ω g t and h g t denote the width and height of the ground truth box.
Although SIoU improves bounding box regression accuracy for circular targets, its uniform treatment of all samples proves inadequate when addressing low-quality samples. Therefore, the dynamic non-monotonic focusing mechanism of Wise-IoUv3 [38] is incorporated. This mechanism allocates gradient gains rationally, enhancing adaptability to occlusions while reducing background interference. The core formulation utilizes an outlier degree β and a non-monotonic focus coefficient γ :
L loU = 1 IoU R WIoU = exp σ 2 W g 2 + H g 2 L WIoU   v 1 = L IoU R WIoU β = L IoU * L ¯ IoU 0 , + L WIoU   v 3 = γ L WIoU   v 1 , γ = β δ τ β δ
where δ and τ denote hyperparameters; L IoU * represents the monotonic focus coefficient with L ¯ IoU as its mean value. A smaller outlier degree β indicates higher predicted box quality.
Ultimately, to construct the Wise-SIoU loss, a multiplicative fusion strategy is employed. This enables the non-monotonic focusing coefficient γ to act directly upon the SIoU loss, adaptively adjusting the attention intensity toward geometric regression targets based on β . This design ensures stable model convergence for clear samples and intensifies learning for hard samples. The final Wise-SIoU loss is calculated as:
L Wise-SIoU = γ R WIoU L SIoU

3. Experiments and Results

3.1. Detection Results Under Different Lightweight Backbone Networks

Lightweight backbones are essential for minimizing parameters and computational complexity, enabling efficient deployment on resource-constrained devices. To evaluate the proposed CAEfficientViT, comparative experiments were conducted against four representative lightweight backbones: RepViT-M0.9, StarNet-S2, MobileNetV4-S, and EfficientViT-M0. As summarized in Table 6, alternative networks generally exhibit larger parameter sizes alongside lower overall detection accuracy. Although MobileNetV4-S achieves the fastest inference speed (131 FPS), its mAP@0.5 drops to 87.6%. Conversely, models like StarNet-S2 suffer from significantly lower inference speeds (80 FPS). Comprehensive comparisons demonstrate that CAEfficientViT achieves an optimal balance, delivering the lowest parameter count (10.4 M) while maximizing mean average precision (mAP@0.5 of 88.7%) and maintaining a highly competitive inference speed (120 FPS).

3.2. Comparative Experiment of Different Attention Mechanisms

To validate the proposed FEAA mechanism for tomato ripeness classification, comparative experiments were conducted against the Multi-Head, Pola, AdditiveTokenMixer, and EfficientAdditive attention mechanisms within the RT-DETR framework (Table 7). As the results indicate, most evaluated attention modules exhibit comparable parameter sizes. However, while alternatives such as Pola and AdditiveTokenMixer degrade mean average precision compared to the baseline, the proposed FEAA maintains an identical parameter count (19.9 M) to EfficientAdditive yet achieves the highest precision, recall, and mAP@0.5.

3.3. Detection Results Under Different Upsampling Operators

To investigate the impact of various upsampling operators on GFLOPs, parameters, and mAP@0.5, comparative experiments were conducted evaluating CARAFE, FADE, IndexNet, DySample, and the proposed DwDySample. Maintaining the baseline architecture constant, each operator was independently integrated and evaluated. The quantitative results are summarized in Table 8. As demonstrated, the proposed DwDySample achieves the highest mAP@0.5 of 89.4% while maintaining the lowest computational complexity (57.0 G) and parameter count (19.9 M). It matches the extreme lightweight efficiency of the standard DySample while significantly outperforming it in feature reconstruction accuracy.

3.4. Ablation Study

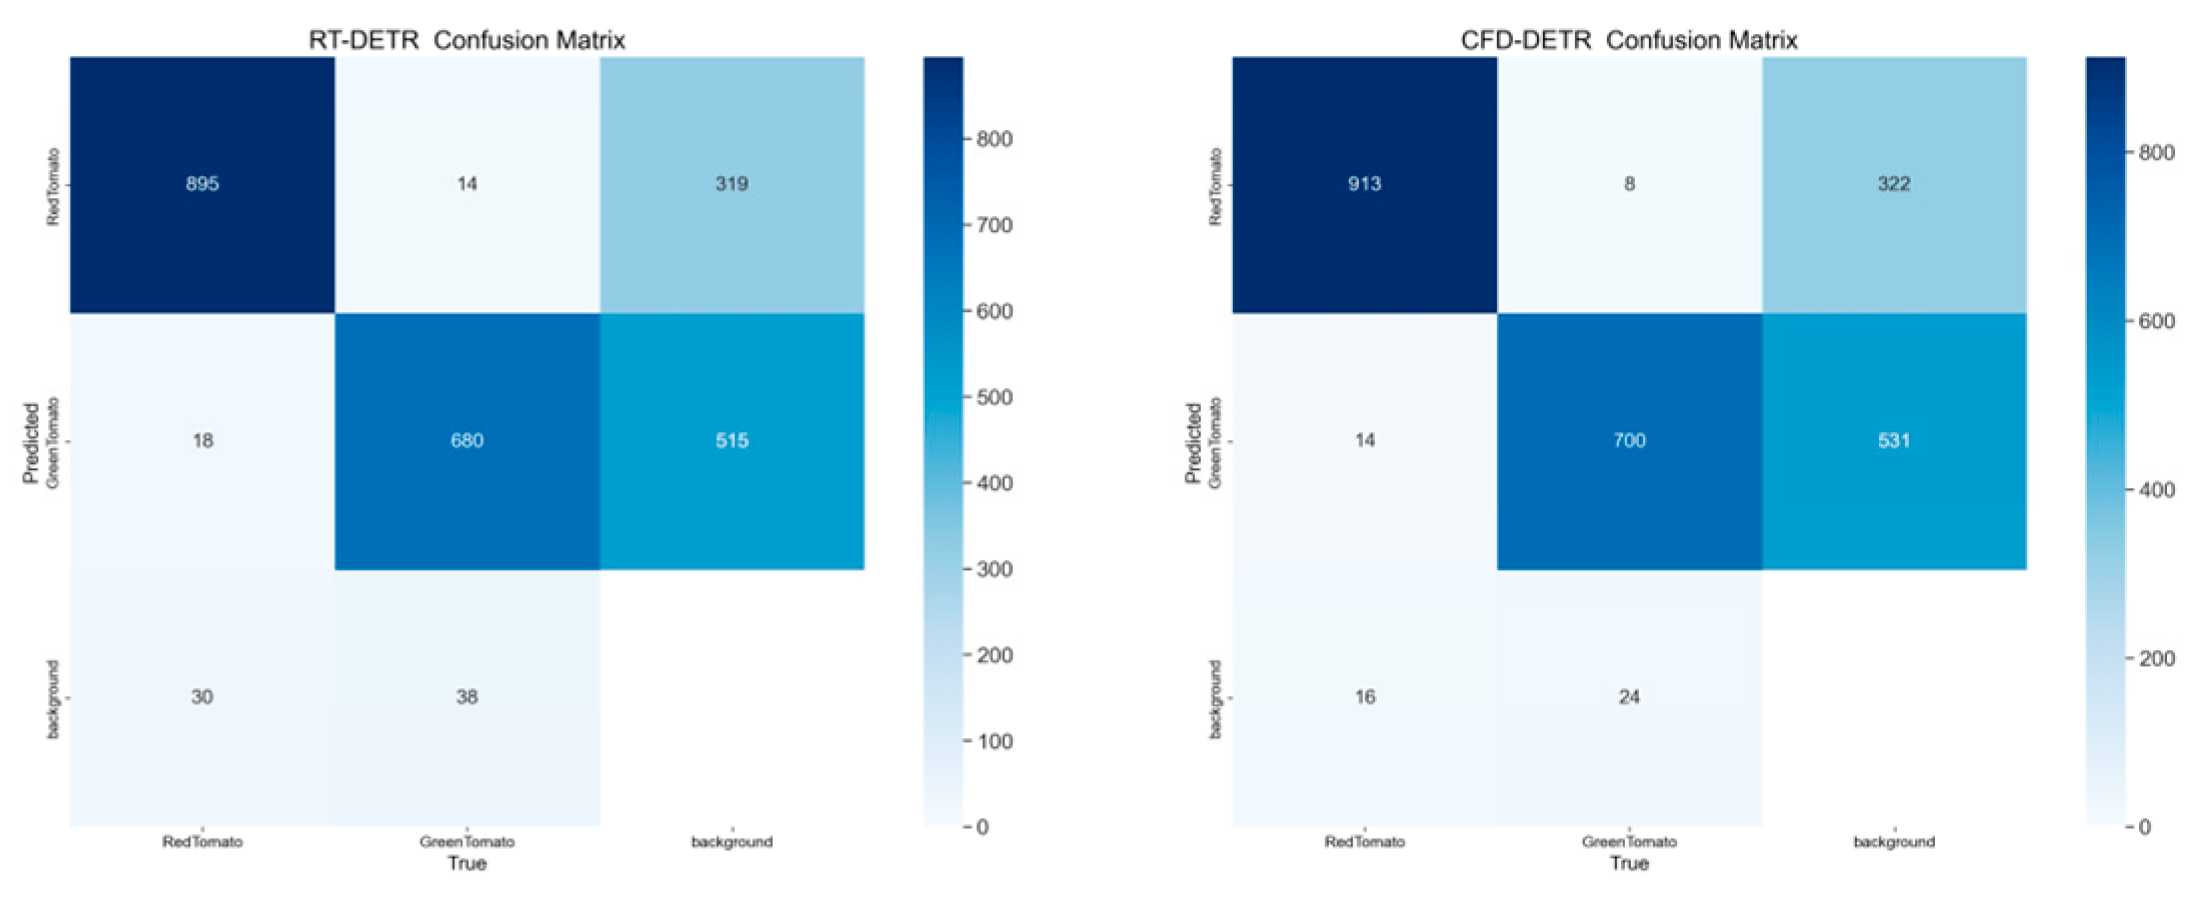
To validate the effectiveness of the proposed architectural enhancements, ablation experiments were conducted to analyze the individual and synergistic impacts of the key components (CAEfficientViT, FEAA, DwDySample, and Wise-SIoU) relative to the baseline RT-DETR model. The quantitative results are presented in Table 9. Incorporating the CAEfficientViT backbone into the original model increases precision (P) and mAP@0.5 by 1.0 and 0.6 percentage points, respectively, while significantly reducing the parameter count by 9.5 M and computational complexity by 30.2 G. This confirms substantial resource reductions while maintaining robust detection performance, rendering it highly suitable for resource-constrained agricultural settings. Integrating solely the FEAA module boosts precision, recall (R), and mAP@0.5 by 2.5, 0.3, and 2.2 percentage points, respectively, compared to the baseline, demonstrating an enhanced capability to capture fine-grained ripeness features. Employing only the DwDySample operator raises P, R, and mAP@0.5 by 1.3, 0.3, and 1.3 percentage points, respectively, optimizing feature reconstruction during upsampling with a negligible impact on computational complexity and parameter size. Furthermore, embedding the Wise-SIoU maintains constant parameters and computation levels while increasing P and mAP@0.5 by 2.9 and 1.3 percentage points, respectively. This validates its efficacy in flexible gradient allocation, intensifying the focus on low- and average-quality samples. Finally, integrating all modules (Model-7) yields a comprehensive enhancement: P, R, and mAP@0.5 increase by 2.5, 2.6, and 2.1 percentage points, respectively, over the baseline model (as visualized in the confusion matrices in Figure 10). Simultaneously, the computational load and parameter count significantly decrease by 29.9 G and 9.4 M, conclusively demonstrating that the model’s real-time detection performance and lightweight deployment potential are fully optimized.

3.5. Model Comparison Experiment

To ensure the fairness and scientific rigor of the comparative analysis, we adopted the optimal training configurations officially recommended by the authors of each baseline model, guaranteeing that every architecture achieves its peak performance. For instance, the YOLO series necessitates a longer training schedule (300 epochs) and the SGD optimizer for full convergence. In contrast, Transformer-based architectures (including RT-DETR and our proposed CFD-DETR) converge more efficiently within 100 epochs using the AdamW optimizer. Furthermore, to establish a fair and reproducible evaluation baseline, all comparative models were initialized with their officially designated pre-trained weights, without any custom modifications. The detailed training configurations are summarized in Table 10.
To comprehensively validate the superiority of the proposed model for tomato detection, comparative experiments were conducted against Faster R-CNN and mainstream YOLO series architectures. All models were evaluated on the identical dataset, with specific quantitative results detailed in Table 11. As indicated in Table 9, the proposed model outperforms all other evaluated networks, achieving the highest precision, recall, and mAP@0.5 at 88.2%, 85.9%, and 90.2%, respectively. Furthermore, while delivering state-of-the-art detection accuracy, the proposed model requires the fewest parameters (10.5 M) and the lowest computational complexity (27.0 G). Although its model size (21.3 M) is marginally larger than that of YOLOv10s, it achieves a substantial 73.6% reduction compared to the baseline RTDETR-R18 (80.7 M). Comprehensive comparisons demonstrate that the proposed architecture successfully achieves a superior balance between high-precision detection and lightweight optimization, rendering it highly suitable for deployment in resource-constrained agricultural settings.

3.6. Visual Analytics

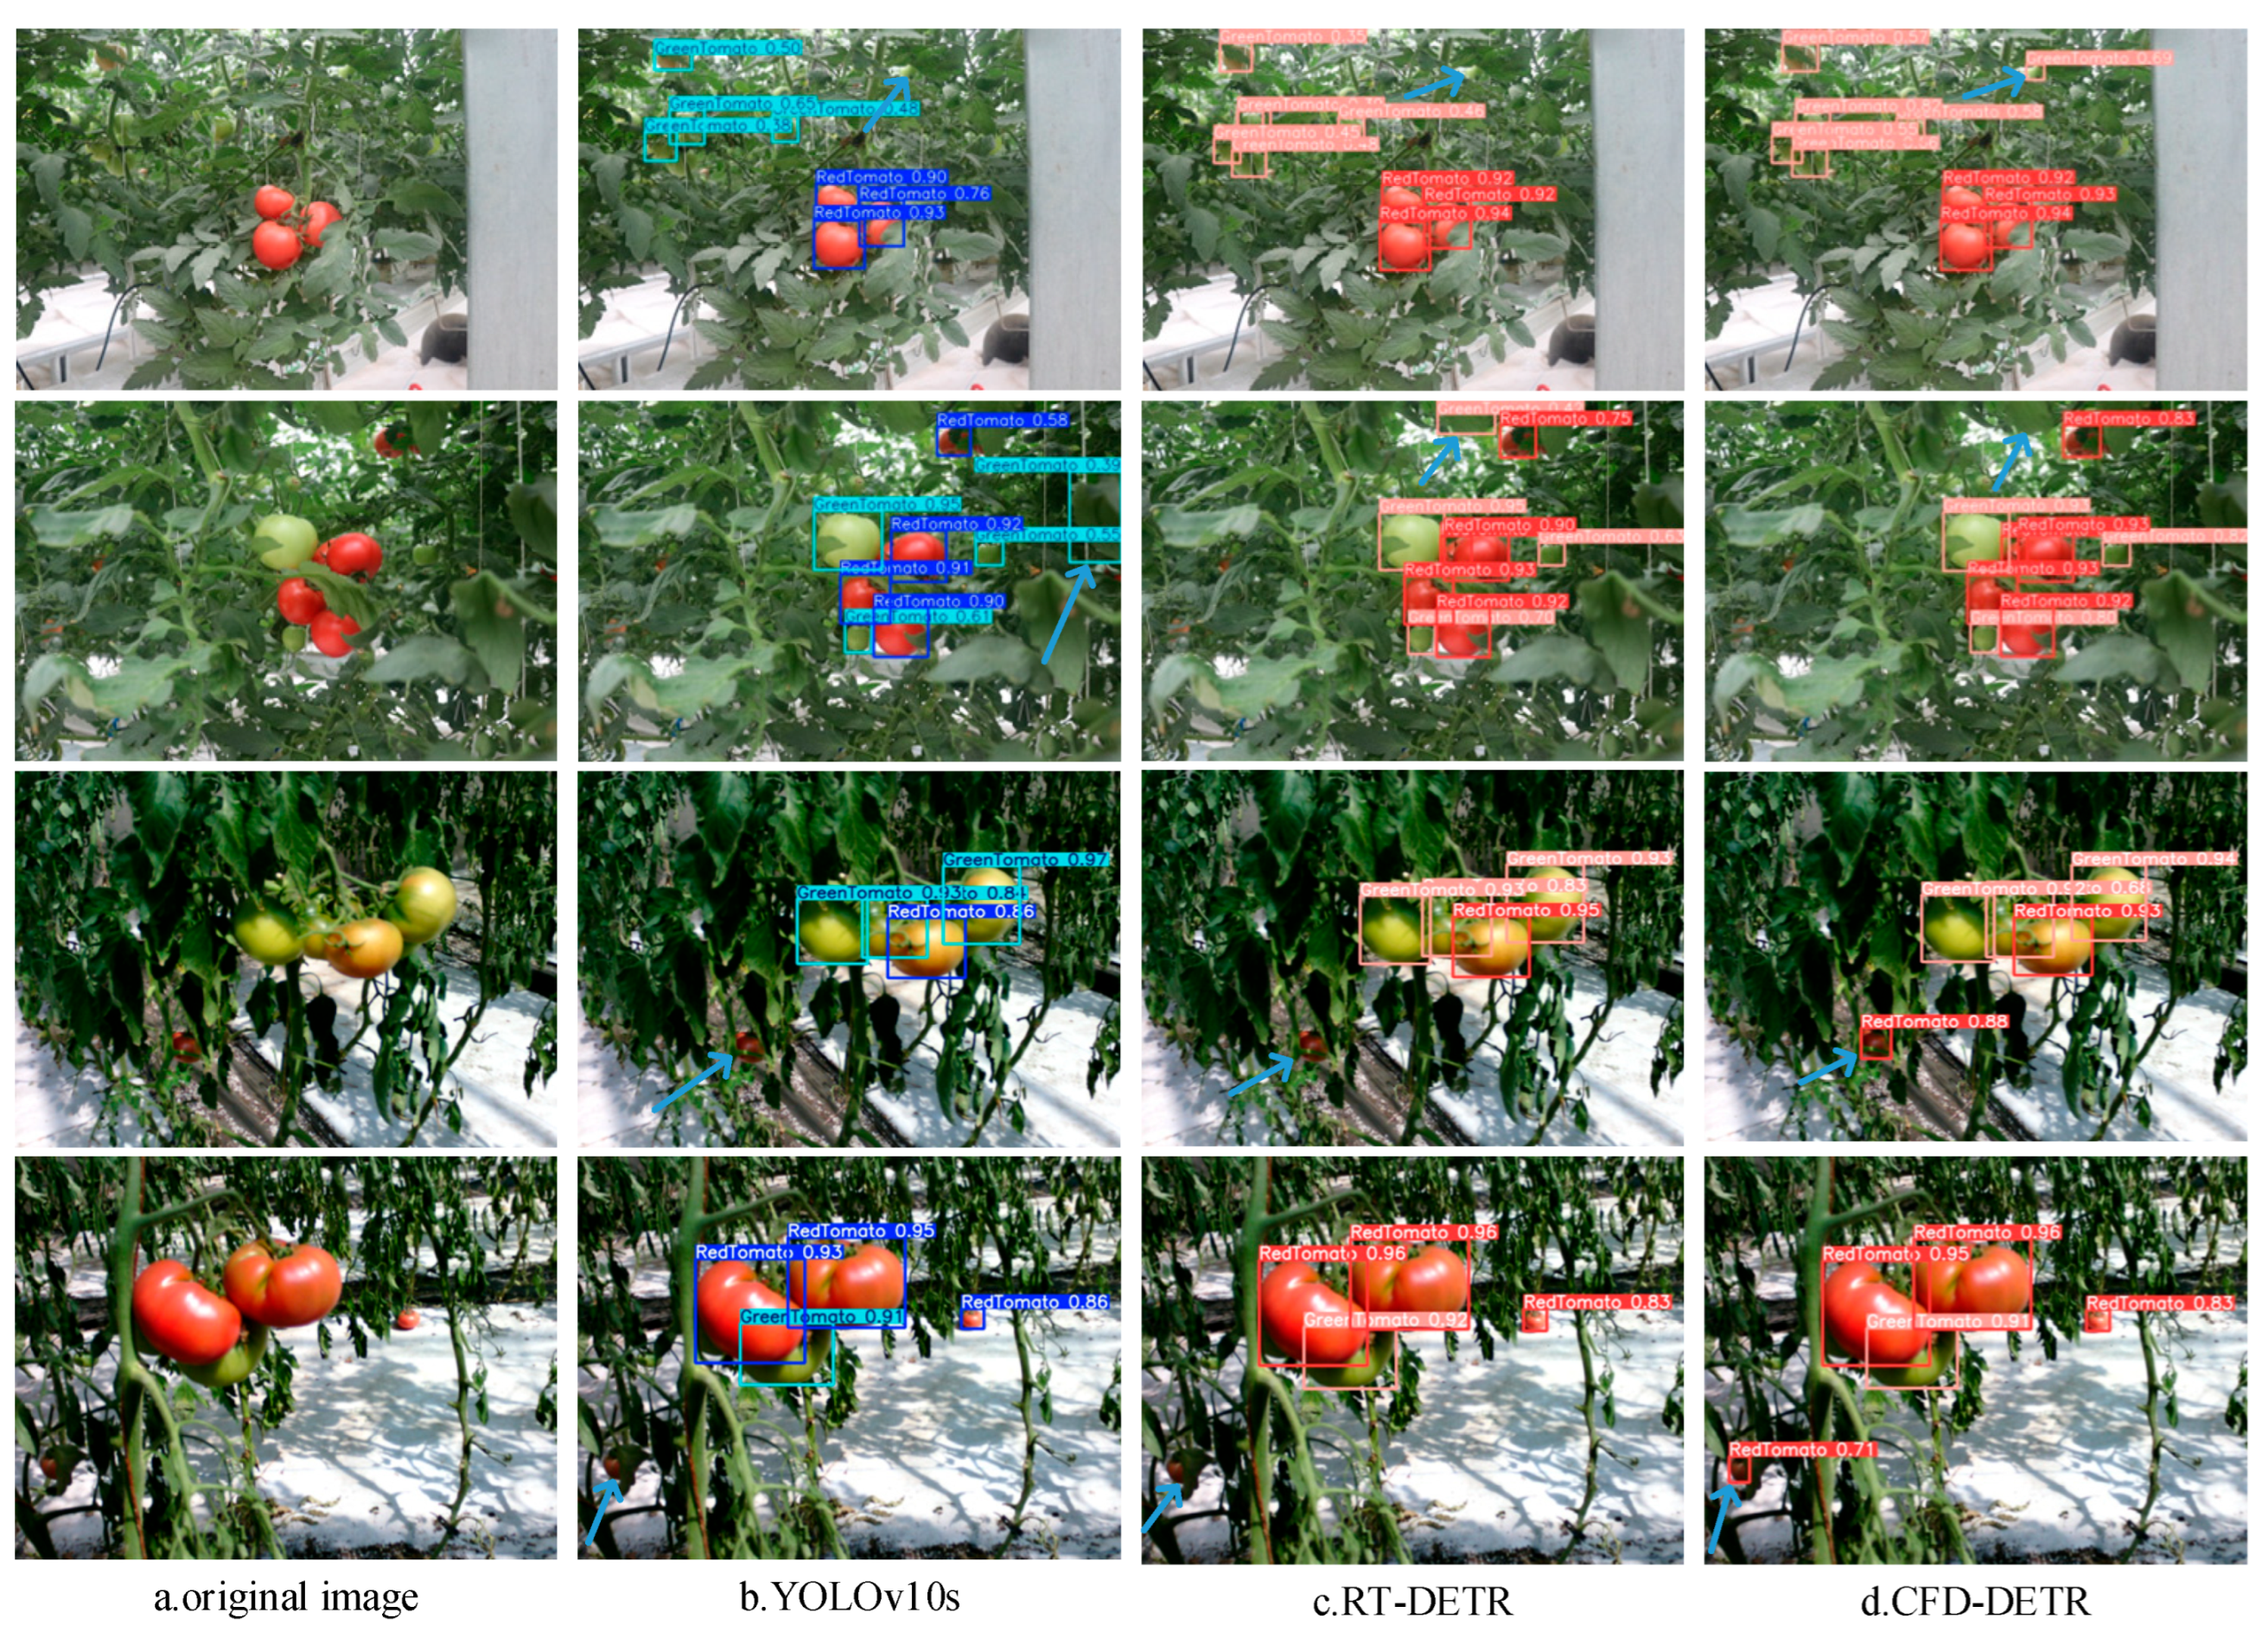
To visually assess the effectiveness of the proposed CFD-DETR model, the detection results of various architectures were qualitatively compared. As illustrated in Figure 11, representative images featuring dense fruit clusters and severe foliage occlusion were selected from the test set for this analysis. The visualizations demonstrate that the CFD-DETR model achieves superior localization accuracy and yields higher confidence scores than both the baseline RT-DETR and YOLOv10s. Notably, the baseline RT-DETR already outperforms YOLOv10s in terms of detection confidence under such complex scenarios, corroborating the structural advantage of the DETR architecture in handling occlusion and overlapping. Specifically, as observed in the first row, both RT-DETR and YOLOv10s suffer from prominent missed detections. Furthermore, the second row reveals that these models incorrectly classify background foliage as immature tomatoes. In the third and fourth rows, neither comparison architecture successfully identifies mature tomatoes severely obscured by leaves. In contrast, the proposed CFD-DETR not only accurately recognizes all heavily occluded targets but also maintains robust confidence scores. This qualitative evaluation conclusively demonstrates the model’s optimized performance in mitigating both missed and false detections within complex agricultural scenarios.

3.7. Cross-Dataset Generalization Analysis

To rigorously evaluate the generalization capabilities of the proposed CFD-DETR model, two public tomato ripeness datasets from the Kaggle platform—Laboro Tomato [39] and the Riped and Unriped Tomato Dataset (RaUTD) [40]—were selected for cross-dataset validation, in addition to the primary greenhouse dataset constructed in this study. By comparing the detection accuracy of CFD-DETR against the baseline RT-DETR across these diverse datasets, the model’s robustness and adaptability to various shooting environments, tomato varieties, and lighting conditions are comprehensively assessed. As detailed in Table 12, the proposed model significantly outperforms the baseline on the Laboro Tomato dataset, with mAP@0.5 and mAP@0.5:0.95 increasing by 3.4 and 4.7 percentage points, respectively. Similarly, on the RaUTD dataset, improvements of 1.3 and 2.0 percentage points are observed for mAP@0.5 and mAP@0.5:0.95, respectively. These gains are consistent with the performance on the primary greenhouse dataset, which exhibits corresponding increases of 2.1 and 1.6 percentage points. These consistent accuracy improvements across disparate datasets conclusively demonstrate that the CFD-DETR architecture possesses excellent cross-domain generalization capabilities, ensuring reliable tomato ripeness detection in highly variable agricultural environments.

4. Discussion

4.1. Potential and Limitations of Edge Deployment

Although the core motivation of this study is the lightweight deployment for agricultural edge devices, physical validation on mainstream edge hardware was not conducted due to current equipment limitations. However, to objectively evaluate the model’s application potential in compute-constrained environments, pure CPU inference experiments were conducted to simulate edge computing scenarios. Under the exact same CPU environment, the baseline RT-DETR model exhibited an inference latency of 618.80 ms per image (1.62 FPS). In contrast, the latency of the proposed CFD-DETR model was significantly reduced to 489.20 ms per image (2.04 FPS), achieving an approximately 26% improvement in inference speed. Therefore, a visual inference delay of less than 0.5 s is entirely acceptable for practical robotic harvesting tasks. These CPU test results effectively demonstrate that the architectural optimizations of CFD-DETR drastically reduce computational overhead, proving its strong potential for future deployment on resource-limited agricultural robots.

4.2. Failure Cases Analysis Under Extreme Conditions

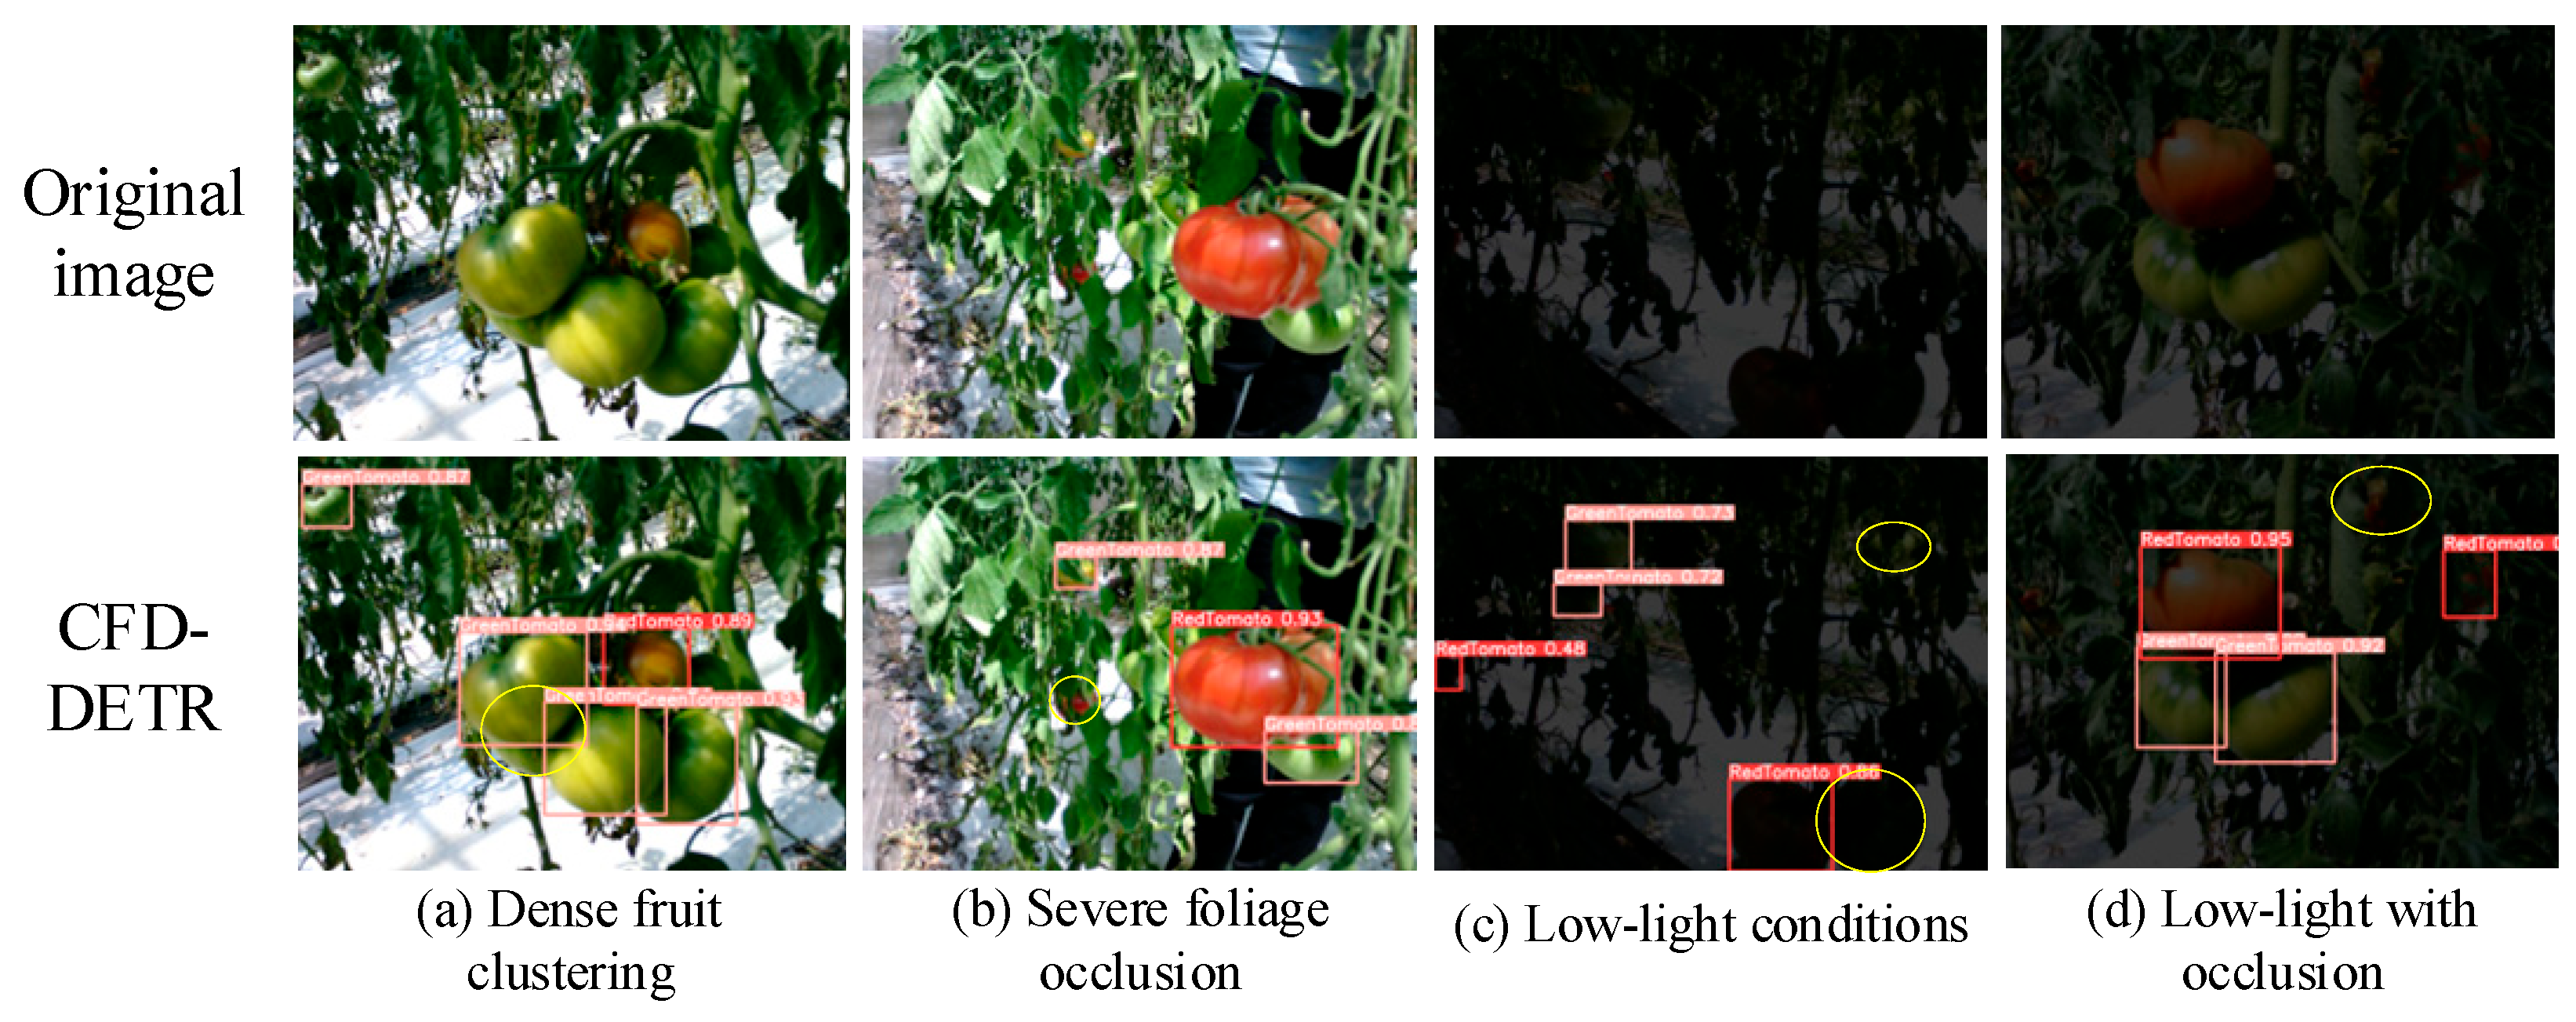
Figure 12 illustrates typical failure cases of the CFD-DETR model under extreme greenhouse conditions, such as poor illumination and severe occlusion. An in-depth analysis of these cases is essential to identify the practical bottlenecks for real-world agricultural deployment. Regarding severe overlap and foliage occlusion, as shown in Figure 12a, when fruits of the same color category densely overlap, the spatial continuity and edge contours of the targets are significantly disrupted. This makes it difficult for the self-attention mechanism to accurately delineate instance boundaries within complex, homogenized backgrounds, leading to missed detections. Furthermore, as depicted in Figure 12b, even for mature red tomatoes with distinct color contrast, high-degree obstruction by branches and leaves causes severe fragmentation of morphological features. This prevents the model from aggregating complete global contextual information, which similarly results in false negatives. In terms of extreme illumination degradation, as shown in Figure 12c,d, tomato surface color features and texture details undergo significant optical degradation under severe backlight or simulated nighttime low-light conditions. Since the ripeness classification mechanism proposed in this study relies heavily on visual color features, this light-induced feature attenuation leads to insufficient deep semantic information extracted by the Feature Pyramid Network, significantly limiting the model’s recall capability. To address these limitations, future work will explore multi-modal feature fusion strategies to compensate for the deficiencies of single RGB visual features in extreme agricultural environments, thereby further enhancing the robustness and practical value of the model.

5. Conclusions

To overcome the critical bottleneck of deploying high-precision vision detection models on resource-constrained agricultural edge devices, this study proposes CFD-DETR, a lightweight tomato ripeness detection model tailored for real-world greenhouse environments. To address the three core challenges of dynamic light interference, severe foliage occlusion, and dense fruit overlapping, CFD-DETR introduces four key innovations: (1) the lightweight CAEfficientViT backbone network, which enhances tomato color feature extraction capabilities to efficiently capture fine-grained ripeness traits; (2) the FEAA mechanism, which utilizes global weighted attention scores to direct the model’s focus toward critical ripeness regions while reducing computational overhead; (3) the DwDySample overcomes the blurring and artifacts caused by traditional upsampling, preserving maturity-related color transitions and occlusion boundary information; and (4) the Wise-SIoU loss function, which integrates Wise-IoUv3 and SIoU to enhance bounding box fitting capabilities for low-quality samples and improve robustness in complex scenarios. Experimental results demonstrate that, compared to the RT-DETR baseline, CFD-DETR achieves improvements of 2.5%, 2.6%, and 2.1% in Precision, Recall, and mAP@0.5, respectively, while reducing GFLOPs and parameter count by 29.9 G and 9.4 M, respectively. On the public LaboroTomato and RauTD datasets, mAP@0.5 and mAP@0.5:0.95 are increased by 3.4% and 1.3%, respectively, confirming its strong generalization capabilities. In summary, CFD-DETR provides a highly deployable algorithmic foundation for automated robotic harvesting. Future research will focus on optimizing robustness under extreme conditions and exploring physical deployment and real-time hardware acceleration on harvesting robots.


Author Contributions

Conceptualization, D.W.; methodology, D.W.; validation, G.Y. and Y.W.; formal analysis, Z.L.; investigation, Z.L.; writing—original draft preparation, D.W.; writing—review and editing, G.Y.; visualization, D.W. and Z.L.; supervision, Z.L. and Y.W. All authors have read and agreed to the published version of the manuscript.

Funding

This research received no external funding.

Data Availability Statement

The data presented in this study are openly available in https://github.com/Daric-Weng/CFD-DETR-Dataset (accessed on 30 April 2026).

Acknowledgments

We sincerely thank the reviewers for their constructive comments, which have significantly contributed to the overall improvement of this manuscript. Furthermore, we extend our gratitude to the editorial board for their assistance and patience throughout the peer-review process. During the preparation of this manuscript, the authors utilized Gemini strictly for English language editing and polishing.

Conflicts of Interest

The authors declare no conflicts of interest.

References

  1. Costa, J.M.; Heuvelink, E. Introduction: The tomato crop and industry. In Tomatoes; Heuvelink, E., Ed.; CABI Publishing: Wallingford, UK, 2005; pp. 1–19. [Google Scholar] [CrossRef]
  2. Vu, Q.; Ronzhin, A. Models and algorithms for design robotic gripper for agricultural products. C. R. Acad. Bulg. Sci. 2020, 73, 103–110. [Google Scholar] [CrossRef]
  3. Ali, H.; Lali, M.I.; Nawaz, M.Z.; Sharif, M.; Saleem, B.A. Symptom based automated detection of citrus diseases using color histogram and textural descriptors. Comput. Electron. Agric. 2017, 138, 92–104. [Google Scholar] [CrossRef]
  4. Vallone, S.; Sivertsen, H.; Anthon, G.E.; Barrett, D.M.; Mitcham, E.J.; Ebeler, S.E.; Zakharov, F. An integrated approach for flavour quality evaluation in muskmelon (Cucumis melo L. reticulatus group) during ripening. Food Chem. 2013, 139, 171–183. [Google Scholar] [CrossRef]
  5. Tian, H.; Wang, T.; Liu, Y.; Qiao, X.; Li, Y. Computer vision technology in agricultural automation—A review. Inf. Process. Agric. 2020, 7, 1–19. [Google Scholar] [CrossRef]
  6. Wiesner-Hanks, T.; Wu, H.; Stewart, E.; DeChant, C.; Kaczmar, N.; Lipson, H.; Gore, M.A.; Nelson, R.J. Millimeter-level plant disease detection from aerial photographs via deep learning and crowdsourced data. Front. Plant Sci. 2019, 10, 1550. [Google Scholar] [CrossRef]
  7. Bhargava, A.; Bansal, A.; Goyal, V. Machine learning-based detection and sorting of multiple vegetables and fruits. Food Anal. Methods 2022, 15, 228–242. [Google Scholar] [CrossRef]
  8. Linker, R.; Cohen, O.; Naor, A. Determination of the number of green apples in RGB images recorded in orchards. Comput. Electron. Agric. 2012, 81, 45–57. [Google Scholar] [CrossRef]
  9. Liu, G.; Mao, S.; Kim, J.H. A mature-tomato detection algorithm using machine learning and color analysis. Sensors 2019, 19, 2023. [Google Scholar] [CrossRef] [PubMed]
  10. Ko, K.; Jang, I.; Choi, J.H.; Lim, J.H.; Lee, D.U. Stochastic decision fusion of convolutional neural networks for tomato ripeness detection in agricultural sorting systems. Sensors 2021, 21, 917. [Google Scholar] [CrossRef] [PubMed]
  11. Ni, L.; Ye, F.; Cui, X.; Peng, X.; Song, S.; Luo, W. Comparative Study of Lightweight Deep Learning Models for Greenhouse Tomato Leaf Disease Classification Using the Public TLID Dataset. Digit. Intell. Agric. 2026, 2, 45–53. [Google Scholar] [CrossRef]
  12. Redmon, J.; Divvala, S.; Girshick, R.; Farhadi, A. You only look once: Unified, real-time object detection. In Proceedings of the 2016 IEEE Conference on Computer Vision and Pattern Recognition (CVPR), Las Vegas, NV, USA, 27–30 June 2016; pp. 779–788. [Google Scholar] [CrossRef]
  13. Liu, G.; Nouaze, J.C.; Touko Mbouembe, P.L.; Kim, J.H. YOLO-Tomato: A robust algorithm for tomato detection based on YOLOv3. Sensors 2020, 20, 2145. [Google Scholar] [CrossRef]
  14. Gao, G.; Shuai, C.; Wang, S.; Ding, T. Using improved YOLO V5s to recognize tomatoes in a continuous working environment. Signal Image Video Process. 2024, 18, 4019–4028. [Google Scholar] [CrossRef]
  15. Yang, Z.; Li, Y.; Han, Q.; Wang, H.; Li, C.; Wu, Z. A method for tomato ripeness recognition and detection based on an improved YOLOv8 model. Horticulturae 2024, 10, 15. [Google Scholar] [CrossRef]
  16. Vaswani, A.; Shazeer, N.; Parmar, N.; Uszkoreit, J.; Jones, L.; Gomez, A.N.; Kaiser, L.; Polosukhin, I. Attention is all you need. Adv. Neural Inf. Process. Syst. 2017, 30, 5998–6008. [Google Scholar]
  17. Nahak, P.; Pratihar, D.K.; Deb, A.K. Tomato maturity stage prediction based on vision transformer and deep convolution neural networks. Int. J. Hybrid Intell. Syst. 2025, 21, 61–78. [Google Scholar] [CrossRef]
  18. Carion, N.; Massa, F.; Synnaeve, G.; Usunier, N.; Kirillov, A.; Zagoruyko, S. End-to-end object detection with transformers. In Proceedings of the 16th European Conference on Computer Vision (ECCV), Glasgow, UK, 23–28 August 2020; pp. 213–229. [Google Scholar] [CrossRef]
  19. Liu, Q.; Meng, H.; Zhao, R.; Ma, X.; Zhang, T.; Jia, W. Green apple detector based on optimized deformable detection transformer. Agriculture 2025, 15, 75. [Google Scholar] [CrossRef]
  20. Yao, J.; Zhou, J.; Nie, Y.; Xue, J.; Lin, K.; Tan, L. Edge-Guided DETR Model for Intelligent Sensing of Tomato Ripeness Under Complex Environments. Mathematics 2025, 13, 2095. [Google Scholar] [CrossRef]
  21. Gao, M.; Yang, S. CT-DETR and ReID-guided multi-target tracking algorithm in complex scenes. ICCK Trans. Emerg. Top. Artif. Intell. 2024, 1, 44–57. [Google Scholar] [CrossRef]
  22. Zhao, Y.; Lv, W.; Xu, S.; Wei, J.; Wang, G.; Dang, Q.; Liu, Y.; Chen, J. DETRs beat YOLOs on real-time object detection. In Proceedings of the 2024 IEEE/CVF Conference on Computer Vision and Pattern Recognition (CVPR), Seattle, WA, USA, 17–21 June 2024; pp. 16965–16974. [Google Scholar]
  23. Zhao, Z.; Chen, S.; Ge, Y.; Wang, J.; Li, Y.; Zhang, X. RT-DETR-Tomato: Tomato target detection algorithm based on improved RT-DETR for agricultural safety production. Appl. Sci. 2024, 14, 6287. [Google Scholar] [CrossRef]
  24. Gu, Z.; Ma, X.; Guan, H.; Jiang, Q.; Deng, H.; Wen, B.; Zhu, T.; Wu, X. Tomato fruit detection and phenotype calculation method based on the improved RTDETR model. Comput. Electron. Agric. 2024, 227, 109524. [Google Scholar] [CrossRef]
  25. Wang, S. Real-time object detection using a lightweight two-stage detection network with efficient data representation. ICCK Trans. Emerg. Top. Artif. Intell. 2024, 1, 17–30. [Google Scholar] [CrossRef]
  26. Gao, X.; Ding, J.; Bie, M.; Yu, H.; Shen, Y.; Zhang, R.; Xi, X. YOLOv8n-FDE: An Efficient and Lightweight Model for Tomato Maturity Detection. Agronomy 2025, 15, 1899. [Google Scholar] [CrossRef]
  27. Song, D.; Liu, P.; Zhu, Y.; Li, T.; Zhang, K. FGS-YOLOv8s-seg: A Lightweight and Efficient Instance Segmentation Model for Detecting Tomato Maturity Levels in Greenhouse Environments. Agronomy 2025, 15, 1687. [Google Scholar] [CrossRef]
  28. Ma, Z.; Zhang, H.; Yun, Y.; Yang, Z.; An, X.; Ma, D.; Liu, J.; Ma, H. TMSDDET: A Lightweight Model for Tomato Maturity and Defect Detection on Edge Devices. Appl. Eng. Agric. 2026, 42, 193–207. [Google Scholar] [CrossRef]
  29. Wang, S.; Jiang, H.; Yang, J.; Ma, X.; Chen, J.; Li, Z.; Tang, X. Lightweight tomato ripeness detection algorithm based on the improved RT-DETR. Front. Plant Sci. 2024, 15, 1415297. [Google Scholar] [CrossRef]
  30. Liu, F.; Liu, Y.K.; Lin, S.; Guo, W.; Xu, F.; Zhang, B. Fast recognition method for tomatoes under complex environments based on improved YOLO. Trans. Chin. Soc. Agric. Mach. 2020, 51, 229–237. (In Chinese) [Google Scholar] [CrossRef]
  31. USDA. United States Standards for Grades of Fresh Tomatoes; U.S. Department of Agriculture: Washington, DC, USA, 1991.
  32. Mehta, S.; Rastegari, M. Separable self-attention for mobile vision transformers. arXiv 2022, arXiv:2206.02680. [Google Scholar] [CrossRef]
  33. Shaker, A.; Maaz, M.; Rasheed, H.; Khan, S.; Yang, M.H.; Khan, F.S. SwiftFormer: Efficient additive attention for transformer-based real-time mobile vision applications. In Proceedings of the 2023 IEEE/CVF International Conference on Computer Vision (ICCV), Paris, France, 2–6 October 2023; pp. 17425–17436. [Google Scholar]
  34. Bahdanau, D.; Cho, K.; Bengio, Y. Neural machine translation by jointly learning to align and translate. arXiv 2014, arXiv:1409.0473. [Google Scholar]
  35. Liu, W.; Lu, H.; Fu, H.; Cao, Z. Learning to upsample by learning to sample. In Proceedings of the 2023 IEEE/CVF International Conference on Computer Vision (ICCV), Paris, France, 2–6 October 2023; pp. 6027–6037. [Google Scholar]
  36. Rezatofighi, H.; Tsoi, N.; Gwak, J.; Sadeghian, A.; Reid, I.; Savarese, S. Generalized intersection over union: A metric and a loss for bounding box regression. In Proceedings of the 2019 IEEE/CVF Conference on Computer Vision and Pattern Recognition (CVPR), Long Beach, CA, USA, 15–20 June 2019; pp. 658–666. [Google Scholar] [CrossRef]
  37. Gevorgyan, Z. SIoU loss: More powerful learning for bounding box regression. arXiv 2022, arXiv:2205.12740. [Google Scholar] [CrossRef]
  38. Tong, Z.; Chen, Y.; Xu, Z.; Yu, R. Wise-IoU: Bounding box regression loss with dynamic focusing mechanism. arXiv 2023, arXiv:2301.10051. [Google Scholar]
  39. Trigubenko, R. Laboro Tomato. Kaggle, 2023. Available online: https://www.kaggle.com/datasets/nexuswho/laboro-tomato (accessed on 4 March 2026).
  40. TechKhid, S.M.K. Riped and Unriped Tomato Dataset. Kaggle, 2022. Available online: https://www.kaggle.com/datasets/sumn2u/riped-and-unriped-tomato-dataset (accessed on 4 March 2026).
Figure 1. Partial sample data.
Agronomy 16 00932 g001
Figure 2. Tomato images after data augmentation.
Agronomy 16 00932 g002
Figure 3. The network structure of CFD-DETR.
Agronomy 16 00932 g003
Figure 4. The CAEfficientViT architecture.
Agronomy 16 00932 g004
Figure 5. Block design comparison: (a) standard EfficientViT block; (b) the proposed CAEfficientViT block, which simplifies feature extraction and incorporates a channel interaction module; (c) Cascaded Group Attention; (d) detailed block architecture.
Agronomy 16 00932 g005
Figure 6. Comparison of self-attention mechanisms: (a) is classical multi-head self-attention in ViT, which also acts as attention for intra-scale feature interactions in RT-DETR; (b) is separable self-attention in MobileViTv2, which reduces the matrix feature metric to a vector; (c) is swift self-attention in SwiftFormer, which achieves efficient feature association with only Q and K; (d) shows the proposed FEAA module.
Agronomy 16 00932 g006
Figure 7. Offset generation styles in DySample. Although the (a) “linear + pixel shuffle” (LP) path involves slightly more parameters than the (b) “pixel shuffle + linear” (PL) path, its strategy of first compressing and then expanding significantly reduces the spatial resolution of intermediate features, resulting in lower memory consumption and higher inference throughput.
Agronomy 16 00932 g007
Figure 8. Dynamic upsampling process and module designs in DwDySample. (a) The sampling set is generated by the sampling point generator. In the generator (b), the sampling set is the sum of the generated offset and the original grid position.
Agronomy 16 00932 g008
Figure 9. SIoU schematic.
Agronomy 16 00932 g009
Figure 10. Comparison of models’ confusion matrices before and after improvement: CFD-DETR is an efficient feature fusion detection transformer with the CAEfficientViT backbone, aggregated FEAA and DwDySample synergized with Wise-SIoU loss; RT-DETR is a real-time detection transformer.
Agronomy 16 00932 g010
Figure 11. Comparison of tomato ripeness detection performance across different algorithms. The arrows in the image indicate tomatoes that were missed or misclassified.
Agronomy 16 00932 g011
Figure 12. Typical failure cases of the CFD-DETR model under extreme greenhouse conditions: (a) Severe fruit overlap; (b) Severe foliage occlusion; (c) Low-light conditions; (d) Severe shading and occlusion. Yellow circles indicate missed detections during inference.
Agronomy 16 00932 g012
Table 1. Comparison of object scale distribution before and after re-annotation.
ScaleOriginal CountOriginal Proportion/%Re-Annotated CountRe-Annotated Proportion/%
Small4745.87288.7
Medium308938.0415349.6
Large455856.2349141.7
Total81211008372100
Table 2. Distribution of tomato ripeness categories in the reconstructed dataset.
Ripeness CategoryVisual FeaturesBounding Box CountProportion/%
GreenTomatoPredominantly green surface675545.40
RedTomatoLight red or fully red surface812454.60
Total-14,879100.00
Table 3. Experimental environment.
EnvironmentVersion
Operating SystemWindow11
CPUIntel(R) Core(TM) i5-12600KF
GPUNVIDIA GeForce RTX 4060 Ti 16 G
Torch2.1.1
CUDA11.8
Python3.10
Table 4. Baseline architecture comparison.
Architecture TypeModelParams/MGFOLPs/GmAP@0.5/%
Two-stage CNNFaster-RCNN80.3196.084.3
One-stage CNNYOLOv10s15.358.986.8
SSD23.3136.084.0
DETR+TransformerRT-DETR-R1819.956.988.1
Table 5. Detailed architectural configurations of the CAEfficientViT backbone.
StageOutput SizeBlocks ( L i )Channels ( C i )CGA Heads ( H i )CGA KernelSE Ratio
PatchEmbed80 × 80-64---
Stage180 × 801644[7,5,3,3]0.25
Stage240 × 4021284[7,5,3,3]0.25
Stage320 × 2031924[7,5,3,3]0.25
Note: L i , C i and H i denote the number of stacked blocks, output channels, and attention heads in each stage, respectively. CGA (Cascaded Group Attention) kernels represent the depthwise convolution sizes in the cascaded attention heads. The SE ratio refers to the reduction ratio of the Squeeze-and-Excitation module.
Table 6. Detection results under different lightweight backbone networks.
ModelBackboneP/%Params/MmAP@0.5/%FPS
RTDETRRepViT-M0.986.613.388.598
RTDETRStarNet-S284.211.987.580
RTDETRMobilenetV4-S86.311.387.6131
RTDETREfficientViT-M087.110.788.3104
RTDETRCAEfficientViT86.710.488.7120
Table 7. Comparative experiment of different attention mechanisms.
AttentionP/%R/%Params/MmAP@0.5/%
Multi-Head85.783.319.988.1
Pola85.979.620.186.4
AdditiveTokenMixer86.981.819.987.6
EfficientAdditive87.783.019.988.6
FocusedEfficientAdditive88.283.619.990.3
Table 8. Detection results under different upsampling operators.
Upsampling OperatorP/%R/%GFLOPs/GParams/MmAP@0.5/%
CARAFE87.581.957.220.088.9
FADE85.184.957.420.088.8
IndexNet87.182.561.125.688.2
DySample86.183.857.019.989.0
DwDySample87.083.657.019.989.4
Table 9. Ablation study result.
ModelCAEfficientViTFEAADwDySampleWise-SIoUP/%R/%mAP@0.5/%GFLOPs/GParams/M
RTDETR 85.783.388.156.919.9
Model-1 86.783.388.7+0.626.710.4
Model-2 88.283.690.3+2.257.219.9
Model-3 87.083.689.4+1.357.019.9
Model-4 88.681.789.4+1.356.919.9
Model-5 87.683.389.1+1.027.010.5
Model-6 86.684.189.6+1.527.010.5
Model-788.285.990.2+2.127.010.5
Note: The checkmark “√” indicates that the corresponding component is incorporated into the model.
Table 10. Training configurations for the compared models.
ModelOptimizerInitial LRWarmupEpochsNMS Threshold
Faster-RCNNSGD0.02yes1000.5
YOLOv10sSGD0.01yes3000.6
YOLOv12mSGD0.01yes3000.6
Mamba-YOLO-BAdamW0.001yes100-
RTDETR-R18AdamW0.0001yes100-
OursAdamW0.0001yes100-
Table 11. Model comparison experiment.
ModelP/%R/%mAP@0.5/%Params/MGFLOPs/GSize/M
Faster-RCNN87.183.484.380.3196.082.0
YOLOv10s83.778.286.815.358.915.7
YOLOv12m84.182.588.219.559.537.8
Mamba-YOLO-B82.976.484.521.745.420.7
RTDETR-R1885.783.388.119.956.980.7
Ours88.285.990.210.527.021.3
Table 12. Comparison of different datasets (%).
DatasetsRT-DETRCFD-DETR
mAP@0.5mAP@0.5:0.95mAP@0.5mAP@0.5:0.95
Laboro Tomato77.362.280.766.9
RaUTD90.774.892.076.8
Ours88.167.790.269.3
Disclaimer/Publisher’s Note: The statements, opinions and data contained in all publications are solely those of the individual author(s) and contributor(s) and not of MDPI and/or the editor(s). MDPI and/or the editor(s) disclaim responsibility for any injury to people or property resulting from any ideas, methods, instructions or products referred to in the content.