The Effect of the Freeze–Thaw Process on Plant Available Water and Water-Stable Aggregates as a Function of Soil Tillage and Soil Chemical Quality



Abstract
1. Introduction
2. Materials and Methods
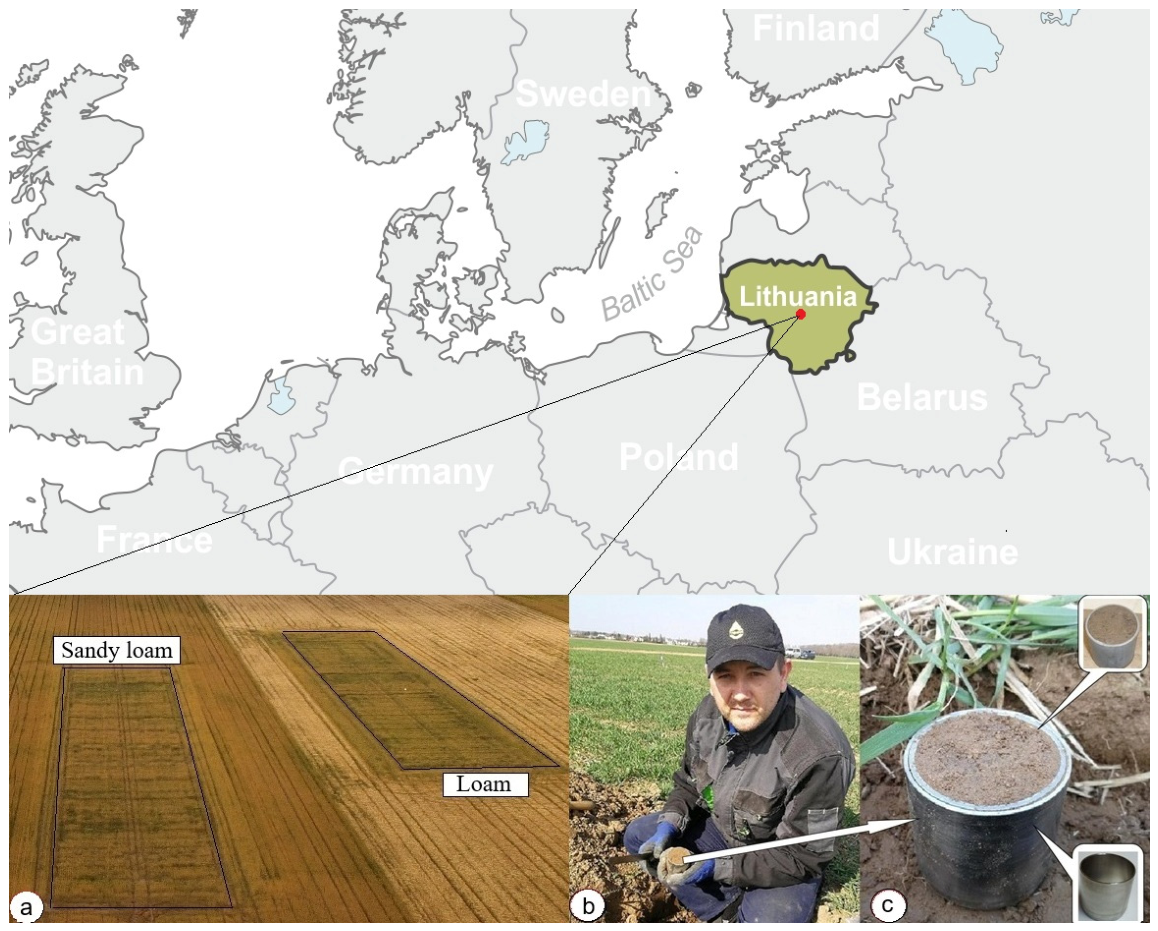
2.1. Soil Description and Site
2.2. Sampling
2.3. Freezing–Thawing Process
2.4. Hydro-Physical Analyses of the Soil
2.5. Water-Stable Aggregate (WSA) Analysis
2.6. Agrochemical Analysis
2.7. Meteorological Conditions
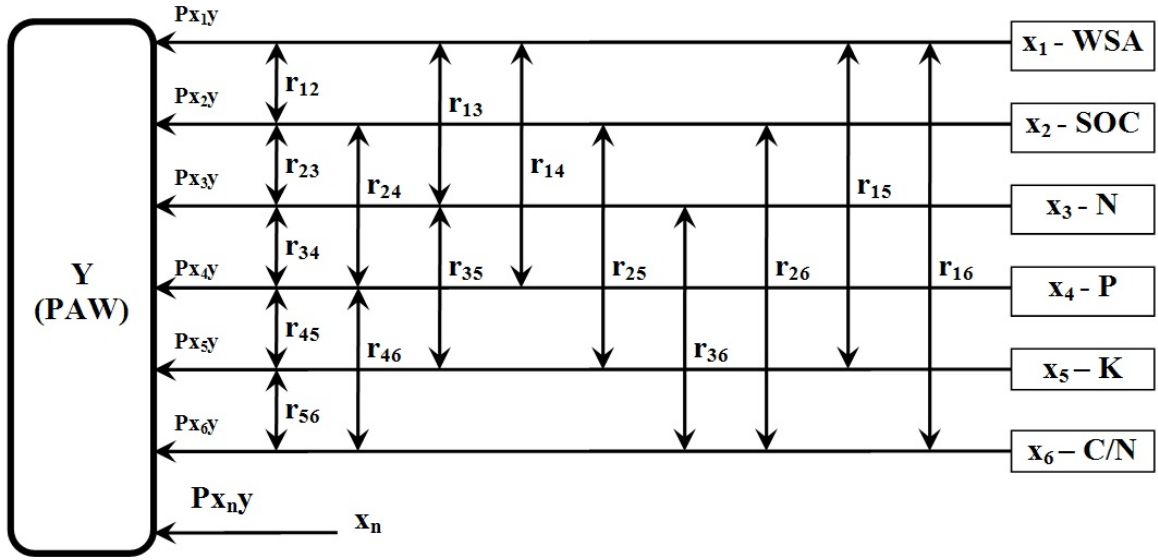
2.8. Statistical Analysis
3. Results
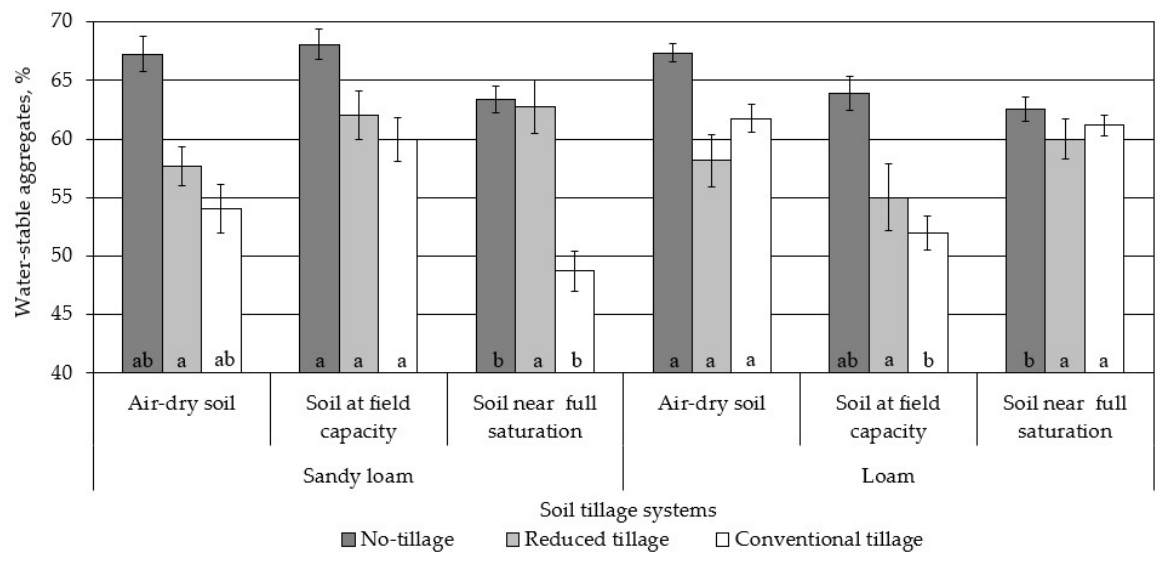
3.1. Content of Soil Water-Stable Aggregates
3.2. The Effect of Tillage Systems on Water-Stable Aggregate Content
3.3. Soil Chemical Properties
3.4. Content of Plant Available Water
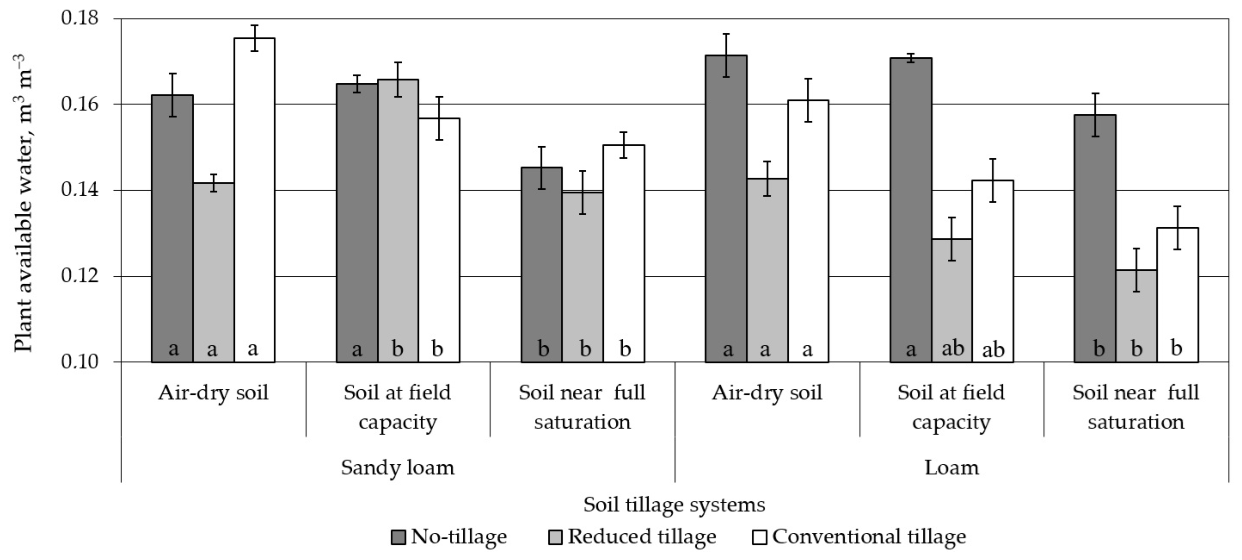
3.5. The Influence of Tillage Systems on Plant Available Water (PAW) Content
3.6. The Effect of Water Content During Freezing–Thawing Processes on Plant Available Water (PAW) Content
3.7. The Effect of Soil Chemical Properties on Water-Stable Aggregates
3.8. Relationships of Dependent Variable (PAW) with Physical and Chemical Properties of Soil at Different Water Contents During Freezing–Thawing
4. Discussion
5. Conclusions
Author Contributions
Funding
Data Availability Statement
Conflicts of Interest
Abbreviations
| WSA | Water-stable aggregates |
| PAW | Plant available water |
| NT | No-tillage |
| RT | Reduced tillage |
| CT | Conventional tillage |
| AD | Air-dry soil |
| FC | Soil at field capacity |
| NS | Soil near full saturation |
| SOC | Soil organic carbon |
| N | Total nitrogen |
| P | Available phosphorus |
| K | Available potassium |
| C/N | Carbon/nitrogen ratio |
References
- IPCC. Climate Change 2007: The Physical Science Basis. Contribution of Working Group I to the Fourth Assessment Report of the Intergovernmental Panel on Climate Change; Solomon, S., Qin, D., Manning, M., Chen, Z., Marquis, M., Averyt, K., Tignor, M.M.B., Miller, H.L., Eds.; Cambridge University Press: Cambridge, UK; New York, NY, USA, 2007; p. 996. [Google Scholar]
- Xiao, L.; Yao, K.; Li, P.; Liu, Y.; Zhang, Y. Effects of freeze-thaw cycles and initial soil moisture content on soil aggregate stability in natural grassland and Chinese pine forest on the Loess Plateau of China. J. Soils Sediments 2020, 20, 1222–1230. [Google Scholar] [CrossRef]
- Kværnø, S.H.; Øygarden, L. The influence of freeze-thaw cycles and soil moisture on aggregate stability of three soils in Norway. Catena 2006, 67, 175–182. [Google Scholar] [CrossRef]
- Galvonaitė, A.; Valiukas, D.; Kilpys, J.; Kitrienė, Z.; Misiūnienė, M. Climate Atlas of Lithuania; Lithuanian Hydrometeorological Service under the Ministry of Environment: Vilnius, Lithuania, 2013; p. 175.
- Staugaitis, G.; Vaišvila, Z.J. Dirvožemio Agrocheminiai Tyrimai. Mokslinė-Methodinė Medžiaga; Lietuvos Agrarinių ir Miškų Mokslų Centro Agrocheminių Tyrimų Laboratorija: Kaunas, Lithuania, 2019; p. 112. (In Lithuanian)
- Wang, T.; Li, P.; Li, Z.B.; Hou, J.M.; Xiao, L.; Ren, Z.P.; Xu, G.C.; Yu, K.X.; Su, Y.Y. The effects of freeze-thaw process on soil water migration in dam and slope farmland on the Loess Plateau, China. Sci. Total Environ. 2019, 666, 721–730. [Google Scholar] [CrossRef] [PubMed]
- Shen, Q.; Wu, M.J.; Zhang, M.K. Accumulation and relationship of metals in different soil aggregate fractions along soil profiles. J. Environ. Sci. 2022, 115, 47–54. [Google Scholar] [CrossRef]
- Lu, Q.; Ma, H.B.; Zhou, Y.; Calvelo-Pereira, R.; Shen, Y. Caragana koshinskii Kom. Plantation reduced soil aggregate stability and aggregate-associated organic carbon on desert steppe. PeerJ 2022, 10, e12507. [Google Scholar] [CrossRef] [PubMed]
- Zhao, Y.D.; Hu, X. A pore-scale investigation of soil aggregate structure responding to freeze-thaw cycles using x-ray computed microtomography. J. Soils Sediments 2023, 23, 3137–3148. [Google Scholar] [CrossRef]
- Tang, F.K.; Cui, M.; Lu, Q.; Liu, Y.G.; Guo, H.Y.; Zhou, J.X. Effects of vegetation restoration on the aggregate stability and distribution of aggregate-associated organic carbon in a typical karst gorge region. Solid Earth 2016, 7, 141–151. [Google Scholar] [CrossRef]
- Xiao, L.; Zhang, Y.; Li, P.; Xu, G.C.; Shi, P.; Zhang, Y. Effects of freeze-thaw cycles on aggregate-associated organic carbon and glomalin-related soil protein in natural-succession grassland and Chinese pine forest on the Loess Plateau. Geoderma 2019, 334, 1–8. [Google Scholar] [CrossRef]
- Wang, J.; Liu, L.; Qiu, X.; Wei, Y.; Li, Y.; Shi, Z. Contents of soil organic carbon and nitrogen in water-stable aggregates in abandoned agricultural lands in an arid ecosystem of Northwest China. J. Arid. Land 2016, 8, 350–363. [Google Scholar] [CrossRef]
- Kim, Y.J.; Kim, J.; Jung, J.Y. Responses of dissolved organic carbon to freeze-thaw cycles associated with the changes in microbial activity and soil structure. Cryosphere 2023, 17, 3101–3114. [Google Scholar] [CrossRef]
- Jia, Y.L.; Chen, S.Y.; Wu, M.H.; Gu, Y.Z.; Wei, P.J.; Wu, T.H.; Shang, Z.H.; Wang, S.J.; Yu, H.Y. Improved permafrost stability by revegetation in extremely degraded grassland of the Qinghai-Tibetan Plateau. Geoderma 2023, 430, 116350. [Google Scholar] [CrossRef]
- Al-Kaisi, M.M.; Douelle, A.; Kwaw-Mensah, D. Soil microaggregate and macroaggregate decay over time and soil carbon change as influenced by different tillage systems. Soils Water Conserv. 2014, 69, 574–580. [Google Scholar] [CrossRef]
- Dong, C.; Gu, Y.; Jia, Y.; Wei, P.; Jin, J.; Deng, Y.; Yang, P.; Chen, S. Effects of freeze-thaw cycles on the size distribution and stability of soil aggregate in the permafrost regions of the Qinghai-Tibetan Plateau. Environ. Res. Commun. 2023, 5, 095008. [Google Scholar] [CrossRef]
- Li, G.Y.; Fan, H.M. Effect of freeze-thaw on water stability of aggregates in a black soil of Northeast China. Pedosphere 2014, 24, 285–290. [Google Scholar] [CrossRef]
- Cheng, Y.; Hao, S.; Zhang, J.; Xu, G.; Zhang, Y.; Ren, Z.; Jiang, W.; Liu, M. Impacts of freeze-thaw cycles on soil aggregate stability and phosphorus occurrence under different land uses. Soil Tillage Res. 2026, 261, 107177. [Google Scholar] [CrossRef]
- Sun, B.; Ren, F.; Ding, W.; Zhang, G.; Huang, J.; Li, J.; Zhang, L. Effects of freeze-thaw on soil properties and water erosion. Soil Water Res. 2021, 16, 205–216. [Google Scholar] [CrossRef]
- Starkloff, T.; Larsbo, M.; Stolte, J. Quantifying the impact of a succession of freezing-thawing cycles on the pore network of a silty clay loam and a loamy sand topsoil using X-ray tomography. Catena 2017, 156, 365–374. [Google Scholar] [CrossRef]
- Liebhard, G.; Klik, A.; Neugschwandtner, R.W.; Nolz, R. Effects of tillage systems on soil water distribution, crop development, and evaporation and transpiration rates of soybean. Agric. Water. Manag. 2022, 269, 107719. [Google Scholar] [CrossRef]
- Phogat, M.; Dahiya, R.; Sangwan, P.S.; Goyal, V. Zero tillage and water productivity: A review. Int. J. Chem. Stud. 2020, 8, 2529–2533. [Google Scholar] [CrossRef]
- Blanco-Canqui, H.; Wortmann, C.S. Does occasional tillage undo the ecosystem services gained with no-till? A review. Soil Tillage Res. 2020, 198, 104534. [Google Scholar] [CrossRef]
- Boone, F.R.; Veen, B.W. Mechanisms of crop responses compaction. In Developments in Agricultural Engineering; Elsevier: Amsterdam, The Netherlands, 1994; pp. 237–264. [Google Scholar] [CrossRef]
- Munna, M.N.H.; Lal, R. Long-term organic amendments for plant-available water capacity in a temperate no-till system. Agric. Ecosyst. Environ. 2026, 401, 110296. [Google Scholar] [CrossRef]
- Rooney, E.C.; Bailey, V.L.; Patel, K.F.; Dragila, M.; Battu, A.K.; Buchko, A.C.; Gallo, A.C.; Hatten, J.; Possinger, A.R.; Qafoku, O. Soil pore network response to freeze-thaw cycles in permafrost aggregates. Geoderma 2022, 411, 115674. [Google Scholar] [CrossRef]
- Liu, H.J.; Rezanezhad, F.; Zak, D.; Li, X.J.; Lennartz, B. Freeze-thaw cycles alter soil hydro-physical properties and dissolved organic carbon release from peat. Front. Environ. Sci. 2022, 10, 930052. [Google Scholar] [CrossRef]
- Shi, G.X.; Hou, R.J.; Li, T.X.; Fu, Q.; Wang, J.W.; Zhou, W.Q.; Su, Z.B.; Shen, W.Z.; Wang, Y.J. Effects of biochar and freeze-thaw cycles on the bacterial community and multifunctionality in a cold black soil area. J. Environ. Manag. 2023, 342, 118302. [Google Scholar] [CrossRef] [PubMed]
- Haydu-Houdeshell, C.; Graham, R.C.; Hendrix, P.F.; Peterson, A.C. Soil aggregate stability under chaparral species in southern California. Geoderma 2018, 310, 201–208. [Google Scholar] [CrossRef]
- IUSS Working Group WRB. World Reference Base for Soil Resources. International Soil Classification System for Naming Soils and Creating Legends for Soil Maps, 4th ed.; International Union of Soil Sciences (IUSS): Vienna, Austria, 2022. [Google Scholar]
- Kochiieru, M.; Versuliene, A.; Shatkovska, K.; Feiza, V.; Seibutis, V. Mechanism of interaction between earthworms and root parameters on Cambisol. Agronomy 2024, 14, 1536. [Google Scholar] [CrossRef]
- Kochiieru, M.; Feiziene, D.; Feiza, V.; Volungevicius, J.; Velykis, A.; Slepetiene, A.; Deveikyte, I.; Seibutis, V. Freezing-thawing impact on aggregate stability as affected by land management, soil genesis and soil chemical and physical quality. Soil Tillage Res. 2020, 203, 104705. [Google Scholar] [CrossRef]
- Klute, A. Water retention: Laboratory methods. In Methods of Soil Analysis. Part 1. Physical and Mineralogical Methods, 2nd ed.; Klute, A., Ed.; Agronomy Monograph 9; The American Society of Agronomy and Soil Science Society of America: Madison, WI, USA, 1986; pp. 635–662. [Google Scholar] [CrossRef]
- Nikitin, B.A. Methods for soil humus determination. Agro Chem. 1999, 3, 156–158. [Google Scholar]
- Saint-Denis, T.; Goupy, J. Optimization of a nitrogen analyser based on the Dumas method. Anal. Chim. Acta 2004, 515, 191–198. [Google Scholar] [CrossRef]
- Egner, H.; Riehm, H.; Domingo, W.R. Untersuchungen uber die chemische Bodenanalyse als Grundlage fur die Beurteilung desNahrstoffzustandes der Boden II. Chemische Extraktionsmethoden zur Phosphor-und Kaliumbestimmung. K. Lantbrukshogskolans Ann. 1960, 26, 199–215. [Google Scholar]
- Williams, W.A.; Jones, M.B.; Demment, M.W.A. Concise table for path analysis statistics. Agron. J. 1990, 82, 1022–1024. [Google Scholar] [CrossRef]
- Sarker, T.C.; Incerti, G.; Spaccini, R.; Piccolo, A.; Mazzoleni, S.; Bonanomi, G. Linking organic matter chemistry with soil aggregate stability: Insight from 13C NMR spectroscopy. Soil Biol. Biochem. 2018, 117, 175–184. [Google Scholar] [CrossRef]
- Debnath, P.; Deb, P.; Sen, D.; Pattannaik, S.K.; Sah, D.; Ghosh, S.K. Physico-chemical properties and its relationship with water holding capacity of cultivated soils along altitudinal gradient in Sikkim. Int. J. Agric. Environ. Biotechnol. 2012, 5, 99–102. [Google Scholar]
- Deb, P.; Debnath, P.; Pattannaaik, S.K. Physico-chemical properties and water holding capacity of cultivated soils along altitudinal gradient in South Sikkim, India. Indian J. Agric. Res. 2014, 48, 120–126. [Google Scholar] [CrossRef]
- An, S.; Mentler, A.; Mayer, H.; Blum, W.E.H. Soil aggregation, aggregate stability, organic carbon and nitrogen in different soil aggregate fractions under forest and shrub vegetation on the Loess Plateau, China. Catena 2010, 81, 226–233. [Google Scholar] [CrossRef]
- Kochiieru, M.; Feiza, V.; Feiziene, D.; Lamorski, K.; Deveikytė, I.; Seibutis, V.; Pranaitienė, S. Long-term contrasting tillage in Cambisol: Effect on water-stable aggregates, macropore network and soil chemical properties. Int. Agrophys. 2023, 37, 59–67. [Google Scholar] [CrossRef]
- Skvortsova, E.B.; Shein, E.V.; Abrosimov, K.N.; Romanenko, K.A.; Yudina, A.V.; Klyueva, W.; Khaidapova, D.D.; Rogov, W. The impact of multiple freeze-thaw cycles on the microstructure of aggregates from a Soddy-Podzolic soil: A microtomographic analysis. Eurasian Soil Sci. 2018, 5, 190–198. [Google Scholar] [CrossRef]
- Kalhoro, S.A.; Xu, X.; Chen, W.; Hua, R.; Raza, S.; Ding, K. Effects of Different Land-Use Systems on Soil Aggregates: A Case Study of the Loess Plateau (Northern China). Sustainability 2017, 9, 1349. [Google Scholar] [CrossRef]
- Erktan, A.; Cecillon, L.; Graf, F.; Roumet, C.; Legout, C.; Rey, F. Increase in soil aggregate stability along a Mediterranean successional gradient in severely eroded gully bed ecosystems: Combined effects of soil, root traits and plant community characteristics. Plant Soil 2016, 398, 121–137. [Google Scholar] [CrossRef]
- Liu, H.; Gao, X.; Li, C.; Cai, Y.; Song, X.; Zhao, X. Intercropping increases plant water availability and water use efficiency: A synthesis. Agric. Ecosyst. Environ. 2025, 379, 109360. [Google Scholar] [CrossRef]
- Bhavya, V.P.; Anil Kumar, S.; Shivanna, M. Characterization of soil for physical properties under different land use systems. Int. J. Chem. Stud. 2017, 5, 2022–2024. [Google Scholar] [CrossRef]
- Wang, R.; Hu, X. Freeze-thaw processes correspond to the protection-loss of soil organic carbon through regulating pore structure of aggregates in alpine ecosystems. Soil 2024, 10, 859–871. [Google Scholar] [CrossRef]
- Peng, Y.; Yan, Y.; Fan, Z.; Shi, J.; Huo, C.; Zhang, Z.; Wang, X. Microbial associations with soil organic carbon pool composition and stabilization in eroding landscapes. Catena 2025, 258, 109302. [Google Scholar] [CrossRef]



| Factors | Soil Texture | Tillage System | Soil Layer (cm) | Water Content at Freezing | Water-Stable Aggregates (%) | F | Pr > F |
|---|---|---|---|---|---|---|---|
| Soil texture | Sandy loam | 60.43 a ± 0.75 | 0.05 | 0.8201 | |||
| Loam | 60.20 a ± 0.64 | ||||||
| Tillage system | No-tillage | 65.43 a ± 0.54 | 37.42 | 0.0001 | |||
| Reduced tillage | 59.26 b ± 0.90 | ||||||
| Conventional tillage | 56.26 c ± 0.81 | ||||||
| Soil layer (cm) | 0–10 | 62.63 a ± 0.64 | 23.59 | 0.0001 | |||
| 10–20 | 58.01 b ± 0.70 | ||||||
| Water content at freezing | Air-dry | 61.03 a ± 0.83 | 0.58 | 0.5625 | |||
| Field capacity | 60.14 a ± 0.93 | ||||||
| Near full saturation | 59.77 a ± 0.80 |
| Tillage System | Water-Stable Aggregates After Freezing–Thawing at Different Water Content (%) | |||||
|---|---|---|---|---|---|---|
| WSAAD | WSAFC | WSANS | ||||
| Sandy Loam | Loam | Sandy Loam | Loam | Sandy Loam | Loam | |
| No-tillage | 67.23 a ± 1.51 | 67.35 a ± 0.80 | 68.07 a ± 1.30 | 63.91 a ± 1.45 | 63.41 a ± 1.15 | 62.59 a ± 1.04 |
| Reduced tillage | 57.69 b ± 1.68 | 58.14 b ± 2.21 | 62.01 b ± 2.05 | 55.00 b ± 2.84 | 62.76 a ± 2.24 | 59.98 a ± 1.71 |
| Conventional tillage | 54.05 b ± 2.08 | 61.75 b ± 1.19 | 59.94 b ± 1.85 | 51.94 b ± 1.44 | 48.71 b ± 1.69 | 61.16 a ± 0.87 |
| F | 14.71 | 9.28 | 5.73 | 9.46 | 22.53 | 1.07 |
| Pr > F | 0.0001 | 0.0004 | 0.0061 | 0.0004 | 0.0001 | 0.3514 |
| Soil Texture | Tillage | Soil Layer | pHKCl | Soil Organic Carbon (SOC) | Total Nitrogen (N) | Available Phosphorus (P) | Available Potassium (K) | C/N |
|---|---|---|---|---|---|---|---|---|
| cm | g kg−1 | |||||||
| Sandy loam | NT | 0–10 | 5.4 ± 0.4 | 9.2 ± 0.8 | 1.13 ± 0.17 | 0.284 ± 0.05 | 0.249 ± 0.03 | 8.4 ± 2.0 |
| 10–20 | 6.0 ± 0.5 | 8.1 ± 1.1 | 0.87 ± 0.19 | 0.148 ± 0.03 | 0.114 ± 0.02 | 9.5 ± 0.8 | ||
| Mean: 0–20 | 5.7 ± 0.3 | 8.6 ± 0.6 | 1.00 ± 0.13 | 0.216 ± 0.05 | 0.181 ± 0.04 | 9.0 ± 0.9 | ||
| RT | 0–10 | 5.8 ± 0.1 | 8.5 ± 0.5 | 0.97 ± 0.03 | 0.366 ± 0.04 | 0.326 ± 0.06 | 8.7 ± 0.3 | |
| 10–20 | 6.2 ± 0.1 | 7.1 ± 0.6 | 0.85 ± 0.04 | 0.181 ± 0.01 | 0.131 ± 0.03 | 8.4 ± 0.3 | ||
| Mean: 0–20 | 6.0 ± 0.1 | 7.8 ± 0.5 | 0.91 ± 0.04 | 0.273 ± 0.06 | 0.228 ± 0.06 | 8.6 ± 0.2 | ||
| CT | 0–10 | 5.4 ± 0.1 | 8.3 ± 0.7 | 1.00 ± 0.07 | 0.189 ± 0.01 | 0.168 ± 0.01 | 8.2 ± 0.1 | |
| 10–20 | 5.6 ± 0.4 | 8.1 ± 0.3 | 0.89 ± 0.07 | 0.154 ± 0.01 | 0.166 ± 0.01 | 9.2 ± 1.0 | ||
| Mean: 0–20 | 5.5 ± 0.2 | 8.2 ± 0.3 | 0.94 ± 0.05 | 0.171 ± 0.01 | 0.167 ± 0.01 | 8.7 ± 0.5 | ||
| Sandy loam (average) | 5.7 ± 0.1 | 8.2 ± 0.3 | 0.95 ± 0.04 | 0.220 ± 0.03 | 0.192 ± 0.02 | 8.8 ± 0.3 | ||
| Loam | NT | 0–10 | 6.8 ± 0.0 | 13.0 ± 0.5 | 1.54 ± 0.13 | 0.379 ± 0.13 | 0.356 ± 0.05 | 8.5 ± 0.4 |
| 10–20 | 7.0 ± 0.0 | 12.1 ± 0.9 | 1.39 ± 0.21 | 0.361 ± 0.16 | 0.169 ± 0.05 | 8.8 ± 0.7 | ||
| Mean: 0–20 | 6.9 ± 0.1 | 12.5 ± 0.5 | 1.46 ± 0.11 | 0.370 ± 0.08 | 0.263 ± 0.06 | 8.6 ± 0.3 | ||
| RT | 0–10 | 6.9 ± 0.1 | 12.2 ± 1.1 | 1.45 ± 0.09 | 0.337 ± 0.02 | 0.324 ± 0.01 | 8.4 ± 0.2 | |
| 10–20 | 7.1 ± 0.0 | 10.7 ± 0.7 | 1.27 ± 0.17 | 0.328 ± 0.01 | 0.157 ± 0.03 | 8.5 ± 0.6 | ||
| Mean: 0–20 | 7.0 ± 0.1 | 11.4 ± 0.7 | 1.36 ± 0.09 | 0.332 ± 0.01 | 0.241 ± 0.05 | 8.4 ± 0.3 | ||
| CT | 0–10 | 6.7 ± 0.1 | 10.4 ± 0.1 | 1.13 ± 0.08 | 0.266 ± 0.01 | 0.201 ± 0.03 | 9.3 ± 0.7 | |
| 10–20 | 6.8 ± 0.1 | 11.7 ± 1.2 | 1.29 ± 0.11 | 0.265 ± 0.01 | 0.159 ± 0.01 | 9.2 ± 1.7 | ||
| Mean: 0–20 | 6.7 ± 0.1 | 11.1 ± 0.6 | 1.21 ± 0.07 | 0.265 ± 0.01 | 0.180 ± 0.02 | 9.2 ± 0.8 | ||
| Loam (average) | 6.9 ± 0.0 | 11.7 ± 0.4 | 1.34 ± 0.06 | 0.332 ± 0.03 | 0.228 ± 0.03 | 8.8 ± 0.3 | ||
| Factor | Soil Texture | Tillage System | Soil Layer (cm) | Water Content at Freezing | Plant Available Water (m3 m−3) | F | Pr > F |
|---|---|---|---|---|---|---|---|
| Soil texture | Sandy loam | 0.156 a ± 0.003 | 2.73 | 0.1031 | |||
| Loam | 0.148 a ± 0.004 | ||||||
| Tillage system | No-tillage | 0.162 a ± 0.003 | 7.43 | 0.0012 | |||
| Reduced tillage | 0.140 b ± 0.004 | ||||||
| Conventional tillage | 0.153 a ± 0.005 | ||||||
| Soil layer (cm) | 0–10 | 0.151 a ± 0.004 | 0.02 | 0.8756 | |||
| 10–20 | 0.152 a ± 0.003 | ||||||
| Water content at freezing | Air-dry | 0.159 a ± 0.005 | 5.22 | 0.0078 | |||
| Field capacity | 0.155 a ± 0.004 | ||||||
| Near full saturation | 0.141 b ± 0.004 |
| Tillage System | Plant Available Water (PAW) After Freezing–Thawing at Different Water Contents (m3 m−3) | |||||
|---|---|---|---|---|---|---|
| PAWAD | PAWFC | PAWNS | ||||
| Sandy Loam | Loam | Sandy Loam | Loam | Sandy Loam | Loam | |
| NT | 0.162 ab ± 0.006 | 0.172 a ± 0.009 | 0.165 a ± 0.004 | 0.171 a ± 0.008 | 0.145 a ± 0.003 | 0.158 a ± 0.006 |
| RT | 0.142 b ± 0.003 | 0.143 a ± 0.007 | 0.166 a ± 0.008 | 0.129 b ± 0.008 | 0.140 a ± 0.009 | 0.122 b ± 0.012 |
| CT | 0.176 a ± 0.012 | 0.161 a ± 0.016 | 0.157 a ± 0.004 | 0.142 b ± 0.010 | 0.151 a ± 0.007 | 0.131 ab ± 0.010 |
| Contrasts | ||||||
| NT vs. CT | −0.014 * | 0.011 ns | 0.008 ns | 0.029 * | −0.006 ns | 0.027 * |
| NT vs. RT | 0.020 ** | 0.029 * | −0.001 ns | 0.042 ** | 0.004 ns | 0.036 ** |
| RT vs. CT | −0.034 ** | −0.018 ns | 0.009 ns | −0.013 ns | −0.011 ns | −0.009 ns |
| Parameters | NT | RT | CT | WSA | PAW | SOC | N | P | K |
|---|---|---|---|---|---|---|---|---|---|
| Air-dry soil | |||||||||
| WSA—water-stable aggregates (%) | 67.35 | 58.14 | 61.75 | ||||||
| PAW—plant available water (m3 m−3) | 0.172 | 0.143 | 0.161 | 0.48 * | |||||
| SOC—soil organic carbon (g kg−1) | 12.53 | 11.40 | 11.05 | 0.56 * | 0.78 ** | ||||
| N—total nitrogen (g kg−1) | 1.46 | 1.36 | 1.21 | 0.40 ns | 0.55 * | 0.94 ** | |||
| P—available phosphorus (g kg−1) | 0.370 | 0.332 | 0.265 | 0.46 * | 0.18 ns | 0.69 * | 0.85 ** | ||
| K—available potassium (g kg−1) | 0.263 | 0.241 | 0.180 | 0.38 ns | 0.28 ns | 0.68 * | 0.73 ** | 0.54 * | |
| C/N—carbon/nitrogen ratio | 8.64 | 8.42 | 9.25 | 0.09 ns | 0.16 ns | −0.44 ns | −0.71 ** | −0.81 ** | −0.56 * |
| Soil at field capacity | |||||||||
| WSA—water-stable aggregates (%) | 63.91 | 55.00 | 51.94 | ||||||
| PAW—plant available water (m3 m−3) | 0.171 | 0.129 | 0.142 | 0.72 ** | |||||
| SOC—soil organic carbon (g kg−1) | 12.53 | 11.40 | 11.05 | 0.73 ** | 0.49 * | ||||
| N—total nitrogen (g kg−1) | 1.46 | 1.36 | 1.21 | 0.76 ** | 0.38 ns | 0.94 ** | |||
| P—available phosphorus (g kg−1) | 0.370 | 0.332 | 0.265 | 0.83 ** | 0.51 * | 0.69 * | 0.85 ** | ||
| K—available potassium (g kg−1) | 0.263 | 0.241 | 0.180 | 0.75 ** | 0.17 ns | 0.68 * | 0.73 ** | 0.54 * | |
| C/N—carbon/nitrogen ratio | 8.64 | 8.42 | 9.25 | −0.51 * | 0.03 ns | −0.44 ns | −0.71 ** | −0.81 ** | −0.56 * |
| Soil near full saturation | |||||||||
| WSA—water-stable aggregates (%) | 62.59 | 59.98 | 61.16 | ||||||
| PAW—plant available water (m3 m−3) | 0.157 | 0.121 | 0.131 | −0.10 ns | |||||
| SOC—soil organic carbon (g kg−1) | 12.53 | 11.40 | 11.05 | 0.65 * | 0.11 ns | ||||
| N—total nitrogen (g kg−1) | 1.46 | 1.36 | 1.21 | 0.52 * | 0.10 ns | 0.94 ** | |||
| P—available phosphorus (g kg−1) | 0.370 | 0.332 | 0.265 | 0.23 ns | 0.42 * | 0.69 * | 0.85 ** | ||
| K—available potassium (g kg−1) | 0.263 | 0.241 | 0.180 | 0.81 ** | 0.03 ns | 0.68 * | 0.73 ** | 0.54 * | |
| C/N—carbon/nitrogen ratio | 8.64 | 8.42 | 9.25 | −0.08 ns | −0.01 ns | −0.44 ns | −0.71 ** | −0.81 ** | −0.56 * |
| Parameters | NT | RT | CT | WSA | PAW | SOC | N | P | K |
|---|---|---|---|---|---|---|---|---|---|
| Air-dry soil | |||||||||
| WSA—water-stable aggregates (%) | 67.23 | 57.69 | 54.05 | ||||||
| PAW—plant available water (m3 m−3) | 0.162 | 0.142 | 0.176 | −0.16 ns | |||||
| SOC—soil organic carbon (g kg−1) | 8.63 | 7.78 | 8.18 | 0.49 * | 0.18 ns | ||||
| N—total nitrogen (g kg−1) | 1.00 | 0.91 | 0.94 | 0.30 ns | 0.19 ns | 0.88 ** | |||
| P—available phosphorus (g kg−1) | 0.216 | 0.273 | 0.171 | 0.24 ns | −0.61 * | 0.54 * | 0.58 * | ||
| K—available potassium (g kg−1) | 0.181 | 0.228 | 0.167 | 0.14 ns | −0.50 * | 0.63 * | 0.60 * | 0.97 ** | |
| C/N—carbon/nitrogen ratio | 8.96 | 8.57 | 8.74 | 0.35 ns | −0.03 ns | −0.06 ns | −0.51 * | −0.34 ns | −0.27 ns |
| Soil at field capacity | |||||||||
| WSA—water-stable aggregates (%) | 68.07 | 62.01 | 59.94 | ||||||
| PAW—plant available water (m3 m−3) | 0.165 | 0.166 | 0.157 | 0.18 ns | |||||
| SOC—soil organic carbon (g kg−1) | 8.63 | 7.78 | 8.18 | 0.55 * | −0.39 ns | ||||
| N—total nitrogen (g kg−1) | 1.00 | 0.91 | 0.94 | 0.71 ** | −0.34 ns | 0.88 ** | |||
| P—available phosphorus (g kg−1) | 0.216 | 0.273 | 0.171 | 0.31 ns | −0.11 ns | 0.54 * | 0.58 * | ||
| K—available potassium (g kg−1) | 0.181 | 0.228 | 0.167 | 0.18 ns | −0.25 ns | 0.63 * | 0.60 * | 0.97 ** | |
| C/N—carbon/nitrogen ratio | 8.96 | 8.57 | 8.74 | −0.38 ns | 0.16 ns | −0.06 ns | −0.51 * | −0.34 ns | −0.27 ns |
| Soil near full saturation | |||||||||
| WSA—water-stable aggregates (%) | 63.41 | 62.77 | 48.71 | ||||||
| PAW—plant available water (m3 m−3) | 0.146 | 0.139 | 0.151 | −0.60 * | |||||
| SOC—soil organic carbon (g kg−1) | 8.63 | 7.78 | 8.18 | 0.49 * | 0.09 ns | ||||
| N—total nitrogen (g kg−1) | 1.00 | 0.91 | 0.94 | 0.46 * | 0.30 ns | 0.88 ** | |||
| P—available phosphorus (g kg−1) | 0.216 | 0.273 | 0.171 | 0.83 ** | −0.52 * | 0.54 * | 0.58 * | ||
| K—available potassium (g kg−1) | 0.181 | 0.228 | 0.167 | 0.71 ** | −0.48 * | 0.63 * | 0.60 * | 0.97 ** | |
| C/N—carbon/nitrogen ratio | 8.96 | 8.57 | 8.74 | −0.08 ns | −0.40 ns | −0.06 ns | −0.51 * | −0.34 ns | −0.27 ns |
| Parameters | WSA | SOC | N | P | K | C/N | PAW (rY) |
|---|---|---|---|---|---|---|---|
| Air-dry soil | |||||||
| WSA—water-stable aggregates (%) | −2.219 | 1.090 | −0.639 | 1.568 | 0.371 | 0.315 | 0.48 * |
| SOC—soil organic carbon (g kg−1) | −1.235 | 1.958 | −1.495 | 2.381 | 0.671 | −1.504 | 0.78 ** |
| N—total nitrogen (g kg−1) | −0.895 | 1.846 | −1.586 | 2.914 | 0.716 | −2.444 | 0.55 * |
| P—available phosphorus (g kg−1) | −1.011 | 1.354 | −1.342 | 3.442 | 0.531 | −2.792 | 0.18 ns |
| K—available potassium (g kg−1) | −0.839 | 1.339 | −1.158 | 1.862 | 0.981 | −1.910 | 0.28 ns |
| C/N—carbon/nitrogen ratio | −0.204 | −0.858 | 1.129 | −2.799 | −0.546 | 3.432 | 0.16 ns |
| Soil at field capacity | |||||||
| WSA—water-stable aggregates (%) | 4.893 | −1.117 | 2.879 | −4.252 | −2.385 | 0.699 | 0.72 ** |
| SOC—soil organic carbon (g kg−1) | 3.559 | −1.536 | 3.581 | −3.530 | −2.188 | 0.599 | 0.49 * |
| N—total nitrogen (g kg−1) | 3.709 | −1.448 | 3.798 | −4.319 | −2.335 | 0.975 | 0.38 ns |
| P—available phosphorus (g kg−1) | 4.077 | −1.062 | 3.215 | −5.102 | −1.730 | 1.113 | 0.51 * |
| K—available potassium (g kg−1) | 3.648 | −1.051 | 2.773 | −2.761 | −3.198 | 0.762 | 0.17 ns |
| C/N—carbon/nitrogen ratio | −2.499 | 0.673 | −2.704 | 4.150 | 1.780 | −1.369 | 0.03 ns |
| Soil near full saturation | |||||||
| WSA—water-stable aggregates (%) | −1.404 | 0.409 | −0.824 | 0.499 | 1.352 | −0.130 | −0.10 ns |
| SOC—soil organic carbon (g kg−1) | −0.913 | 0.628 | −1.482 | 1.476 | 1.149 | −0.752 | 0.11 ns |
| N—total nitrogen (g kg−1) | −0.736 | 0.592 | −1.572 | 1.806 | 1.226 | −1.222 | 0.10 ns |
| P—available phosphorus (g kg−1) | −0.329 | 0.435 | −1.330 | 2.134 | 0.908 | −1.396 | 0.42 * |
| K—available potassium (g kg−1) | −1.131 | 0.430 | −1.148 | 1.154 | 1.679 | −0.955 | 0.03 ns |
| C/N—carbon/nitrogen ratio | 0.106 | −0.275 | 1.119 | −1.735 | −0.934 | 1.716 | −0.01 ns |
| Parameters | WSA | SOC | N | P | K | C/N | PAW (rY) |
|---|---|---|---|---|---|---|---|
| Air-dry soil | |||||||
| WSA—water-stable aggregates (%) | 0.330 | 2.237 | −1.355 | −0.510 | 0.089 | −0.947 | −0.16 ns |
| SOC—soil organic carbon (g kg−1) | 0.162 | 4.554 | −3.930 | −1.174 | 0.408 | 0.156 | 0.18 ns |
| N—total nitrogen (g kg−1) | 0.100 | 4.010 | −4.463 | −1.245 | 0.391 | 1.393 | 0.19 ns |
| P—available phosphorus (g kg−1) | 0.078 | 2.473 | −2.570 | −2.163 | 0.632 | 0.941 | −0.61 * |
| K—available potassium (g kg−1) | 0.045 | 2.851 | −2.677 | −2.095 | 0.652 | 0.726 | −0.50 * |
| C/N—carbon/nitrogen ratio | 0.114 | −0.260 | 2.275 | 0.745 | −0.173 | −2.733 | −0.03 ns |
| Soil at field capacity | |||||||
| WSA—water-stable aggregates (%) | 7.266 | −2.417 | −2.684 | −5.772 | 3.818 | −0.027 | 0.18 ns |
| SOC—soil organic carbon (g kg−1) | 3.965 | −4.430 | −3.328 | −10.190 | 13.592 | −0.004 | −0.39 ns |
| N—total nitrogen (g kg−1) | 5.160 | −3.900 | −3.780 | −10.806 | 13.023 | −0.036 | −0.34 ns |
| P—available phosphorus (g kg−1) | 2.234 | −2.405 | −2.176 | −18.769 | 21.030 | −0.024 | −0.11 ns |
| K—available potassium (g kg−1) | 1.278 | −2.773 | −2.267 | −18.181 | 21.710 | −0.019 | −0.25 ns |
| C/N—carbon/nitrogen ratio | −2.786 | 0.252 | 1.927 | 6.465 | −5.765 | 0.070 | 0.16 ns |
| Soil near full saturation | |||||||
| WSA—water-stable aggregates (%) | −2.814 | −0.175 | 0.949 | 5.724 | −4.181 | −0.103 | −0.60 * |
| SOC—soil organic carbon (g kg−1) | −1.376 | −0.358 | 1.828 | 3.766 | −3.696 | −0.070 | 0.09 ns |
| N—total nitrogen (g kg−1) | −1.286 | −0.315 | 2.076 | 3.994 | −3.541 | −0.624 | 0.30 ns |
| P—available phosphorus (g kg−1) | −2.322 | −0.195 | 1.195 | 6.937 | −5.718 | −0.422 | −0.52 * |
| K—available potassium (g kg−1) | −1.993 | −0.224 | 1.245 | 6.719 | −5.903 | −0.325 | −0.48 * |
| C/N—carbon/nitrogen ratio | 0.238 | 0.020 | −1.058 | −2.389 | 1.568 | 1.224 | −0.40 ns |
Disclaimer/Publisher’s Note: The statements, opinions and data contained in all publications are solely those of the individual author(s) and contributor(s) and not of MDPI and/or the editor(s). MDPI and/or the editor(s) disclaim responsibility for any injury to people or property resulting from any ideas, methods, instructions or products referred to in the content. |
© 2026 by the authors. Licensee MDPI, Basel, Switzerland. This article is an open access article distributed under the terms and conditions of the Creative Commons Attribution (CC BY) license.
Share and Cite
Kochiieru, M.; Pranaitienė, S.; Feiza, V.; Kochiieru, Y. The Effect of the Freeze–Thaw Process on Plant Available Water and Water-Stable Aggregates as a Function of Soil Tillage and Soil Chemical Quality. Agronomy 2026, 16, 916. https://doi.org/10.3390/agronomy16090916
Kochiieru M, Pranaitienė S, Feiza V, Kochiieru Y. The Effect of the Freeze–Thaw Process on Plant Available Water and Water-Stable Aggregates as a Function of Soil Tillage and Soil Chemical Quality. Agronomy. 2026; 16(9):916. https://doi.org/10.3390/agronomy16090916
Chicago/Turabian StyleKochiieru, Mykola, Simona Pranaitienė, Virginijus Feiza, and Yuliia Kochiieru. 2026. "The Effect of the Freeze–Thaw Process on Plant Available Water and Water-Stable Aggregates as a Function of Soil Tillage and Soil Chemical Quality" Agronomy 16, no. 9: 916. https://doi.org/10.3390/agronomy16090916
APA StyleKochiieru, M., Pranaitienė, S., Feiza, V., & Kochiieru, Y. (2026). The Effect of the Freeze–Thaw Process on Plant Available Water and Water-Stable Aggregates as a Function of Soil Tillage and Soil Chemical Quality. Agronomy, 16(9), 916. https://doi.org/10.3390/agronomy16090916