Article

Cultivar Variation in Growth, Yield, and Nutritional Quality of Pea Sprouts and Fresh Seeds for the Selection of Specialized Cultivars

1
Mid-Term National Germplasm Resource Bank for Drought-Resistant and Salt-Alkali Tolerant Crops (Jinan), National Saline-Alkali Tolerant Crop Germplasm Resources Nursery (Dongying), Institute of Crop Germplasm Resources, Shandong Academy of Agricultural Sciences, Jinan 250100, China
2
Qingdao Academy of Agricultural Sciences, Qingdao 266100, China
*
Authors to whom correspondence should be addressed.
These authors contributed equally to this work.
Agronomy 2026, 16(8), 784; https://doi.org/10.3390/agronomy16080784
Submission received: 4 March 2026 / Revised: 4 April 2026 / Accepted: 8 April 2026 / Published: 10 April 2026
(This article belongs to the Special Issue Cultivar Development of Pulses Crop—2nd Edition)

Abstract

To clarify cultivar differences in growth performance, yield formation, and bioactive characteristics at the sprout and fresh seed stages, twelve pea cultivars were evaluated. Growth traits, yield formation, and changes in phenolic compounds and antioxidant activity during sprouting were assessed, and the nutritional quality and mineral element composition of fresh seeds were also determined. The results showed that cultivars 24-164 and 24-510 exhibited low germination rates and severe cotyledon decay, making them unsuitable for sprout production. Significant differences were observed among the remaining cultivars in growth traits, edible ratio, and yield efficiency, with cultivars 24-724 and 24-486 showing superior processing efficiency and utilization value. During sprouting, total phenolic and total flavonoid contents, as well as 2,2′-azino-bis(3-ethylbenzothiazoline-6-sulfonic acid) (ABTS) radical scavenging activity and ferric reducing antioxidant power (FRAP), were significantly influenced by both cultivar and light exposure stage. Root length and root diameter were significantly and positively correlated with phenolic accumulation and antioxidant activity. Analysis of fresh seed quality revealed marked inter-cultivar variation in nutritional and health-related traits. Cultivar 24-486 exhibited the highest values for phenolic content, antioxidant capacity, vitamin C, vitamin E, and Fe and Se accumulation, whereas cultivar 24-013 showed advantages in calcium and potassium contents. These results identify cultivars 24-724 and 24-486 as promising candidates for sprout production and highlight cultivar 24-486 as a dual-purpose genotype for both sprout and fresh seed utilization.

1. Introduction

Pea (Pisum sativum L., 2n = 14) is an important leguminous vegetable and grain crop, characterized by high protein content, dietary fiber, and abundant vitamins and mineral elements. Owing to its notable nutritional advantages, it is widely used for fresh consumption, processing, and the development of functional foods [1,2]. With consumer demand shifting from a yield-oriented focus to an emphasis on nutritional quality and health-related attributes [3], the identification of pea genotypes that combine high production efficiency with superior nutritional value has become a key objective in cultivar improvement and industrial utilization [4].
Pea sprouts, as a short-cycle and high value-added vegetable product, possess several advantages, including a short production period, low input requirements, and the potential for year-round cultivation [5]. Their nutritional quality is closely associated with metabolic reprogramming during seed germination. Germination triggers enhanced secondary metabolism, particularly the synthesis and accumulation of antioxidant compounds such as phenolic compounds, including flavonoids [6], which can substantially improve the health-promoting value of sprouts. However, cultivars vary markedly in germination rate, morphological development, and the capacity to accumulate bioactive compounds. These variations often result in unstable yield and quality performance under identical production conditions [6,7]. Therefore, clarifying inter-cultivar differences and establishing an evaluation system oriented toward industrial demands are critical for the selection of specialized cultivars for sprout production.
In sprout production, the edible ratio and yield efficiency more accurately reflect commercial value than biomass alone [6], as they directly determine the proportion of usable tissue and processing efficiency. However, existing studies have largely focused on growth traits such as seedling length or fresh weight, while comparatively few have integrated production efficiency with bioactive and antioxidant-related quality in a comprehensive evaluation [8,9]. This limitation constrains the precise assessment of cultivar suitability for commercial sprout production [8,10]. Meanwhile, the relationship between bioactive and antioxidant-related quality and organ growth in sprouts remains uncertain. Coordinated development between aboveground and belowground organs may influence water and mineral nutrient uptake as well as metabolic regulation, thereby affecting the accumulation of phenolic compounds and antioxidant capacity. Nevertheless, supporting evidence within pea sprout systems remains relatively limited [8].
In addition to sprouts, fresh pea seeds represent an important edible product, and their nutritional quality and health-related characteristics also exhibit marked cultivar differences. Phenolic compounds and their antioxidant activity, vitamins C and E, carotenoids and soluble sugars [11,12], as well as mineral elements such as Se, Fe, Zn, K, and Ca [13], collectively determine the nutritional value and health-promoting potential of fresh seeds. However, studies integrating growth performance, yield efficiency, bioactive quality, and mineral nutrition across both sprout and fresh seed stages within the same germplasm set remain scarce. This gap restricts the multi-purpose utilization of pea germplasm resources and the implementation of precision breeding strategies [14].
In recent years, with growing consumer interest in nutrient-dense sprouts and plant-based functional foods, sprouts have emerged as a rapidly developing market segment with considerable application potential [3]. To address the knowledge gap described above, twelve pea cultivars were selected for this study. The objectives were to: (1) clarify cultivar differences in growth performance and production efficiency of pea sprouts and identify suitable genotypes; (2) characterize the dynamic patterns of phenolic accumulation and antioxidant activity during germination and their relationships with growth traits; and (3) assess the genetic diversity of nutritional quality in fresh seeds and screen superior cultivars. The findings are expected to provide a theoretical basis and germplasm support for the selection of specialized pea cultivars for sprout production, the improvement of fresh seed nutritional quality, and the breeding of pea cultivars with superior nutritional and bioactive traits.

2. Materials and Methods

2.1. Materials

Twelve pea (Pisum sativum L.) cultivars were used as experimental materials. The cultivar codes were 24-010, 24-723, 24-724, 24-486, 24-013, 24-606, 24-647, 24-609, 24-638, 24-515, 24-164, and 24-510. All materials were obtained from the Mid-Term National Germplasm Resource Bank for Drought-Resistant and Salt-Alkali Tolerant Crops (Jinan). Seeds used for sprout experiments originated from a single seed multiplication lot harvested in 2022 and were stored at 4 °C and 40% relative humidity prior to use.

2.2. Methods

2.2.1. Cultivation, Sampling, and Determination of Growth and Quality Parameters of Pea Sprouts

Healthy, plump, and uniformly sized pea seeds were selected based on full expansion, round shape, bright green color, cultivar-appropriate maturity, and the absence of visible mechanical damage or decay. Two layers of medium-speed qualitative filter paper (Grade GB/T 1914-93, Beijing, China) were thoroughly moistened with tap water and placed at the bottom of a transparent germination box (12 cm × 12 cm) with a lid. Seeds were evenly arranged in a 5 × 6 pattern (30 seeds per box) and covered with an additional layer of moist filter paper. During cultivation, the filter paper was moistened with 5 mL of tap water three times daily (08:00, 12:00, and 16:00) to maintain saturated moisture conditions without visible standing water. The germination boxes were placed in an artificial climate chamber and incubated in darkness for 5 days at 25 °C and 80% relative humidity. Subsequently, the seedlings were transferred to light conditions with a 12 h photoperiod using a GreenFuture artificial climate chamber(GREENFUTURE, Shanghai, China) equipped with four-color LED light sources (red: 660 nm, blue: 450 nm, green: 520 nm, and white: 400–700 nm) at a light intensity of 19,800 lx. The temperature during the light phase was maintained at 25 °C. Each treatment included three biological replicates.
Sampling was performed at four stages: one day before light exposure (S1), and on the first (S2), second (S3), and third (S4) days after light exposure. At each stage, 1.5 g of seedlings were collected per replicate. Morphological traits, including seedling length, stem diameter, root length, and root diameter, were measured immediately after sampling. The remaining material was rapidly frozen in liquid nitrogen and stored at −80 °C for subsequent biochemical analyses.
(1)
100-Seed Weight Determination (S0)
Before sowing, 100-seed weight was determined by randomly selecting 100 dry seeds and weighing them. The measurement was repeated three times, and the mean value was expressed as g per 100 seeds.
(2)
Measurement of Growth Traits (S1–S4)
At stages S1, S2, S3, and S4, seedling length, stem diameter, root length, and root diameter were measured. Seedling length was defined as the length of the aboveground part from the base of the hypocotyl to the apex and was measured with a standard ruler (accuracy 1 mm). Root length was defined as the length of the primary root and was measured using the same ruler. Stem diameter and root diameter were measured using a vernier caliper; stem diameter was measured at the middle of the hypocotyl, and root diameter approximately 1 cm below the root–shoot junction along the primary root. Mean values were calculated for each trait.
(3)
Determination of Total Phenolics, Total Flavonoids, and Antioxidant Capacity (S0–S4)
Samples collected at stages S0–S4 were immediately frozen in liquid nitrogen and stored for analysis. Total phenolic content, total flavonoid content, 2,2′-azino-bis (3-ethylbenzothiazoline-6-sulfonic acid) (ABTS) radical scavenging activity, and ferric reducing antioxidant power (FRAP) were determined using commercial assay kits (Grace Biotechnology Co., Ltd., Suzhou, China). Total phenolic content was expressed as gallic acid equivalents (mg GAE g−1 FW) using kit catalog No. G0117W [15,16]; total flavonoid content as rutin equivalents (mg RE g−1 FW) using kit catalog No. G0118W48 [17]; ABTS activity as Trolox equivalents (μg TE g−1 FW) using kit catalog No. G0127W [18,19]; and FRAP activity as Trolox equivalents (μmol TE g−1 FW) using kit catalog No. G0115W [20,21,22]. Each treatment included three biological replicates.
(4)
Determination of Biomass and Edible Portion (S4)
At stage S4, sprouts were harvested and surface moisture was gently removed before weighing the fresh weight of the whole plant, which was recorded as total biomass. The edible portion (aboveground part) was then separated and weighed for fresh weight. The edible ratio and yield efficiency were calculated as follows:
Edible Ratio (%) = (Fresh weight of edible portion/Total biomass) × 100%.
Yield efficiency (%) = (Fresh weight of edible portion/Total weight of seeds sown) × 100%

2.2.2. Sampling and Determination of Quality Parameters of Fresh Seeds

The twelve pea cultivars were cultivated in the experimental field of the Qingdao Academy of Agricultural Sciences (Qingdao, China). Fresh pods were harvested at 20 days after anthesis (DAA), when seeds had reached the mature-green stage, were fully expanded, uniformly rounded, bright green in color, and exhibited a dry matter content of approximately 35–40%. Three biological replicates were established for each cultivar, and six fresh pods were randomly collected from different plants per replicate. After harvest, samples were immediately frozen in liquid nitrogen and stored at −80 °C until analysis. Prior to measurement, pods were shelled and fresh seeds were used for all quality determinations.
(1)
Determination of Quality Indices
Fresh seeds of each cultivar were analyzed for carotenoids [23], total soluble sugars [24,25], vitamin E [26], ascorbic acid (AsA)/vitamin C, total phenolics, total flavonoids, ABTS radical scavenging activity, and FRAP. All indices were determined using commercial assay kits (Grace Biotechnology Co., Ltd., Suzhou, China), following the manufacturer’s instructions. Each treatment included three biological replicates.
(2)
Determination of Mineral Elements
The contents of selenium (Se), iron (Fe), zinc (Zn), potassium (K), and calcium (Ca) in fresh seeds were determined by Grace Biotechnology Co., Ltd. (Suzhou, China). Samples were digested using an HNO3-HClO4 (4:1, v/v) mixture. Briefly, 0.5 g of fresh sample was pre-digested overnight in 10 mL of the acid mixture, then digested stepwise at 100 °C for 30 min, 150 °C for 1 h, and 180 °C for 2 h until the solution became clear. After evaporation to near dryness, the residue was diluted to 25 mL with 2% HNO3 and filtered. Selenium content was determined by ICP-MS [27] (PerkinElmer NexION 1000) using 74Ge as the internal standard, while Fe, Zn, K, and Ca were determined by atomic absorption spectrometry (AAS; Beijing Purkinje TAS-990) [28,29,30], following standard methods and published procedures for plant mineral analysis.

2.2.3. Data Processing and Statistical Analysis

Experimental data were organized and preliminarily processed using Microsoft Excel 2021. Statistical analyses were performed using IBM SPSS Statistics 24. Prior to one-way ANOVA, normality of residuals was assessed using the Shapiro–Wilk test and homogeneity of variances using Levene’s test. When the ANOVA indicated significant differences, multiple comparisons were performed using the least significant difference (LSD) test at p < 0.05. Correlation analysis was conducted in RStudio (R version 4.5.0) using the Hmisc package to calculate correlation coefficients and significance levels, and the corrplot package to generate correlation plots. Figures were prepared using GraphPad Prism 8. For the sprouting experiment, three independent biological replicates were used, each represented by a separate germination box. For biochemical assays, technical replicates were measured from each biological replicate and their mean values were used for statistical analysis. Results are presented as mean ± standard deviation (mean ± SD).

3. Results

3.1. Growth Traits and Bioactive Quality Differences in Pea Sprouts

3.1.1. Changes in Growth Traits of Different Pea Cultivars During the Sprouting Stage

Growth traits of pea sprouts were measured at four key developmental stages (S1–S4) during germination. The results showed that cultivars 24-164 and 24-510 exhibited severe cotyledon decay, characterized by water-soaked softening and mold growth, leading to very low germination rates. Cultivar 24-510, a fresh-eating sweet pea cultivar, has a thin seed coat and high starch content; under high-humidity, enclosed conditions, its seed coat may rupture and nutrients may leak, thereby promoting microbial infection and cotyledon decay. Therefore, these two cultivars were considered unsuitable for sprout production and were excluded from subsequent analyses.
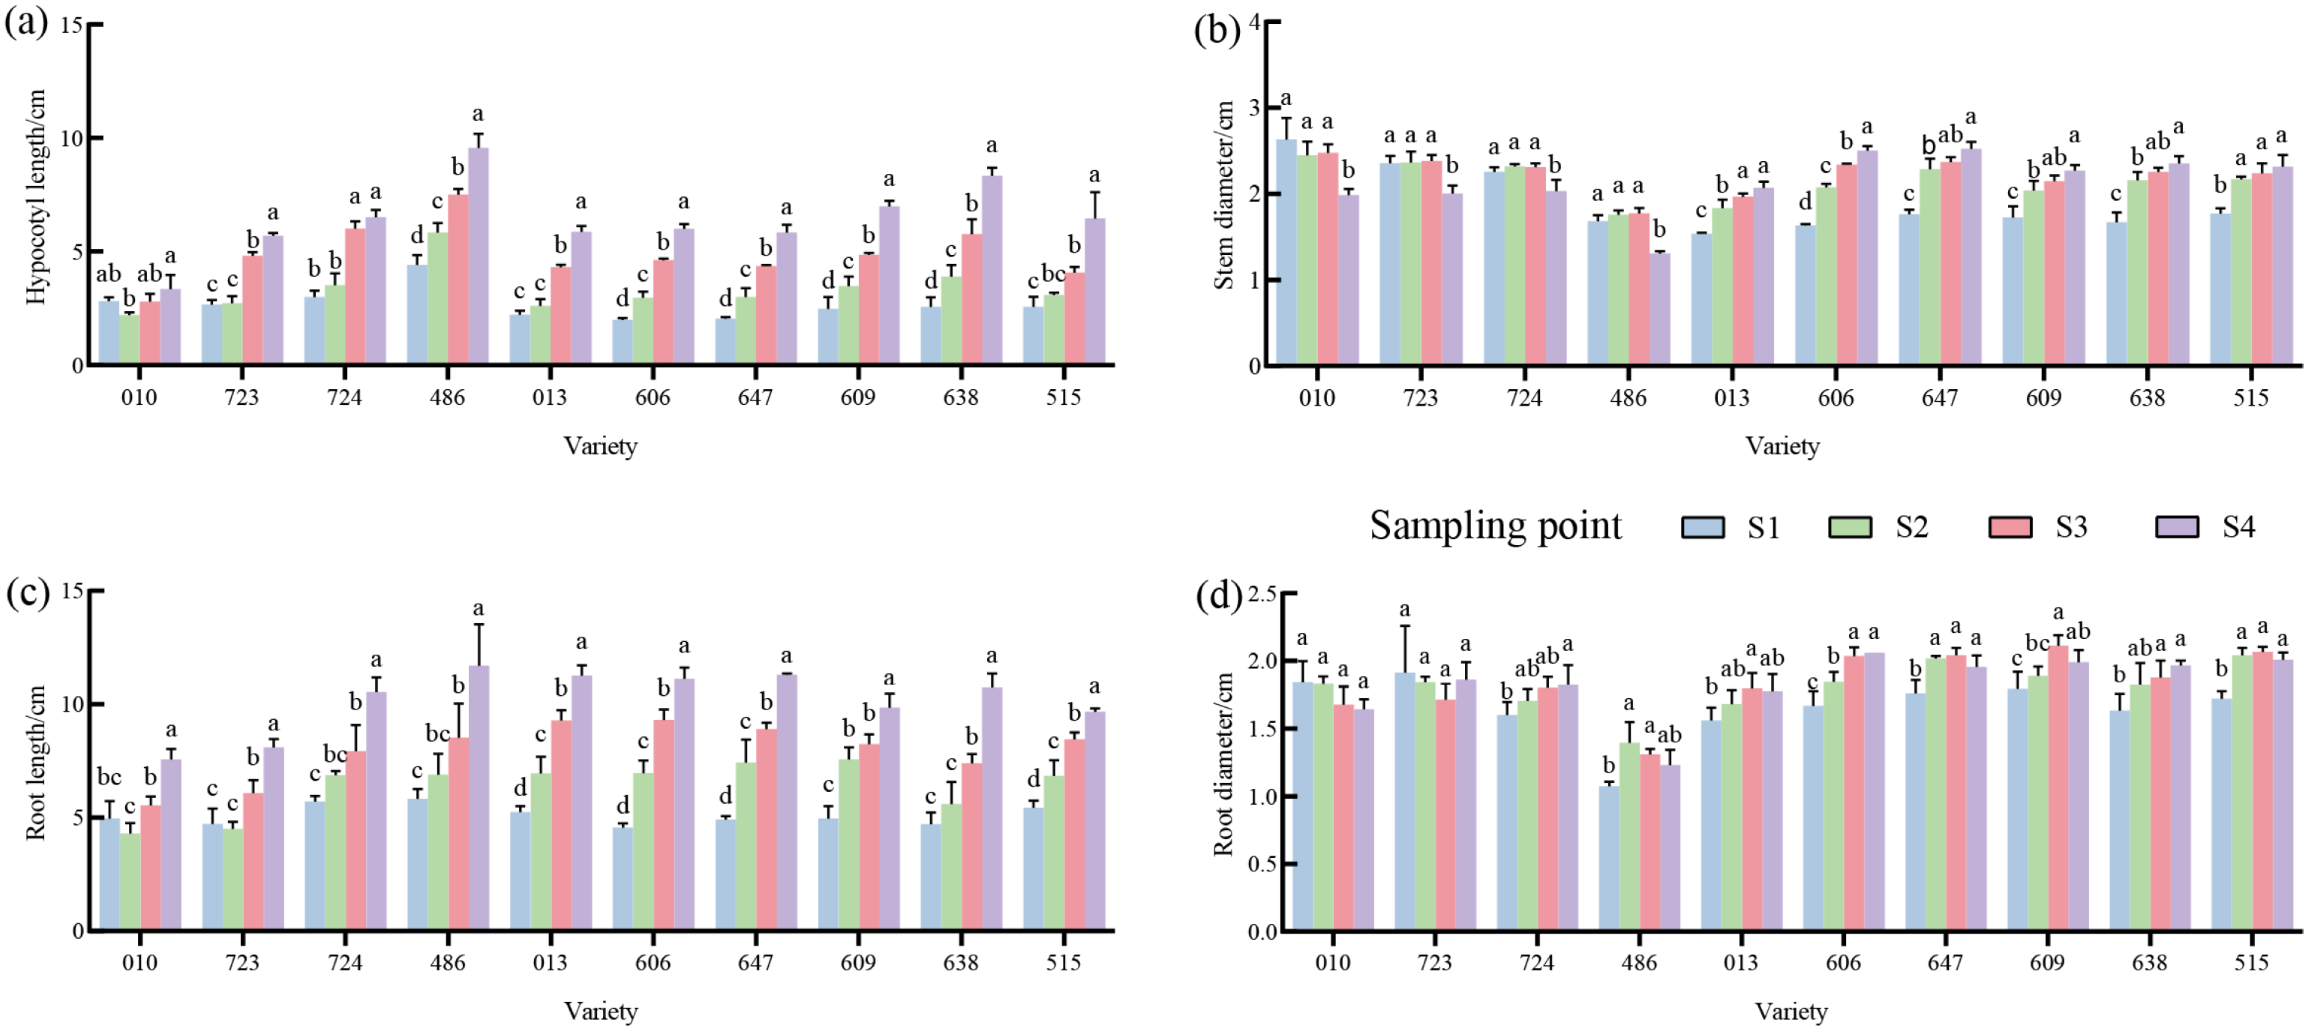
Among the remaining ten cultivars, seedling length generally increased during germination, except in cultivar 24-010, and reached its maximum value at stage S4. Marked variation in the rate of seedling elongation was observed among cultivars, with cultivar 24-486 consistently showing a relatively rapid elongation rate across all stages. Regarding stem diameter, only cultivar 24-606 showed marked differences among developmental stages, whereas changes in the other cultivars were relatively minor. Root diameter increased overall, with most cultivars peaking at S4; for example, cultivar 24-486 increased from 1.11 ± 0.03 mm at S1 to 1.29 ± 0.02 mm at S4, and cultivar 24-606 from 1.71 ± 0.08 mm to 2.06 ± 0.00 mm (Table 1, root diameter column). Root length increased more gradually, and inter-cultivar differences were smaller compared with other traits; for example, cultivar 24-486 increased from 6.33 ± 0.02 cm at S1 to 13.42 ± 0.08 cm at S4 (Table 1; Figure 1).

3.1.2. Yield Traits and Yield Efficiency of Different Pea Cultivars During the Sprouting Stage

At stage S4, the 100-seed weight, total biomass, fresh weight of the edible portion, edible ratio, and yield efficiency of sprouts from ten pea cultivars were evaluated. All yield-related traits differed significantly among cultivars (p < 0.01). The 100-seed weight ranged from 8.60 to 29.00 g, with cultivar 24-486 showing the lowest value and cultivar 24-647 the highest. Total biomass was highest in cultivar 24-609 (137.05 g per 100 plants) and lowest in cultivar 24-486. The fresh weight of the edible portion was greatest in cultivar 24-638 (40.95 g per 100 plants), whereas cultivar 24-010 had the lowest value. Marked cultivar differences were also observed in edible ratio and yield efficiency. Cultivars 24-724 and 24-486 exhibited the highest edible ratios and yield efficiencies, indicating superior processing efficiency and utilization value for sprout production. In contrast, cultivars 24-010, 24-647, and 24-609 showed relatively lower edible ratios and yield efficiencies (Table 2).

3.1.3. Changes in Phenolic Compounds and Antioxidant Activity During Germination of Different Pea Sprout Cultivars

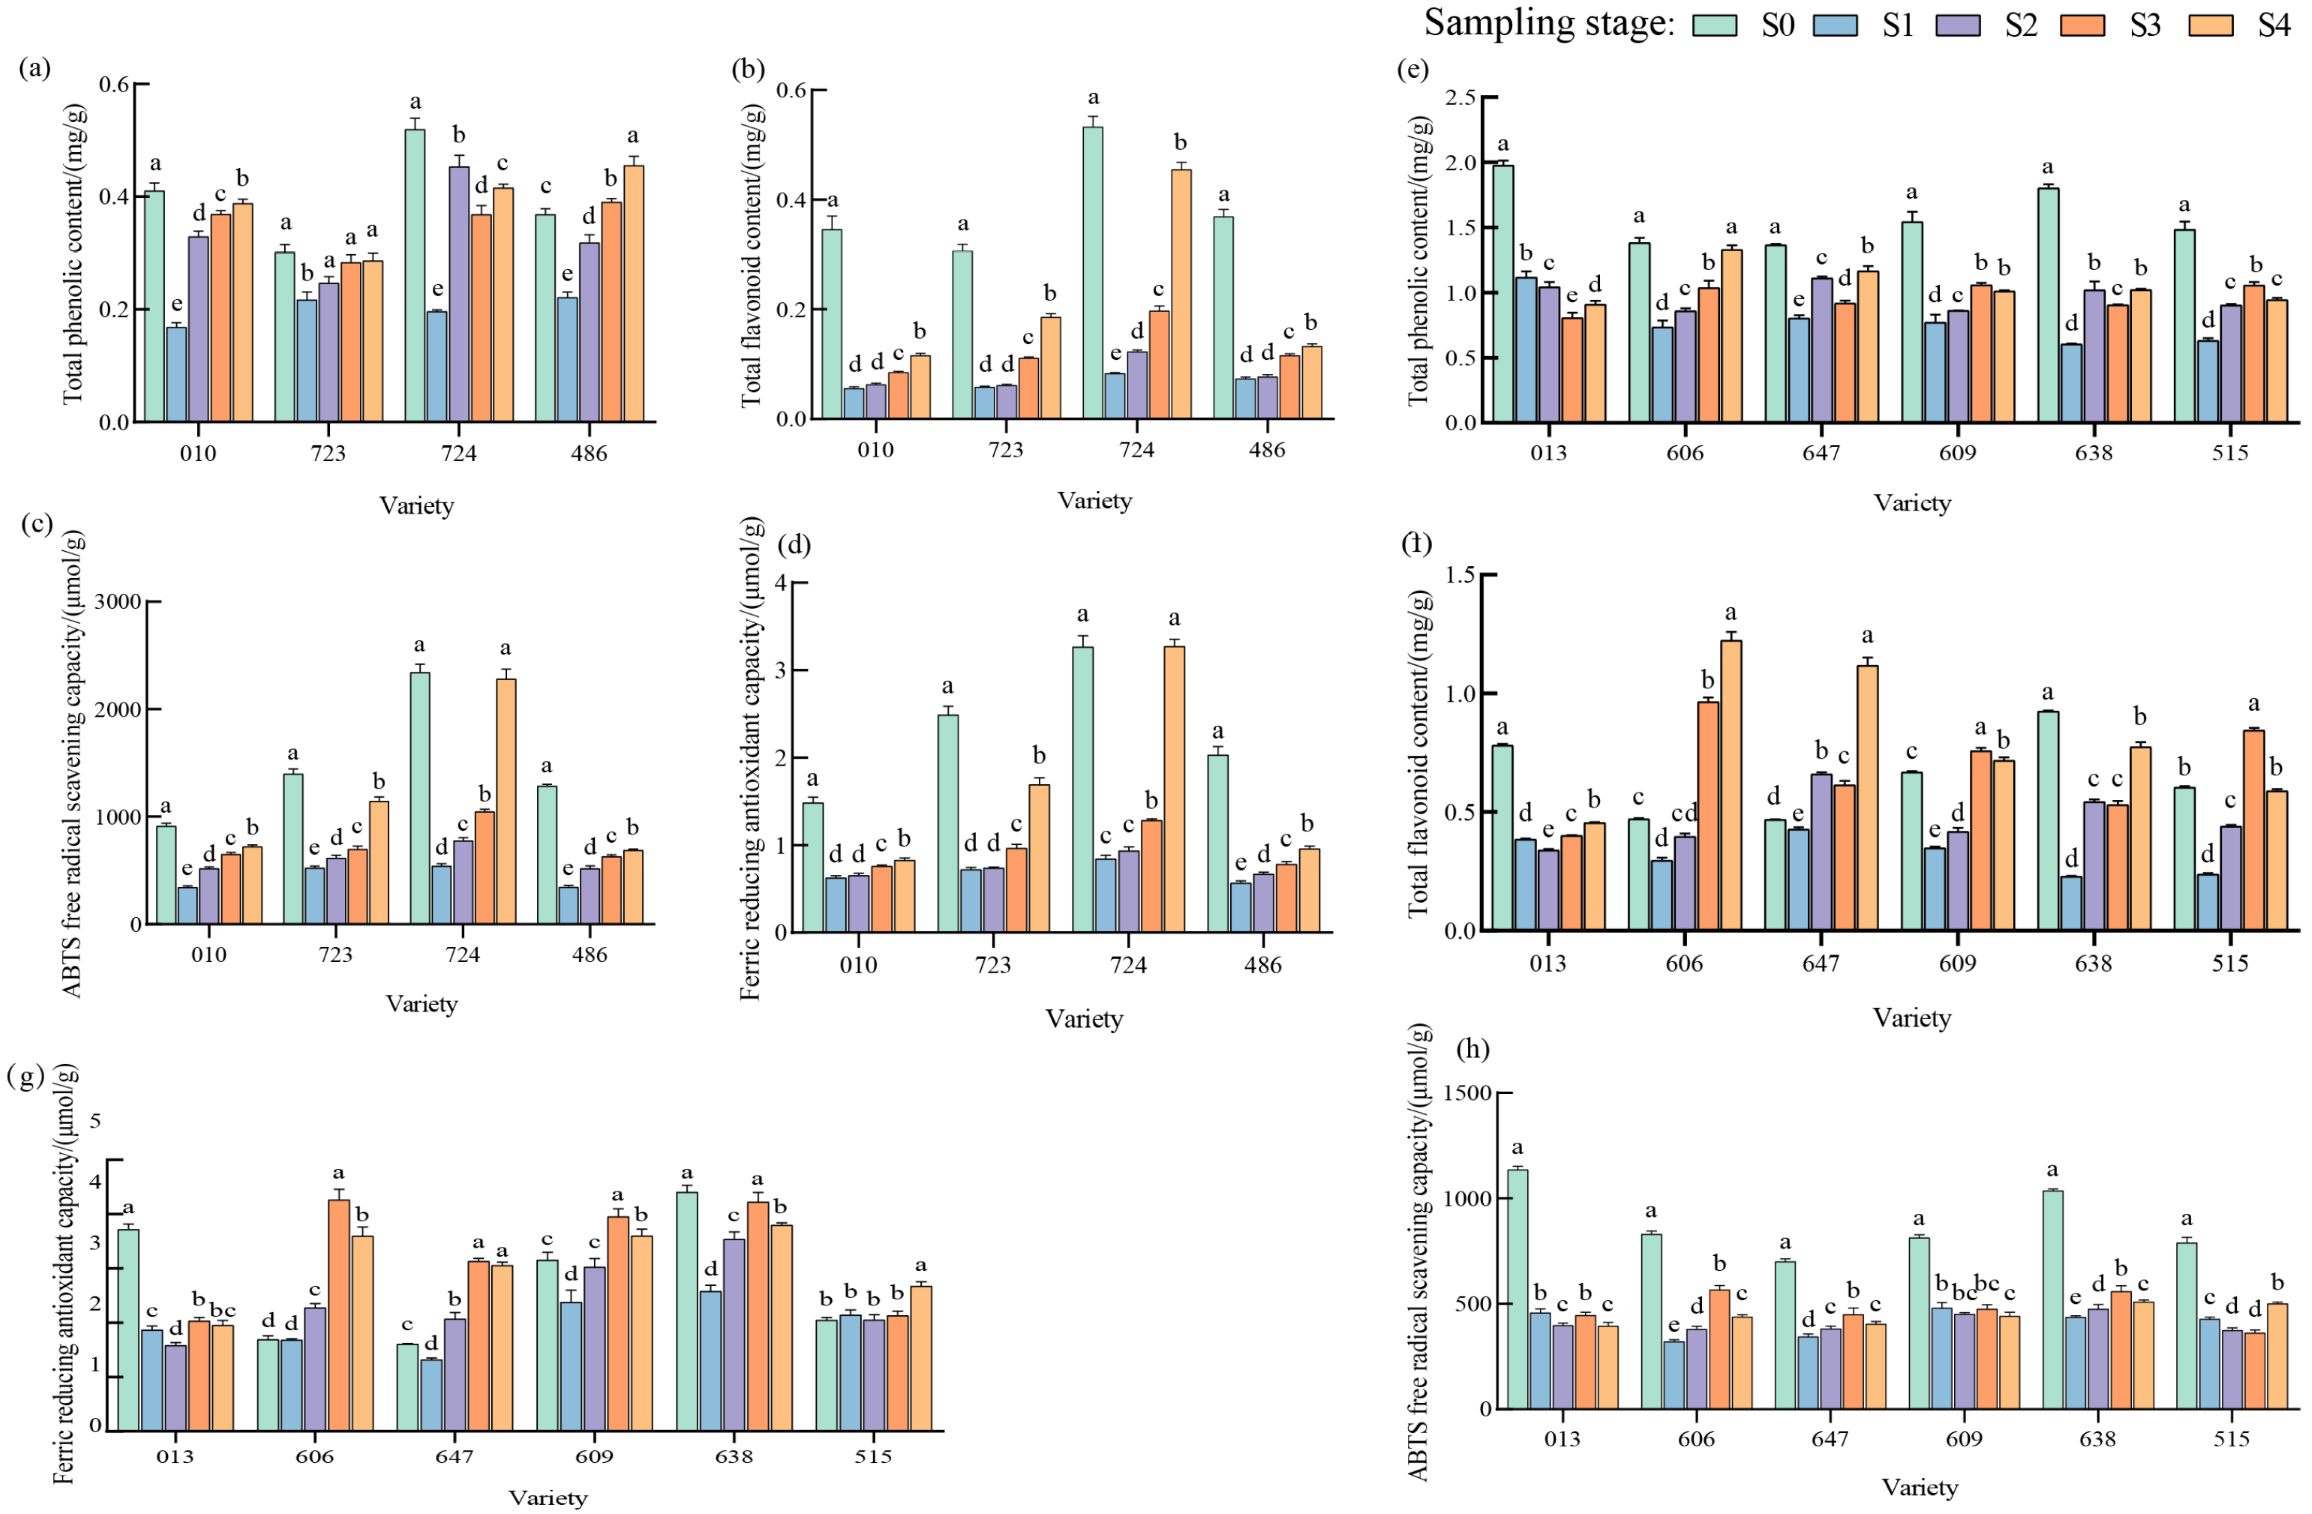
During germination (S0–S4), significant cultivar- and developmental stage-dependent differences (p < 0.05) were observed in total phenolic content (TPC), total flavonoid content (TFC), and antioxidant activities (ABTS and FRAP) among pea sprout cultivars. Overall, the total phenolic content of most cultivars increased with prolonged light exposure, reaching a peak at stages S3–S4. However, in a few cultivars, such as 24-013, the peak occurred earlier at stage S2 (Figure 2a,e), indicating earlier initiation of phenolic biosynthesis. Differences in total flavonoid content among cultivars were more pronounced, reflecting genotypic variation in flavonoid metabolism (Figure 2b,f). The trends in ABTS and FRAP antioxidant activities were generally consistent with those of phenolic compounds. Most cultivars exhibited the strongest antioxidant capacity at stage S4, whereas cultivar 24-638 showed relatively high antioxidant activity as early as stage S2, suggesting earlier activation of antioxidant metabolism (Figure 2c,d,g,h).

3.1.4. Correlation Analysis Between Growth Traits and Antioxidant Activity

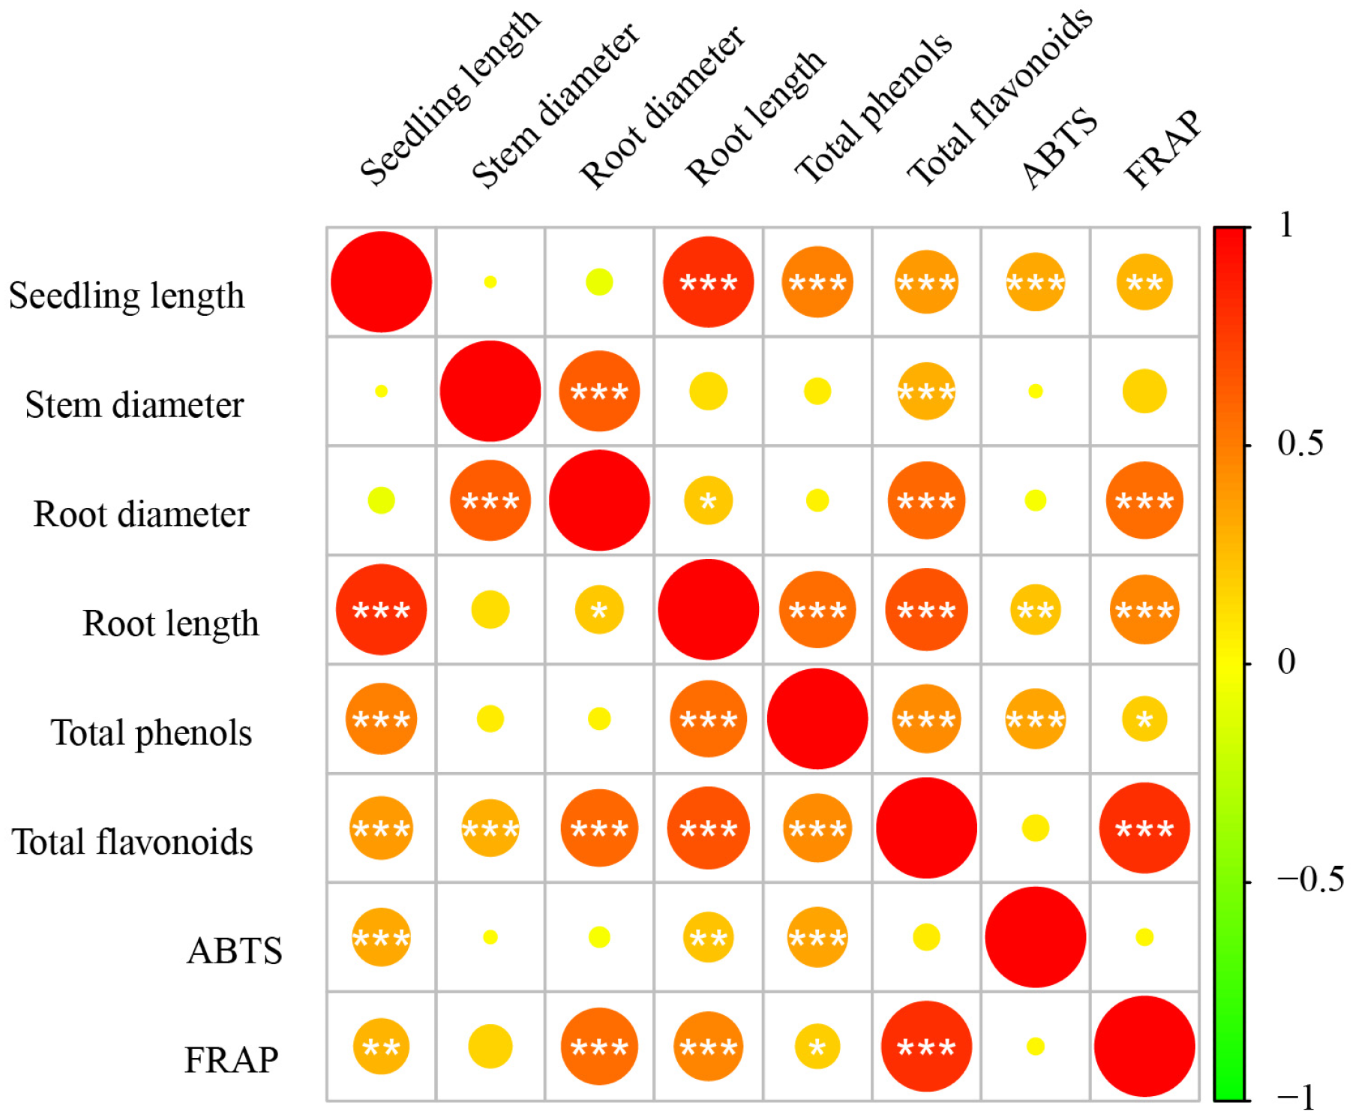
Correlation analysis showed that growth traits, including seedling length, stem diameter, root length, and root diameter, were all significantly and positively correlated with each other, with correlation coefficients ranging from 0.44 to 0.68 (p < 0.01), reflecting coordinated organ development during pea sprout growth. Root length and root diameter were significantly and positively correlated with total phenolic content (r = 0.61 and 0.64, respectively, p < 0.01), total flavonoid content (r = 0.58 and 0.60, respectively, p < 0.01), ABTS activity (r = 0.54 and 0.57, respectively, p < 0.01), and FRAP activity (r = 0.56 and 0.59, respectively, p < 0.01), whereas the correlations between aboveground growth traits and antioxidant indices were relatively weaker (Figure 3). In addition, total phenolic and total flavonoid contents were positively correlated with both antioxidant activity indicators, consistent with the major contribution of phenolic compounds to the antioxidant capacity of pea sprouts. These results suggest a positive association between root development and antioxidant-related traits, providing a useful basis for selecting pea sprout cultivars with superior bioactive quality.

3.2. Differences in Nutritional Quality and Bioactive Traits of Fresh Seeds Among Pea Cultivars

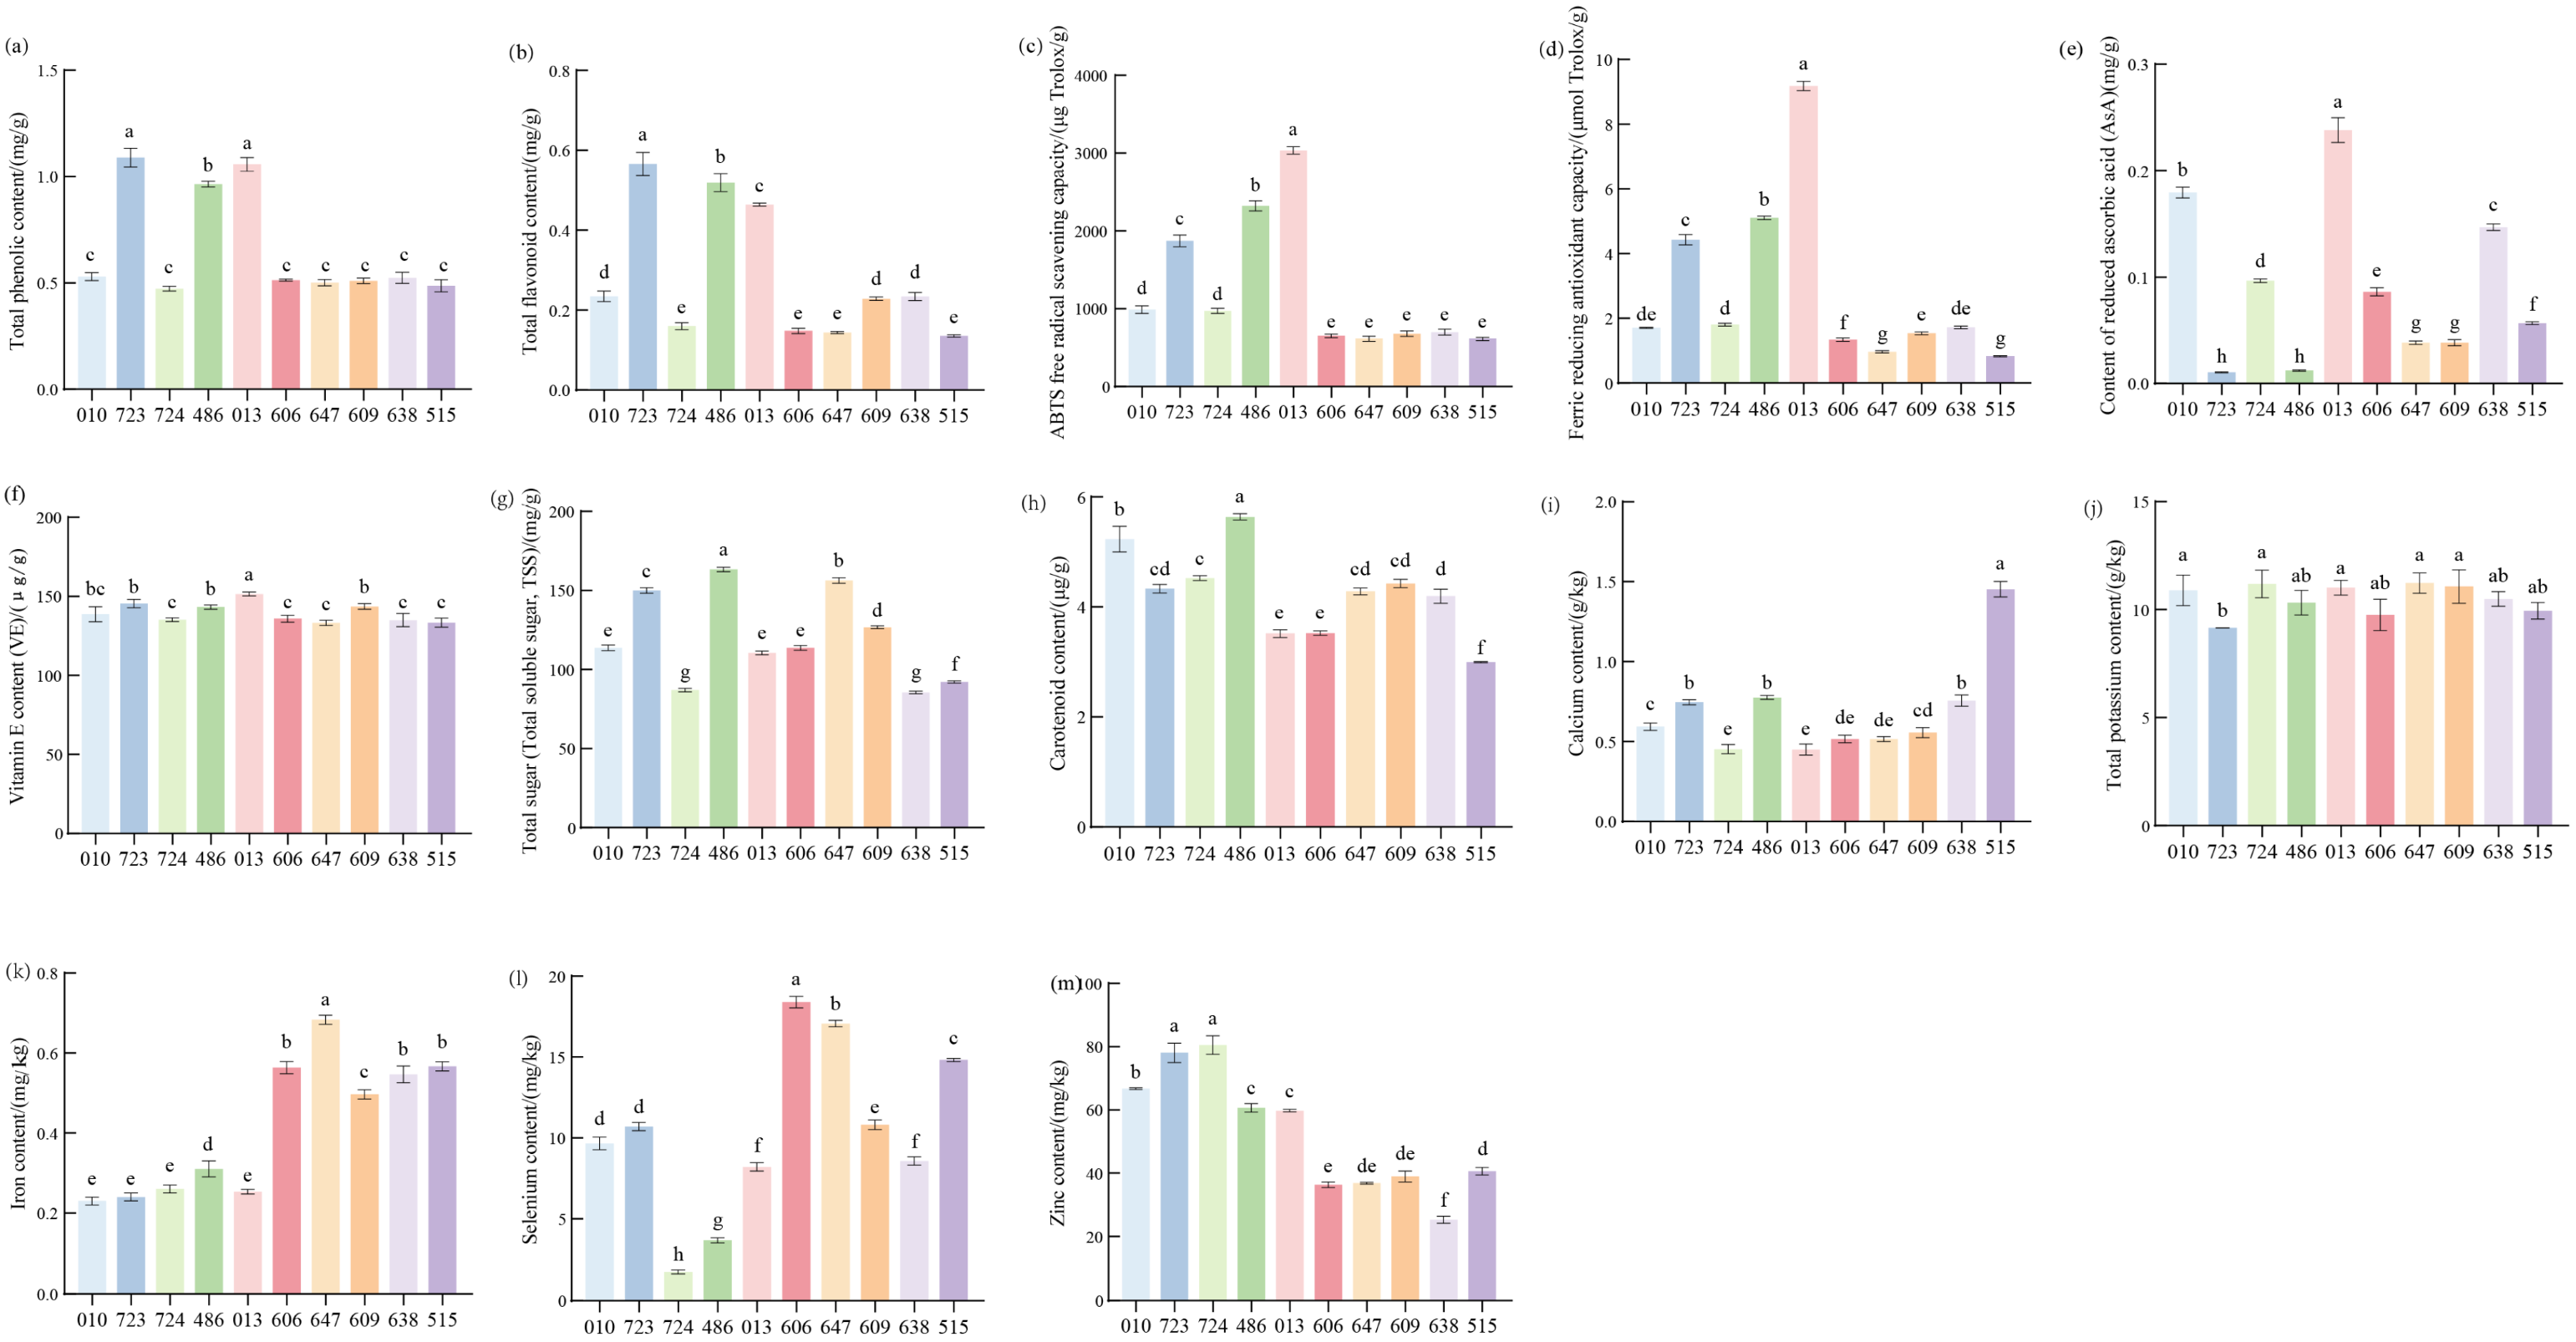
Fresh seeds from the 12 pea cultivars showed significant variation in phenolic compounds, flavonoids, antioxidant activity (ABTS and FRAP), vitamins (AsA and VE), total sugars, carotenoids, and mineral elements (Se, Fe, Zn, K, and Ca) (p < 0.01, Figure 4). These results reflect pronounced genetic diversity in both nutritional and bioactive traits.
Cultivar 24-486 consistently exhibited the highest levels of total phenolics (1.22 mg GAE g−1 FW), total flavonoids (0.86 mg RE g−1 FW), ABTS activity (2686.6 μg TE g−1 FW), FRAP activity (7.61 μmol TE g−1 FW), vitamin C (0.25 mg g−1 FW), vitamin E (200 mg kg−1 FW), and selected microelements, including Fe (0.6 mg g−1 FW) and Se (20 μg g−1 FW), indicating strong potential for bioactive and nutritional applications. Cultivars such as 24-010 and 24-638 generally showed lower phenolic accumulation and antioxidant activity, whereas cultivar 24-164 also exhibited relatively high ABTS activity (3035.9 μg TE g−1 FW). These trends indicate that phenolic compounds are major contributors to antioxidant capacity in pea seeds.
In terms of sugar and carotenoid content, cultivars 24-486, 24-723, and 24-647 had total sugar contents exceeding 150 mg g−1 FW, whereas cultivars 24-609 and 24-010 ranged between 100 and 150 mg g−1 FW. Carotenoid accumulation was highest in cultivar 24-724 (6 mg g−1 FW), whereas cultivars 24-010 and 24-647 showed lower levels, indicating cultivar differences in pigment-related nutrient biosynthesis.
For mineral elements, cultivar 24-013 had the highest calcium (1.5 mg g−1 FW) and potassium (15 mg g−1 FW) contents, whereas cultivar 24-010 had the highest zinc content (80 mg kg−1 FW). Cultivars 24-647 and 24-638 exhibited relatively lower levels of microelements, including Fe, Se, and Zn.
Overall, cultivar 24-486 combined high phenolic content, antioxidant activity, vitamins, and selected microelements, making it a superior cultivar for both nutritional and bioactive applications. Cultivar 24-013 excelled in macroelement accumulation, whereas cultivars such as 24-010 and 24-647 consistently showed lower nutritional and bioactive indices. These low-performing cultivars may serve as reference materials for the breeding and selection of high-quality pea cultivars.

4. Discussion

4.1. Varietal Differences in Growth Traits of Pea Sprouts

Our study demonstrated that the germination capacity and early growth traits of pea sprouts varied significantly among cultivars, reflecting differences in genetic background and seed reserve utilization efficiency. Cultivars 24-164 and 24-510 exhibited low germination rates and severe cotyledon decay, indicating that not all fresh-consumption pea cultivars are suitable for sprout production. In contrast, cultivar 24-486 consistently showed rapid hypocotyl elongation and robust root development across all stages, indicating strong early growth vigor and suitability for short-cycle sprout cultivation. These findings are consistent with previous studies showing that seed vigor and genotype strongly influence sprout growth performance [31,32]. The coordinated development of shoot and root traits observed in cultivar 24-486 may facilitate efficient nutrient and water uptake during early growth, which is important for the production of uniform, high-quality sprouts [33,34].

4.2. Yield Formation and Edible Efficiency

The commercial value of pea sprouts depends not only on total biomass but also on the proportion of edible tissue and the efficiency of converting seed mass into harvestable biomass [35,36]. Our results showed that cultivars 24-724 and 24-486 achieved the highest edible ratios and total biomass, whereas some cultivars with relatively high total biomass showed lower edible ratios, thereby reducing their practical value for sprout production. These findings suggest that breeding and selection for sprout production should consider edible efficiency in addition to biomass alone.

4.3. Phenolic Accumulation and Antioxidant Activity

Significant cultivar- and developmental stage-dependent differences were observed in total phenolics, flavonoids, and antioxidant activity during sprouting. In most cultivars, phenolic compounds accumulated progressively after light exposure and reached relatively high levels at stages S3–S4, indicating that light is an important environmental factor promoting phenolic metabolism [6]. Cultivar 24-638 exhibited relatively high antioxidant activity at an earlier stage, suggesting more rapid induction of antioxidant metabolism. The positive correlations between phenolic content and antioxidant activity are consistent with the established role of phenolic compounds as major contributors to antioxidant capacity in legume sprouts. These findings highlight the potential of specific cultivars for developing sprouts with enhanced bioactive quality.

4.4. Nutritional Quality of Fresh Seeds

Fresh seeds showed substantial cultivar-dependent differences in vitamins, sugars, carotenoids, and mineral elements [11]. Cultivar 24-486 exhibited the highest values for phenolic content, antioxidant activity, vitamin C, vitamin E, and selected microelements, whereas cultivar 24-013 showed a clear advantage in calcium and potassium accumulation. These differences highlight the genetic diversity of pea germplasm and support the possibility of selecting cultivars for dual-purpose use, including both sprout production and fresh seed consumption. They also suggest the feasibility of improving both nutritional quality and bioactive traits through targeted breeding.

4.5. Implications for Cultivar Selection, Breeding, and Industrial Applications

Overall, cultivars 24-724 and 24-486 are promising for specialized sprout production because of their high edible ratios, high yield efficiencies, and strong antioxidant-related traits. Cultivar 24-486 also exhibited superior performance in fresh seed nutritional quality, making it a promising dual-purpose genotype. In contrast, cultivar 24-013 showed stronger macroelement accumulation but relatively weaker antioxidant performance, indicating a different utilization value. These differences provide useful guidance for cultivar selection and targeted breeding according to intended end use, including sprout production, fresh seed consumption, or dual-purpose application [37]. Future studies should further examine genotype × environment interactions, optimize light and nutrient conditions for bioactive compound accumulation, and investigate the molecular basis of cultivar differences in these traits [13].

4.6. Limitations of the Study

Several limitations should be acknowledged in this study. First, the sprout observation period was limited to three days after light exposure and therefore may not fully capture long-term changes in phenolic accumulation and antioxidant activity. Second, biochemical analyses were based on commercial colorimetric kits rather than chromatographic techniques such as HPLC or LC-MS, which limits identification of individual [37]. Third, fresh seeds were produced under field conditions, whereas sprouts were grown in a controlled climate chamber, which may complicate direct comparisons between the two utilization stages [31]. Finally, cultivars 24-164 and 24-510 were excluded from sprout evaluation because of poor germination and cotyledon decay, limiting assessment of their dual-purpose potential [6]. Future studies should address these limitations by extending the observation period, using more advanced analytical methods, aligning environmental conditions across production systems, and evaluating a broader range of germplasm [38].

5. Conclusions

Marked cultivar-level variation was observed in growth performance, yield traits, antioxidant capacity, and nutritional quality among the tested pea cultivars. Not all cultivars evaluated were suitable for sprout production; cultivars 24-724 and 24-486 exhibited the highest edible ratios and yield efficiencies, identifying them as promising candidates for specialized sprout cultivation. Phenolic compounds were the primary determinants of antioxidant capacity in both pea sprouts and fresh seeds, and their accumulation was jointly influenced by genotype and light exposure stage. Root morphological traits, particularly root length and root diameter, were positively associated with the accumulation of phenolic compounds and flavonoids in pea sprouts.
Among fresh seeds, cultivar 24-486 exhibited the highest values for phenolic content, flavonoid content, antioxidant activity, vitamin C, vitamin E, and selected microelements, whereas cultivar 24-013 showed the highest calcium and potassium contents. These findings provide a useful basis for selecting pea cultivars for sprout production, fresh seed utilization, and dual-purpose breeding. Future metabolomic and genomic studies may further clarify the genetic basis underlying these cultivar differences.

Author Contributions

C.-N.Z.: Data curation, Formal analysis, Investigation, Writing—original draft. J.B.: Investigation, Software, Supervision. Writing—original draft. X.-Y.Z.: Data curation, Resources, Writing—original draft. F.-J.S.: Data curation, Resources. J.-J.H.: Methodology, Supervision. S.-Z.Q.: Data curation, Validation. X.C.: Data curation, Validation. W.-J.W.: Visualization. K.-H.J.: Investigation, Writing—original draft. R.-M.T.: Funding acquisition, Supervision. M.L.: Software. G.L. and N.-N.L.: Conceptualization, Project administration, Writing—review & editing. All authors have read and agreed to the published version of the manuscript.

Funding

This research was supported by the Agricultural Science & Technology Innovation Project of SAAS (CXGC2026B21, CXGC2026C53), the Key R&D Program of Shandong Province, China (2025LZGC009, 2024TZXD017, 2024TZXD052), the National Natural Science Foundation of China (32401937), and the earmarked fund for Shandong Agriculture Research System (SDARS-15).

Data Availability Statement

The original contributions presented in this study are included in the article. Further inquiries can be directed to the corresponding author(s).

Conflicts of Interest

The authors declare no conflicts of interest.

References

  1. Lu, Z.X.; He, J.F.; Zhang, Y.C.; Bing, D.J. Composition, physicochemical properties of pea protein and its application in functional foods. Crit. Rev. Food Sci. Nutr. 2020, 60, 2593–2605. [Google Scholar] [CrossRef] [Scilit]
  2. Dahl, W.J.; Foster, L.M.; Tyler, R.T. Review of the health benefits of peas (Pisum sativum L.). Br. J. Nutr. 2012, 108, S3–S10. [Google Scholar] [CrossRef] [Scilit] [PubMed]
  3. Aloo, S.O.; Ofosu, F.K.; Kilonzi, S.M.; Shabbir, U.; Oh, D.H. Edible plant sprouts: Health benefits, trends, and opportunities for novel exploration. Nutrients 2021, 13, 2882. [Google Scholar] [CrossRef] [Scilit] [PubMed]
  4. Ferreira, H.; Vasconcelos, M.; Gil, A.M.; Pinto, E. Benefits of pulse consumption on metabolism and health: A systematic review of randomized controlled trials. Crit. Rev. Food Sci. Nutr. 2021, 61, 85–96. [Google Scholar] [CrossRef] [Scilit] [PubMed]
  5. Uhlarik, A.; Ćeran, M.; Živanov, D.; Grumeza, R.; Skøt, L.; Sizer-Coverdale, E.; Lloyd, D. Phenotypic and genotypic characterization and correlation analysis of pea (Pisum sativum L.) Diversity panel. Plants 2022, 11, 1321. [Google Scholar] [CrossRef] [Scilit]
  6. Zhao, T.; Quan, W.; Du, Z.; Xie, Q.; Kang, Y.; Xue, W. A comprehensive evaluation of pea germplasm resources through cluster and gray relational analyses. Genet. Resour. Crop Evol. 2023, 70, 1135–1149. [Google Scholar] [CrossRef] [Scilit]
  7. Poudel, P.; Connolly, E.L.; Kwasniewski, M.; Lambert, J.D.; Di Gioia, F. Zinc biofortification via fertigation using alternative zinc sources and concentration levels in pea, radish, and sunflower microgreens. Sci. Hortic. 2024, 331, 113098. [Google Scholar] [CrossRef] [Scilit]
  8. Wang, J.; Ma, Y.; Huang, X.; Song, L.; Li, N.; Cheng, Y.; Shen, Y.; Li, Q.; Li, T.; Hai, D. Changes in physio-biochemical metabolism, phenolics and antioxidant capacity of different Chinese pea varieties during germination. Int. J. Food Sci. Technol. 2023, 58, 167–180. [Google Scholar] [CrossRef] [Scilit]
  9. Wojdyło, A.; Nowicka, P.; Tkacz, K.; Turkiewicz, I.P. Sprouts vs. Microgreens as novel functional foods: Variation of nutritional and phytochemical profiles and their in vitro bioactive properties. Molecules 2020, 25, 4648. [Google Scholar] [CrossRef] [Scilit]
  10. Huang, X.; Li, W.; Wang, J.; Li, Q.; Shen, Y.; Cheng, Y.; Li, T.; Wang, T.; Wang, Y.; Song, L.; et al. Nacl stress on physio-biochemical, phenolics synthesis and antioxidant system of pea (Pisum sativum L.) Sprouts. LWT 2024, 210, 116821. [Google Scholar] [CrossRef] [Scilit]
  11. Thirumalai, M.; Sharma, V.K.; Tripathi, K.; Jain, A.; Angirekula, U.B.; Ali, S.; Rajkumar, S.; Wankhede, D.P.; Bollinedi, H.; Yadav, R. A comprehensive assessment of vegetable pea (Pisum sativum L.) Germplasm integrating multivariate data analysis with agro-morphological and biochemical characterisation. J. Agric. Food Res. 2025, 23, 102253. [Google Scholar] [CrossRef] [Scilit]
  12. Ballén Taborda, C.; Johnson, N.; Boatwright, L.; Lawrence, T.; Kay, J.; Windsor, N.; Madurapperumage, A.; Thavarajah, P.; Tang, L.; Shipe, E. Genome-wide association studies of nutritional traits in peas (Pisum sativum L.) For biofortification. Plant Genome 2025, 18, e70135. [Google Scholar] [CrossRef] [Scilit] [PubMed]
  13. Ton, A.; Mart, D.; Karaköy, T.; Türkeri, M.; Torun, A.A.; Anlarsal, A.E. Characterization of some local pea (Pisum sativum L.) Genotypes for agro-morphologicaltraits and mineral concentrations. Turk. J. Agric. For. 2022, 46, 245–256. [Google Scholar] [CrossRef] [Scilit]
  14. Benincasa, P.; Falcinelli, B.; Lutts, S.; Stagnari, F.; Galieni, A. Sprouted grains: A comprehensive review. Nutrients 2019, 11, 421. [Google Scholar] [CrossRef] [Scilit] [PubMed]
  15. Singleton, V.L.; Rossi, J.A., Jr. Colorimetry of total phenolics with phosphomolybdic-phosphotungstic acid reagents. Am. J. Enol. Vitic. 1965, 16, 144–158. [Google Scholar] [CrossRef] [Scilit]
  16. Kupina, S.; Fields, C.; Roman, M.C.; Brunelle, S.L. Determination of total phenolic content using the folin-c assay: Single-laboratory validation, first action 2017.13. J. AOAC Int. 2018, 101, 1466–1472. [Google Scholar] [CrossRef] [Scilit]
  17. Huang, R.; Wu, W.; Shen, S.; Fan, J.; Chang, Y.; Chen, S.; Ye, X. Evaluation of colorimetric methods for quantification of citrus flavonoids to avoid misuse. Anal. Methods. 2018, 10, 2575–2587. [Google Scholar] [CrossRef] [Scilit]
  18. Re, R.; Pellegrini, N.; Proteggente, A.; Pannala, A.; Yang, M.; Rice-Evans, C. Antioxidant activity applying an improved abts radical cation decolorization assay. Free Radic. Biol. Med. 1999, 26, 1231–1237. [Google Scholar] [CrossRef] [Scilit]
  19. Platzer, M.; Kiese, S.; Herfellner, T.; Schweiggert-Weisz, U.; Miesbauer, O.; Eisner, P. Common trends and differences in antioxidant activity analysis of phenolic substances using single electron transfer based assays. Molecules 2021, 26, 1244. [Google Scholar] [CrossRef] [Scilit]
  20. Benzie, I.F.; Strain, J.J. The ferric reducing ability of plasma (frap) as a measure of “antioxidant power”: The frap assay. Anal. Biochem. 1996, 239, 70–76. [Google Scholar] [CrossRef] [Scilit]
  21. Heckmann, M.; Stadlbauer, V.; Drotarova, I.; Gramatte, T.; Feichtinger, M.; Arnaut, V.; Atzmüller, S.; Schwarzinger, B.; Röhrl, C.; Blank-Landeshammer, B.; et al. Identification of oxidative-stress-reducing plant extracts from a novel extract library—Comparative analysis of cell-free and cell-based in vitro assays to quantitate antioxidant activity. Antioxidants 2024, 13, 297. [Google Scholar] [CrossRef] [Scilit] [PubMed]
  22. Suriyaprom, S.; Srisai, P.; Intachaisri, V.; Kaewkod, T.; Pekkoh, J.; Desvaux, M.; Tragoolpua, Y. Antioxidant and anti-inflammatory activity on lps-stimulated raw 264.7 macrophage cells of white mulberry (Morus alba L.) Leaf extracts. Molecules 2023, 28, 4395. [Google Scholar] [CrossRef] [Scilit] [PubMed]
  23. Singh, J.; Jayaprakasha, G.K.; Patil, B.S. Improved sample preparation and optimized solvent extraction for quantitation of carotenoids. Plant Foods Hum. Nutr. 2021, 76, 60–67. [Google Scholar] [CrossRef] [Scilit] [PubMed]
  24. Sumner, J.B.; Graham, V.A. Dinitrosalicylic acid: A reagent for the estimation of sugar in normal and diabetic urine. J. Biol. Chem. 1921, 47, 5–9. [Google Scholar] [CrossRef] [Scilit]
  25. Coddens, L.; De Schepper, C.F.; Brijs, K.; Courtin, C.M. Comparative evaluation of dns, pahbah, and bca colourimetric assays for quantifying reducing sugars. Carbohydr. Res. 2025, 560, 109770. [Google Scholar] [CrossRef] [Scilit]
  26. Christie, A.A.; Dean, A.C.; Millburn, B.A. The determination of vitamin e in food by colorimetry and gas-liquid chromatography. Analyst 1973, 98, 161–167. [Google Scholar] [CrossRef] [Scilit]
  27. Zhan, J.; Qi, M.; Wang, C.; Wang, X.; Wang, H.; Dun, X. Precise determination of selenium forms and contents in selenium-enriched rapeseed seedlings and flowering stalks by hplc-icp-ms. J. Agric. Food Chem. 2024, 72, 9477–9486. [Google Scholar] [CrossRef] [Scilit]
  28. Isaac, R.A.; Johnson, W.C. Collaborative study of wet and dry ashing techniques for the elemental analysis of plant tissue by atomic absorption spectrophotometry. J. Assoc. Off. Anal. Chem. 1975, 58, 436–440. [Google Scholar] [CrossRef] [Scilit]
  29. Ihnat, M. High reliability atomic absorption spectrometry of major and minor elements in biological materials. Fresenius’ Z. Anal. Chem. 1987, 326, 739–741. [Google Scholar] [CrossRef] [Scilit]
  30. Albakaa, A.; Ameen, D.; Abed, N.K.; Jabbar, Z.A.; Musaa, L.A. Quantification of ca, k, mg, zn and fe elements in grape leaves from different regions of iraq by atomic absorption spectroscopy. J. Phys. Conf. Ser. 2021, 1853, 12018. [Google Scholar] [CrossRef] [Scilit]
  31. Fowler, C.; Turner, D.W.; Siddique, K. Selection of field pea (Pisum sativum L.) Cultivar and growing site improves germination and uniformity for sprout production. Aust. J. Agric. Res. 2006, 57, 1249–1257. [Google Scholar] [CrossRef] [Scilit]
  32. Nonogaki, H. Seed germination and dormancy: The classic story, new puzzles, and evolution. J. Integr. Plant Biol. 2019, 61, 541–563. [Google Scholar] [CrossRef] [Scilit]
  33. Finch-Savage, W.E.; Bassel, G.W. Seed vigour and crop establishment: Extending performance beyond adaptation. J. Exp. Bot. 2016, 67, 567–591. [Google Scholar] [CrossRef] [Scilit]
  34. Kyriacou, M.C.; Rouphael, Y.; Di Gioia, F.; Kyratzis, A.; Serio, F.; Renna, M.; De Pascale, S.; Santamaria, P. Micro-scale vegetable production and the rise of microgreens. Trends Food Sci. Technol. 2016, 57, 103–115. [Google Scholar] [CrossRef] [Scilit]
  35. Harakotr, B.; Charoensup, L.; Rithichai, P.; Jirakiattikul, Y.; Suthamwong, P. Yield, bioactive compounds, and antioxidant potential of twenty-three diverse microgreen species grown under controlled conditions. Resources 2025, 14, 71. [Google Scholar] [CrossRef] [Scilit]
  36. Pae, S.; Ha, T.; Lee, M.; Hwang, C.; Shim, K.; Park, C.; Park, K.; Baek, I. Evaluation of characteristics of peanut sprout using korean cultivars. Korean J. Crop Sci. 2011, 56, 394–399. [Google Scholar] [CrossRef] [Scilit]
  37. Zhang, Q.; Yue, Y.; Li, X.; Zhang, C.; Guo, Y.; Wang, Z.; Li, J. Advances in analytical techniques for bioactive compound quantification in medicinal plants: Innovations, challenges, and pharmaceutical applications. Microchem. J. 2025, 214, 114119. [Google Scholar] [CrossRef] [Scilit]
  38. Majzoobi, M.; Wang, Z.; Teimouri, S.; Pematilleke, N.; Brennan, C.S.; Farahnaky, A. Unlocking the potential of sprouted cereals, pseudocereals, and pulses in combating malnutrition. Foods 2023, 12, 3901. [Google Scholar] [CrossRef] [Scilit]
Figure 1. Growth traits of 10 pea cultivars during sprouting. (a) Seedling length. (b) Stem diameter. (c) Root length. (d) Root diameter. Seedling length, stem diameter, root length, and root diameter were measured at four developmental stages (S1–S4, where S1 = one day before light exposure, and S2–S4 = the first to third day after light exposure). Data represent mean ± SD of three biological replicates. Different letters above bars indicate significant differences among cultivars at p < 0.05 (one-way ANOVA followed by LSD test). At S4, cultivar 24-486 exhibited the highest seedling length (8.92 ± 0.01 cm) and root length (13.42 ± 0.08 cm), whereas cultivar 24-010 showed the lowest values for most growth traits.
Agronomy 16 00784 g001
Figure 2. Dynamic changes in phenolic compounds and antioxidant activity of 10 pea cultivars during germination. (a,e) Total phenolic content. (b,f) Total flavonoid content. (c,h) ABTS free radical scavenging activity. (d,g) Ferric reducing antioxidant capacity. Data are presented as mean ± SD of three biological replicates. Different lowercase letters above the bars indicate significant differences among cultivars at the same developmental stage at p < 0.05.
Agronomy 16 00784 g002
Figure 3. Pearson correlation analysis between growth traits and antioxidant activity of pea sprouts. Growth traits include seedling length, stem diameter, root length, and root diameter. Antioxidant-related traits include TPC, TFC, ABTS, and FRAP. Significant correlations at p < 0.05 are indicated with asterisks (* p < 0.05, ** p < 0.01, *** p < 0.001). Data are based on three biological replicates per cultivar.
Agronomy 16 00784 g003
Figure 4. Differences in phenolic compounds, antioxidant activity, vitamins, sugars, and mineral elements among fresh seeds of 12 pea cultivars. (a) Total phenolic content. (b) Total flavonoid content. (c) ABTS free radical scavening capavity. (d) Ferric reducing antioxidant capavity. (e) Content of reduced ascorbic acid (AsA). (f) Vitamin E content. (g) Total soluble sugars. (h) Carotenoidscontent. (i) Calcium content. (j) Total potassium content. (k) Iron content. (l) Selenium content. (m) Zinc content. Data represent mean ± SD of three biological replicates. Different letters indicate significant differences among cultivars at p < 0.05 (one-way ANOVA followed by LSD test).
Agronomy 16 00784 g004
Table 1. Growth traits of 10 pea cultivars during germination.
Sampling StageCultivarHypocotyl Length (cm)Stem Diameter (mm)Root Diameter (mm)Root Length (cm)
S10102.92 ± 0.00 b2.49 ± 0.00 a2.02 ± 0.00 ab5.13 ± 0.00 c
7233.03 ± 0.08 b2.44 ± 0.03 a2.28 ± 0.01 a5.42 ± 0.02 bc
7243.03 ± 0.08 b2.27 ± 0.03 b1.59 ± 0.02 c5.47 ± 0.03 bc
4864.66 ± 0.13 a1.70 ± 0.00 c1.11 ± 0.03 d6.33 ± 0.02 a
0132.31 ± 0.06 d1.54 ± 0.01 d1.61 ± 0.06 c5.15 ± 0.13 c
6062.00 ± 0.05 e1.64 ± 0.01 d1.71 ± 0.08 bc4.46 ± 0.06 e
6472.05 ± 0.08 e1.74 ± 0.02 c1.71 ± 0.05 bc4.81 ± 0.05 cd
6092.11 ± 0.03 e1.72 ± 0.05 c1.76 ± 0.05 b4.73 ± 0.02 d
6382.74 ± 0.05 c1.79 ± 0.05 c1.71 ± 0.02 bc4.92 ± 0.03 cd
5152.90 ± 0.02 b1.81 ± 0.04 c1.77 ± 0.02 b5.62 ± 0.03 b
S20102.25 ± 0.17 e2.46 ± 0.14 a1.89 ± 0.04 ab4.82 ± 0.05 e
7232.75 ± 0.05 d2.37 ± 0.00 a1.88 ± 0.00 ab4.83 ± 0.04 e
7243.27 ± 0.18 c2.35 ± 0.00 a1.71 ± 0.00 b7.03 ± 0.00 c
4865.78 ± 0.18 a1.79 ± 0.01 c1.52 ± 0.08 c7.80 ± 0.00 a
0132.59 ± 0.06 d1.84 ± 0.06 c1.68 ± 0.01 bc6.73 ± 0.18 cd
6063.01 ± 0.24 c2.11 ± 0.09 b1.84 ± 0.02 ab7.09 ± 0.18 c
6473.25 ± 0.15 c2.44 ± 0.08 a2.02 ± 0.02 a8.08 ± 0.21 a
6093.31 ± 0.10 c2.06 ± 0.05 b1.88 ± 0.02 ab7.44 ± 0.10 b
6384.17 ± 0.20 b2.21 ± 0.03 b1.81 ± 0.00 b6.53 ± 0.03 d
5153.17 ± 0.00 c2.14 ± 0.00 b1.99 ± 0.00 a7.27 ± 0.00 bc
S30102.67 ± 0.17 f2.32 ± 0.04 a1.80 ± 0.02 b4.17 ± 0.16 e
7234.65 ± 0.02 d2.31 ± 0.03 a1.78 ± 0.00 bc5.55 ± 0.02 d
7246.32 ± 0.15 b2.29 ± 0.07 ab1.89 ± 0.02 b8.87 ± 0.01 b
4867.73 ± 0.03 a1.78 ± 0.01 c1.27 ± 0.04 d10.27 ± 0.01 a
0134.35 ± 0.02 d1.95 ± 0.03 c1.81 ± 0.03 b9.17 ± 0.17 b
6064.61 ± 0.02 d2.35 ± 0.01 a2.11 ± 0.00 a9.72 ± 0.00 a
6474.44 ± 0.02 d2.33 ± 0.01 a2.00 ± 0.08 a8.92 ± 0.10 b
6094.62 ± 0.10 d2.20 ± 0.07 b2.06 ± 0.02 a9.11 ± 0.14 b
6385.93 ± 0.17 c2.22 ± 0.05 b1.74 ± 0.08 bc7.88 ± 0.11 c
5154.08 ± 0.00 e2.22 ± 0.00 b2.11 ± 0.00 a8.68 ± 0.00 b
S40103.03 ± 0.04 e2.01 ± 0.03 ab1.59 ± 0.03 d7.60 ± 0.02 e
7235.68 ± 0.05 d2.07 ± 0.07 ab1.84 ± 0.00 cd8.37 ± 0.00 d
7246.45 ± 0.13 c1.88 ± 0.04 b1.79 ± 0.04 d9.98 ± 0.06 c
4868.92 ± 0.01 a1.32 ± 0.00 c1.29 ± 0.02 e13.42 ± 0.08 a
0135.96 ± 0.04 d2.07 ± 0.07 ab1.84 ± 0.03 cd11.33 ± 0.15 b
6065.88 ± 0.03 d2.45 ± 0.04 a2.06 ± 0.00 a10.85 ± 0.02 b
6475.97 ± 0.18 d2.55 ± 0.02 a2.06 ± 0.01 a11.70 ± 0.00 b
6096.72 ± 0.05 c2.22 ± 0.02 ab1.91 ± 0.06 c10.15 ± 0.10 c
6387.97 ± 0.02 b2.45 ± 0.00 a2.00 ± 0.03 b10.05 ± 0.00 c
5157.55 ± 0.00 b2.26 ± 0.00 ab1.95 ± 0.00 bc9.83 ± 0.00 c
Values are presented as mean ± SD of three biological replicates. Seedling length (cm), stem diameter (mm), root diameter (mm), and root length (cm) were measured at four developmental stages. Different lowercase letters within the same column indicate significant differences among cultivars at the same sampling stage at p < 0.05 (one-way ANOVA followed by LSD test).
Table 2. Yield traits and yield efficiency of 10 pea cultivars at stage S4.
Cultivar100-Seed Weight
(g)
Total Biomass (g per 100 Plants)Fresh Weight of Edible Portion (g per 100 Plants)Edible Ratio
(%)
Yield Efficiency (%)
01010.09 ± 0.47 h56.78 ± 2.08 d14.42 ± 1.06 f25.42 ± 2.51 de0.25 ± 0.02 ef
72316.07 ± 0.35 g86.40 ± 5.42 c27.39 ± 1.10 cd31.70 ± 1.25 bc0.32 ± 0.01 b
72415.68 ± 0.24 g86.67 ± 5.42 c31.72 ± 1.26 bc36.65 ± 0.51 ab0.37 ± 0.01 a
4868.60 ± 0.11 i54.22 ± 4.26 d20.50 ± 1.10 e37.80 ± 1.65 a0.38 ± 0.02 a
01317.17 ± 0.62 f94.61 ± 7.28 bc25.61 ± 2.60 d27.07 ± 1.22 d0.27 ± 0.01 d
60627.58 ± 0.37 b120.33 ± 9.56 ab31.96 ± 3.01 bc26.50 ± 1.26 d0.26 ± 0.01 e
64729.00 ± 0.20 a120.06 ± 12.65 ab30.50 ± 1.67 bc25.40 ± 1.68 de0.25 ± 0.01 ef
60925.48 ± 0.32 c137.05 ± 10.80 a33.06 ± 2.17 b24.17 ± 1.51 e0.24 ± 0.01 f
63822.18 ± 0.27 e136.06 ± 3.51 a40.95 ± 0.92 a30.07 ± 0.95 c0.30 ± 0.01 c
51524.14 ± 0.30 d111.56 ± 13.00 b28.39 ± 2.25 c25.40 ± 4.31 de0.25 ± 0.05 ef
Values are presented as mean ± SD of three biological replicates. Different lowercase letters within the same column indicate significant differences among cultivars at p < 0.05 (one-way ANOVA followed by LSD test).
Disclaimer/Publisher’s Note: The statements, opinions and data contained in all publications are solely those of the individual author(s) and contributor(s) and not of MDPI and/or the editor(s). MDPI and/or the editor(s) disclaim responsibility for any injury to people or property resulting from any ideas, methods, instructions or products referred to in the content.