Article

Wheat–Pea Intercropping Responds to Nitrogen Fertilization and Maintains Yield Under Agroforestry in Central Italy


by
Silvia Pampana
1,2,
Lorenzo Gabriele Tramacere
1,2,*,
Sanaz Afshari-Behbahanizadeh
1,
Àngela Puig-Sirera
1,
Edoardo Monacci
1,2,
Gabriele Sileoni
1,2 and
Daniele Antichi
1,2
1
Department of Agriculture, Food and Environment, University of Pisa, 56124 Pisa, Italy
2
Centre for Agri-Environmental Research “Enrico Avanzi”, University of Pisa, 56122 Pisa, Italy
*
Author to whom correspondence should be addressed.
Agronomy 2026, 16(7), 727; https://doi.org/10.3390/agronomy16070727
Submission received: 5 March 2026 / Revised: 24 March 2026 / Accepted: 27 March 2026 / Published: 31 March 2026

Abstract

Agriculture must shift to sustainable practices that support mitigation and adaptation, with crop diversification highlighted as a key adaptive practice. A field experiment was conducted in central Italy to study forage and grain production of wheat (Triticum aestivum L.) and pea (Pisum sativum L.) intercropping (IC) comparing three nitrogen fertilizations (NF) (i.e., 0, 70, and 140 kg ha−1) and two cropping systems (CS) (i.e., arable (AR) and silvo-arable (SIAR)) for two consecutive cropping seasons (2023–2024 and 2024–2025). Forage and grain production were determined at flowering and at maturity to identify temporal trends in resource use. Overall, the results demonstrated that poplar presence did not significantly impact IC productivity, as forage biomass at flowering was 5.00 t ha−1 in AR and 4.77 t ha−1 in SIAR in 2024, and 3.20 t ha−1 in both cropping systems in 2025. Moreover, NF was the main driver of both forage and grain production, without significant interaction with the CS, and a moderate N rate (i.e., 70 kg ha−1) was the most efficient, ensuring both wheat and pea productivity. The absence of a yield penalty in the IC in the SIAR supports the agroecological value of integrating annual intercrops with tree components.

1. Introduction

The transition toward more sustainable and resilient agricultural systems by adopting management practices that help mitigate or adjust to changing conditions is essential to address today’s challenges posed by climate change and resource scarcity. Among the strategies proposed to enhance agroecosystem sustainability, crop diversification, i.e., growing different crops through rotation or multiple cropping—particularly through intercropping (IC) and agroforestry (AF)—has received growing attention due to its potential to improve resource-use efficiency, stabilize yields, and reduce external inputs [1].
IC annual legumes with cereals is an effective strategy to enhance productivity and nitrogen (N) use efficiency and is widely adopted in Mediterranean forage production [2,3,4,5]. Here, wheat (Triticum aestivum L.) and pea (Pisum sativum L.) are autumn-winter crops used for forage, silage, or grain to improve feed nutrition, and their IC benefits from complementary resource use and growth patterns [3], as wheat relies on soil and N fertilizers, while pea adds N through N2 fixation. This process has advantages for both plants, potentially reducing the need for mineral fertilizers in crop rotation. However, biological nitrogen fixation rarely fully replaces fertilizer N inputs [6], so applying an appropriate rate of N fertilizer is still necessary in Mediterranean legume–cereal IC systems to ensure adequate yield and quality [5,6,7].
Therefore, the performance of wheat–pea IC systems is strongly influenced by N availability. While increasing mineral N inputs typically enhances wheat growth and yield, it may reduce pea competitiveness and inhibit symbiotic N2 fixation, thereby altering species balance and potentially reducing system-level complementarity.
Finding N strategies that maintain high wheat productivity without introducing negative impacts on legume performance and functional complementarity as well as system-level efficiency may still be a major issue for targeted N management in cereal–legume systems because the advantages of IC are highly dependent on N supply which significantly influences the competitive balance, complementarity effects, and total resource use efficiency within the mixture [8,9,10].
In parallel, AF systems (i.e., the intentional integration of trees with crops) offer additional opportunities to increase the agroecosystem diversity and therefore its sustainability [11]. By increasing structural and functional diversity, AF can enhance resource capture, regulate microclimatic conditions, and contribute to soil fertility and carbon sequestration.
Therefore, the integration of AF with cereal–legume IC further increases structural and functional biodiversity by combining trees and annual intercrops and creating vertical and horizontal stratification of canopies and rooting zones, which modifies light distribution, soil moisture, and temperature regimes, thereby regulating microbial activity and N transformation processes [12,13,14].
The presence of trees further extends rooting depth and spatial nutrient capture, enabling N uptake from deeper soil layers and potentially reducing leaching. At the same time, increased plant diversity and litter inputs enhance soil organic matter turnover and microbial biomass, contributing to N cycling and improved N-use efficiency [15].
Regardless, environmental variability may condition these interactions, and the inter-annual differences in rainfall distribution, thermal regimes, and soil water status common in Mediterranean areas can strongly affect N uptake dynamics in cereals and the initiation and efficiency of N2 fixation in legumes. Such variation can alter competitive outcomes and actual benefits of IC across years, as demonstrated in cereal–pea systems under temperate conditions [16].
Despite the advantages of both IC and AF, studies integrating these two approaches remain limited, particularly for annual cereal–legume systems. Most existing research has focused either on intercrops in open-field conditions or on sole crops under tree-based systems, while experimental evidence on cereal–legume IC within silvo-arable AF systems is still scarce [12,13].
To fill this gap, this study aims to evaluate the agronomic performance of wheat–pea IC within both arable and silvo-arable agroforestry systems under different NF. We carried out a dual-purpose evaluation of the IC for forage and grain production and nutrient accumulation by measuring and analyzing the biomass both at flowering and at maturity.
We hypothesize that: (i) Increasing NF rate may reduce interspecific competition, thereby supporting IC nutrient resource uptake and increase total production; (ii) interactions between intercropped species may vary across the growing seasons due to differences in nutrient demand and N availability; and (iii) the presence of poplar trees under AF conditions would not result in yield decline but may influence resource allocation and growth dynamics.

2. Materials and Methods

2.1. Experimental Site

The experiment was conducted over two cropping seasons (2023–2024 and 2024–2025) at the Centre for Agri-environmental Research “E. Avanzi”, University of Pisa, Italy (43°41′6.71″ N, 10°20′33.12″ E; 1 m a.s.l.), located about 4 km from the coast of central Italy, at a site with a Mediterranean climate (Csa, Köppen classification) characterized by mild, wet winters and hot, dry summers. The experimental field was ploughed to a depth of 40 cm, and treatments were re-randomized in the second year. Soil parameters did not differ between years, and average values are summarized in Table 1. The soil is calcareous, xeric, and classified as Typic Xerofluvents [17], with medium loam texture, moderate organic matter content (1.7%), and adequate nutrient levels (total N = 1.2 g kg−1).

2.2. Experimental Design

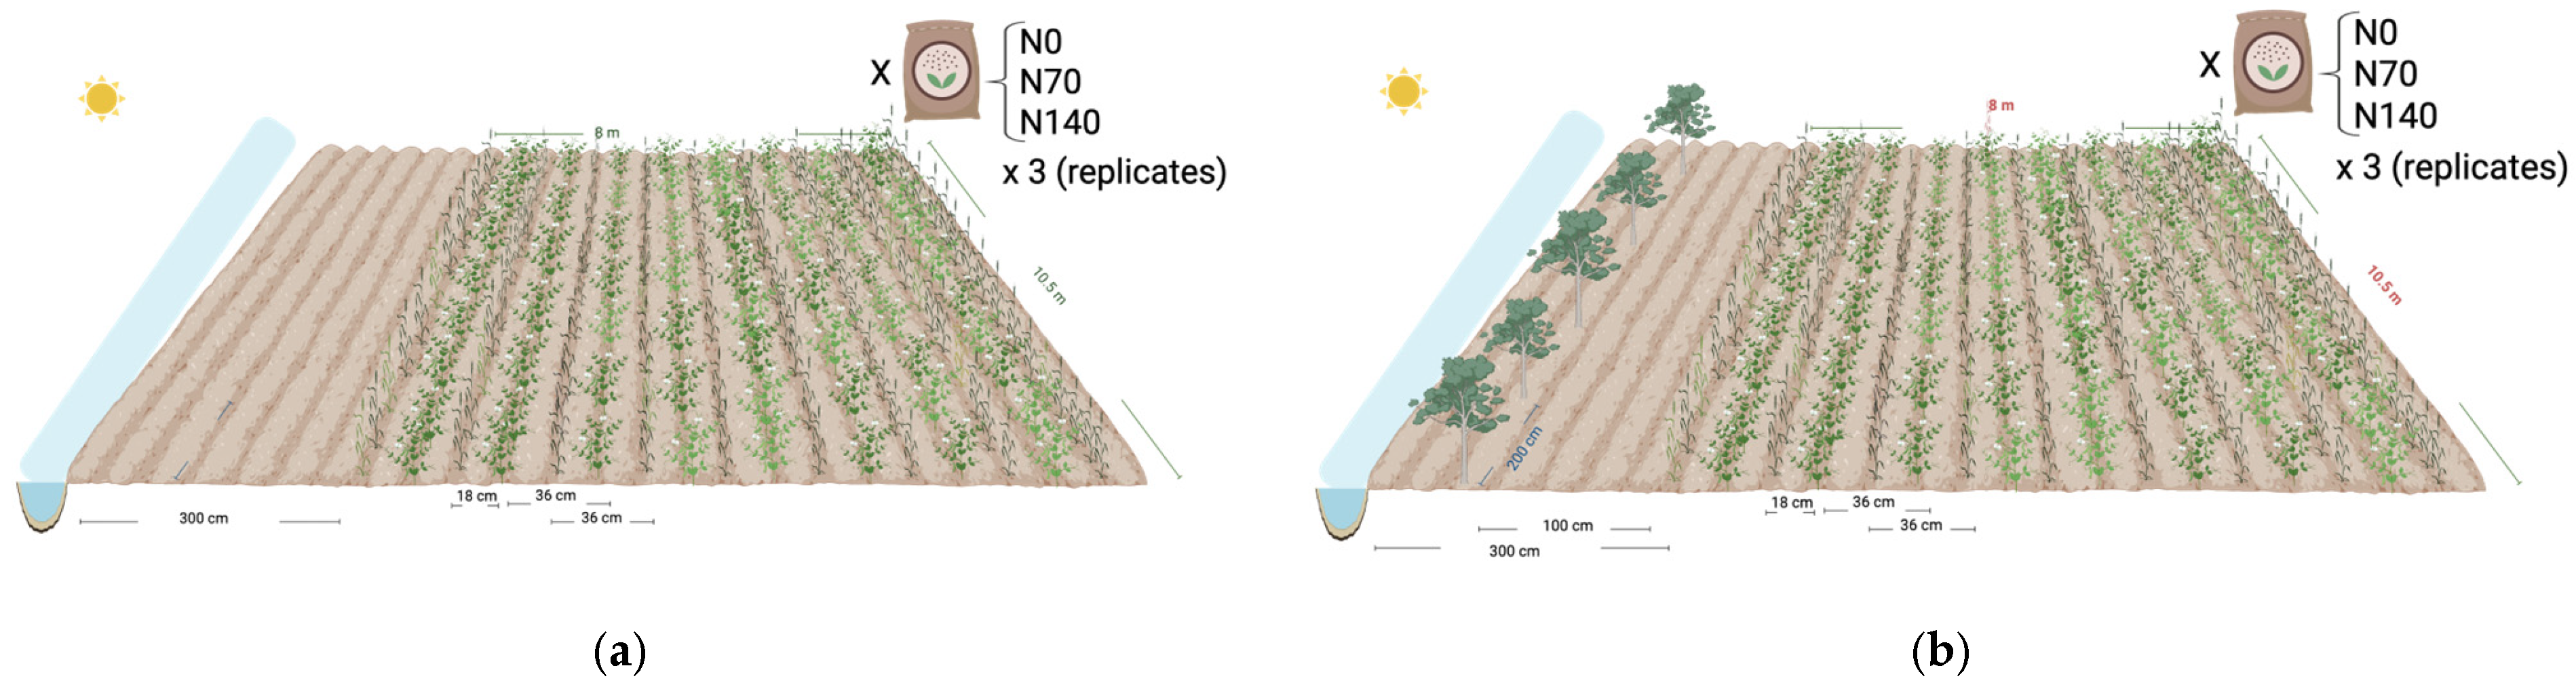
The trial followed a two-way randomized complete block design with three replications, testing three nitrogen fertilizations (NF) and two cropping systems (CS). NF were: (i) N0: control without nitrogen fertilization (0 kg N ha−1); (ii) N70: optimal nitrogen fertilization rate for the intercrop (70 kg N ha−1); and (iii) N140: double the optimal nitrogen fertilization rate (140 kg N ha−1). The optimal rate (70 kg ha−1) was based on recommendations for cereal–legume forage intercrops in central Italy [5], while the doubled rate (140 kg ha−1) was expected to influence both forage and grain production. Nitrogen was applied as urea (46% N) in two equal topdressing splits at wheat tillering and stem elongation (i.e., 0 + 0, 35 + 35, and 70 + 70 kg N ha−1 respectively, in N0, 70, and 140). CS were: (i) arable (AR): herbaceous intercrop of wheat and pea without trees, and (ii) silvo-arable (SIAR): herbaceous intercrop of wheat and pea combined with a single row of poplar trees (Populus × euramericana with five trees per plot, 2 m spacing along the row, planted along field margins (Figure 1)). Thus, each year, six treatments (two CS × three NF) were tested across 18 plots (six treatments × three replications), each measuring approximately 84 m2 (8 m width × 10.5 m length), with each plot receiving a specific N treatment and either the presence or absence of poplar trees.

2.3. Crop Management

The trial took place under rainfed conditions, using consistent agronomic practices typically followed by local farmers across all plots, except for the experimental treatments (NF and CS). In both CS, the intercrop consisted of common wheat (Triticum aestivum L., cv. Ludwig) and pea (Pisum sativum L., cv. Paprika). Ludwig is a strategic variety for dairy cow forage (hay or silage) and was selected for its medium-late maturity and suitability for forage production. Audit variety is for animal feed and was selected for its high productivity and protein content. In the SIAR, five 1-year-old stems of poplars (clone I-214, Populus × euramericana (Dode) Guinier) were manually planted, north-south oriented, in each plot on 23 February 2021, 2 m apart along one plot edge, 2 m away from drainage ditches, and 1 m apart from the beginning of the wheat/pea vegetation, whereas in AR the intercropped crops were grown without trees. Fields were ploughed to ~40 cm depth in autumn (18 October 2023 and 27 September 2024, respectively) and fertilized basally with 50 kg ha−1 P2O5 (triple superphosphate, 0-46-0) and 40 kg ha−1 K2O (potassium sulphate) before sowing (20 November 2023 and 14 October 2024). Wheat and pea were sown with a mechanical sower on 2 February 2024 and 13 November 2024 at rates of 180 kg ha−1 for wheat and 240 kg ha−1 for pea. Wheat rows were spaced 36 cm apart, with one pea row between each pair (18 cm).
N fertilization was applied at three rates (0, 70, and 140 kg ha−1) according to the experimental design described above. In the first year, fertilizers were applied on 7 March 2024 and 17 April 2024; in the second year, on 10 January 2025 and 21 March 2025, following the same scheme, with application timing adjusted according to crop development. No herbicides or pesticides were applied as weed and disease pressure remained below economic thresholds.

2.4. Crop Sampling, Analysis, and Calculation

Crop phenological phases were tracked in both years using the BBCH scale [23] to accurately determine growth stages for scheduling inorganic nitrogen applications and harvests. Plant density was measured at crop emergence by counting plants along 1 m of the row and converting to plants m−2.
Aboveground biomass was sampled at flowering (BBCH 65) and maturity (BBCH 97), corresponding to forage and grain harvest stages, respectively, using two 25 × 25 cm quadrats per plot. Samples were separated into wheat, pea, weeds, and residues, weighed fresh, oven-dried to constant weight, and expressed on an area basis (Mg ha−1).
At maturity, grain yield was determined from harvested plant material collected within the quadrats, with wheat and pea separated into reproductive and vegetative organs. Grain dry weight was used to calculate crop yield (Mg ha−1). Yield components were recorded separately, including spike number per unit area (n m−2), spike biomass (Mg ha−1), and mean spike weight (g) for wheat, and pod biomass (Mg ha−1), pod number per unit area (n m−2), and mean pod weight (g) for pea. Harvest index (HI) was calculated as the ratio of grain dry weight to total aboveground dry biomass.
For each experimental year and for both sampling stages, subsamples of the harvested plant material were analyzed for elemental composition. N and carbon (C) concentrations were determined by dry combustion using an elemental analyzer (FlashSmart™ Elemental Analyzer, Thermo Scientific, Waltham, MA, USA). Phosphorus (P) concentration was determined using a colorimetric method following acid digestion, measured with a UV–visible spectrophotometer (UV-1900i, Shimadzu, Kyoto, Japan) according to Wieczorek et al. [24]. Nutrient accumulation (N, P, and C) was calculated by multiplying the dry biomass of each plant component by its respective nutrient concentration and expressed on an area basis (kg ha−1).
Leaf area index (LAI) was measured non-destructively using an I-FishI hemispherical camera coupled with an LAI-2000 Plant Canopy Analyzer (LI-COR Biosciences, Lincoln, NE, USA). Measurements were conducted under diffuse light conditions at sunset, with eight readings per plot collected on multiple dates during the growing season in each experimental year.

2.5. Statistical Analysis

Statistical analyses were carried out using JMP software (SAS Institute Inc., Cary, NC, USA, Student Edition 19). The effect of NF and CS was assessed on grain yield and all the yield components for wheat and pea, respectively. The effects of NF and CS, and their interaction, were analyzed using a linear model, followed by a two-way ANOVA. To investigate the effect of NF and CS and their interaction on leaf area index (LAI), which was measured repeatedly at different growth stages, a mixed model with repeated measures over time was applied within each year, with NF, CS, and time (T) as fixed factors, and block as a random factor; a three-way ANOVA was then carried out. Initially, a combined analysis of the two years was performed for all the parameters tested. As the year and its interactions with the other factors tested were significant for most measured traits, data were subsequently analyzed separately for each year. Treatment means were compared using Tukey’s Honest Significant Difference (HSD) test at p < 0.05, and are presented with letters indicating significant differences.

3. Results

3.1. Weather Conditions

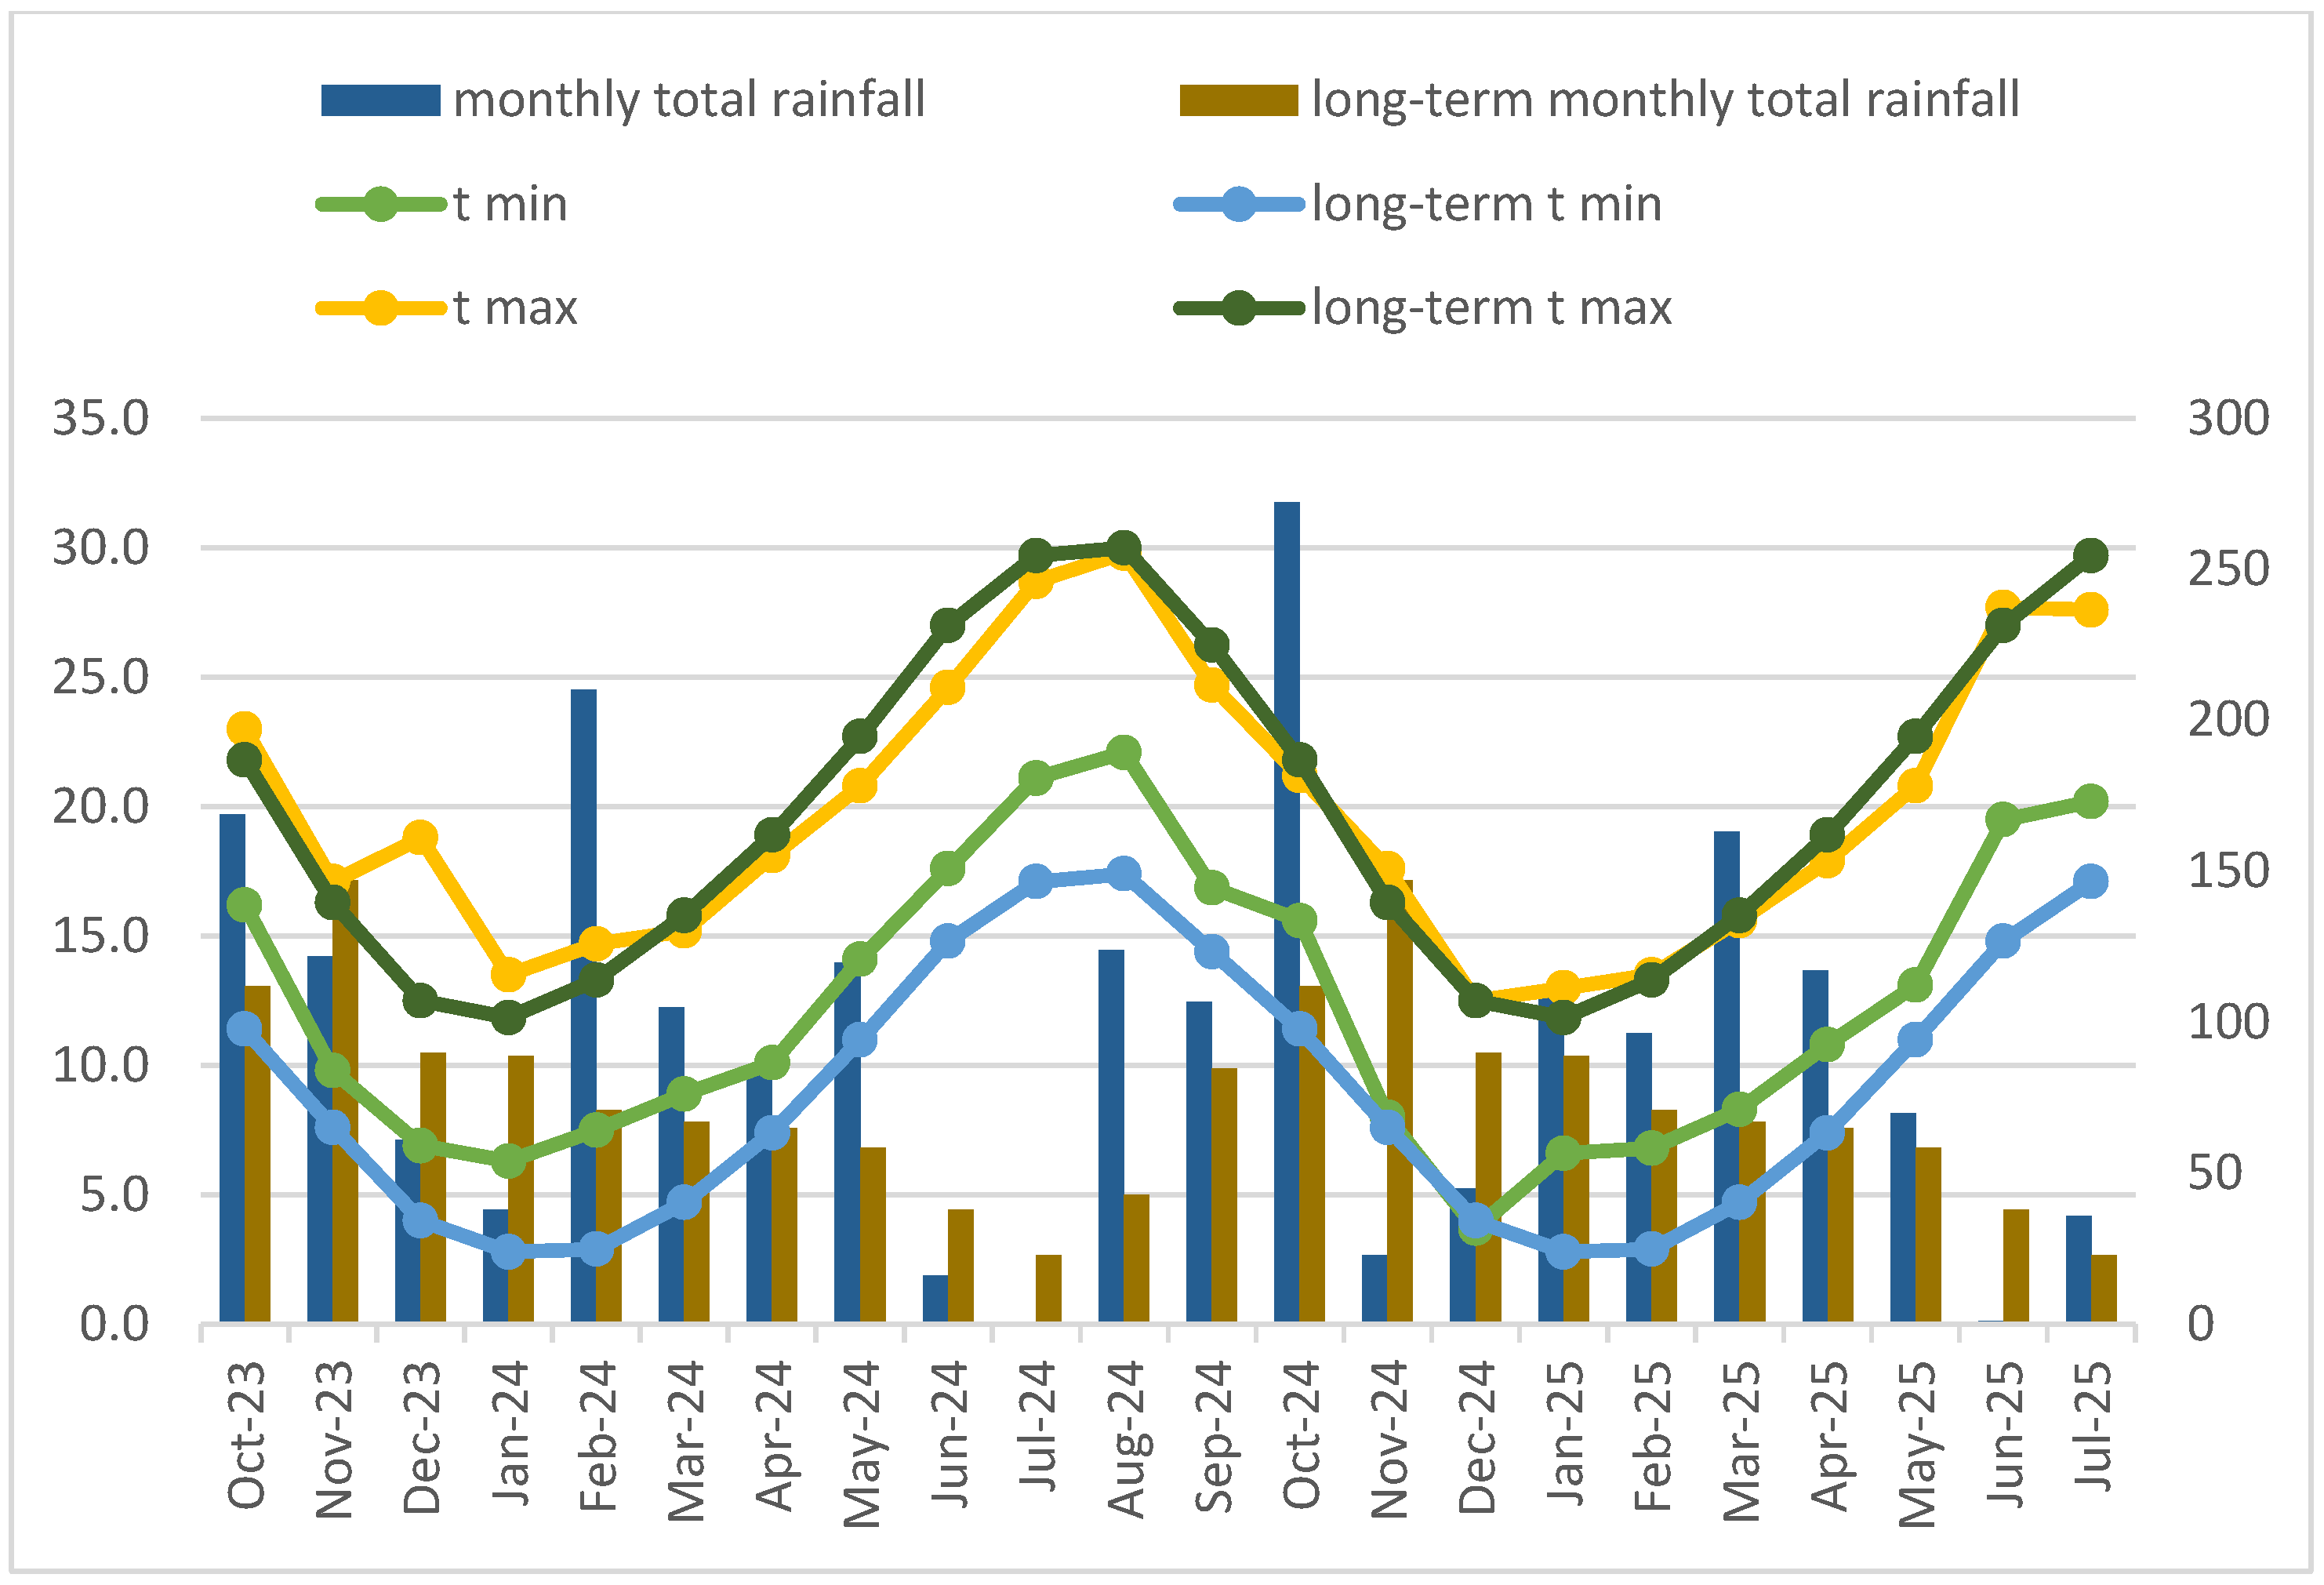
Meteorological data were obtained from the nearest public weather station of the Tuscany Region (43°40′51.60″ N, 10°16′48.00″ E; http://www.sir.toscana.it (accessed on 5 March 2026)). Long-term (1993–2023) averages indicate annual precipitation of 890 mm and mean minimum and maximum temperatures of 12.7 °C and 20.5 °C, respectively. During the two experimental seasons (October 2023–June 2025), temperature trends followed the regional pattern, with mild winters (minimum temperatures of 2–6 °C) and hot summers (up to 30 °C). Overall, temperatures were similar across the two years and remained within the normal range. Although total precipitation from October to July was similar in the two growing seasons (925 and 934 mm, respectively), its distribution was highly irregular, with distinct wet and dry phases (Figure 2). Notable rainfall spikes occurred in February 2024 (210 mm), October 2024 (272 mm), and a weaker one in March 2025 (163.2). Conversely, there were long dry periods, particularly in early summer in June/July 2024 and 2025, where no rainfall was observed or was very minimal. Generally, precipitation displayed an irregular distribution, involving lengthy dry spells followed by heavy rainfall sessions.

3.2. Leaf Area Index

In 2024, LAI was significantly affected by T, CS, and NF (Table S1). Higher LAI values were observed during the earlier T sampling (3.24 in April) than during the later ones (Figure S1). AR generally exhibited higher LAI values than SIAR, with a more pronounced decline over time in SIAR. NF increased LAI at all sampling dates: (i) from 3.00 to 3.40 at T1; (ii) from 2.73 to 3.00 at T2; and (iii) from 2.52 to 3.19 at T3 (+12%, +10% and +27%, for T1, T2, and T3 respectively). In 2025, LAI was significantly influenced by T and N rate but not by CS (Table S1). The highest LAI values were recorded in April and mid-May (3.82 and 3.72, respectively), followed by a gradual decline towards maturity. The N140 treatment maintained the highest LAI values throughout the season, while N70 showed intermediate values (3.45 averaged over T dates), suggesting a partial saturation of the N response during peak vegetative growth (Figure S1).

3.3. Measurements at Flowering Stage

3.3.1. Aboveground Biomass

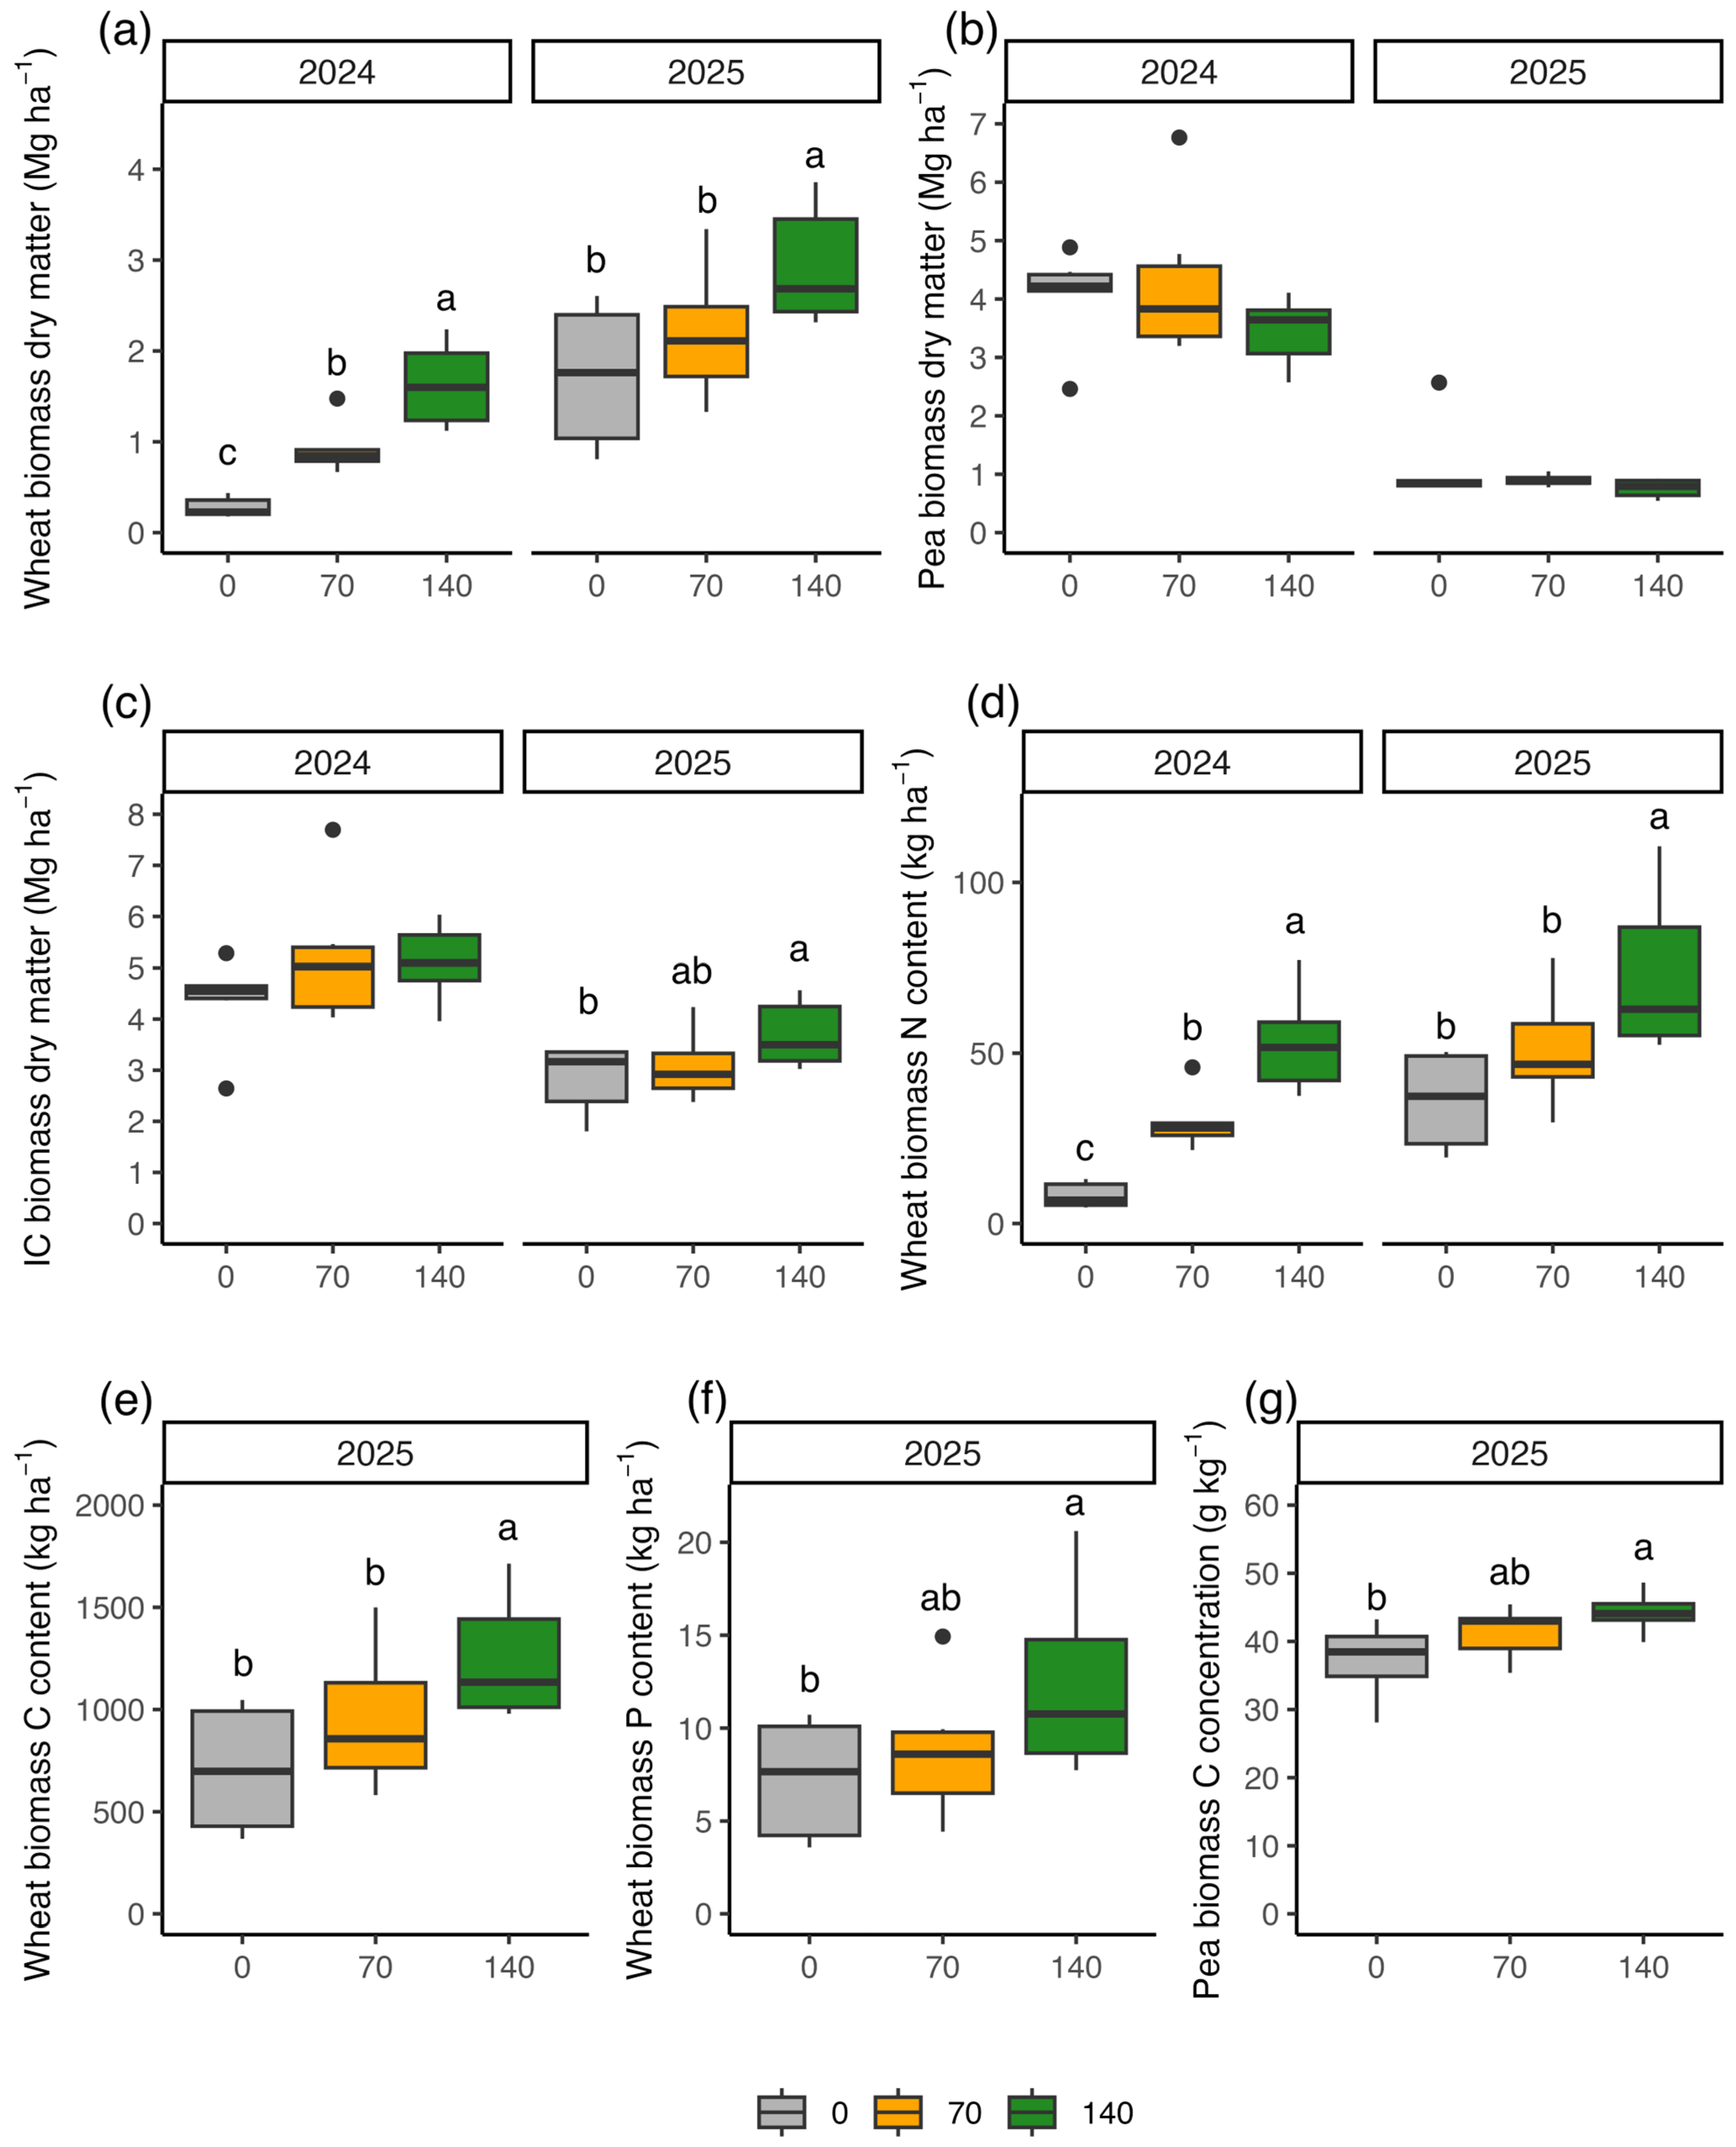
NF significantly affected wheat aboveground biomass (p < 0.001) at flowering in both years whereas pea and weed biomass were largely unaffected (Table S2). In 2024, wheat biomass increased progressively with N supply, reaching a maximum of 1.63 Mg ha−1 at 140 kg N ha−1, which was significantly higher than at 70 kg N ha−1 (0.92 Mg ha−1) and in the unfertilized control (0.28 Mg ha−1). A similar response was observed in 2025, with wheat biomass increasing from 1.72 Mg ha−1 at 0 kg N ha−1, to 2.93 Mg ha−1 at 140 kg N ha−1 (Figure 3a).
In contrast, pea biomass remained stable across N treatments in both years. In 2025, pea biomass was lower and remained unresponsive to N fertilization (Figure 3b). In 2024, total intercrop (IC) biomass did not respond significantly to N fertilization, although numerically higher values were observed under fertilized treatments (5.11–5.21 Mg ha−1) compared with the unfertilized control (4.34 Mg ha−1). In 2025, IC biomass increased significantly with NF rate (p < 0.05), rising from 2.84 Mg ha−1 at N0 to 3.69 Mg ha−1 at N140 (Figure 3c). Cropping system (CS) and CS × NF interaction did not significantly affect biomass production of any component in either year.

3.3.2. Nutrient Content

In both years, NF rate significantly affected total N content in wheat aboveground biomass (p < 0.001 both years), with increasing accumulation at higher fertilization levels (Figure 3d). In 2024, total N accumulation increased from 8.25 kg ha−1 in the unfertilized control to 29.76 kg ha−1 at 70 kg N ha−1 and reached 53.06 kg ha−1 at 140 kg N ha−1, while in 2025, wheat N accumulation increased from 36.05 to 72.72 kg ha−1 across the same N range (Figure 3d).
In 2025, NF rate also significantly affected carbon (C) and phosphorus (P) accumulation in wheat biomass (p < 0.001 and p < 0.05, respectively). At 140 kg N ha−1, wheat C and P accumulation reached 1246.15 and 12.32 kg ha−1, respectively (Figure 3e,f). In pea biomass, only C concentration differed significantly (p < 0.05), increasing from 37.24% in the control to 44.25% at N140 (Figure 3g), while N and P content remained unaffected.
Cropping system did not significantly influence N, C, or P content in either wheat or pea biomass in either year (Table S2).

3.4. Measurements at Maturity

3.4.1. Wheat Biomass and Harvest Index

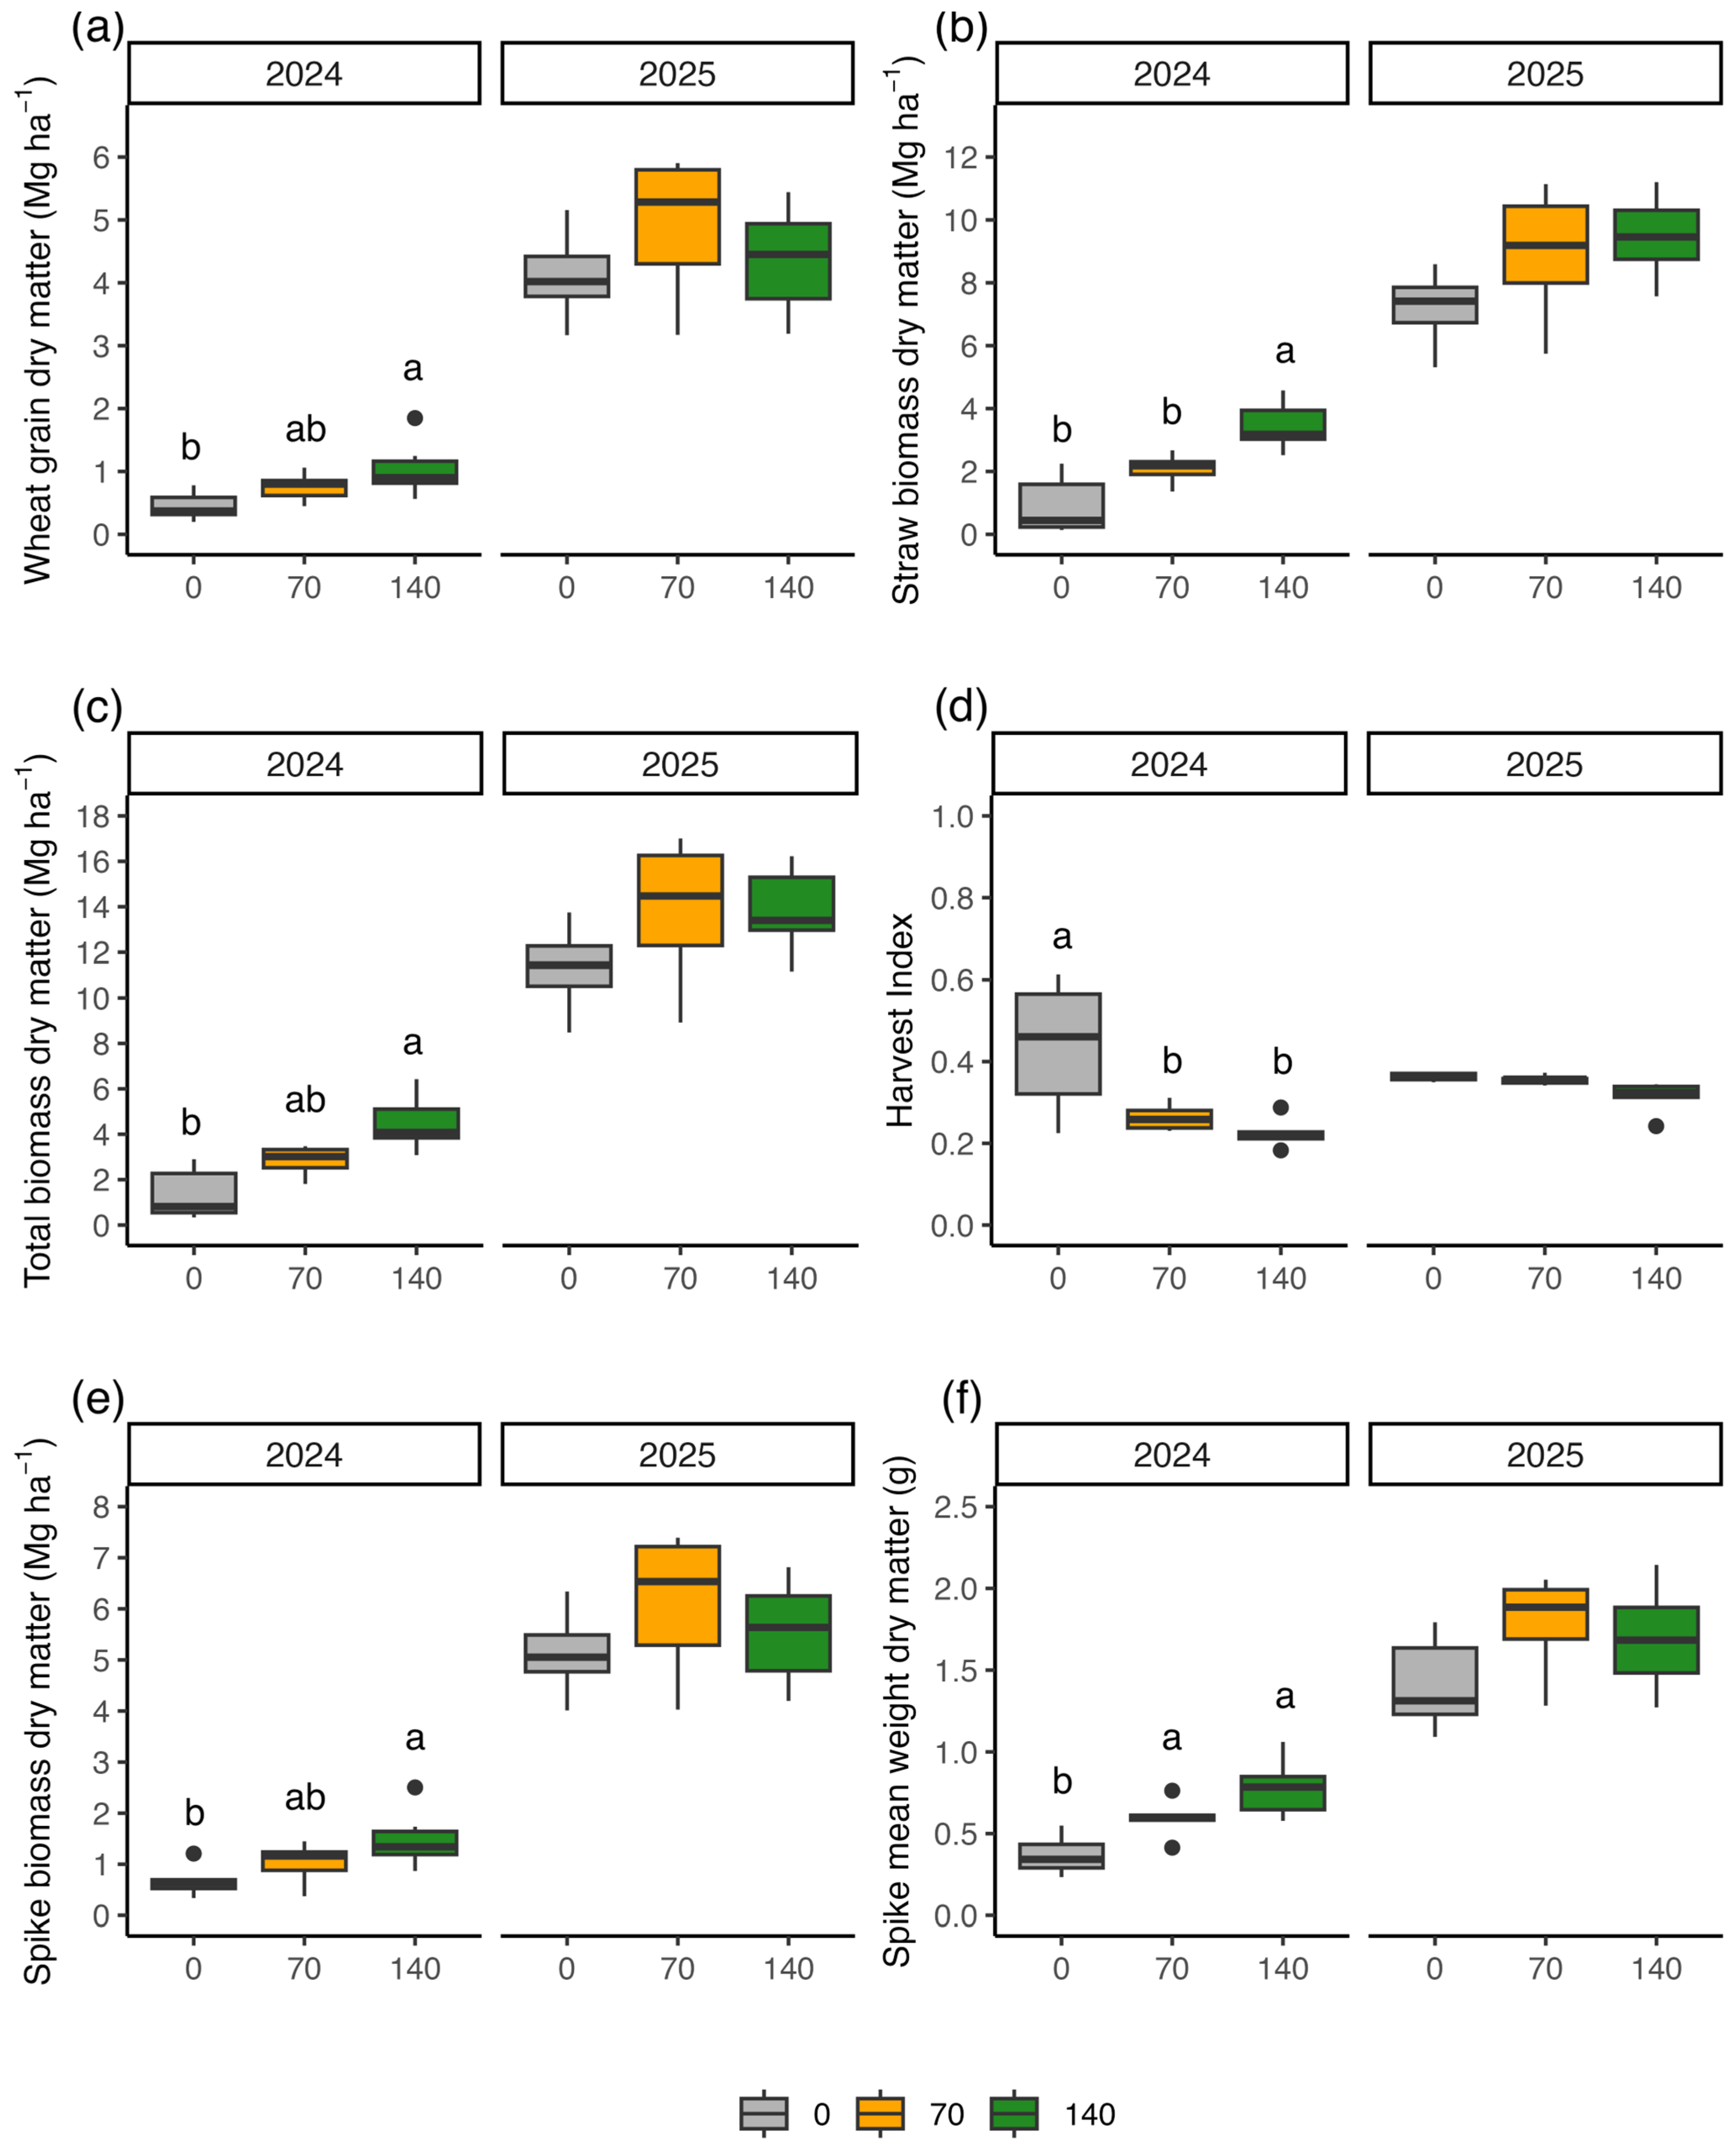
At maturity in 2024, wheat grain (p < 0.05), vegetative (p ≤ 0.001), and total aboveground biomass (p ≤ 0.01) increased significantly with increasing N rate, while HI (p ≤ 0.01) decreased (Table S3; Figure 4a–d). Grain biomass increased from 0.45 Mg ha−1 at N0 to 1.04 Mg ha−1 at N140 (Figure 4a), whereas vegetative biomass increased from 0.90 to 3.44 Mg ha−1 (Figure 4b), resulting in a total aboveground biomass increase from 1.35 to 4.48 Mg ha−1 (Figure 4c). Conversely, HI declined from 0.44 to 0.23 across the same N range (Figure 4d). The CS had no significant effect on wheat biomass or HI.
In 2025, wheat biomass components were not significantly affected by N rate or cropping system (Figure 4a–c). However, HI was significantly influenced by NF rate (p < 0.01) and CS (p < 0.05), decreasing from 0.36 at N0 to 0.31 at N140 (Figure 4d), and being slightly higher in AR than SIAR (0.36 and 0.33, respectively).

3.4.2. Wheat Spike Traits

Across both years, spike number per unit area was unaffected by NF rate or CS (Table S3). In 2024, spike biomass and spike mean weight increased significantly with NF rate (p < 0.05 and p < 0.01, respectively). Spike biomass increased from 0.67 to 1.49 Mgha−1, while spike mean weight increased from 0.37 to 0.78 g between N0 and N140 (Figure 4e,f). In 2025, none of the spike traits responded significantly to NF or CS (Figure 4e,f).

3.4.3. Pea Grain and Harvest Index

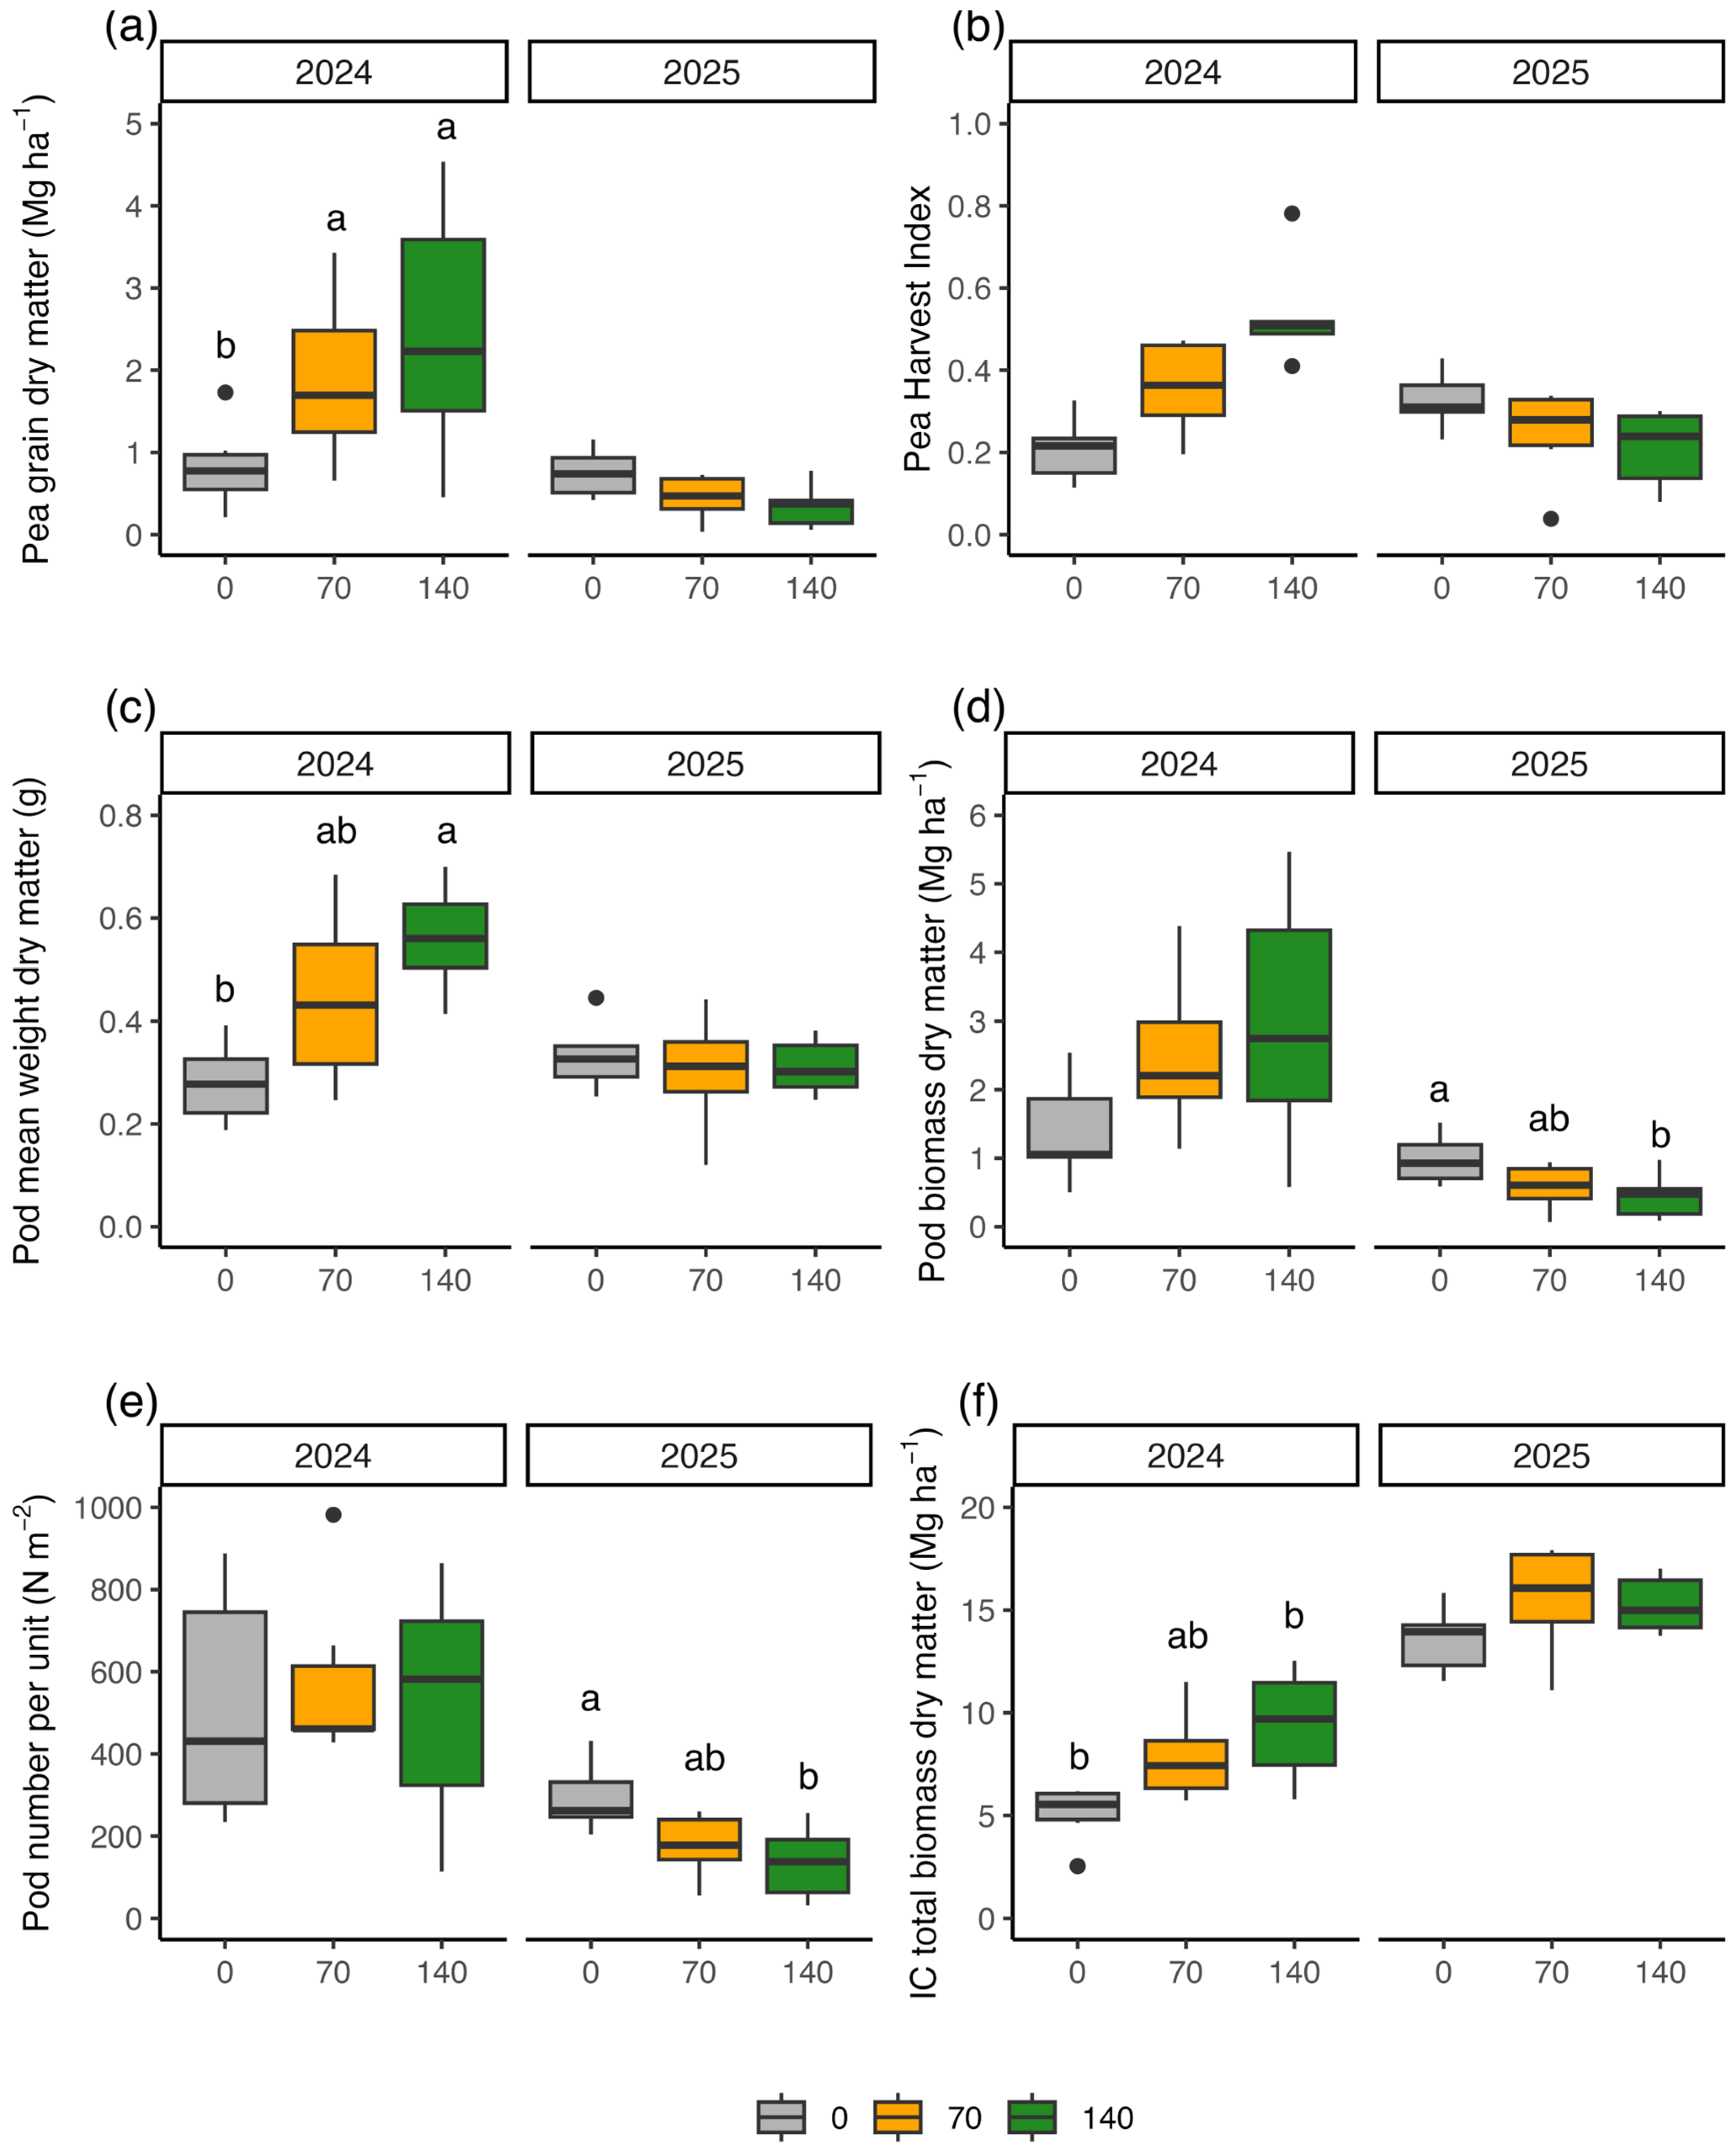
In 2024, pea grain biomass and HI (p < 0.01) were significantly changed by NF, while vegetative and total biomass were unaffected (Table S3). Grain biomass increased from 0.83 to 2.46 Mg ha−1 and HI from 0.21 to 0.54 between N0 and N140 (Figure 5a,b). In 2025, no significant effects of NF rate or CS were observed on pea biomass components or HI (Figure 5a,b).

3.4.4. Pea Pod Traits

In 2024, NF significantly affected pod mean weight (p < 0.05; Table S3), increasing from 0.28 g in the unfertilized control to 0.56 g at N140 (Figure 5c). Pod biomass and pod number per unit area were not significantly affected, although pod biomass increased numerically with NF rate (1.38 Mg ha−1 at N0 to 2.99 Mg ha−1 at N140) (Figure 5d,e).
In 2025, NF significantly affected pod biomass and pod number (p < 0.05), both decreasing with increasing N supply (Figure 5d,e). Pod biomass declined from 0.98 to 0.45 Mg ha−1, and pod number from 292.7 to 135.3 pods m−2 between N0 and N140 (Figure 5d,e). CS did not significantly affect pod traits in either year.

3.4.5. Intercrop Total Aboveground Biomass and Weed Biomass

In 2024, total intercrop aboveground biomass increased significantly with NF rate (p < 0.05; Table S3), being approximately 78% higher at N140 than in the unfertilized control (Figure 5f). In contrast, intercrop biomass in 2025 was not significantly affected by NF rate or CS (Figure 5f). In both years, weed biomass at maturity remained low and was not significantly influenced by NF rate, CS, or their interaction, averaging 0.31 g m−2 in 2024 and almost null (0.02 g m−2) in 2025.

3.4.6. Wheat Nutrient Concentration and Accumulation

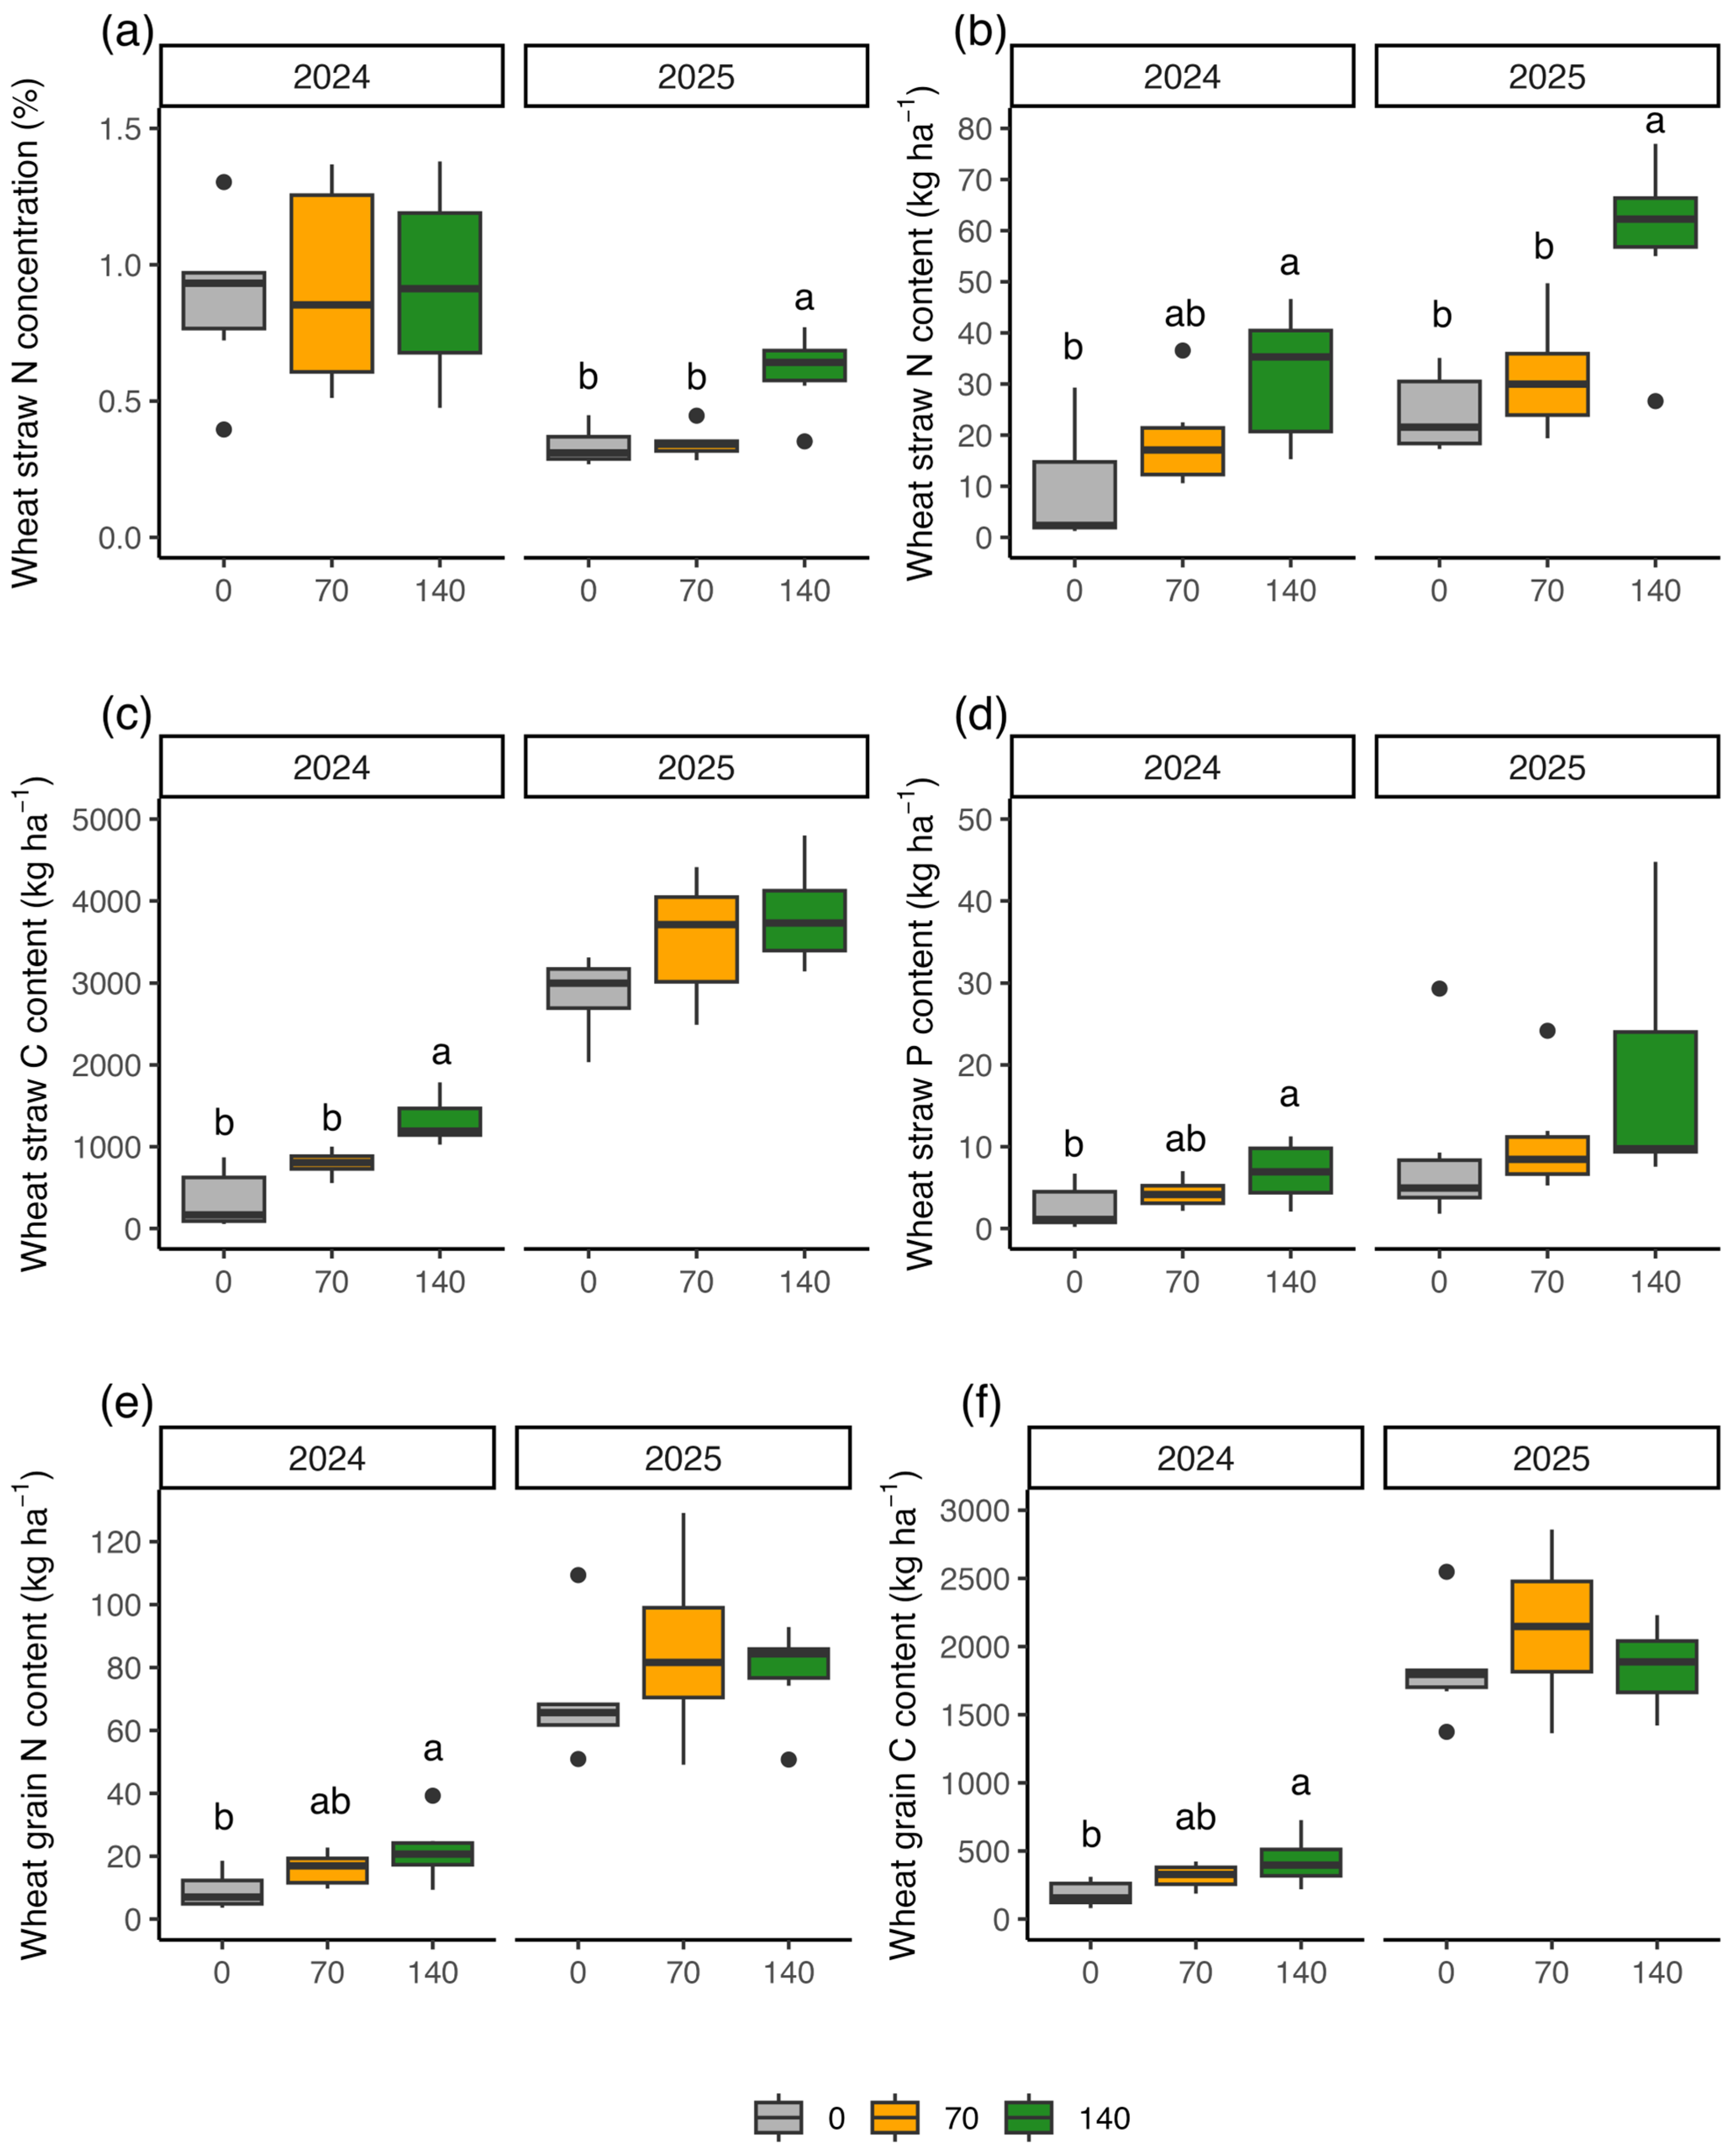
In 2024, nitrogen (N), carbon (C), and phosphorus (P) concentrations in both vegetative biomass and wheat grain were not significantly affected by NF rate, CS or their interaction (Table S4). However, in 2025, it was observed that the concentration of nitrogen in wheat vegetative biomass was significantly affected by NF rate (p < 0.001), increasing from 0.33% in N0 to 0.61% in N140 (Figure 6a). In contrast, C and P concentrations in vegetative biomass, as well as N, C, and P concentrations in wheat grain, were not significantly affected by NF rate or CS.
However, in 2024, NF significantly increased vegetative biomass and N, C, and P accumulation (Table S4). For vegetative biomass, N accumulation increased from 9.31 kg ha−1 under N0 to 31.76 kg ha−1 under N140 (p < 0.05) (Figure 6b); C accumulation increased from 349.95 to 1312.54 kg ha−1 (p < 0.001) (Figure 6c); and P accumulation increased from 2.56 to 6.91 kg ha−1 (p < 0.01) (Figure 6d).
Grain N and C accumulation also increased significantly with NF rate, with grain N increasing from 9.05 to 21.91 kg ha−1 and grain C from 184.63 to 429.92 kg ha−1 (p < 0.05) (Figure 6e,f), whereas grain P accumulation was not significantly affected. CS had no significant effect on nutrient accumulation in either vegetative biomass or grain.
In 2025, N accumulation in wheat vegetative biomass increased significantly with N rate (p < 0.01), rising from 24.38 kg ha−1 at N0 to 58.48 kg ha−1 at N140 (Figure 6b). Vegetative C and P accumulation showed no significant response to NF rate (Figure 6c,d). Grain nutrient accumulation (N, C, and P) was not significantly influenced by NF rate or CS in 2025 (Figure 6e,f).

3.4.7. Pea Nutrient Concentration and Accumulation

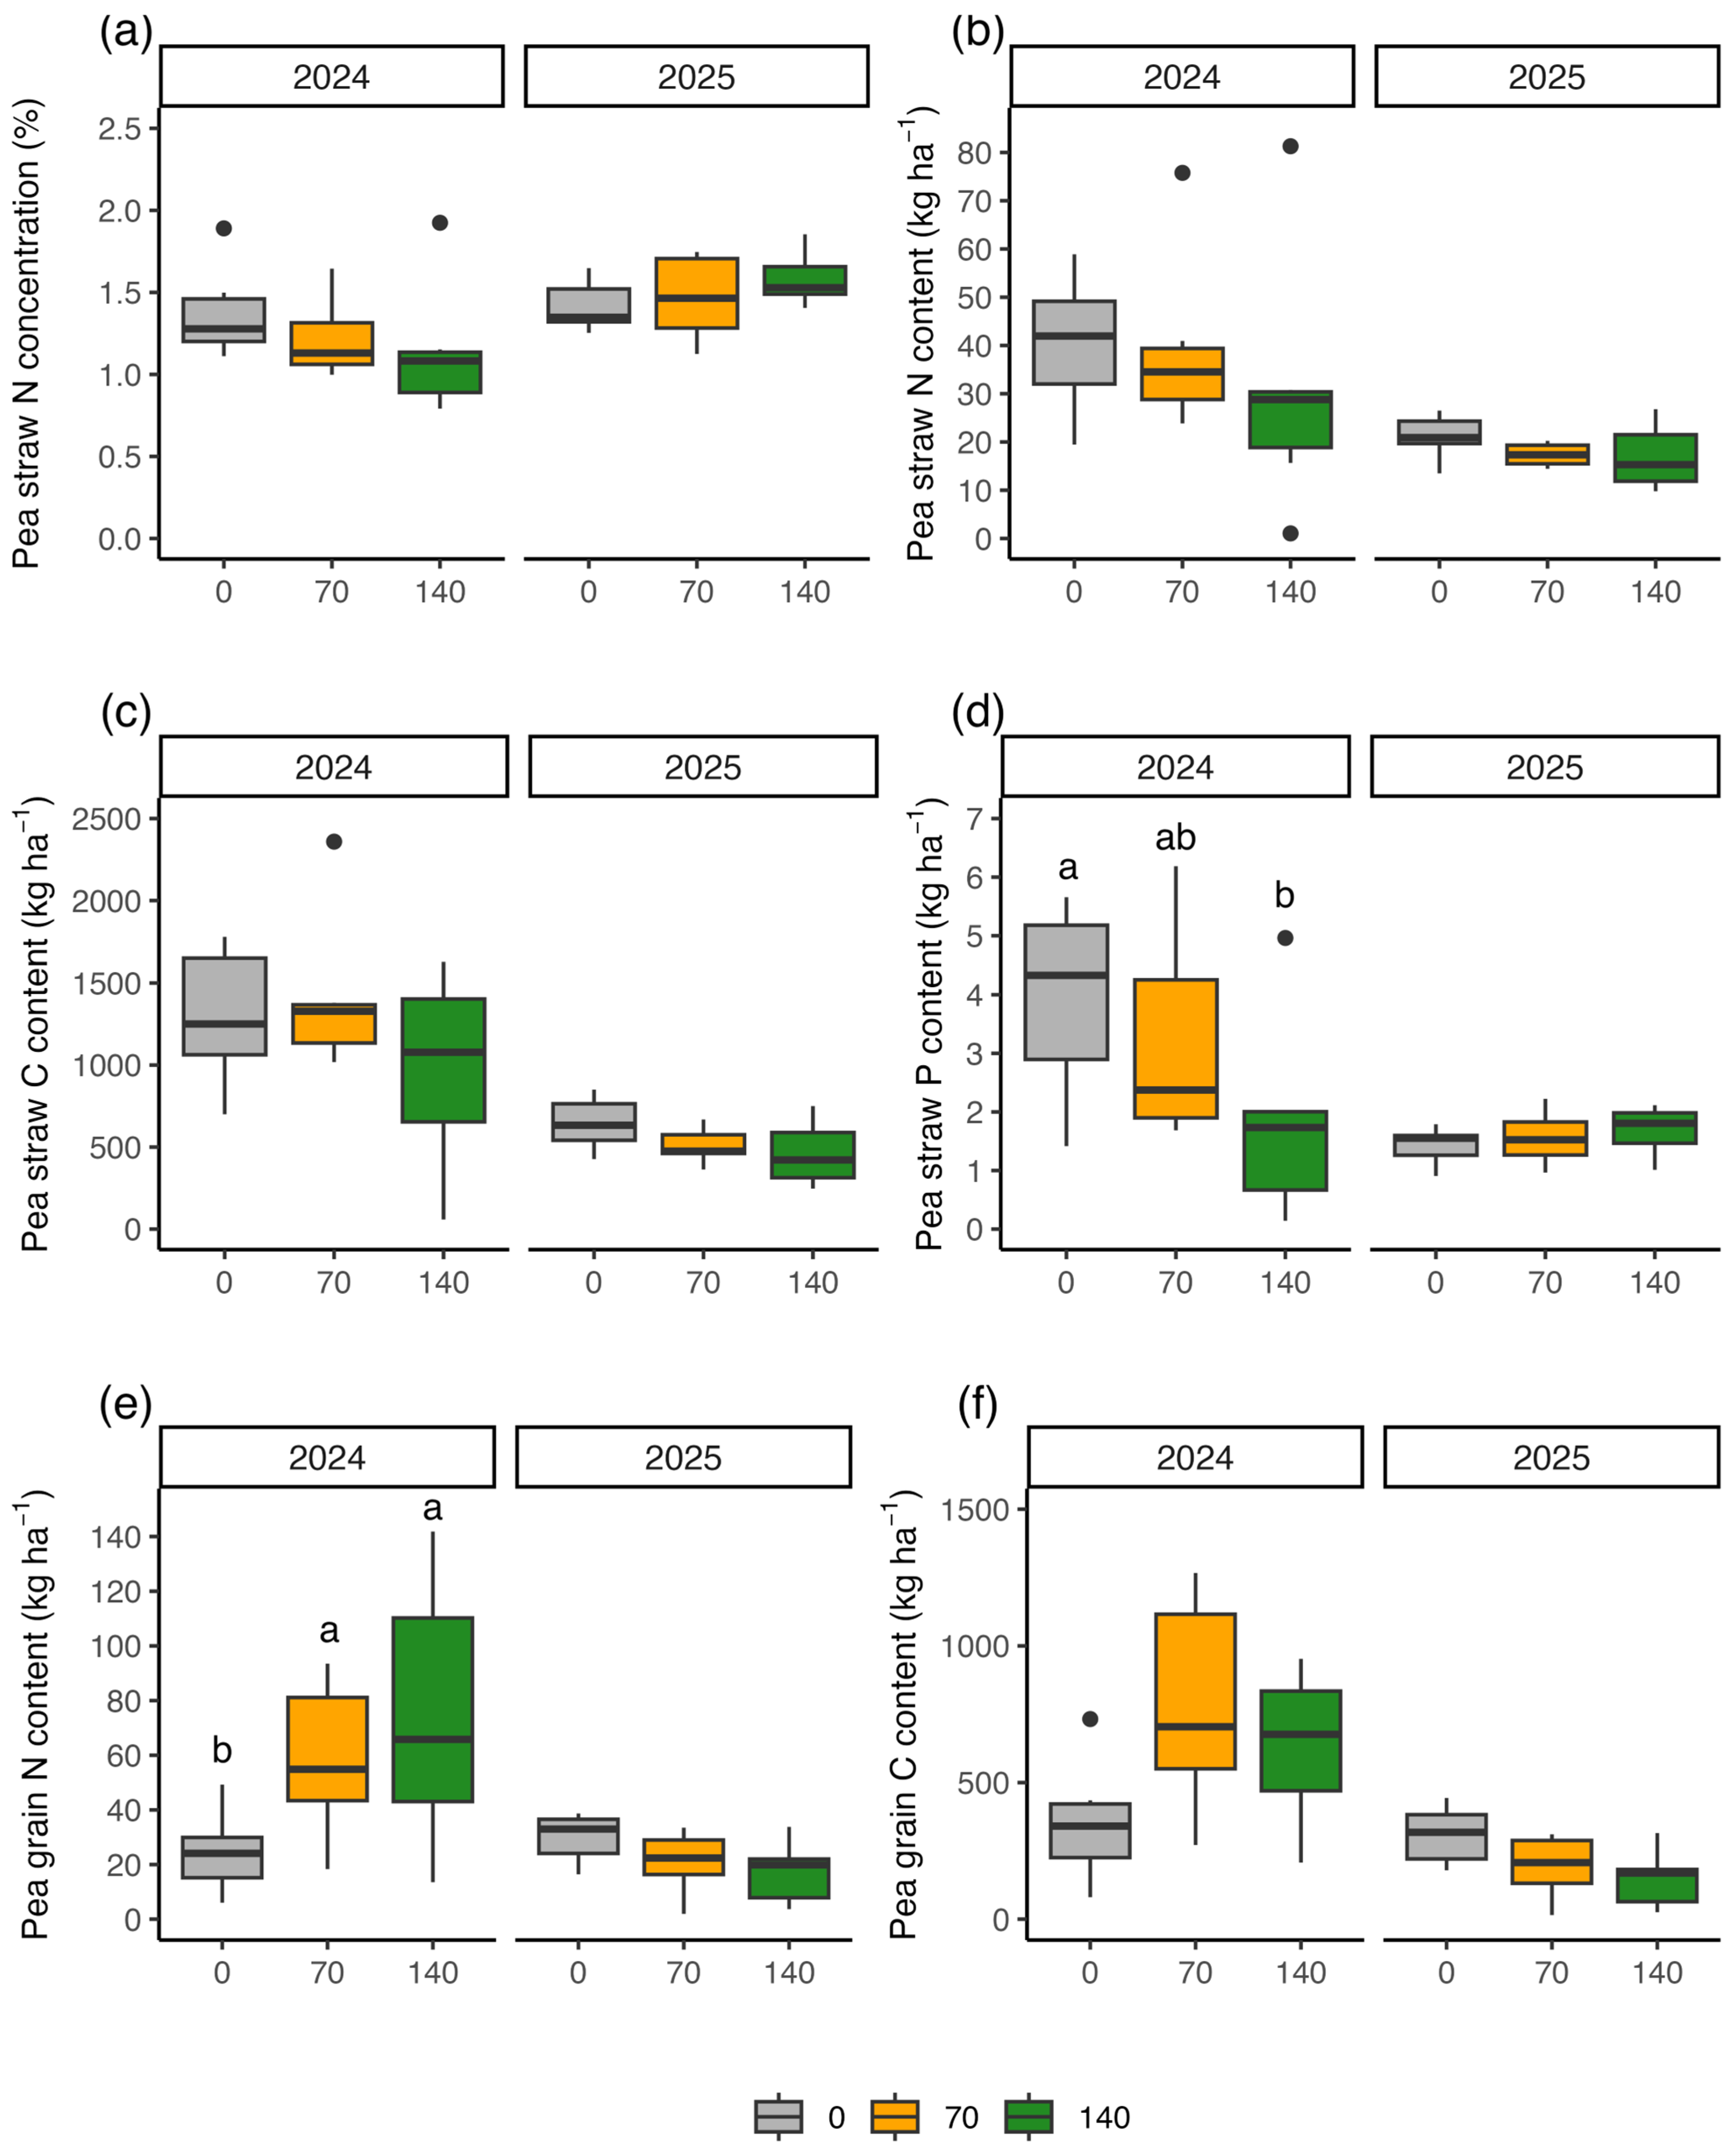
In 2024, N rate significantly affected phosphorus (P) concentration in pea vegetative biomass (p < 0.05), which decreased from 0.14% at N0 to 0.08% at N140 (Figure 7a), while CS had no significant effect (Table S4). A significant CS × NF rate interaction was observed for grain N concentration (p < 0.05); however, grain N concentration ranged narrowly between 2.94 and 3.16%, with no clear or consistent differences between CS across NF rates (Figure 7). Vegetative P accumulation declined significantly with increasing NF rate, decreasing from 3.94 kg ha−1 at N0 to 1.83 kg ha−1 at N140 (p < 0.05; Figure 7b). In contrast, N accumulation in pea grain increased by increasing NF rate from 24.60 kg ha−1 at N0 to 74.58 kg ha−1 at N140 (p < 0.05) (Figure 7c). Carbon accumulation in both vegetative biomass and grain was not significantly affected by CS or NF rate.
In 2025, grain N concentration increased significantly with NF rate (p < 0.01), rising from 4.15% at N0 to 5.33% at N140 (Figure 7d). In contrast, N, C, and P concentrations in vegetative biomass were not significantly affected by CS or NF rate, with mean vegetative N concentration ranging from 1.41 to 1.58%. Nutrient accumulation in both vegetative biomass and grain was also unaffected by treatments.

3.4.8. Nitrogen Harvest Index (NHI)

NF rate significantly affected wheat NHI in both years (p < 0.05 in 2024 and p < 0.001 in 2025; Table S5). In wheat, NHI progressively decreased with increasing NF, indicating a reduced efficiency of N translocation to the grain at higher N rates (Table 2). Conversely, pea NHI increased with increasing N rate in 2024 (p < 0.01) but was unaffected in 2025, showing improved N allocation to the grain from the unfertilized control to the highest N treatment (Table 2).

4. Discussion

This research aimed to assess the physiological and agronomic performances of a wheat and pea intercrop cultivated with three rates of nitrogen fertilization and within an arable cropping system and a silvo-arable agroforestry system. We conducted observations at both the flowering and maturity stages to assess the impact of NF and CS on growth dynamics over two cropping seasons.
Overall, varying climate conditions across the two experimental years had significant and distinct impacts on yield and its components in the two companion crops.
In contrast, the effect of the CS was negligible for most measured traits, and no significant differences were observed in the IC performance between the AR and SIAR systems. The CS × NF rate interaction was generally not significant, except for pea grain N concentration in the first year.
NF was the main driver of forage and grain yield and N accumulation.

4.1. Effect of the Year

Large differences between the two years of the experiment confirmed the major effect of climatic factors on crop growth and nitrogen use efficiency in Mediterranean IC [3,4,5]. Rainfall patterns and planting dates had major impacts on crop phenology, biomass production, and grain yield in crops. In the first year 2023/2024, late planting of crops occurred due to heavy rainfall and led to reduced cycle duration, reduced tillering in wheat, reduced solar radiation interception, and greater reliance on mineral N nutrition; thus, addition of N fertilizer led to greater vegetative biomass but reduced harvest index and N harvest index because of the suppression associated primarily with dominant vegetative growth in a N-driven system under heat and photoperiod stress [25,26]. On the contrary, in experimental year 2024/2025, timely planting allowed complete phenological growth of crops, hence more tillering and biomass production in wheat; therefore, N fertilizer effect was less pronounced. Under these conditions, nitrogen was not the primary limiting factor, and crop growth was mainly driven by canopy development and radiation interception, indicating a radiation-driven system rather than a N-limited one [27,28,29]. Pea responses were likewise context-dependent, with greater reliance on mineral N under shortened cycles in the first year and increased dependence on symbiotic N2 fixation under optimal conditions in the second [6].

4.2. Effect of the Cropping System

Although AR plots tended to show slightly higher LAI and early biomass under high NF rate, these differences did not translate into significant yield gains, and the presence of poplars in SIAR did not have significant effects on crop yield, biomass accumulation, and nutrient dynamics. Trees likely induced mild shading and belowground competition, but these effects were insufficient to constrain crop growth because of the autumn–winter cycle of wheat–pea IC. Indeed, as reported by several studies conducted in temperate agroforestry systems, light competition is more critical for summer crops than for winter cereals and legumes [30,31]. On the contrary, as reported by Piotto et al. [32], selecting deciduous tree species such as poplar in combination with C3 winter crops reduces the temporal overlap in growth, allowing winter crops, such as winter wheat, to reach at least stem elongation and flag-leaf formation before full poplar leaf expansion. Indeed, C3 species are well suited to these systems because of their lower light saturation point and the limited overlap with the leafing period of deciduous trees [33]. This results in reduced competition for resources such as light and water at flowering, which is a crucial phase for these crops, and yields are not significantly affected compared with systems without trees [32,34]. Similar findings were reported by Blanchet et al. [35] for winter pea in southern France within a 25 year hybrid walnut (Juglans regia × nigra, cv. NG23) AF system, although yield reductions increased with increasing shade levels. This is consistent with recent work in this study area by Tramacere et al. [13,36] on sulla, a winter legume crop, but generally is confirmed by studies conducted in temperate regions on legumes [37,38,39]. Considering the overall cereal–legume IC, in Mediterranean environments, evidence from silvo-arable systems with deciduous trees mainly concerns annual crops grown as sole crops (e.g., winter cereals or grain legumes), whereas studies explicitly testing cereal–legume IC under deciduous tree rows are scarce; the closest available evidence comes from grass–legume mixtures used as forage [40,41]. However, alley-cropping systems with olive (Olea europaea L.) provide initial indications that winter cereal–legume associations can still be advantageous under tree cover, and also when intercropped with evergreen trees. Indeed, in rainfed olive orchards, barley–pea and triticale–pea intercrops had increased productivity and improved resource-use efficiency, although responses varied across years [42,43].

4.3. Effect of the Nitrogen Rate

We found that N availability was the main driver of productivity and N uptake in wheat–pea IC. Across both years, the component crops had different responses; wheat showed significant increases in aboveground biomass and nutrient accumulation with higher N rates, especially during the shorter season (i.e., 2023–2024). However, higher NF rates reduced HI and NHI, indicating excessive vegetative growth at the expense of N remobilization to grain [44]. These results emphasize that maximizing N supply does not necessarily lead to higher N use efficiency or grain yield.
In contrast, pea showed inconsistent and context-dependent responses to N fertilization. Higher N availability increased pea grain yield, pod weight, HI, and NHI, suggesting that pea was more dependent on mineral N rather than biological N fixation under short and stressful cycles, like in the first year. In contrast, in the second year, under optimal growth conditions, increased N supply reduced pod number and pod biomass, possibly due to inhibition of rhizobial activity and reduced symbiotic efficiency, which has been widely reported for legumes exposed to high soil mineral N levels [6,9,10].
Overall, under stress or disturbed phenological conditions, legumes show positive responses to NF, while pea performance relies more on BNF under optimal conditions.
In both years, the intermediate NF rate (70 kg N ha−1) represented the best agronomic compromise, allowing high productivity of both crops while preserving wheat nitrogen efficiency, maintaining legume function, and avoiding excessive vegetative growth. This NF rate also favoured good weed control by providing a rapid canopy closure without overstimulation of the spontaneous vegetation.
Even if in this study N dynamics have been based on crop yield and nutrient accumulation, and direct measurement studies of mineral N in soils and BNF have not been conducted, considering all the above observations together, we conclude that under shorter crop cycles, NF is a yield driver, while during optimal cycle duration, N regulates assimilative distribution and nutrient efficiency.

5. Conclusions

Although further research is needed to validate different herbaceous and tree crop combinations under different pedoclimatic conditions, our study underscores that wheat–pea IC is a sound agroecological strategy able to balance, under Mediterranean conditions, the requirements for productivity with those of nitrogen use efficiency and resilience. The IC displayed functional plasticity both for forage and grain production, while maintaining productivity and N efficiency even in challenging climatic and management conditions.
Moreover, we did not find any yield penalty in the silvo-arable system, supporting the agroecological value of integrating annual intercrops with tree components.
Finally, N management was identified as one of the major drivers affecting system performance, and 70 kg ha−1 was proven to be the most sustainable strategy to obtain both forage and grain.

Supplementary Materials

The following supporting information can be downloaded at: https://www.mdpi.com/article/10.3390/agronomy16070727/s1, Table S1: p values of the fixed effects, T, CS, NF and their interaction on the LAI of the crops in the two years of the experiment; Table S2: p values of the fixed effects, CS, NF and their interaction on the AGB, N %, N acc, C %, C acc, P %, and P acc of the crops at flowering in the two years of the experiment; Table S3: p values of the fixed effects, CS, NF and their interaction on the wheat grain yield, straw, total biomass, HI, spike biomass, and spike MW, pea grain yield, straw, total biomass, HI, pod MW, pod biomass, pod Nb, and IC total biomass at maturity in the two years of the experiment; Table S4: p values of the fixed effects, CS, NF and their interaction on the AGB, N %, N acc, C %, C acc, P %, and P acc of the crops at maturity in the two years of the experiment; Table S5: p values of the fixed effects, CS, NF and their interaction on the nitrogen NHI in wheat and pea at maturity. Figure S1: Grain nitrogen concentration in pea at maturity during the 2023–2024 growing season as affected by the interaction between cropping systems; Figure S2: Leaf area index trends across sampling dates under different cropping systems.

Author Contributions

Conceptualization, D.A., S.P. and L.G.T.; methodology, D.A., S.P. and L.G.T.; software, S.P. and S.A.-B.; validation, D.A., S.P. and L.G.T.; formal analysis, S.P. and S.A.-B.; investigation, S.P., L.G.T., À.P.-S., S.A.-B., E.M. and G.S.; resources, D.A.; data curation, S.P. and S.A.-B.; writing—original draft preparation, S.A.-B. and S.P.; writing—review and editing, D.A., S.P., L.G.T., À.P.-S., S.A.-B., E.M. and G.S.; visualization, D.A., S.P., L.G.T. and S.A.-B.; supervision, D.A. and S.P.; project administration, D.A.; funding acquisition, D.A. All authors have read and agreed to the published version of the manuscript.

Funding

This study was carried out within the Agritech National Research Center and received funding from the European Union Next Generation EU (Piano Nazionale di Ripresa e Resilienza (PNRR)—Missione 4, Componente 2, Investimento 1.4—D.D. 1032 17/06/2022, CN00000022). Silvia Pampana co-authored this publication as part of her research activities funded by the European Union Next Generation EU (Piano Nazionale di Ripresa e Resilienza (PNRR)).

Data Availability Statement

The data presented in this study are available on request from the corresponding author.

Acknowledgments

The authors would like to thank the Centre for Agri-environmental Research “Enrico Avanzi” of the University of Pisa for hosting the trials and for the technical support, and Carla Catalano Ricci for the field sampling during her Master’s thesis work.

Conflicts of Interest

The authors declare no conflicts of interest.

References

  1. Li, L.; Tilman, D.; Lambers, H.; Zhang, F.-S. Plant diversity and overyielding: Insights from belowground facilitation of intercropping in agriculture. New Phytol. 2014, 203, 63–69. [Google Scholar] [CrossRef] [PubMed]
  2. Yu, Y.; Stomph, T.J.; Makowski, D.; Zhang, L.; van der Werf, W. A meta-analysis of relative crop yields in cereal/legume mixtures suggests options for management. Field Crops Res. 2016, 198, 269–279. [Google Scholar] [CrossRef]
  3. Monti, M.; Pellicanò, A.; Santonoceto, C.; Preiti, G.; Pristeri, A. Yield components and nitrogen use in cereal-pea intercrops in Mediterranean environment. Field Crops Res. 2016, 196, 379–388. [Google Scholar] [CrossRef]
  4. Jensen, E.S. Grain yield, symbiotic N2 fixation and interspecific competition for inorganic N in pea-barley intercrops. Plant Soil 1996, 182, 25–38. [Google Scholar] [CrossRef]
  5. Pampana, S.; Arduini, I.; Andreuccetti, V.; Mariotti, M. Fine-Tuning N Fertilization for Forage and Grain Production of Barley–Field Bean Intercropping in Mediterranean Environments. Agronomy 2022, 12, 418. [Google Scholar] [CrossRef]
  6. Pampana, S.; Masoni, A.; Mariotti, M.; Ercoli, L.; Arduini, I. Nitrogen fixation of grain legumes differs in response to nitrogen fertilisation. Exp. Agric. 2018, 54, 66–82. [Google Scholar] [CrossRef]
  7. Lai, H.; Gao, F.; Su, H.; Zheng, P.; Li, Y.; Yao, H. Nitrogen Distribution and Soil Microbial Community Characteristics in a Legume–Cereal Intercropping System: A Review. Agronomy 2022, 12, 1900. [Google Scholar] [CrossRef]
  8. Jensen, E.S.; Carlsson, G.; Hauggaard-Nielsen, H. Intercropping of grain legumes and cereals improves the use of soil N resources and reduces the requirement for synthetic fertilizer N: A global-scale analysis. Agron. Sustain. Dev. 2020, 40, 5. [Google Scholar] [CrossRef]
  9. Corre-Hellou, G.; Fustec, J.; Crozat, Y. Interspecific competition for soil N and its interaction with N2 fixation, leaf expansion and crop growth in pea–barley intercrops. Plant Soil 2006, 282, 195–208. [Google Scholar] [CrossRef]
  10. Naudin, C.; Corre-Hellou, G.; Pineau, S.; Crozat, Y.; Jeuffroy, M.-H. The effect of various dynamics of N availability on winter pea–wheat intercrops: Crop growth, N partitioning and symbiotic N2 fixation. Field Crops Res. 2010, 119, 2–11. [Google Scholar] [CrossRef]
  11. Zhang, D.; Du, G.; Sun, Z.; Bai, W.; Wang, Q.; Feng, L.; Zheng, J.; Zhang, Z.; Liu, Y.; Yang, S.; et al. Agroforestry enables high efficiency of light capture, photosynthesis and dry matter production in a semi-arid climate. Eur. J. Agron. 2018, 94, 1–11. [Google Scholar] [CrossRef]
  12. Panozzo, A.; Quataert, P.; De Swaef, T.; Pardon, P.; Vamerali, T.; Verheyen, K.; Reubens, B. A meta-analysis on the impact of trees on yield of intercrops in alley-cropping systems of temperate climates. Agric. Syst. 2026, 232, 104578. [Google Scholar] [CrossRef]
  13. Tramacere, L.G.; Sbrana, M.; Antichi, D. N2 Use in perennial swards intercropped with young poplars, clone I-214 (Populus × euramericana (Dode) Guinier), in the Mediterranean area under rainfed conditions. Agronomy 2023, 13, 1761. [Google Scholar] [CrossRef]
  14. Majaura, M.; Böhm, C.; Freese, D. The influence of trees on crop yields in temperate zone alley cropping systems: A review. Sustainability 2024, 16, 3301. [Google Scholar] [CrossRef]
  15. Smith, J.; Pearce, B.D.; Wolfe, M.S. Reconciling productivity with protection of the environment: Is temperate agroforestry the answer? Renew. Agric. Food Syst. 2013, 28, 80–92. [Google Scholar] [CrossRef]
  16. Jevtić, R.; Župunski, V.; Grčak, M.; Živančev, D.; Knežević, D. Cereal–pea intercropping reveals variability in the relationships among yield, quality parameters, and obligate pathogens infection in wheat, rye, oat, and triticale, in a temperate environment. Plants 2023, 12, 2067. [Google Scholar] [CrossRef]
  17. Soil Survey Staff. Soil Taxonomy: A Basic System of Soil Classification for Making and Interpreting Soil Surveys, 2nd ed.; Agriculture Handbook No. 436; Natural Resources Conservation Service, U.S. Department of Agriculture (USDA): Washington, DC, USA, 1999.
  18. Indorante, S.J.; Follmer, L.R.; Hammer, R.D.; Koenig, P.G. Particle-Size Analysis by a Modified Pipette Procedure. Soil Sci. Soc. Am. J. 1990, 54, 560–563. [Google Scholar] [CrossRef]
  19. Walkley, A.; Black, I.A. An Examination of the Degtjareff Method for Determining Soil Organic Matter and a Proposed Modification of the Chromic Acid Titration Method. Soil Sci. 1934, 37, 29–38. [Google Scholar] [CrossRef]
  20. ASTM D4972-95a; Standard Test Method for pH of Soils. ASTM International: West Conshohocken, PA, USA, 1995.
  21. Bremner, J.M. Determination of nitrogen in soil by the Kjeldahl method. J. Agric. Sci. 1960, 55, 11–33. [Google Scholar] [CrossRef]
  22. Olsen, S.R.; Cole, C.V.; Watanabe, F.S.; Dean, L.A. Estimation of Available Phosphorus in Soils by Extraction with Sodium Bicarbonate; USDA Circular No. 939; U.S. Department of Agriculture: Washington, DC, USA, 1954.
  23. Meier, U. (Ed.) Growth Stages of Mono- and Dicotyledonous Plants: BBCH Monograph; Federal Biological Research Centre for Agriculture and Forestry: Berlin, Germany, 2001.
  24. Wieczorek, D.; Żyszka-Haberecht, B.; Kafka, A.; Lipok, J. Determination of phosphorus compounds in plant tissues: From colourimetry to advanced instrumental analytical chemistry. Plant Methods 2022, 18, 22. [Google Scholar] [CrossRef]
  25. Fischer, R.A. Number of kernels in wheat crops and the influence of solar radiation and temperature. J. Agric. Sci. 1985, 105, 447–461. [Google Scholar] [CrossRef]
  26. Ru, C.; Hu, X.; Chen, D.; Song, T.; Wang, W.; Lv, M.; Hansen, N.C. Nitrogen Modulates the Effects of Short-Term Heat, Drought and Combined Stresses after Anthesis on Photosynthesis, Nitrogen Metabolism, Yield, and Water and Nitrogen Use Efficiency of Wheat. Water 2022, 14, 1407. [Google Scholar] [CrossRef]
  27. Todaro, V.; D’Oria, M.; Secci, D.; Zanini, A.; Tanda, M.G. Climate Change over the Mediterranean Region: Local Temperature and Precipitation Variations at Five Pilot Sites. Water 2022, 14, 2499. [Google Scholar] [CrossRef]
  28. Guan, C.; Zhang, D.; Chu, C. Interplay of Light and Nitrogen for Plant Growth and Development. Crop J. 2025, 13, 641–655. [Google Scholar] [CrossRef]
  29. Wu, W.; Chen, L.; Liang, R.; Huang, S.; Li, X.; Huang, B.; Luo, H.; Zhang, M.; Wang, X.; Zhu, H. The Role of Light in Regulating Plant Growth, Development and Sugar Metabolism: A Review. Front. Plant Sci. 2025, 15, 1507628. [Google Scholar] [CrossRef] [PubMed]
  30. Pardon, P.; Reubens, B.; Mertens, J.; Verheyen, K.; De Frenne, P.; de Smet, G.; Van Waes, C.; Reheul, D. Effects of temperate agroforestry on yield and quality of different arable intercrops. Agric. Syst. 2018, 166, 135–151. [Google Scholar] [CrossRef]
  31. Reynolds, P.E.; Simpson, J.A.; Thevathasan, N.V.; Gordon, A.M. Effects of tree competition on corn and soybean photosynthesis, growth, and yield in a temperate tree-based agroforestry intercropping system in southern Ontario, Canada. Ecol. Eng. 2007, 29, 362–371. [Google Scholar] [CrossRef]
  32. Piotto, S.; Panozzo, A.; Pasqualotto, G.; Carraro, V.; Barion, G.; Mezzalira, G.; Furlan, L.; Moore, S.S.; Vamerali, T. Phenology and radial growth of poplars in wide alley agroforestry systems and the effect on yield of annual intercrops in the first four years of tree age. Agric. Ecosyst. Environ. 2024, 361, 108814. [Google Scholar] [CrossRef]
  33. Panozzo, A.; Bolla, P.K.; Barion, G.; Visioli, G.; Vamerali, T. Morpho-physiological and agronomic responses of wheat varieties under artificial shade in agroforestry systems. J. Sci. Food Agric. 2026, 106, 303–316. [Google Scholar] [CrossRef]
  34. Arenas-Corraliza, M.G.; Rolo, V.; López-Díaz, M.L.; Moreno, G. Wheat and barley can increase grain yield in shade through acclimation of physiological and morphological traits in Mediterranean conditions. Sci. Rep. 2019, 9, 9547. [Google Scholar] [CrossRef]
  35. Blanchet, G.; Barkaoui, K.; Bradley, M.; Dupraz, C.; Gosme, M. Interactions between drought and shade on the productivity of winter pea grown in a 25-year-old walnut-based alley cropping system. J. Agron. Crop Sci. 2022, 208, 583–598. [Google Scholar] [CrossRef]
  36. Tramacere, L.G.; Antichi, D.; Mele, M.; Ragaglini, G.; Mantino, A. Effects of intercropping on the herbage production of a binary grass-legume mixture (Hedysarum coronarium L. and Lolium multiflorum Lam.) under artificial shade in Mediterranean rainfed conditions. Agrofor. Syst. 2024, 98, 1445–1460. [Google Scholar] [CrossRef]
  37. Carrier, M.; Rhéaume Gonzalez, F.-A.; Cogliastro, A.; Olivier, A.; Vanasse, A.; Rivest, D. Light availability, weed cover and crop yields in second generation of temperate tree-based intercropping systems. Field Crops Res. 2019, 239, 30–37. [Google Scholar] [CrossRef]
  38. Mantino, A.; Tozzini, C.; Bonari, E.; Mele, M.; Ragaglini, G. Competition for light affects alfalfa biomass production more than its nutritive value in an olive-based alley-cropping system. Forests 2021, 12, 233. [Google Scholar] [CrossRef]
  39. Mantino, A.; Pecchioni, G.; Tozzini, C.; Mele, M.; Ragaglini, G. Agronomic performance of soybean and sorghum in a short rotation poplar coppice alley-cropping system under Mediterranean conditions. Agrofor. Syst. 2023, 97, 1025–1039. [Google Scholar] [CrossRef]
  40. Devkota, N.R.; Kemp, P.D.; Hodgson, J.; Valentine, I.; Jaya, I.K.D. Relationship between tree canopy height and the production of pasture species in a silvopastoral system based on alder trees. Agrofor. Syst. 2009, 76, 363–374. [Google Scholar] [CrossRef]
  41. Perry, M.E.L.; Schacht, W.H.; Ruark, G.A.; Brandle, J.R. Tree canopy effect on grass and grass/legume mixtures in eastern Nebraska. Agrofor. Syst. 2009, 77, 23–35. [Google Scholar] [CrossRef]
  42. Benalia, H.; Lambarraa-Lehnhardt, F.; Bouras, F.-Z.; Kherif, O.; Zemmouri, B.; Seghouani, M.; Guetaf, F.; Ferhat, M.; Latati, M. Comparative assessment of agroforestry performances between pea and barley intercropping with olive tree under Mediterranean conditions. Agrofor. Syst. 2024, 98, 619–635. [Google Scholar] [CrossRef]
  43. Michalitsis, A.; Papakaloudis, P.; Pankou, C.; Lithourgidis, A.; Dordas, C. Sustainable Intensification of Olive Agroecosystems via Barley, Triticale, and Pea Intercropping. Agronomy 2025, 15, 2333. [Google Scholar] [CrossRef]
  44. Li, C.; Shi, Y.; Yu, Z.; Zhang, Y.; Zhang, Z. Optimizing Nitrogen Application Strategies Can Improve Grain Yield by Increasing Dry Matter Translocation, Promoting Grain Filling, and Improving Harvest Indices. Front. Plant Sci. 2025, 16, 1565446. [Google Scholar] [CrossRef]
Figure 1. Diagram of the experimental design of the trial carried out in Pisa, central Italy, in 2023–2024 and 2024–2025, comparing pea–wheat IC in arable and silvo-arable systems. (a) Example plot of the arable system (without trees), and (b) example plot of the silvorabale system (with trees). Each plot was 10.5 × 8 m, and for each cropping system three N fertilizations were applied following a two-way randomized complete block design with three replications. Drawing not to scale. Created in BioRender. Pampana, S. (2026) (https://BioRender.com/10ie4e6 (accessed on 24 March 2026)).
Agronomy 16 00727 g001
Figure 2. Monthly average total precipitation and mean minimum and maximum temperatures during the experimental period (October 2023–July 2025) and the long-term period (1993–2025). Data source: Regional Hydrological Service, Tuscany Region.
Agronomy 16 00727 g002
Figure 3. Box plots of wheat biomass (a), pea biomass (b), total intercrop (IC) biomass (c), and nutrient contents (dg) at the flowering stage during the 2023–2024 and 2024–2025 growing seasons. Carbon (C) and phosphorus (P) were measured at flowering only in the 2024–2025 season. The main body of the boxplot shows the interquartile range (IQR = Q3–Q1), and the central line shows the median (Q2). Whiskers (bars) represent Q1-1.15 IQR (lower) and Q3 + 1.5 IQR (upper), and dots indicate outliers. Within each year, where a significant effect of NF was observed, treatments with the same letter were not significantly different at (p ≤ 0.05 Tukey’s HSD test).
Agronomy 16 00727 g003
Figure 4. Box plots of wheat grain biomass (a), wheat straw biomass (b), wheat total aboveground biomass (c), wheat harvest index (HI) (d), spike biomass (e), and spike mean weight (f) at maturity during the 2023–2024 and 2024–2025 growing seasons. The main body of the boxplot shows the interquartile range (IQR = Q3–Q1), and the central line shows the median (Q2). Whiskers (bars) represent Q1-1.15 IQR (lower) and Q3 + 1.5 IQR (upper), and dots indicate outliers. Within each year, where a significant effect of NF was observed, treatments with the same letter were not significantly different at (p ≤ 0.05 Tukey’s HSD test).
Agronomy 16 00727 g004
Figure 5. Box plots of pea grain biomass (a), pea harvest index (HI) (b), pod mean weight (c), pod biomass (d), pod number per unit area (e), and total intercrop (IC) aboveground biomass (f) at maturity during the 2023–2024 and 2024–2025 growing seasons. The main body of the boxplot shows the interquartile range (IQR = Q3–Q1), and the central line shows the median (Q2). Whiskers (bars) represent Q1-1.15 IQR (lower) and Q3 + 1.5 IQR (upper), and dots indicate outliers. Within each year, where a significant effect of NF was observed, treatments with the same letter were not significantly different at (p ≤ 0.05 Tukey’s HSD test).
Agronomy 16 00727 g005
Figure 6. Box plots of nitrogen concentration in wheat vegetative biomass (% N) (a), N accumulation in wheat vegetative biomass (b), C accumulation in wheat vegetative biomass (c), P accumulation in wheat vegetative biomass (d), N accumulation in wheat grain (e), and C accumulation in wheat grain (f) at maturity during the 2023–2024 and 2024–2025 growing seasons. The main body of the boxplot shows the interquartile range (IQR = Q3–Q1), and the central line shows the median (Q2). Whiskers (bars) represent Q1-1.15 IQR (lower) and Q3 + 1.5 IQR (upper), and dots indicate outliers. Within each year, where a significant effect of NF was observed, treatments with the same letter were not significantly different at (p ≤ 0.05 Tukey’s HSD test).
Agronomy 16 00727 g006
Figure 7. Box plots of N concentration in pea vegetative biomass (% N) (a), N accumulation in pea vegetative biomass (b), C accumulation in pea vegetative biomass (c), P accumulation in pea vegetative biomass (d), N accumulation in pea grain (e), C accumulation in pea grain (f) at maturity during the 2023–2024 and 2024–2025 growing seasons. The main body of the boxplot shows the interquartile range (IQR = Q3–Q1), and the central line shows the median (Q2). Whiskers (bars) represent Q1-1.15 IQR (lower) and Q3 + 1.5 IQR (upper), and dots indicate outliers. Within each year, where a significant effect of NF was observed, treatments with the same letter were not significantly different at (p ≤ 0.05 Tukey’s HSD test).
Agronomy 16 00727 g007
Table 1. Physical and chemical properties of the experimental soil in Pisa, central Italy. Values are averaged over the two years.
ParameterUnitValueMethodReference
Sand (2000–2 µm)g kg−1361Modified pipetteIndorante et al., 1990 [18]
Silt (2–50 µm)g kg−1524
Clay (50–2000 µm)g kg−1115
Organic matterg 100 g−11.7Walkley and BlackWalkley and Black, 1934 [19]
pH-8.1PotentiometricASTM, 1995 [20]
Total nitrogeng kg−11.2KjeldahlBremner, 1960 [21]
Available phosphorusmg kg−131OlsenOlsen et al., 1954 [22]
Table 2. Mean comparison of the nitrogen harvest index (NHI) in wheat and pea at maturity during the 2023–2024 and 2024–2025 growing seasons under different cropping systems and N fertilization rates. For each trait within each factor, means followed by different letters are significantly different according to Tukey’s HSD test (p < 0.05).
NHI Wheat NHI Pea
2023–2024 2024–2025 2023–2024 2024–2025
Cropping System (CS)
AR 0.489 a 0.699 a 0.576 a 0.555 a
SIAR 0.514 a 0.671 a 0.541 a 0.466 a
N Fertilization (NF)
0 0.627 a 0.743 a 0.353 b 0.581 a
70 0.468 ab 0.731 a 0.580 a 0.496 a
140 0.410 b 0.581 b 0.742 a 0.454 a
Disclaimer/Publisher’s Note: The statements, opinions and data contained in all publications are solely those of the individual author(s) and contributor(s) and not of MDPI and/or the editor(s). MDPI and/or the editor(s) disclaim responsibility for any injury to people or property resulting from any ideas, methods, instructions or products referred to in the content.