Article

Comparative Transcriptome Analysis Reveals Novel Insights into Regulatory Mechanisms of Seed Protein and Oil Accumulation in Soybeans


1
Key Laboratory of Soybean Molecular Design Breeding, Northeast Institute of Geography and Agroecology, Chinese Academy of Sciences, Harbin 150081, China
2
University of Chinese Academy of Sciences, Beijing 100049, China
3
Crop Institute of Anhui Academy of Agricultural Sciences, Bio-Breeding Laboratory of Anhui Province, Hefei 230031, China
4
Institute of Plant Sciences, Agricultural Research Organization (ARO)—Volcani Institute, Rishon LeZion 7505101, Israel
5
Heihe Branch Institute, Heilongjiang Academy of Agricultural Sciences, Heihe 164399, China
*
Authors to whom correspondence should be addressed.
Agronomy 2026, 16(5), 562; https://doi.org/10.3390/agronomy16050562
Submission received: 30 January 2026 / Revised: 27 February 2026 / Accepted: 1 March 2026 / Published: 4 March 2026
(This article belongs to the Special Issue Functional Genomics and Molecular Breeding of Soybeans—2nd Edition)

Abstract

Soybean seed quality is defined by an inverse relationship between oil and protein content. Understanding the spatiotemporal regulation of this trade-off is crucial for breeding. This study aims to dissect the transcriptomic networks governing carbon and nitrogen partitioning during seed development. Here, transcriptomic and co-expression network analyses were performed on cotyledon and seedcoat tissues of high-protein (HP) and low-protein (LP) soybean cultivars across three seed developmental stages. We identified 4910 HP/LP-specific differentially expressed genes (DEGs), with striking transcriptional alterations in the early developmental stage. Notably, some important DEGs were enriched in carbon/lipid metabolism, protein folding, and hormone/circadian signaling pathways, among which key gene families (e.g., OLEs, SWEETs, HSPs), core regulators (e.g., LACS, L1L, ABF1), and QTL-localized candidate genes (e.g., FA9) were characterized. Mechanistically, C/VIF1-mediated post-translational inhibition of CWINV1 may restrict carbon flux to oil synthesis in HP seeds; upstream circadian/hormone signaling and L1L-sHSPs jointly promote protein deposition, uncoupling the oil–protein trade-off and enabling HP trait formation. In contrast, LP cultivars upregulated SWEETs, OLEs, and LTPs to facilitate high carbon flux into lipid biosynthesis and storage. These findings provide valuable genetic targets for precision breeding programs aimed at optimizing resource allocation.

1. Introduction

Soybeans [Glycine max (L.) Merr.] are the most essential global sources of edible oil and protein, with seed compositions averaging 18–22% oil and 36–42% protein [1]. Modern soybean cultivars, domesticated from wild soybean (Glycine soja) approximately 5000 years ago, exhibit a well-documented inverse correlation between seed protein and oil content [2]. This trade-off is a manifestation of metabolic competition for shared carbon and nitrogen precursors during seed development, as selection favored larger seeds with a higher oil content, protein concentration typically decreased [3]. Despite the identification of numerous quantitative trait loci (QTLs) and pleiotropic genes (e.g., GmOLEO1, GmSWEET10, GmST05, FA9), the persistent negative correlation between these traits remains a major bottleneck for breeding soybeans with concurrent improvements in yield and nutritional quality [4,5,6,7,8].
A critical barrier to overcoming this trade-off is the complexity of the underlying regulatory networks. While forward genetics has identified key regulators, our understanding of how these genes orchestrate resource partitioning in a spatiotemporal manner remains fragmented. Seed development involves intricate crosstalk between the embryo (sink) and seed coat (source), yet most studies have analyzed whole seeds or single time points, obscuring the dynamic shifts in gene expression that determine final composition. Furthermore, the molecular mechanisms initiating the divergence between high-protein and low-protein trajectories, particularly during the early filling stage, are poorly characterized [9,10,11,12,13].
Recent advances have pinpointed a major-effect QTL on chromosome 20 (cqSeed Protein-003) as a key player in this domestication syndrome [14,15,16,17,18]. Fine-mapping and candidate gene analysis identified the causal gene as Glyma.20G85100, encoding a CCT-domain protein designated POWR1 (Protein, Oil, Weight, Regulator 1) [19,20]. POWR1 resides in a strong selective sweep and exhibits pleiotropy, simultaneously governing seed protein, oil content, and seed weight. Two primary alleles exist: the wild-type allele (POWR1-TE), predominant in G. soja, is associated with high protein and small seeds; conversely, the derived allele (POWR1+TE), containing a 321 bp transposable element insertion in the CCT domain, is associated with increased oil content and seed weight at the expense of protein. However, how this allelic variation translates into transcriptional reprogramming and metabolic flux changes during development remains elusive.
To explore the regulatory basis of this partitioning of carbon and nitrogen resources among oil accumulation and protein synthesis underlying different POWR1 alleles and the potential for metabolic uncoupling, we employed an integrated transcriptomic and co-expression network approach. We profiled gene expression in the embryo and seed coat across three developmental stages (25, 40, and 55 DAF), comparing two high-protein cultivars (POWR1-TE-type) with two low-protein cultivars (POWR1+TE-type). Through comparative analysis, we uncovered differentially expressed genes (DEGs), enriched temporal pathways, and tissue-specific regulators associated with storage reserve accumulation. Weighted gene co-expression network analysis (WGCNA) further identified genotype-specific modules correlated with oil or protein content, allowing us to construct core networks to prioritize candidate genes. By delineating these spatiotemporal dynamics, this study provides new insights into the complex regulation of seed composition and identifies potential targets for mitigating the trade-off between oil and protein accumulation in soybean breeding.

2. Materials and Methods

2.1. Plant Materials and Field Experiments

Four early-maturing spring soybean cultivars—Dongnong 50 (DN50), Dongnong 60 (DN60), Hefeng 25 (HF25), and Heihe 43 (HH43)—widely cultivated in Northeast China, were selected for this study [21]. These cultivars have been grown in the region for years and exhibit stable agronomic traits. Their seeds were planted under natural day-length conditions in Harbin (45° N, 126° E) during the growing season of 2022. These experimental materials were arranged in a randomized complete block design with three biological replicates. Each experimental unit consisted of three-row plots measuring 5 m in length, with 0.20 m inter-row spacing and 0.65 m spacing between adjacent plots. Standard agronomic practices for pest control and weed management were implemented throughout the growing season according to the previous protocols established [21]. The POWR1 genotypes of these cultivars were simultaneously determined via molecular marker analysis by PCR amplification, with the primer shown in Table S1 [22,23].

2.2. Phenotypic Analysis and Sample Preparation

Soybean plants were harvested at the R8 stage (maturity) in 2022, and seeds were dried to <10% moisture content and stored for one month to ensure equilibrium [24,25]. Seed oil and protein contents were measured using a multifunctional near-infrared reflectance spectroscopy system (NIRS™ DS 2500F, FOSS, Eden Prairie, MN, USA) calibrated according to standard soybean reference methods [22].

2.3. RNA Isolation and Transcriptome Sequencing

To capture the dynamic regulation of resource partitioning between storage proteins and oils, developing seeds were collected at 25, 40, and 55 days after flowering (DAF) during the 2023 growing season [26]. The cotyledon (CO) and seed coat (SC) were manually dissected and collected separately, flash-frozen in liquid nitrogen, and stored at −80 °C until processing.
For RNA extraction, each biological replicate was composed of seeds collected and pooled from three independent plants. Two independent biological replicates were prepared for each tissue (embryo and seed coat) at each developmental stage for each variety (DN50, DN60, HF25, and HH43). This resulted in a total of 48 seed samples (2 tissues × 3 stages × 2 biological replicates × 4 varieties) processed for RNA sequencing.
Total RNA was isolated using TRIzol reagent (Invitrogen, Carlsbad, CA, USA) following the manufacturer’s protocol [27]. Prior to library construction, total RNA was treated with RNase-free DNase I (Transgen, Beijing, China) to remove any contamination of genomic DNA. The integrity and concentration of RNA were assessed using an Agilent 2100 Bioanalyzer (Agilent Technologies, Santa Clara, CA, USA). Library construction for RNA-seq was performed following a previously described protocol [28]. The quantified libraries were sequenced on the Illumina HiSeq 2500 sequencing platform (Illumina Inc., San Diego, CA, USA) at Meiji Technologies (Beijing, China), producing 200 bp paired-end reads.

2.4. Transcriptome Data Analysis

Raw sequencing data were generated by Meiji Technologies (Beijing, China) on the Illumina HiSeq 2500 platform. The initial processing of raw reads, including quality control, adapter trimming, and alignment to the reference genome, was performed by the sequencing service provider. Briefly, low-quality bases and adapter sequences were trimmed using Trimmomatic v0.33 with a quality threshold of Q20. The resulting high-quality clean reads were aligned to the soybean reference genome (Glycine max Wm82.a2.v1) using TopHat v2.1.1, allowing for intron sizes ranging from 30 bp to 15,000 bp [29]. Read counts for each annotated gene were generated using featureCounts.
Differential expression analysis (DEGs) between the high-protein (HP) and low-protein (LP) groups was performed using the DESeq2 package in R (v4.4.1), which utilizes a negative binomial distribution model to test for statistical significance based on raw read counts [30,31]. Genes with an adjusted p-value < 0.05 (Benjamini–Hochberg correction for FDR) and an absolute log2 fold change >1 (corresponding to a >2-fold change) were considered significantly differentially expressed [32]. To facilitate the comparison of gene expression levels across samples and for visualization purposes, normalized expression values were calculated as Transcripts Per Million (TPM) [33].

2.5. Differential Expression Analysis and Functional Enrichment

To assess the global transcriptional landscape, raw count data were subjected to dimensionality reduction using R (v4.4.1). Principal Component Analysis (PCA) was performed via the prcomp function to visualize sample relationships, evaluate the repeatability of biological replicates, and reveal overall clustering patterns influenced by genotype and developmental stage. Spearman’s rank correlation (cor function, method = ‘spearman’) was calculated to evaluate replicate consistency. Additionally, hierarchical clustering analysis (HCA) based on Euclidean distances was conducted using the hclust function, and the results were visualized as a cluster dendrogram to confirm grouping. Volcano plots were employed to visualize the distribution of DEGs based on log2 fold change (FC) and statistical significance (−log10 p-value) [34]. DEGs were subjected to functional enrichment analysis via the DAVID bioinformatics database (December 2021) to investigate biological implications, with annotation to the GO and KEGG databases [35,36,37]. Terms with an FDR-corrected p-value < 0.05 were considered significantly enriched.

2.6. Co-Expression Network Analysis

Weighted gene co-expression network analysis (WGCNA) was performed using the WGCNA package in R (v4.4.1) to construct a signed co-expression network and identify modules associated with the oil/protein trait [38]. To ensure robust network construction, the top 30,000 genes (ranked by variance and expressed in at least one sample) were selected as the input matrix. The soft-thresholding power β (4) of the co-expression network was chosen by the criterion of scale-free topology with R2 cutoff (0.85). The network was constructed using the blockwiseModules function with default settings, except for the mergeCutHeight parameter, which was set to 0.25 to optimize module merging. Modules were identified via topological overlap matrix (TOM)-based hierarchical clustering and dynamic tree-cutting algorithms.
To link modules to phenotypic traits, gene significance (GS) was calculated as the Pearson correlation coefficient between individual gene expression profiles and the trait vector (HP vs. LP). Within the trait-correlated modules, an intramodular interaction network was constructed to pinpoint novel candidate regulators. Specifically, gene pairs with connection weights (TOM-based topological overlap) ranking in the top 50 within each module were selected to define a high-confidence sub-network. Hub genes were then defined based on highest module membership (kME) values, a threshold used to filter genes with strong module membership [39]. The resulting core network was visualized using Cytoscape v3.9.1 [40].

2.7. Identification of Candidate Core Regulators

Candidate core regulators were screened from DEGs based on the following integrated criteria: (1) Functional relevance: DEGs annotated with GO terms related to lipid or protein metabolism or showing homology to Arabidopsis thaliana lipid/protein genes; (2) Network centrality: Hub genes (Top 10% connectivity) within WGCNA modules correlated with seed composition traits; (3) Literature support: DEGs overlapping with previously reported seed composition genes [1]; and (4) Regulatory potential: Differentially expressed transcription factors identified via PlantTFDB [41].
To visualize potential interactions, a literature-based association map was manually curated by integrating the candidate core regulators with lipid- and protein-related DEGs, incorporating known seed size regulators to infer potential crosstalk [42].

2.8. Validation of RNA Sequencing Data Reliability

To validate the transcriptomic data, each biological replicate was composed of seeds collected and pooled from three independent plants. Three independent biological replicates were prepared for each tissue (cotyledon and seed coat) at the early developmental stage for two varieties (DN50 and HF25).
Total RNA was extracted using the RNAprep Pure Plant Kit (Tiangen, Beijing, China), and 1 μg of RNA was reverse-transcribed with the EasyScript® One-Step gDNA Removal and cDNA Synthesis SuperMix (TransGen Biotech, Beijing, China). qRT-PCR was performed on an ABI 7500 system (Applied Biosystems, Foster City, CA, USA) using GmActin as the reference gene [43]. Relative expression was calculated using the 2−ΔΔCT method [44]. All reactions included three technical replicates. The correlation between qRT-PCR and RNA-Seq data (log2-transformed) was assessed using the Spearman correlation coefficient. Primers are listed in Table S1.

2.9. Data Analysis

Spearman’s correlation analysis was performed to evaluate relationships between RNA-Seq and RT-PCR in Microsoft Excel. Statistical significance was assessed by Student’s t-test performed in Microsoft Excel.

3. Results

3.1. Phenotypic and Genotypic Analysis of Seed Characteristics

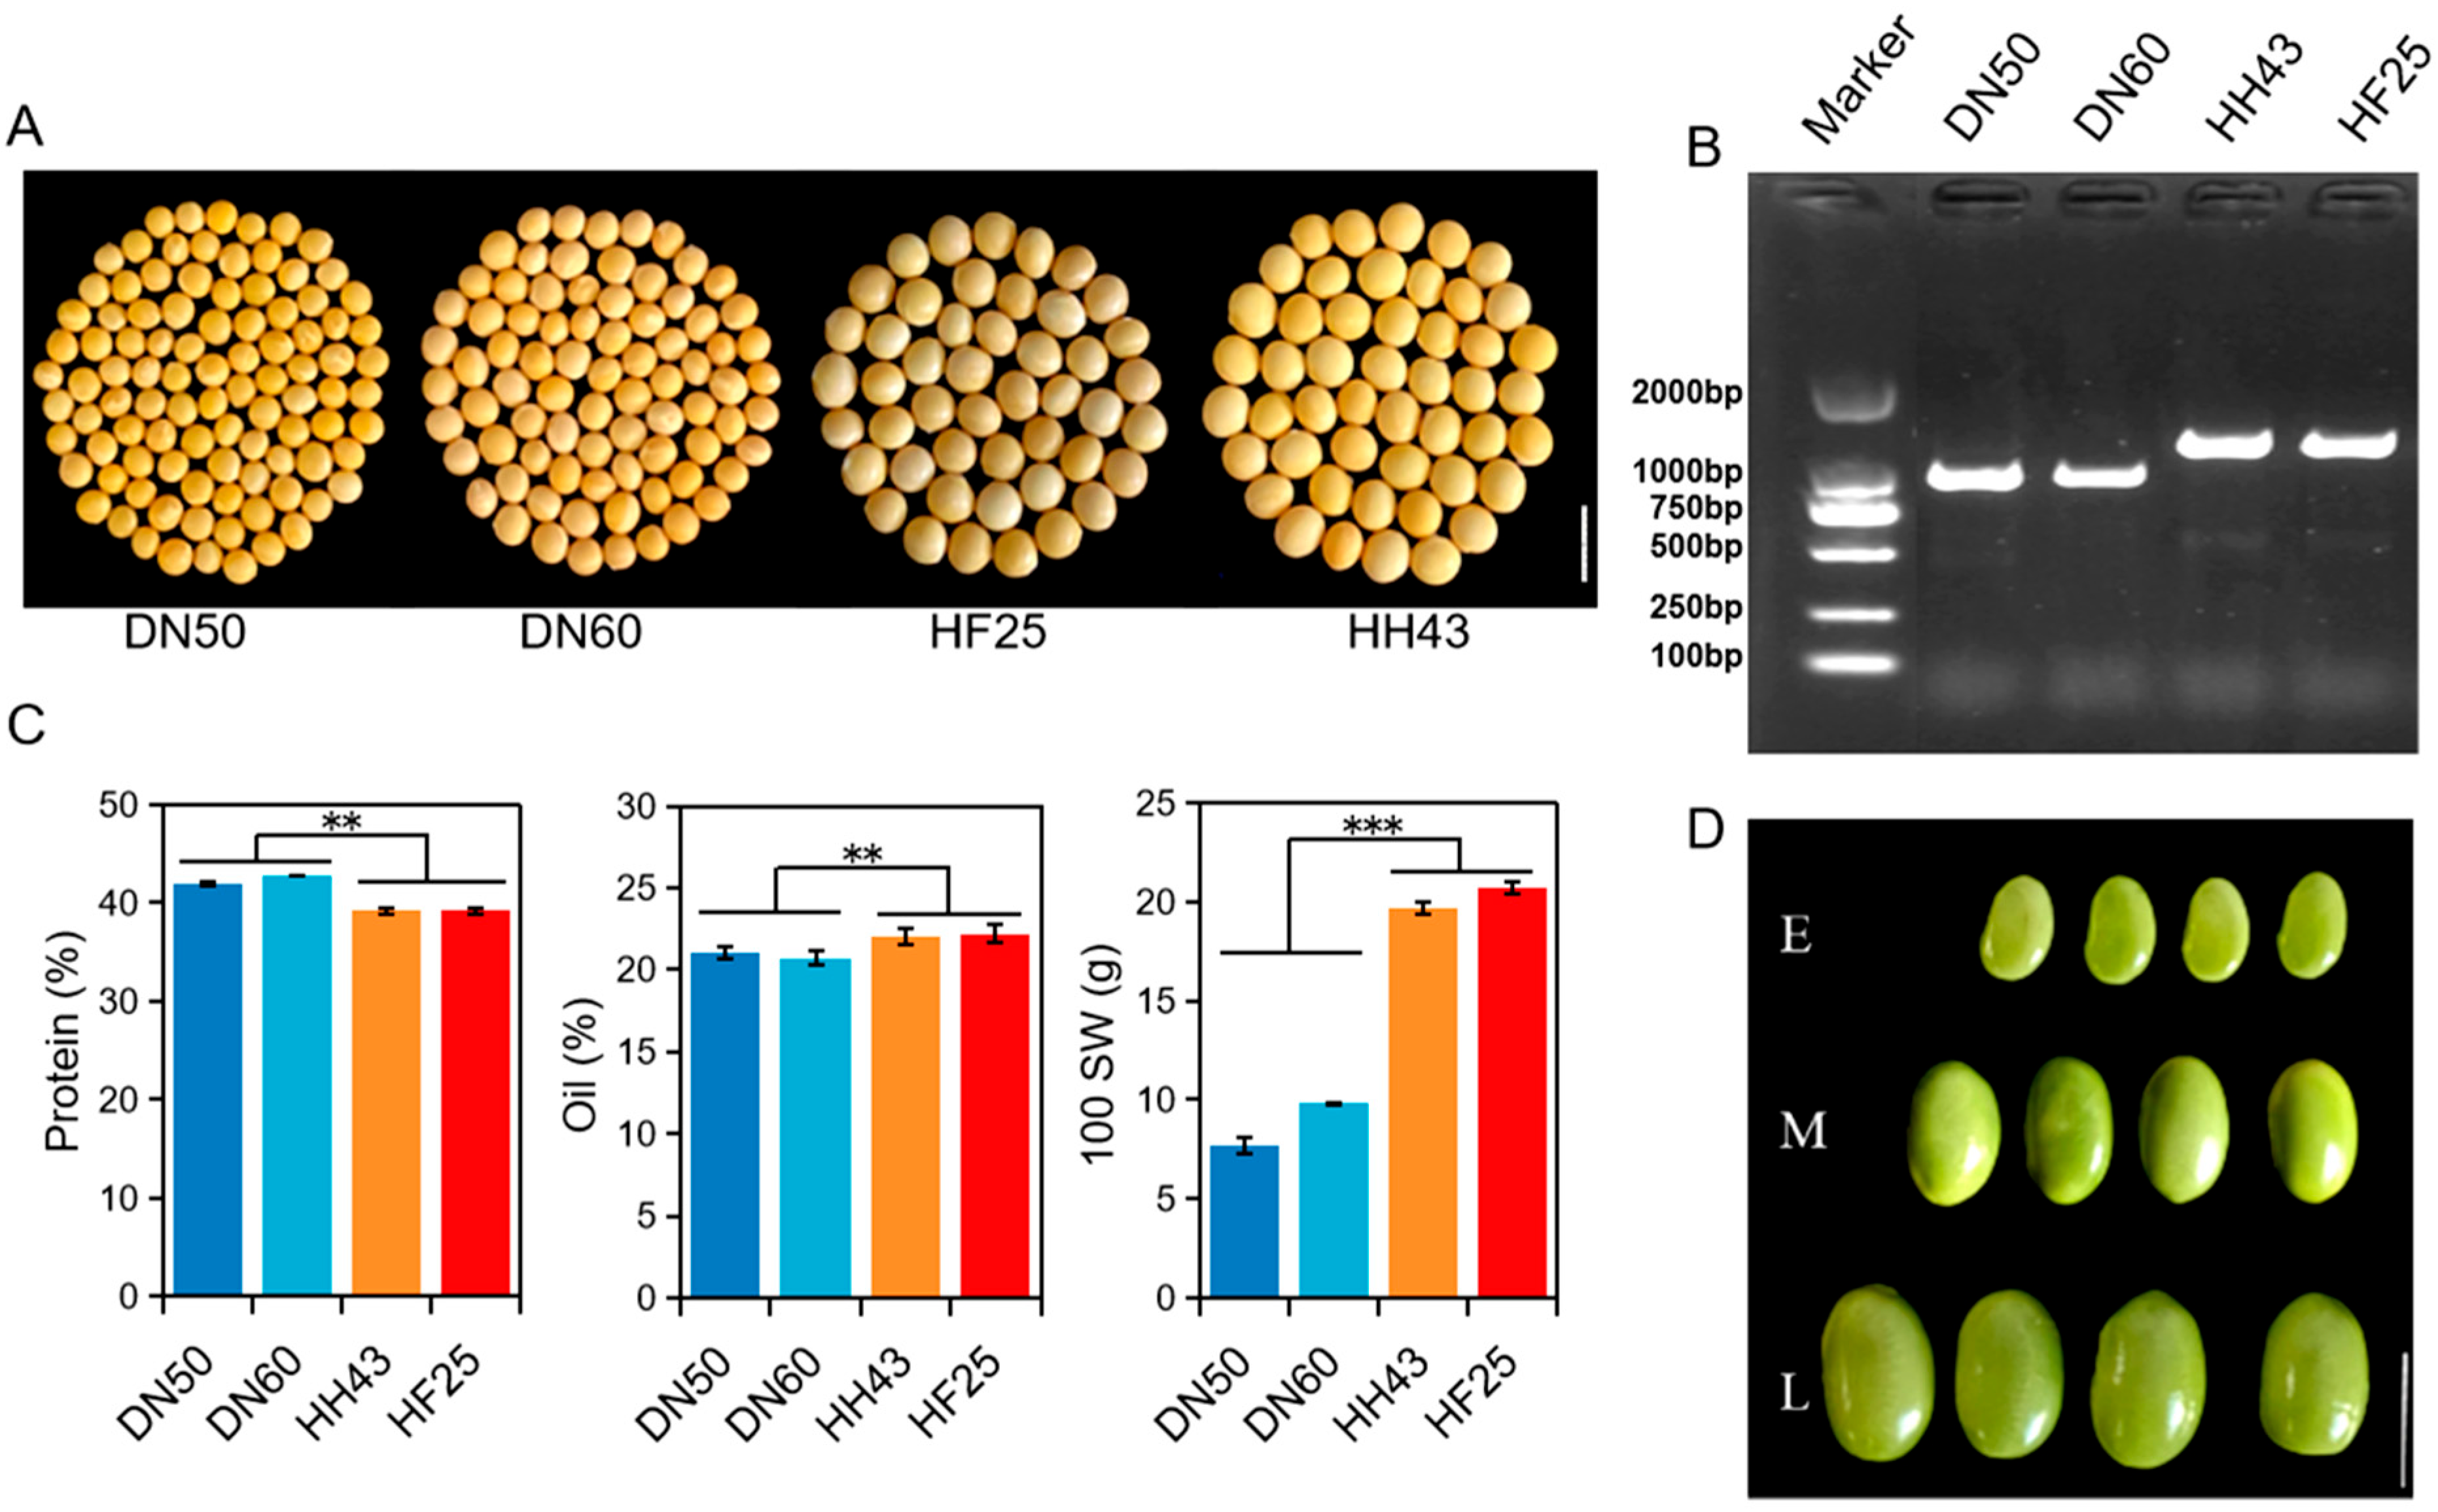
To dissect the molecular basis of seed composition, four early-maturing spring soybean cultivars (DN50, DN60, HF25, HH43) widely cultivated in Northeast China were selected (Figure 1A). Genotyping of the POWR1 locus revealed distinct allelic variations: DN50 and DN60 carry the POWR1-TE allele, while HF25 and HH43 carry the POWR1+TE allele (Figure 1B). Phenotypic analysis confirmed that POWR1-TE cultivars (DN50, DN60) exhibited a high-protein (42.16–42.79%), low-oil (20.7–21.08%), and small-seed (7.65–9.81 g) phenotype. Conversely, POWR1+TE cultivars (HF25, HH43) displayed a low-protein (39.19–39.20%), high-oil (22.04–22.19%), and large-seed (19.70–20.67 g) phenotype (Figure 1A,C). Significant differences (p < 0.05) were observed between the two groups for all traits, with minimal intra-group variation. Based on these contrasting phenotypes, the cultivars were designated as the high-protein (HP) group with low-oil/small-seed phenotypes and the low-protein (LP) group with high-oil/large-seed phenotypes, providing a robust system for investigating transcriptional regulation.

3.2. Identification of Differentially Expressed Genes Across Whole Seed Developmental Stages

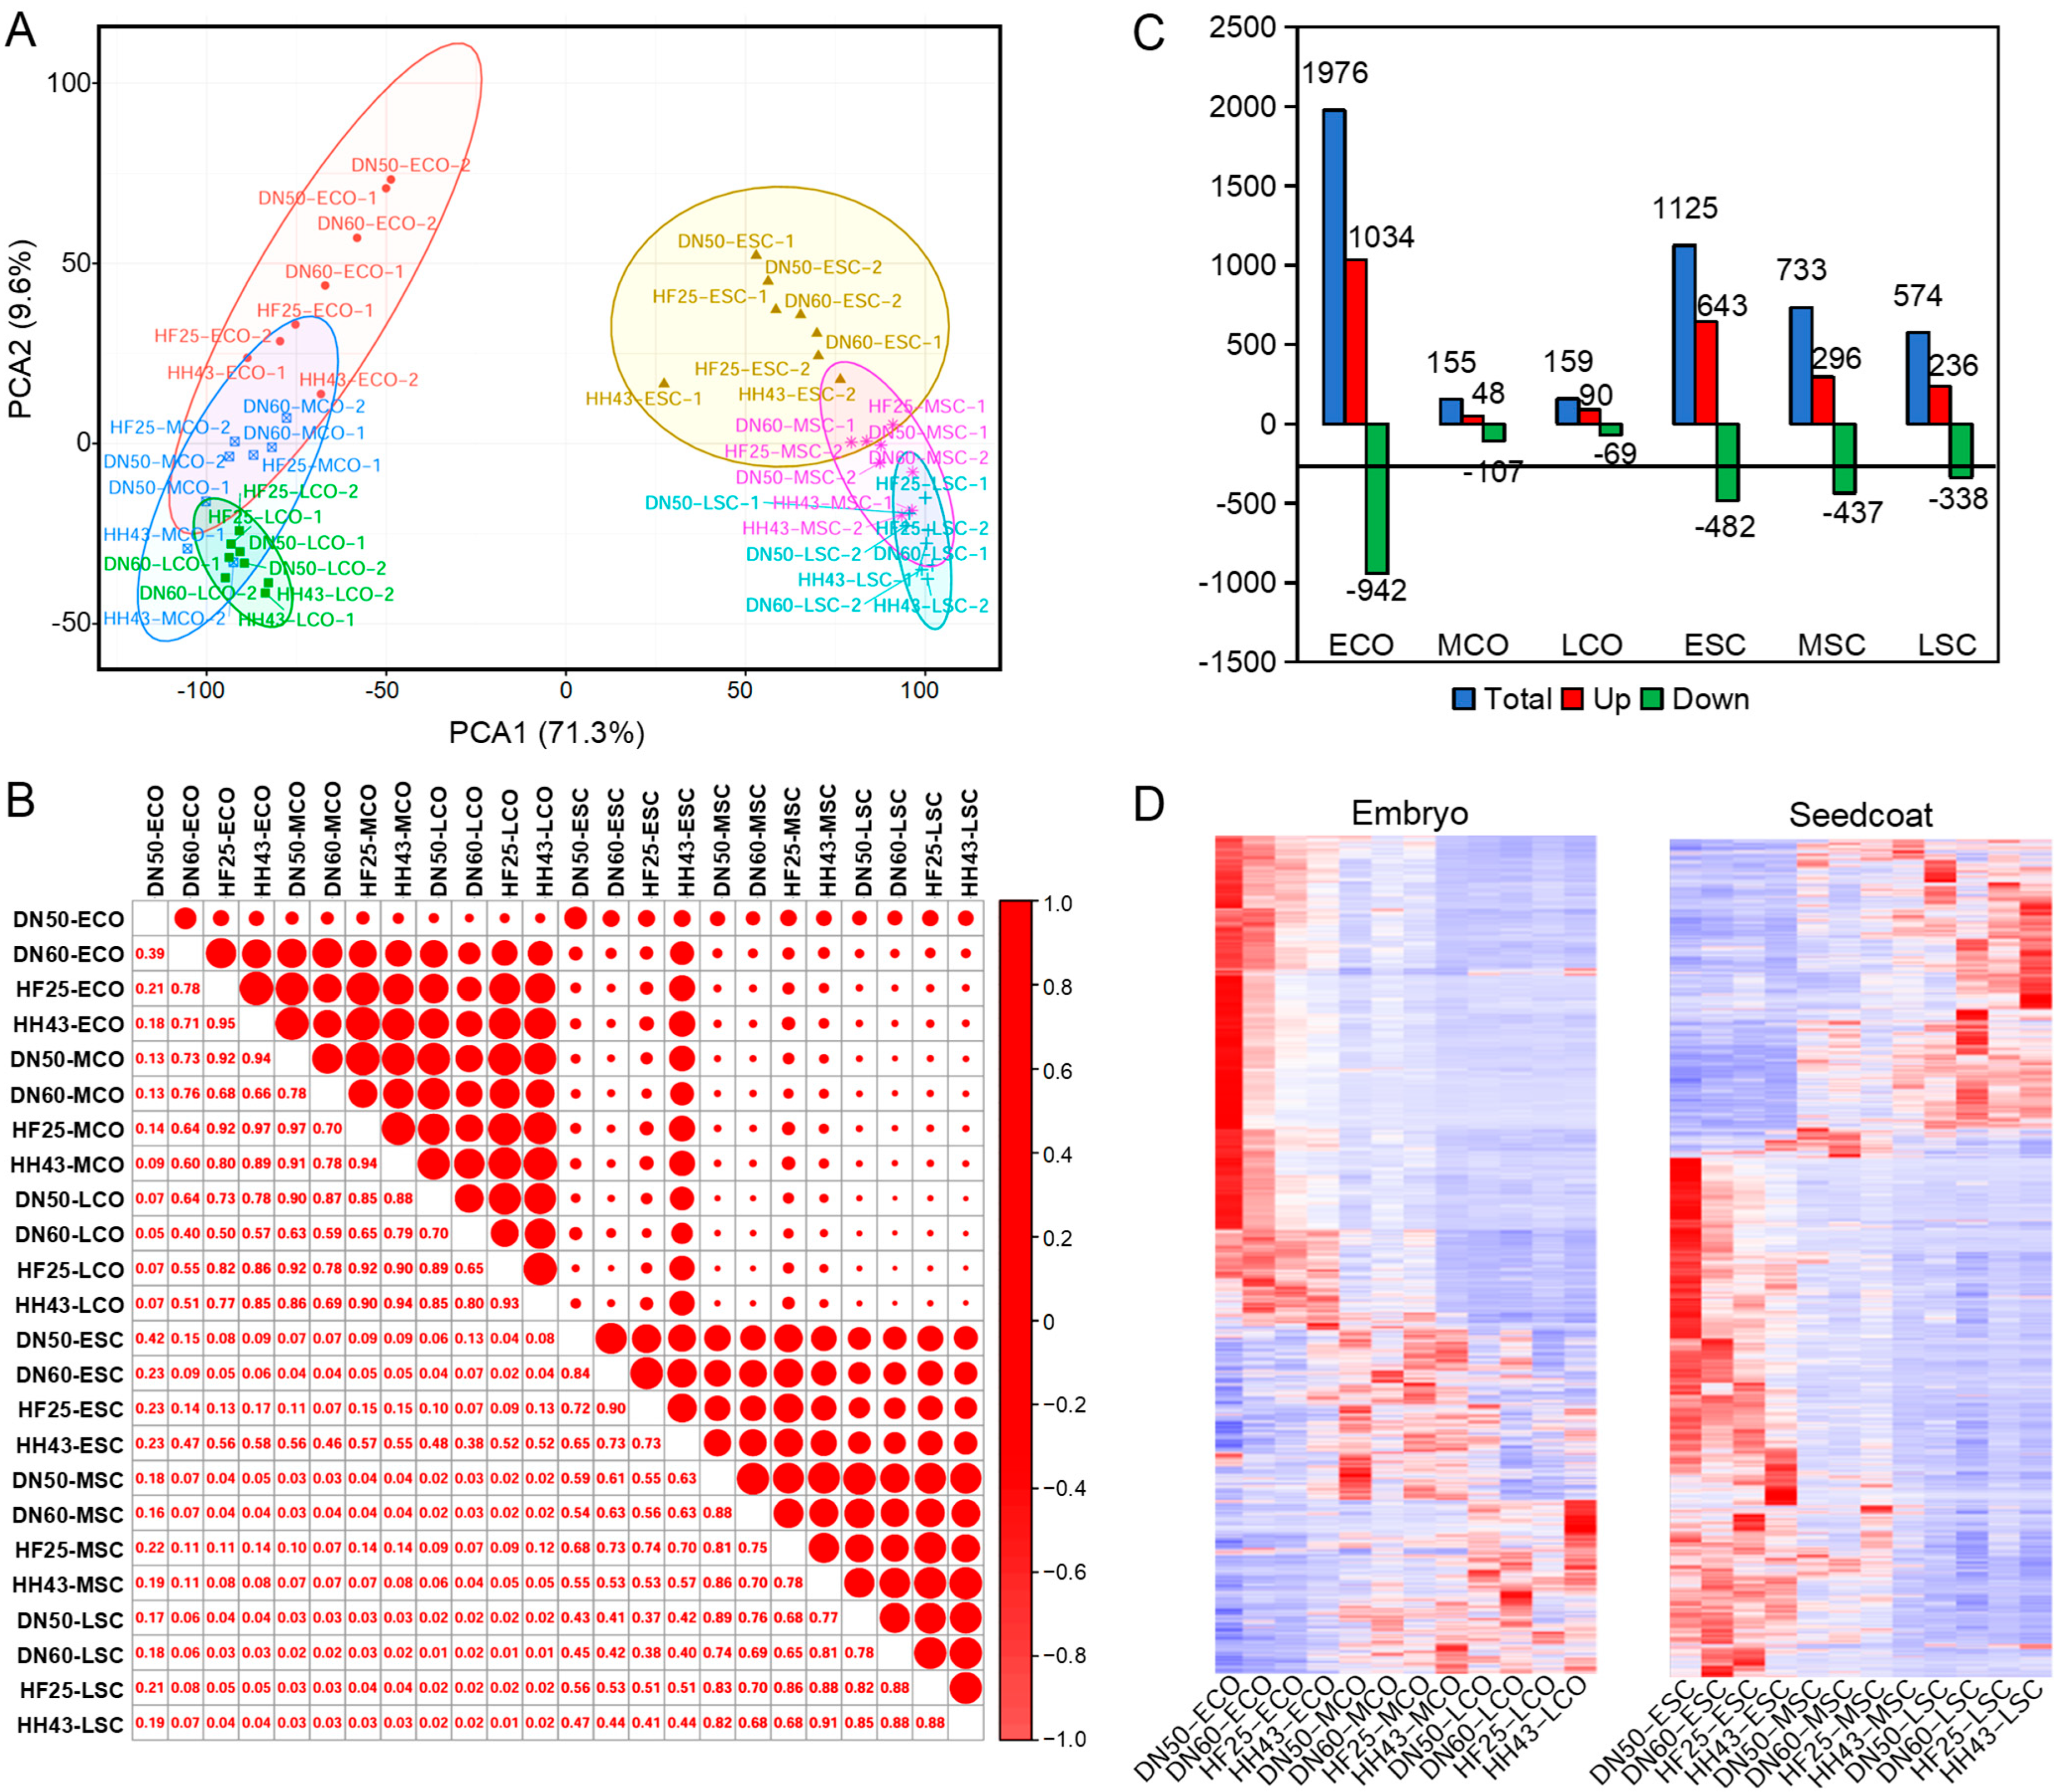
To elucidate the transcriptional dynamics of seed formation, we performed RNA-seq on the seed coat (SC) and cotyledon (CO) of the HP and LP groups across three developmental stages including early (E, 25 DAF), mid (M, 40 DAF), and late (L, 55 DAF) maturity (Figure 1D). Quality control analysis via Principal Component Analysis (PCA) revealed distinct biological separation: PC1 clearly distinguished SC from CO tissues, while PC2 separated samples by developmental stage and further resolved the genotypic divergence between POWR1-TE and POWR1+TE types (Figure 2A). Spearman correlation analysis confirmed high reproducibility within groups (CC > 0.50), but revealed a substantial transcriptional shift in the early CO, where inter-group correlations dropped to 0.18–0.78, suggesting stage-specific regulatory divergence (Figure 2B).
Subsequently, pairwise comparisons were conducted to identify a total of 4910 differentially expressed genes (DEGs) across the three developmental stages between these two groups. A volcano plot was employed to identify DEGs based on log2 fold change (FC) and −log10 p-value (Figure S1). A cluster dendrogram analysis showed that replicates from each condition were closely clustered as supported by a similar separation pattern in a multidimensional scaling plot of log-FC values (Figure S2).
The distribution of these DEGs exhibited strong temporal and spatial specificity. In the embryo, the most pronounced changes occurred at the early stage (ECO) with 1379 DEGs, a number that sharply declined at the mid (448 DEGs) and late (651 DEGs) stages. In contrast, the seed coat displayed a higher baseline of DEGs, with 1125 identified at the early stage (ESC), remaining elevated compared to the embryo at the mid and late stages (733 and 574 DEGs, respectively; Figure 2C). This pattern indicates that while transcriptional reprogramming is concentrated in the early phase for both tissues, the seed coat maintains a higher level of differential expression throughout development. Hierarchical clustering and heat-map analysis further validated these findings, showing that DEGs were predominantly enriched in the early developmental stage with minimal significant differences observed at the mid and late stages (Figure 2D). Collectively, these results underscore the early seed development stage as a pivotal window for transcriptional regulation, particularly within the seed coat where POWR1 is highly expressed.

3.3. Functional Enrichment and Expression Profiling of DEGs

To elucidate the biological functions of these DEGs, Gene Ontology (GO) and KEGG enrichment analyses were performed. A total of 81 biological process (BP) terms were significantly overrepresented (FDR < 0.05), primarily involving carbohydrate/lipid metabolism, photosynthesis, cell differentiation, multicellular organismal development, defense response, and hormone signaling, which are essential for nutrient accumulation and seed formation (Figures S3 and S4).
Tissue- and stage-specific analysis revealed distinct functional divergence. In the CO, BP terms related to protein polymerization, lipid transport, carbohydrate transport, polysaccharide catabolic process, photosynthetic electron transport in photosystem I, and response to heat were specifically enriched at the early stage (Figure S3). As development progressed, the embryo showed diminished unique terms with no unique BP terms identified in the mid stage and only one term (response to stress) enriched in the late stage (Figure S3). In the SC, terms related to lipid storage, negative regulation of catalytic activity, circadian rhythm, hormone-mediated signaling pathways [including abscisic acid (ABA) signaling], and plant-type secondary cell wall biogenesis were prominent at the early stage (Figure S4). There was no distinct BP term at the mid stage; the BPs for the ethylene-activated signaling pathway, regulation of the jasmonic acid-mediated signaling pathway, the hydrogen peroxide catabolic process, regulation of protein serine/threonine phosphatase activity, defense responses to biotic stimulus or abiotic stress, and regulation of defense responses were enriched at the late stage (Figure S4).
Additionally, we found that carbohydrate transport and microtubule cytoskeleton organization occurred at the early stage of seed development (Figures S3 and S4). BP terms specially involved in the middle stage, such as carbohydrate transport, the fatty acid biosynthetic process, protein folding, protein oligomerization, anchored components of membranes, microtubule cytoskeleton organization, responses to chitin, responses to light stimulus, and responses to salt stress, were found (Figures S3 and S4). Five BP terms are peculiarly related to early and middle stages, such as the xyloglucan metabolic process, lipid oxidation, the oxylipin biosynthetic process, cell wall biogenesis, and responses to heat (Figures S3 and S4).
Collectively, these results indicate that temporally, photosynthesis accumulates dry matter such as sugars during the early stage of seed development, which is subsequently converted into lipid and protein through the E-M and M-L transformation processes (Figures S3 and S4). The seed coat may indirectly influence embryonic oil/protein synthesis by regulating hormonal regulation, light exposure, circadian rhythms, or responding to environmental factors (Figures S3 and S4). Through these mechanisms, they may contribute to the differences in nutrient accumulation between the HP and LP groups.
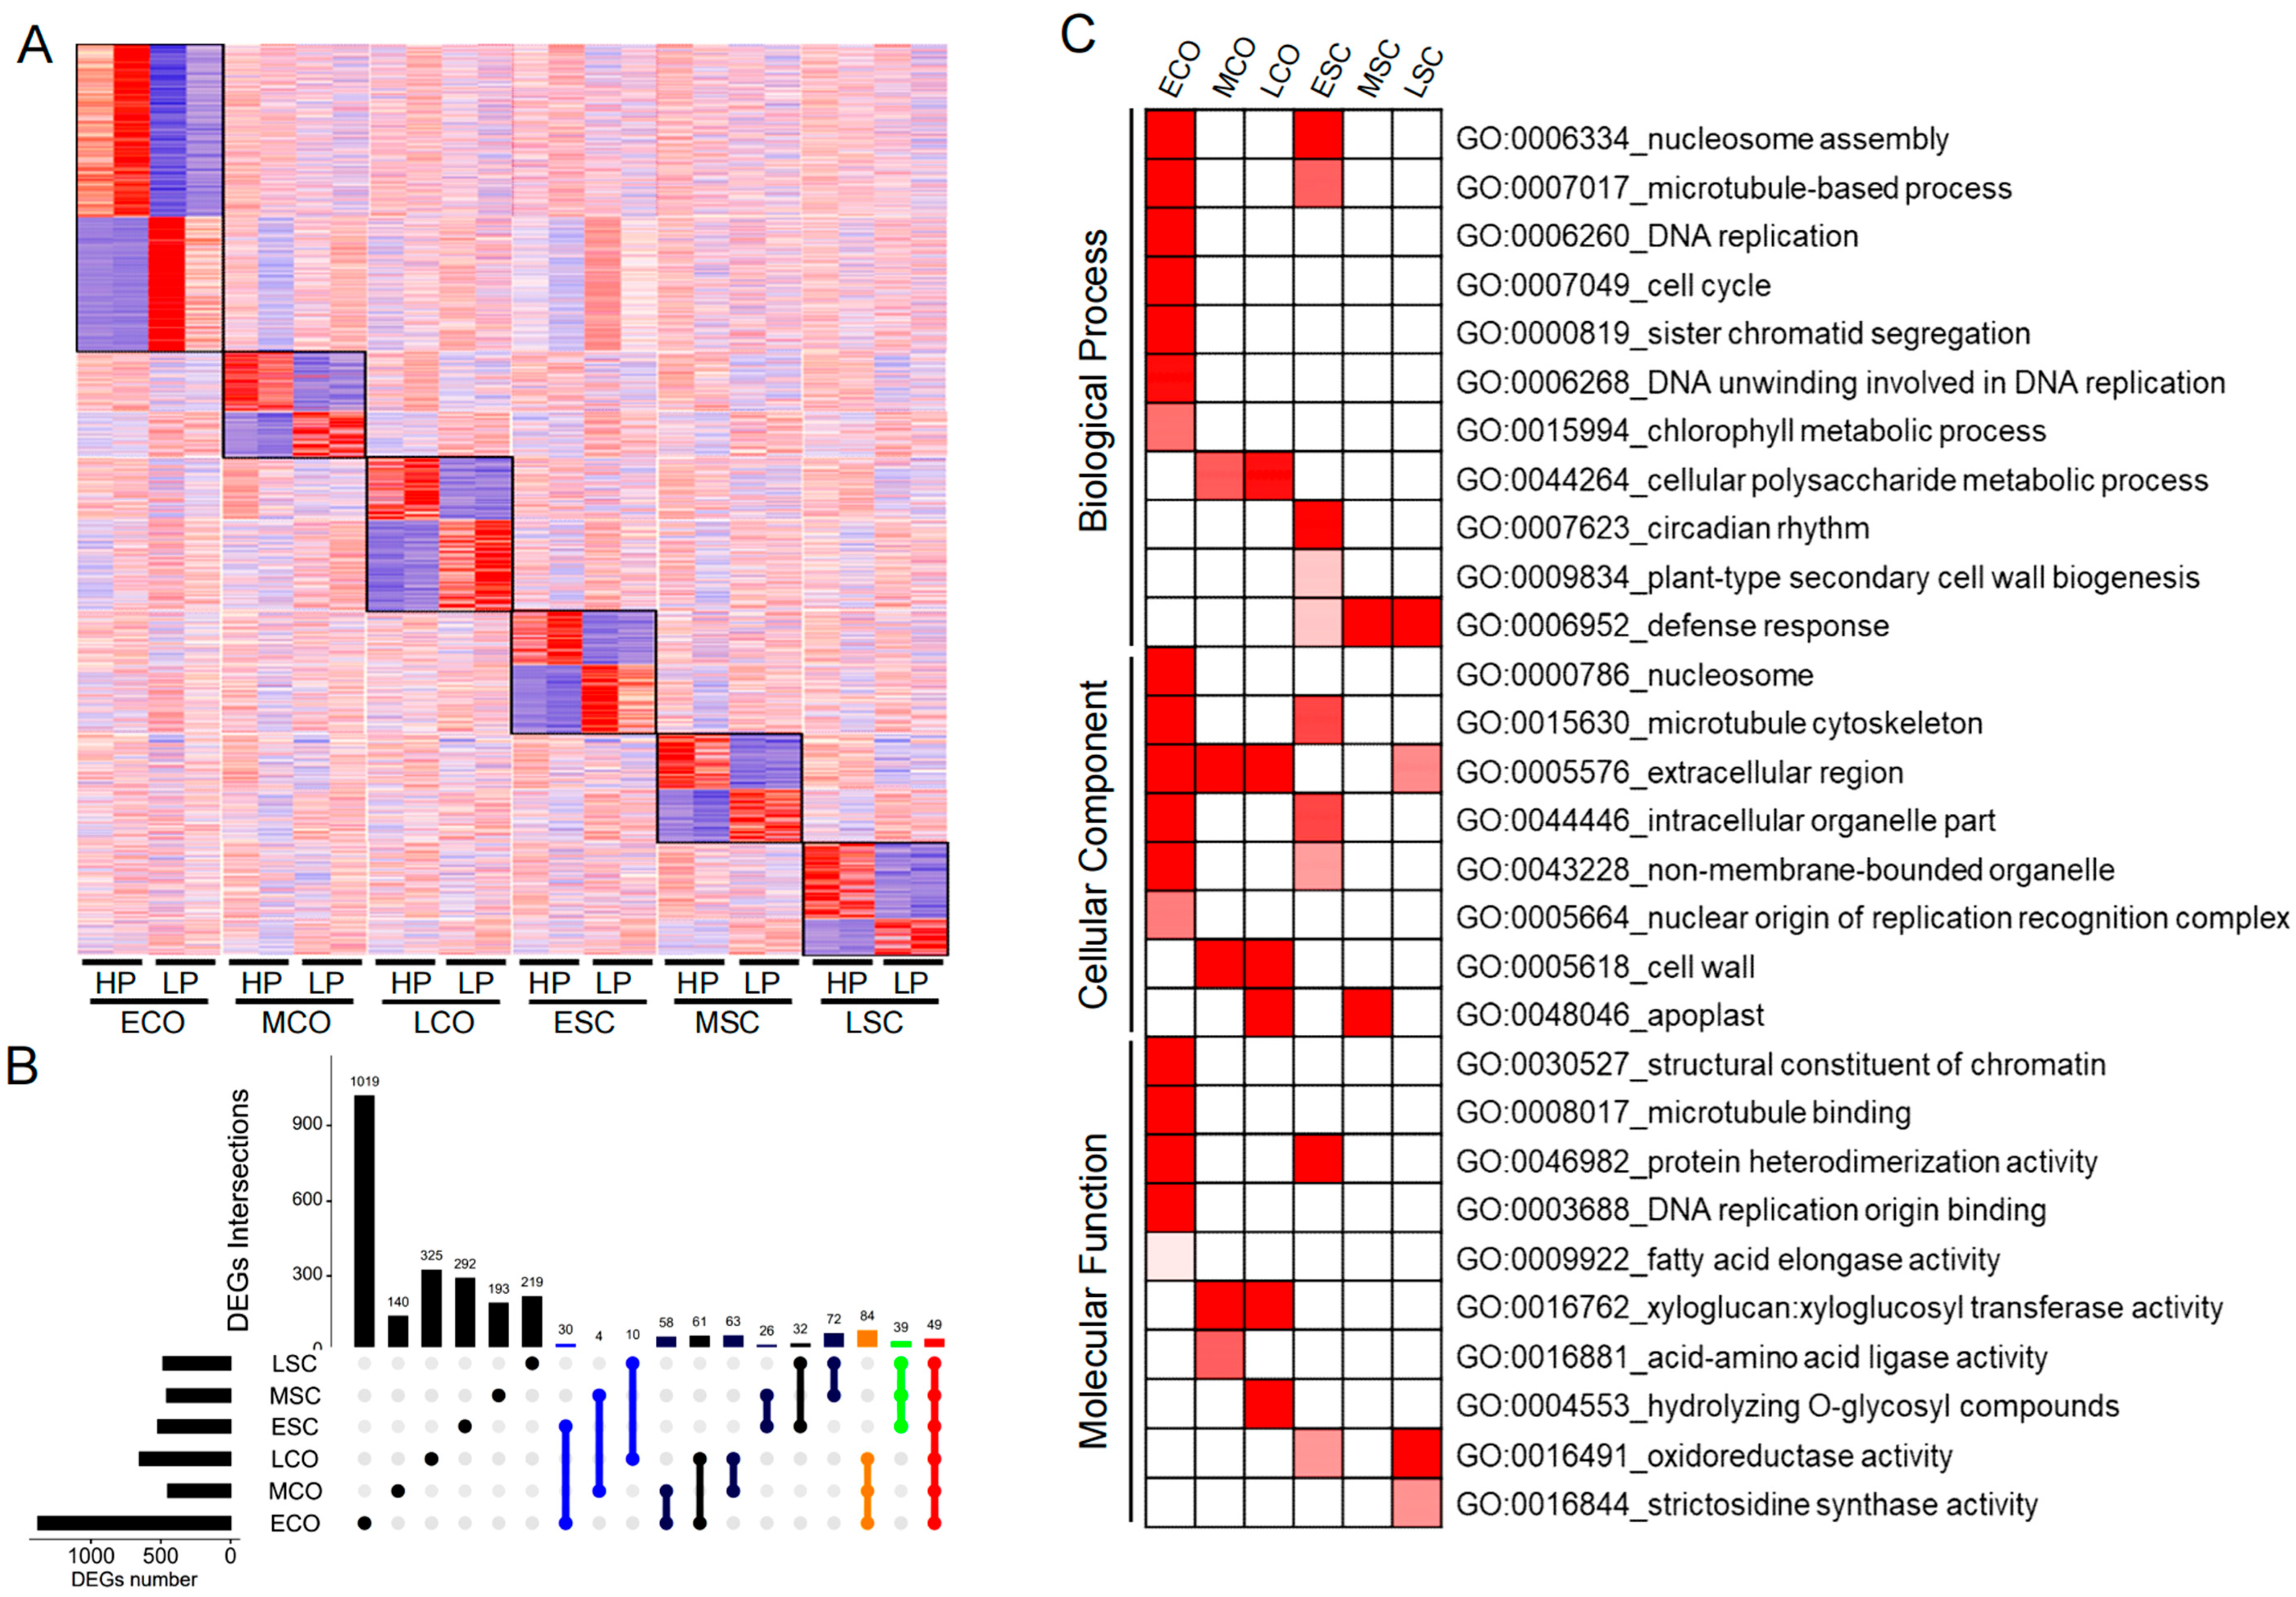
To further dissect these dynamic expression patterns, DEGs were grouped into six clusters via K-means clustering based on their temporal and spatial expression profiles (Figure 3A,B). Cluster 1 (1019 DEGs) and cluster 4 (292 DEGs), which were specific to the early-stage CO and early-stage SC, respectively, were highly enriched for cell cycle and cytoskeleton organization terms such as nucleosome assembly and microtubule-based processes, indicating active cell division and differentiation during early seed development (Figure 3C). Furthermore, the DEGs in cluster 1 were particularly abundant in carbohydrate metabolic process, the chlorophyll metabolic process, and fatty acid elongase activity. Importantly, the DEGs of cluster 4 were uniquely implicated in circadian rhythm and plant-type secondary cell wall biogenesis, which was associated with the enrichment of terms for protein heterodimerization and oxidoreductase activity. Clusters 2 (140 DEGs) and 3 (325 DEGs), predominantly expressed at the mid- and late-stage COs, respectively, were enriched in carbohydrate polysaccharide metabolic processes, specifically exhibiting xyloglucan–xyloglucosyl transferase activity and acid–amino acid lipase activity, supporting the metabolic shift toward storage compound accumulation. Clusters 5 (193 DEGs) and 6 (219 DEGs) expressed in the mid- and late-stage SCs, respectively, were primarily associated with defense response; their encoded products were localized to the extracellular region and cell wall, which is consistent with the seed coat’s pivotal role in mediating stress resistance. The distribution of DEGs across these clusters further confirmed that transcriptional reprogramming is concentrated in the early phase for both tissues and regulated by certain specific factors such as circadian rhythm, with the seed coat maintaining a higher level of differential expression throughout development (Figure 3C).
KEGG pathway analysis corroborated the GO findings, revealing significant activation of metabolism-related pathways across stages (Figures S5 and S6). The pathways for starch/sucrose metabolism and glycolysis were prominent in the early CO, providing the carbon skeletons for subsequent biosynthesis. Lipid metabolism pathways, specifically those of linoleic acid and α-linolenic acid metabolism, were enriched in whole SCs, whereas fatty acid degradation was specific to late-stage SCs. Notably, Alanine, aspartate and glutamate metabolism, as well as circadian rhythm-plant and plant hormone signal transduction were obviously enriched in LSCs (Figures S5 and S6). Additionally, the biosynthesis of other secondary metabolites (stilbenoid, diarylheptanoid and gingerol biosynthesis, flavonoid biosynthesis) were obviously found in seed development (Figures S5 and S6). Collectively, these enrichment analyses highlight the coordinated regulation of carbon flux, lipid biosynthesis, and hormonal signaling in determining seed protein and oil content.

3.4. Co-Expression Network Analysis and Hub Gene Identification

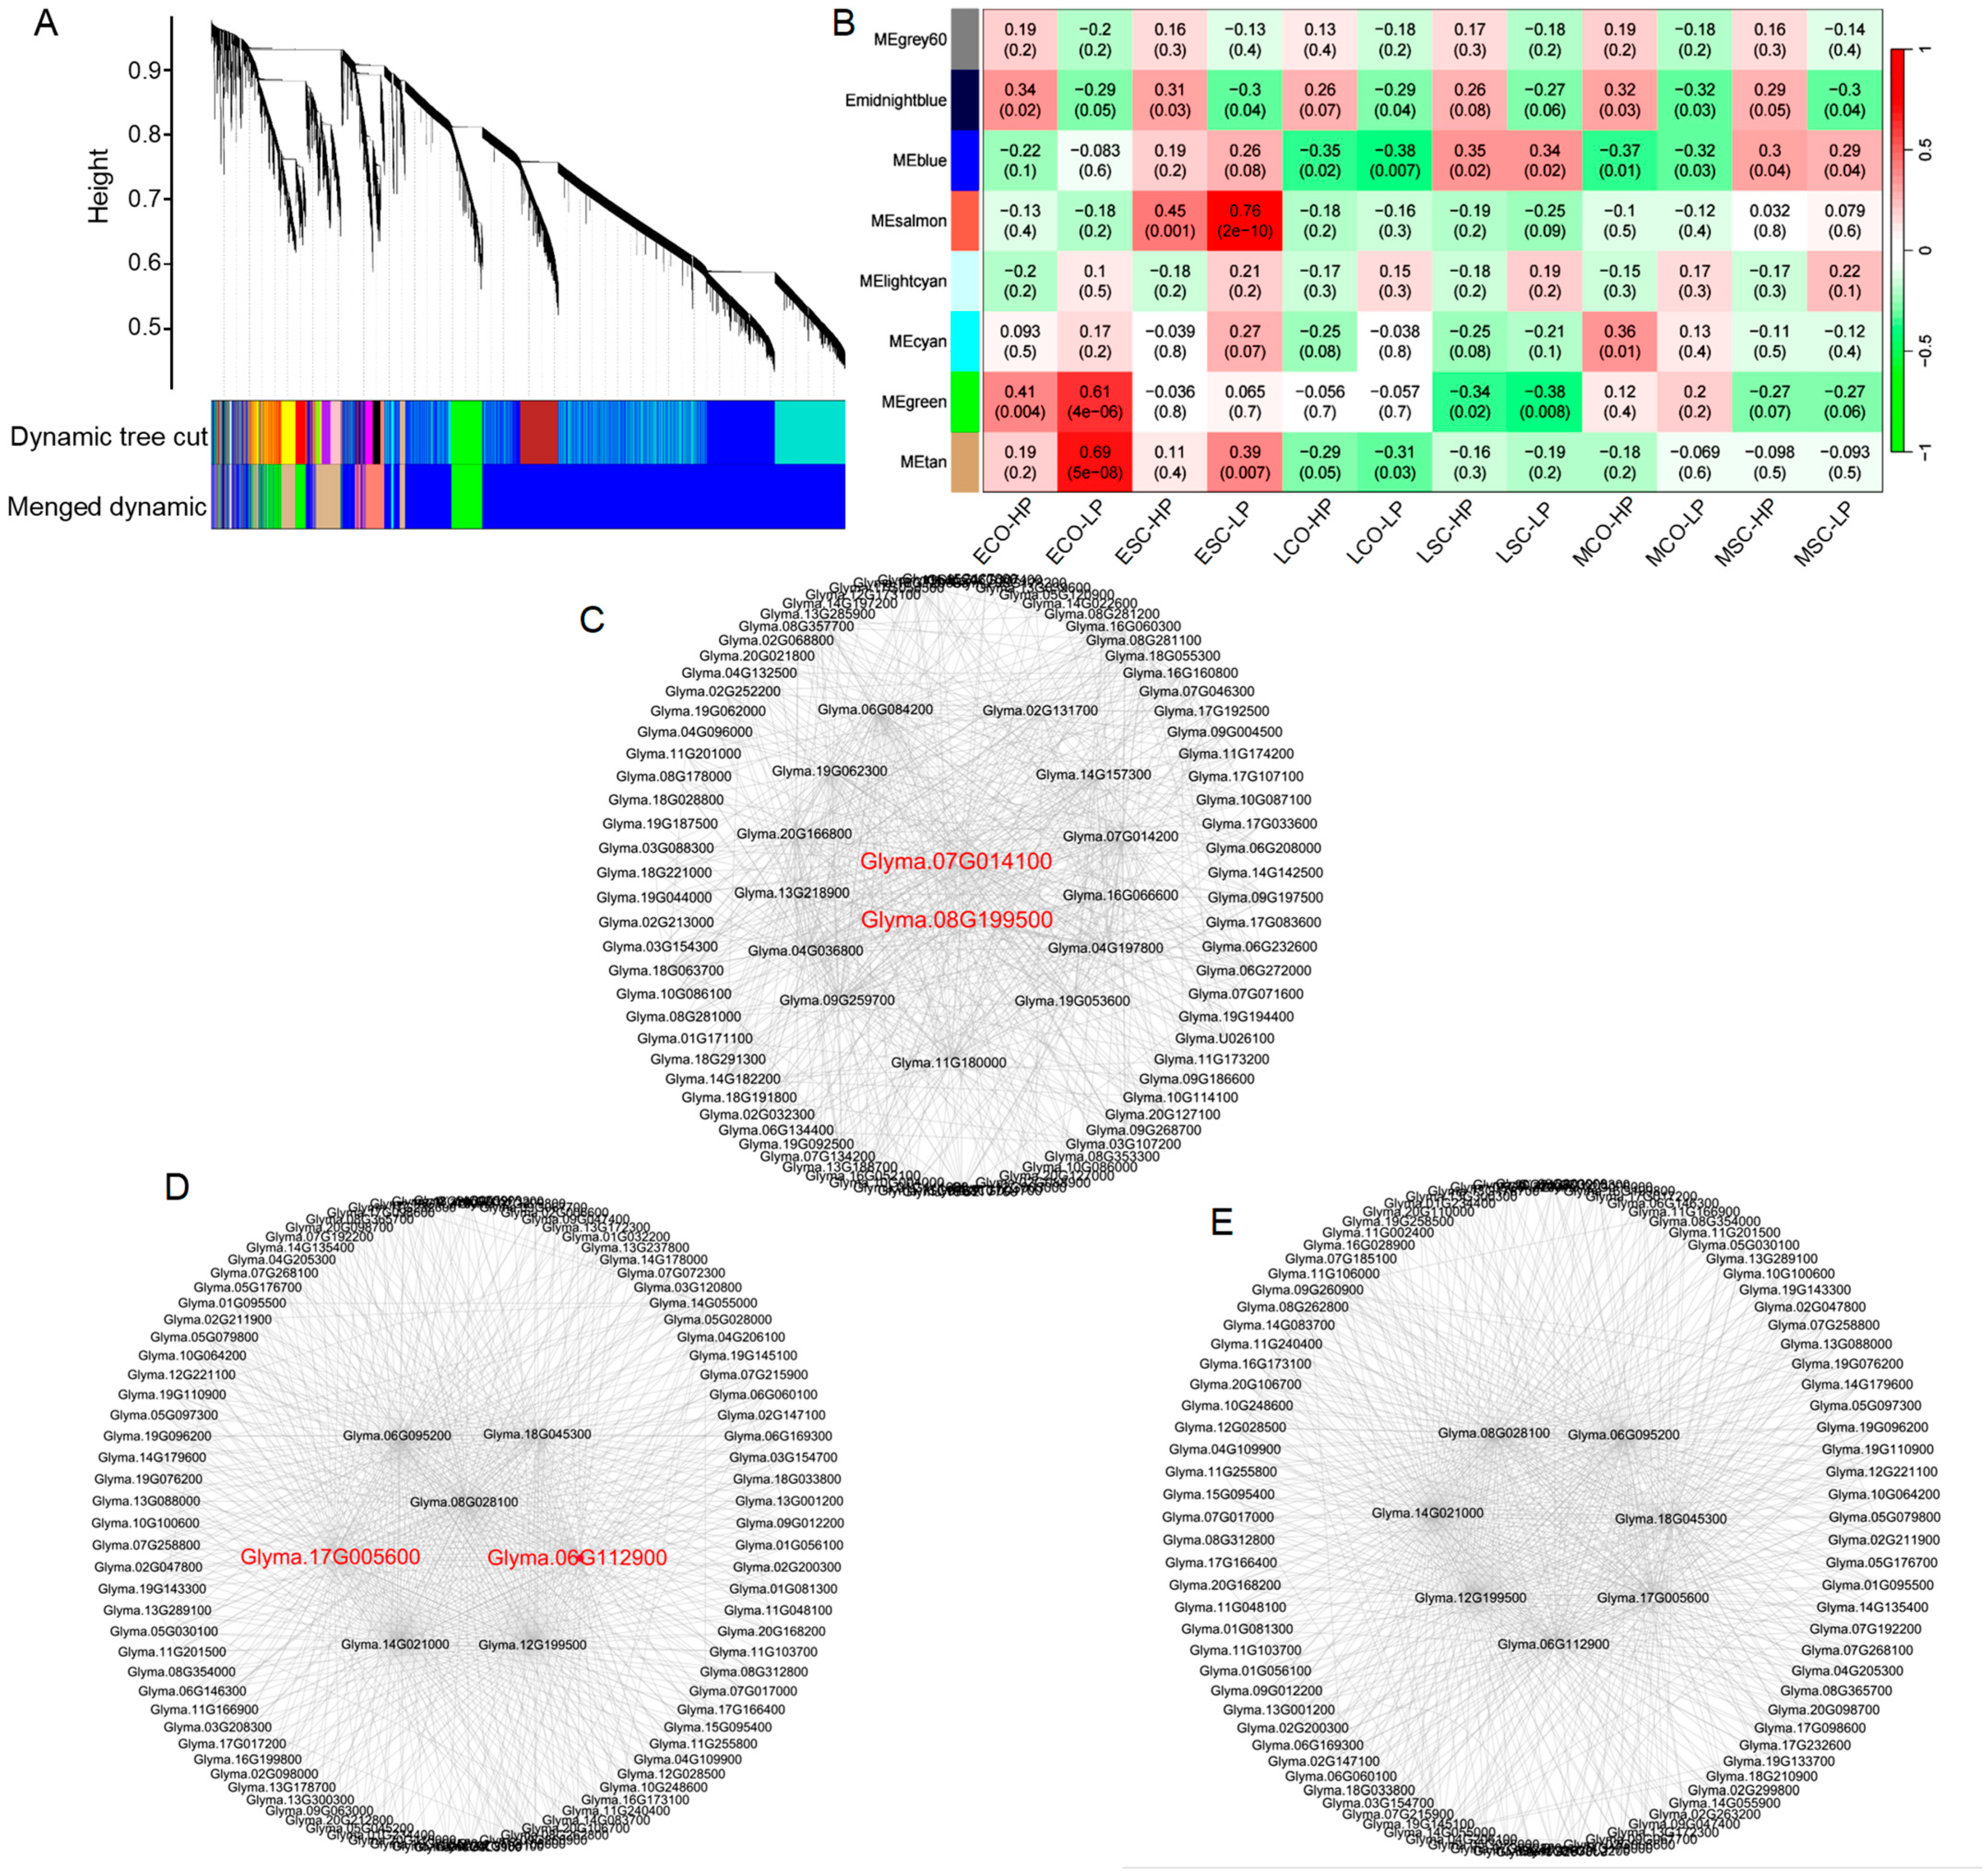
To identify regulatory modules associated with the contrasting oil/protein accumulation patterns, we performed Weighted gene co-expression network analysis (WGCNA) using the R package. Modules were defined as clusters of highly interconnected genes, and eight distinct modules were identified, each labeled with a different color (Figure 4A). Importantly, three of these modules—salmon, green, and tan—exhibited significant positive correlations with the early developmental stage of the HP group (correlation coefficient > 0.6), while showing negative or weak correlations with the LP group (Figure 4B and Figure S7). The distributions of kME values for the three key modules were shown in Figure S8.
The salmon module, which was specific to the early SC, showed an overrepresentation of GO terms related to carbohydrate metabolic processes and lipid transport (Figure S9). Core network analysis of this module revealed a dense network of 4951 interactions among 50 genes, leading to the identification of 15 hub genes (Figure 4C; Table S3). Among these, two GDSL-like Lipase/Acylhydrolase superfamily proteins (GDSL1, GDSL2) and one abscisic acid responsive element-binding factor 1 (ABF1) emerged as core regulators, which were associated with lipid metabolism and with hormone-mediated signaling pathways, respectively.
The green module showed a significant correlation with the early CO of the HP group. Functional enrichment analysis identified GO terms related to seed quality, including cytoplasmic translation, ribosome biogenesis, photosynthesis, and fatty acid biosynthetic processes (Figure S10). The core network in this module contained 50 linking genes, with 7 hub genes predicted, including long chain acyl-CoA synthetase 9 (LACS9, an oil-candidate protein) and one NF-YB factor—LEC1-like protein (L1L) (Figure 4D; Table S2).
The tan module, also correlated with the early CO, was significantly enriched in 18 BP terms, primarily related to photosynthesis, chloroplast organization, ribosome biogenesis, protein import into chloroplasts, and responses to light stimulus (Figure S11). A focused sub-network revealed 5461 interactions, with core regulators including microtubule-associated protein (MAP65/ASE1), Cyclin A1;1, and cellulose synthase (Figure 4E; Table S2).
Collectively, these three modules indicate a convergence of light signals and nutrients in the early embryo, enhancing photosynthesis to produce dry matter, with the involved DEGs (hub gene) inhibiting polysaccharide conversion into fatty acids while simultaneously facilitating the synthesis and transport of amino acids.

3.5. Identification of Key Candidate Regulators

Based on the stage- and tissue-specific categories and network analysis, we identified a set of key regulators encoded by DEGs that are potentially associated with the accumulation of seed storage compounds (Table S3). Notably, the HP and LP groups are not isogenic lines and differ simultaneously in protein, oil, seed weight, and POWR1 genotype. Thus, some of the identified DEGs may also be related to seed size variation rather than solely seed storage compound accumulation.
For carbohydrate catabolism, we found distinct expression patterns (Table S3): (i) Three chloroplast beta-amylase 3 (BAM3) genes were highly expressed in the early COs of the LP group, whereas two Glycosyl hydrolase family 10 (GH10) genes were specific to the HP group’s early COs; additionally, 12 xylanose invertases/hydrolases (XTHs) genes linked to polysaccharide catabolism showed differential expression, with seven genes enriched in the HP group and five in the LP group. (ii) Three cell wall/vacuolar inhibitor of fructosidase 1 (C/VIF1) genes were highly expressed in early SCs of the HP group, potentially suppressing fructosidase catalytic activity. (iii) For transport, three SWEET genes and one major facilitator (MFC) were enriched in the LP group, while two SWEETs were specific to the HP group. (iv) Two proteins, including one NDH-dependent Flow 6 (NDF6) protein and one Proton Gradient Regulation (PGR) protein, are involved in photosynthetic electron transport in photosystem I and were highly expressed in early COs of the LP group. For oil metabolism, seven Oleosin (OLE) and two SEIPIN proteins were upregulated in early SCs of the LP group, promoting lipid storage, while nine lipid-transfer proteins (LTPs) were highly expressed in early COs of the LP group to facilitate transport. Conversely, three 3-ketoacyl-CoA synthases (KCS) were specific to the mid SCs of the HP group, potentially inhibiting oil synthesis and diverting carbon toward protein accumulation. For amino acid metabolism, 10 small heat shock proteins (sHSPs) related to protein folding were upregulated in the mid SCs/COs of the HP group, promoting amino acid synthesis.
Furthermore, three main categories of regulatory genes were detected for the regulation of seed storage compounds accumulation (Table S3): (i) circadian rhythm genes, involving three Night light-inducible and clock-regulated (LNKs) genes, two Flavin-binding, kelch repeat, f box 1 (FKF1s) genes, two Cold-regulated 27 (COR27) genes, one TCP gene and one Gigantea (GI) gene, localized in ESC; (ii) responses to light stimulus, including one Gibberellin oxidases gene, one HEMERA gene, and one Light-sensitive hypocotyls (LSH) gene; and (iii) hormone-mediated signaling pathways, including one C2-domain ABA-related protein (CAR) gene, four MLP-like proteins (MLP423) gene, one Jasmonate-zim-domain proteins (JAZ) gene, and three Ethylene response factors (ERF) genes.

3.6. Factors Controlling Seed Formation

Seed size is positively correlated with oil content and negatively correlated with protein content (3, 4). Advancements in genetics and molecular biology research have identified a large number of key regulators of seed size in model plants (6–9). Leveraging the RNA-seq data of this study, we investigated and summarized the expression pattern of soybean homologous genes of the family genes with well-characterized functions in model plants and further presumed the functions of these gene in seed development (Table S4; Figure S12). We found nine pathways, including cell cycle, the auxin pathway, the GA pathway, the CK pathway, the IKU pathway, the MAPK pathway, light regulation, flavonoids regulation, epigenetic regulation, and some TFs, respectively.
A total of 95 genes were involved, with 50 upregulated in the LP group, whereas the rest were upregulated in the HP group (Table S4). Among them, 87 DEGs were found to be mainly involved in the seed early development stage. There were three DEGs encoding one cytokinin oxidase 3 (CKX3) and two Glutathione S-transferase TAU (GSTs), specially regulated at the MSC. Additionally, four DEGs encoding two VQ motif-containing proteins (IKUs) and two homeobox-leucine zipper family protein/lipid-binding START domain-containing proteins (FWAs) were specially regulated at the LSC. Notably, nine DEGs were involved in light regulation, encoding three LEC1-line proteins (L1Ls), one FUS3, and three AT-hook motif nuclear-localized proteins (AHLs), which primarily modulated protein deposition in CO during the early stage.

3.7. Regulatory Mechanism of Carbon Channeling into Seed Oil and Protein Biosynthesis

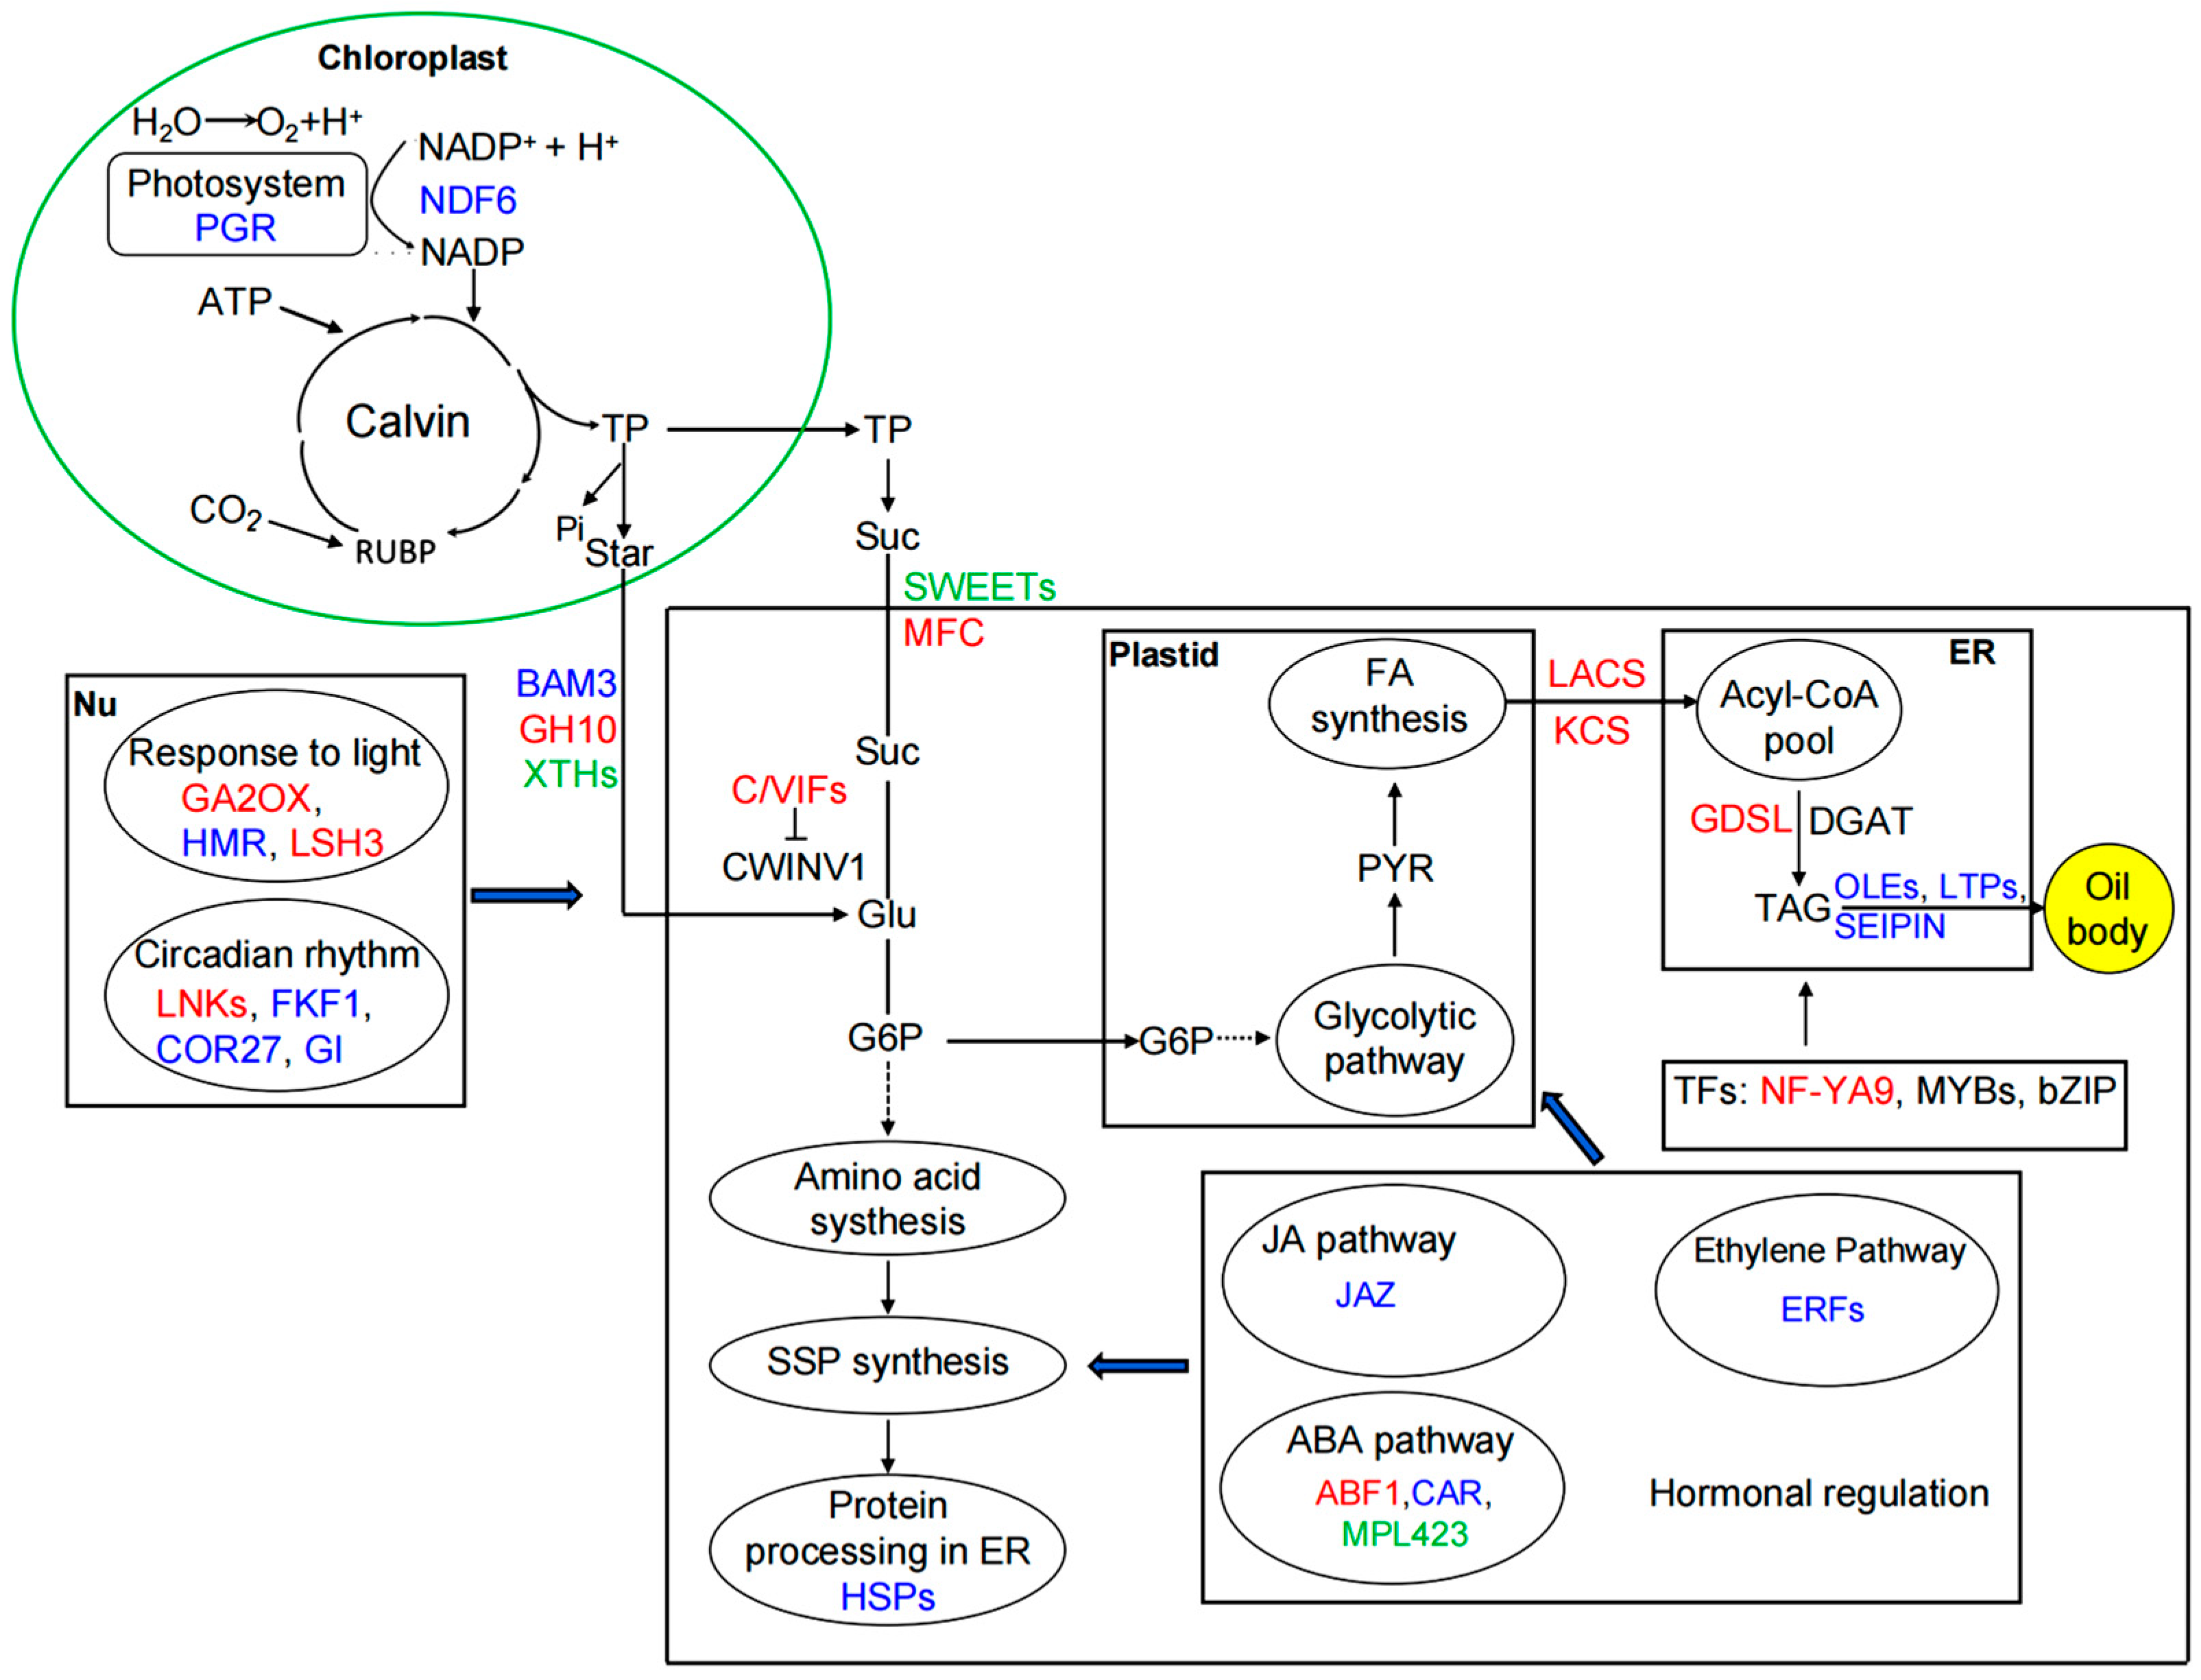
Combining the above enrichment and co-expression network analysis results, we used a transcriptome-supported hypothetical model to explain the divergent accumulation of oil and protein between the LP and HP groups (Figure 5).
We found that NDF6 and PGR family proteins in PSI might promote photosynthetic electron transport to facilitate the biosynthesis of triose phosphate (TP) that was subsequently converted to sucrose and starch.
The sucrose delivered by SWEETs transporters can be hydrolyzed by cell wall invertase (CWINV1) to fuel glycolysis and lipid synthesis. Although the CWINV1 transcript levels showed no significant difference between groups, the high abundance of C/VIF1 in the HP group likely mediates post-translational inhibition of CWINV1 activity. We hypothesize that this inhibition restricts carbon flux into glycolysis and fatty acid biosynthesis, thereby limiting oil accumulation and redirecting metabolism toward nitrogen assimilation and protein deposition.
Meanwhile, genes involved in starch metabolism were differentially regulated: High expression of BAM3 in LP seeds may enhance glucose synthesis release for fatty acid synthesis. Conversely, high expression of GH10 in HP seeds may favor glucose allocation toward amino acid production. While XTHs family members differentiate to coordinate carbon flow, these expression patterns support a model in which carbon flow is differentially partitioned through distinct degradation pathways.
Multiple genes related to lipid metabolism were upregulated in the LP seeds, including LACS and KCS for fatty acid activation and transport, GDSL and FAD2 for TAG assembly, and OLEs (e.g., OLE1, Glyma.20G196600) and SEIPIN genes (e.g., FA9, Glyma.09G250400) for oil body stabilization. Notably, LACS was identified as a network hub gene, supporting its central role in lipid metabolism. Collectively, these genes suggest enhanced oil assembly and storage in the LP group.
Simultaneously, the HP seeds showed elevated expression of sHSPs which support protein folding and homeostasis, and L1L (Glyma.17G005600) encoding NF-YB factor—a hub gene implicated in carbon partitioning and seed maturation. These patterns are consistent with a transcriptional program favoring protein accumulation in HP seeds.
Beyond the core carbon flux regulation, our screening identified a suite of signaling components that correlate with the high-protein phenotype. Circadian and light signaling pathways may be reconfigured in HP phenotypes, with the upregulation of LNKs and LSHs contrasting with the downregulation of FKF1, COR27, and GI. Hormonal crosstalk further refined this process: repressors of oil synthesis associated with jasmonic acid (JAZ1/2) and Ethylene (ERF1/13/71) signaling, along with GA signaling components (GA2OX, HEMERA), were downregulated in the HP group. Concurrently, the ABA pathway exhibited enrichment of downstream effectors (CAR, MLP423), with the ABA-responsive hub gene ABF1 also implicated in this regulatory network. Collectively, these candidate regulators—identified via DEG screening—likely act as upstream modulators that create a permissive physiological environment favoring protein deposition.

3.8. Validation of RNA-Seq Data

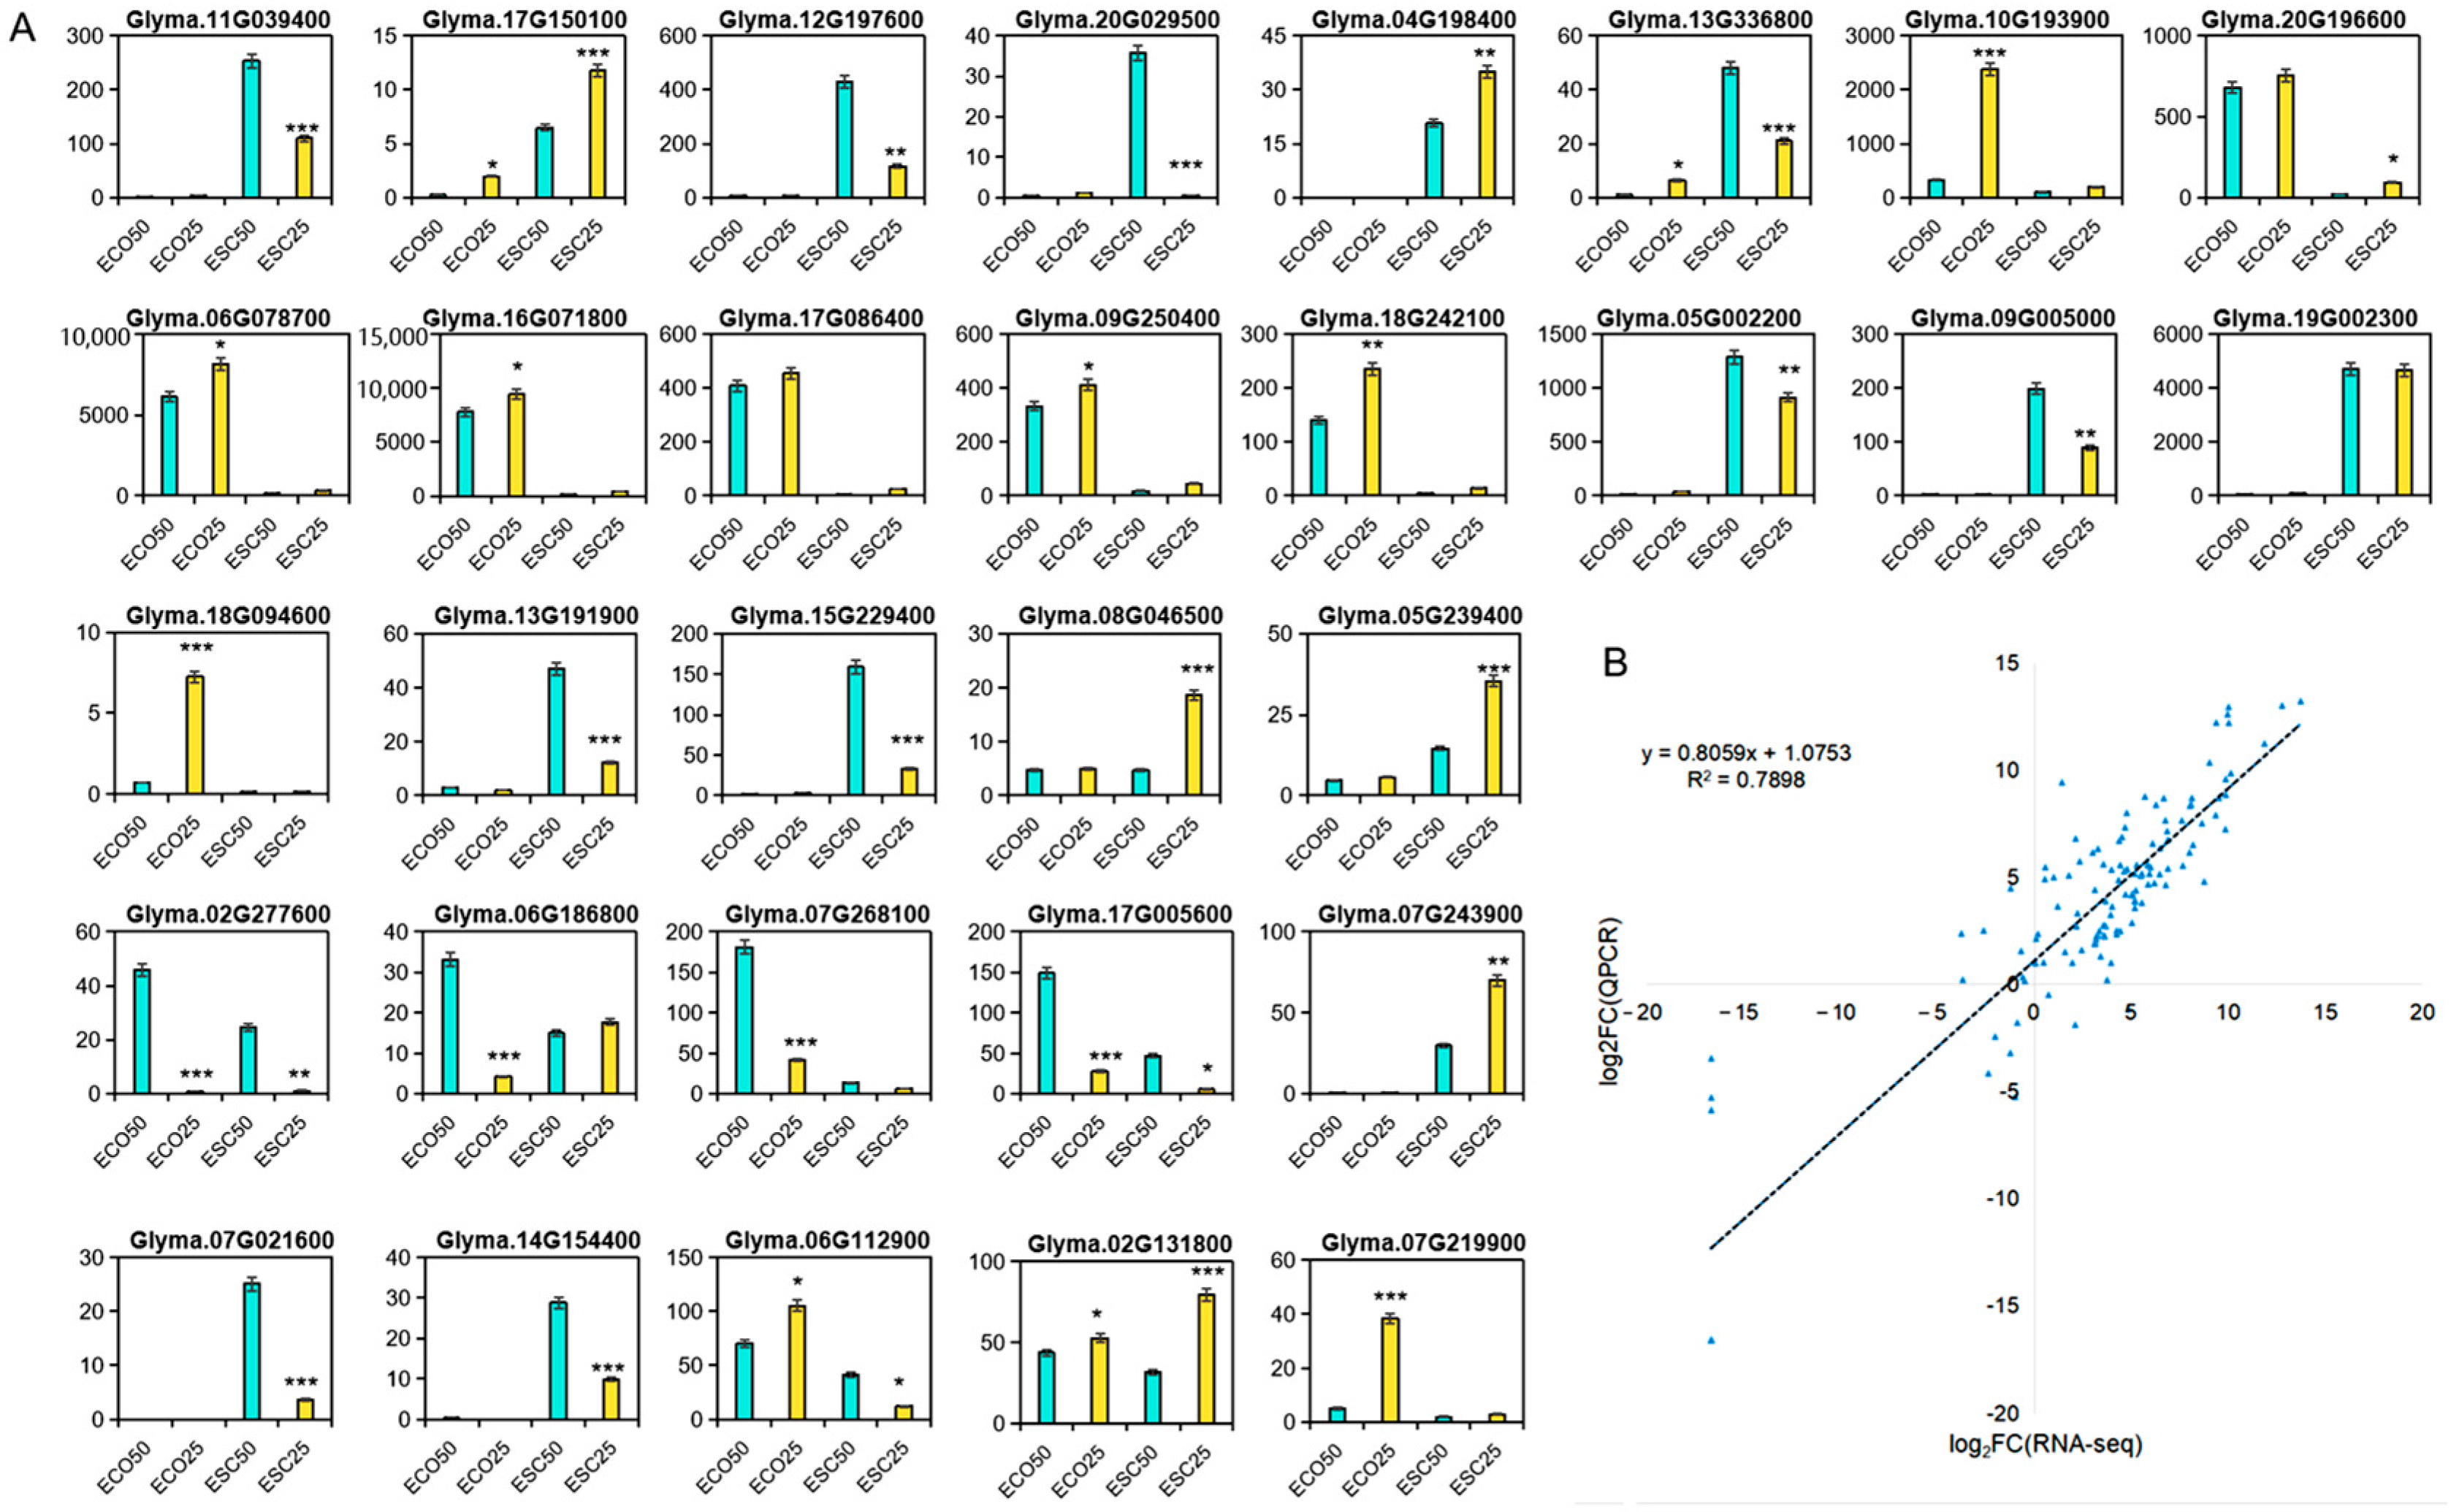
To validate the transcriptomic data, 31 DEGs representing key regulators of oil/protein biosynthesis (Figure 6A) were selected for RT-qPCR. A strong significant correlation (Figure 6B, r = 0.79, p < 0.05, n = 31) was observed between RT-qPCR and RNA-seq expression across all stages, confirming the reliability of the sequencing data.

4. Discussion

4.1. Early Developmental Stage May Represent a Critical Window for Carbon Partitioning and Seed Quality Determination

Seed development in soybeans is a complex process involving morphogenesis, reserve accumulation, and desiccation. Previous studies have established that protein and oil content are largely determined during the seed-filling stage, where a well-documented inverse relationship exists between oil and protein accumulation due to competition for carbon skeletons and energy [45]. However, the molecular events initiating this trade-off remain elusive. In this study, we focused on the spatiotemporal dynamics of gene expression at three key stages—20 DAF (Early, E), 40 DAF (Middle, M), and 55 DAF (Late, L)—to identify the regulatory nodes controlling carbon partitioning (Figure 1D).
Our transcriptomic analysis suggests that the early stage (20 DAF) may represent a pivotal “decision-making window” for seed composition. A total of 4910 differentially expressed genes (DEGs) were identified between high-protein/low-oil (HP) and low-protein/high-oil (LP) cultivars (Figure 1C and Figure 2C). Strikingly, 2504 DEGs were specifically expressed at the early stage, accounting for over 50% of the total transcriptional changes (Figure 2C). This massive transcriptional reprogramming indicates that the metabolic fate of the seed—whether prioritizing oil or protein—may be established long before the final desiccation phase. Spatially, the majority of these DEGs were localized in the early embryo (ECO, 1379 DEGs) and early seed coat (ESC, 1125 DEGs), highlighting the critical role of embryo–seed coat crosstalk during this period in determining sink strength and reserve composition.

4.2. Key Genes Associated with Oil and Protein Content

Soybean seed oil and protein content are domestication-related traits (DRTs) that have been strongly selected during breeding. While forward genetic approaches have identified several key regulators such as GmSWEET10a/b, GmST05, and Fatty Acid 9 (FA9), the complex trade-offs between yield components often constrain the simultaneous improvement of oil and protein [2,4,8]. In this study, we mined quality-related gene resources from transcriptomic data and identified candidate genes that potentially drive the metabolic partitioning between oil and protein (Tables S2–S4).
Recent studies have shown that PSI photoinhibition severely affects net carbon assimilation, photoprotection, starch accumulation, plant growth, and retrograde signaling [46]. Firstly, NDF6 and PGR family proteins in PSI can promote photosynthetic electron transport to facilitate the biosynthesis of Triose phosphate (TP) [47]. TP is subsequently converted to sucrose and starch, which serve as carbon reservoirs that supply precursors via degradation and refixation pathways during oil and protein synthesis [47].
Sucrose flux from the seed coat to the embryo is a critical determinant of seed size and oil content. We identified 11 SWEET genes, with distinct expression patterns diverging between the HP and LP groups. Notably, GmSWEET10, a known regulator of oil content, was functionally validated in our module [4]. While three SWEETs exhibited high expression in the LP group’s early seed coats (ESCs), seven SWEETs were upregulated in the HP group’s early embryos (ECOs). This phylogenetic and spatial separation suggests functional specialization: LP-specific SWEETs may facilitate high-capacity sucrose import for lipid biosynthesis, whereas HP-specific SWEETs might maintain a basal carbon supply for nitrogen assimilation without triggering excessive oil accumulation.
Specifically, sucrose import via SWEETs initiates substrate provision, which is then hydrolyzed by cell wall invertase (CWINV1) to generate glycolytic intermediates [48], a step known to be tightly controlled by small proteinaceous inhibitors (C/VIFs) at the post-translational level [49]. Notably, the high expression of C/VIF1 in the HP group suggests a mechanism to restrict sucrose hydrolysis. Crucially, while CWINV1 transcript levels showed no significant difference between groups, the high abundance of C/VIF1 in the HP group likely mediates post-translational inhibition of CWINV1 activity. This inhibition limits the flux of carbon into glycolysis and subsequent fatty acid biosynthesis, thereby preventing excessive oil accumulation. Concurrently, this metabolic ”braking” may help maintain a carbon/nitrogen balance conducive to protein deposition, or simply restrict seed expansion (consistent with the small-seed phenotype of HP cultivars), thus prioritizing nitrogen assimilation over carbon storage.
The process from photosynthetic products to oil body formation involves fatty acid mobilization, TAG assembly, and lipid storage. Fatty acid mobilization and TAG assembly involve a cascade of enzymes [50,51]. We identified key genes including long-chain acyl-CoA synthetase (LACS), 3-ketoacyl-CoA synthases (KCS), and GDSL-like lipases. Interestingly, while LACS (Glyma.20G196600) was identified as a hub gene in the co-expression network, implying its central regulatory role in lipid channeling, its transcript abundance did not show significant differential expression between the HP and LP groups (Tables S2 and S3). This suggests that LACS activity might be regulated post-translationally or limited by substrate availability (e.g., acetyl-CoA) rather than transcription. In contrast, KCS genes, responsible for elongating C18 fatty acids, were specifically suppressed in the mid-stage HP embryo, halting the production of very-long-chain fatty acids. Furthermore, GDSL and DGAT genes showed lower expression in the HP group, collectively restricting TAG assembly.
The structural capacity for oil storage is a limiting factor for oil content. Oleosins (OLEs) are essential for stabilizing oil bodies and preventing coalescence. We identified Glyma.20G196600 (OLE1) and six homologous genes, all of which were significantly upregulated in the LP group. This aligns with the high oil phenotype of LP cultivars, which require abundant structural proteins to package large oil bodies. Conversely, the low expression of OLEs in the HP seeds is consistent with their smaller size and protein-dense, oil-poor phenotype. Similarly, SEIPIN homologs, which determine lipid droplet number and size, and Lipid Transfer Proteins (LTPs), which mediate fatty acid transport from plastids to the ER, were also enriched in the LP group. These findings indicate that the “hardware” for oil storage is robustly established in LP seeds but suppressed in HP seeds.
Distinct from the lipid-focused network in LP seeds, the HP seeds activated a specific “protein synthesis module.” We identified a cluster of small heat shock proteins (sHSPs) (e.g., Glyma.02G076600, Glyma.08G068700) that were significantly upregulated in the HP group. Crucially, contrary to having a role in oil synthesis, these sHSPs are known to confer symbiotic nitrogen fixation and maintain protein homeostasis under stress [52]. Their high expression in HP seeds likely ensures the proper folding and stability of storage proteins, particularly under conditions where carbon flux is restricted. Moreover, the hub gene L1L (Glyma.17G005600), a nuclear factor Y (NF-Y) subunit B6, emerged as a master regulator of protein deposition. L1L was significantly upregulated in the early embryo of the HP cultivars. This finding aligns with previous research showing that NF-Y complexes (e.g., those involving GmSW14 and GmLEC1) regulate seed storage protein genes [53].
Beyond these core metabolic regulators, our screening identified a suite of candidate signaling components that correlate with the high-protein phenotype. Circadian and light signaling pathways were reconfigured in the HP phenotype, with the upregulation of LNKs and LSHs contrasting with the downregulation of FKF1, COR27, and GI. Hormonal crosstalk further refined this process: key repressors of oil synthesis associated with JAZ1 (jasmonic acid signaling) and ERF1/71 (Ethylene signaling), along with GA signaling components (GA2OX, HEMERA), were downregulated in the HP group (Table S3). While the ABA-responsive gene ABF1 was identified as a network hub, it showed differential expression in the HP group; however, downstream ABA effectors (CAR, MLP423) were significantly enriched, suggesting a modulatory role in reinforcing protein accumulation (Tables S2 and S3).
Collectively, these gene expression patterns support a model of metabolic “uncoupling.” In LP seeds, the coordinated upregulation of SWEETs, OLEs, LTPs, and KCS creates a “high-carbon-flux, high-storage” state. In contrast, HP seeds employ a dual strategy: (1) the restriction of carbon entry into lipid pathways (potentially via C/VIF1 as discussed in Section 3.7), and (2) the activation of a high-efficiency protein synthesis machinery driven by sHSPs and L1L. This allows HP seeds to prioritize nitrogen assimilation and protein deposition despite a restricted carbon import, effectively breaking the typical trade-off between oil and protein accumulation.

4.3. Potential Upstream Regulation: POWR1 as a Candidate Link Between Photoperiod, Hormones, and Metabolic Partitioning

Seed protein and oil content are complex polygenic traits. Recent studies have identified POWR1 on chromosome 20 as a major QTL, controlling these traits [15,16,17,18,19]. POWR1 encodes a CCT-domain protein, and a TE insertion in its coding region truncates the CCT domain, correlating with increased oil content and seed weight in the cultivated soybeans [20]. Although our study utilizes diverse cultivars with complex genetic backgrounds rather than isogenic lines, the expression patterns and enriched pathways observed provide new insights into how POWR1 allelic variation may contribute to the regulatory divergence between the HP and LP groups.
CCT domain is a hallmark of proteins involved in photoperiodic flowering and circadian rhythms [54]. In our dataset, the HP and LP groups exhibited distinct expressions of circadian and light-signaling genes (Table S3). Specifically, the HP seeds exhibited an upregulation of light- and temperature-associated genes such as LNKs and LSHs, and a downregulation of core photoperiod genes including FKF1 and GI.
Given that the POWR1-TE allele (associated with HP) disrupts the CCT domain, we speculate that the intact CCT domain in the HP allele might maintain a stricter “circadian gating” of metabolic genes. This gating could prioritize nitrogen assimilation during specific phases of the day/night cycle, whereas the truncated POWR1 in LP cultivars might relax this control, allowing for constitutive carbon flux into lipid synthesis. However, given the polygenic nature of our materials, POWR1 is likely one of several regulators shaping this rhythmic expression.
The CCT-domain clock proteins PRR5 and PRR7 physically interact with ABI5 to positively modulate ABA signaling during seed development [55]. Since POWR1 contains a CCT domain and its alleles differ for protein/oil traits, we hypothesize that the intact CCT domain in the HP allele may preserve this ABA-enhancing function. This would sustain ABA sensitivity, reinforcing the expression of L1L. Conversely, the POWR1+TE allele in LP cultivars, with its truncated CCT domain, might attenuate this interaction, dampening ABA signaling and releasing repression on GA/JA pathways to favor oil synthesis.
We propose a model: the HP allele may sustain ABA signaling and L1L expression, thereby promoting protein accumulation. An LP allele (TE insertion) may attenuate ABA signaling while releasing repression on GA/JA pathways. This hormonal shift would favor the expression of lipid transport genes (e.g., LTPs, OLEs) and suppress the “metabolic brake” imposed by C/VIF1, leading to enhanced oil storage.
Although POWR1 provides a plausible upstream regulatory hub, the dramatic phenotypic differences between HP and LP cultivars likely arise from the cumulative regulatory network (Figure 5). The distinct expression of L1L and C/VIF1—key regulators of carbon partitioning and protein metabolism—appears to be the proximate cause of the composition divergence. POWR1 may act as a “rheostat” that biases the system toward either a protein-centric or oil-centric state by modulating the circadian and hormonal context in which these downstream genes operate.
Future investigation will be essential to validate the regulatory network underlying seed oil and protein accumulation.

5. Conclusions

This study delineates the transcriptomic landscape of soybean seed development, identifying the early filling stage (20–45 DAF) as the critical window where over 50% of transcriptional divergence between high-protein (HP) and high-oil (LP) cultivars is established. We uncovered distinct spatial–temporal gene modules: HP cultivars specifically upregulate the L1L-sHSPs cluster for protein homeostasis in the embryo, whereas LP cultivars activate SWEET, OLE, and KCS genes to drive carbon flux into lipid biosynthesis. Additionally, the allelic variation of the domestication gene POWR1 correlates with distinct circadian and ABA-related expression patterns. These results provide a high-resolution resource of candidate genes for seed quality improvement to mitigate the trade-off between oil and protein accumulation.

Supplementary Materials

The following supporting information can be downloaded at https://www.mdpi.com/article/10.3390/agronomy16050562/s1, Figure S1: Volcano plot was employed to identify differentially expressed genes (DEGs) based on log2 fold Change (FC) and −log10 p-value at early-stage cotyledon (ECO, A), early-stage seed coat (ESC, B), mid-stage cotyledon (MCO, C), mid-stage seed coat (MSC, D), late-stage cotyledon (LCO, E), late-stage seed coat (LSC, F). Figure S2: A cluster dendrogram analysis for transcriptome data of soybean seeds at different stages. ECO: early-stage cotyledon; MCO: mid-stage cotyledon; LCO: late-stage cotyledon; ESC: early-stage seed coat; MSC: mid-stage seed coat; LSC: late-stage seed coat; 50: DN50; 60: DN60; 43: HH43; 25: HF25. For example, ESC501 and ESC502 represent the first and second biological replicates of the RNA-seq of DN50 in the ESC. Figure S3: Histogram of Gene Ontology (GO) assignments for transcriptome sequences of soybean embryos. A-C. GO results for embryos at early (A), middle (B), and late (C) stages. The unigenes corresponded to three main categories: biological processes (green bars); cellular components (blue bars); and molecular functions (orange bars), with the length of each bar (and numbers at the tail of each bar) indicating the number of unigenes in each sub-category. Figure S4: Histogram of Gene Ontology (GO) assignments for transcriptome sequences of soybean seed coats. A-C. GO results for seed coats at early (A), middle (B), and late (C) stages. The unigenes corresponded to three main categories: biological processes (green bars); cellular components (blue bars); and molecular functions (orange bars), with the length of each bar (and numbers at the tail of each bar) indicating the number of unigenes in each sub-category. Figure S5: Kyoto Encyclopedia of Genes and Genomes (KEGG) annotation for transcriptome sequences of soybean embryos. KEGG results for seed embryos at early stage. Figure S6: Kyoto Encyclopedia of Genes and Genomes (KEGG) annotation for transcriptome sequences of soybean seed coats. A-C. KEGG results for embryos at early (A), middle (B), and late (C) stages. Figure S7: Heat map of module–trait correlation in salmon, green, and tan modules. ECO: early-stage cotyledon; MCO: mid-stage cotyledon; LCO: late-stage cotyledon; ESC: early-stage seed coat; MSC: mid-stage seed coat; LSC: late-stage seed coat; 50: DN50; 60: DN60; 43: HH43; 25: HF25. For example, ESC501 and ESC502 represent the first and second biological replicates of the RNA-seq of DN50 in the ESC. Figure S8: The distributions of kME values for three key modules. A. Salmon module. B. Green module. C. Tan module. The specific kME value corresponding to the 50th gene (the cutoff for Top 50) with a red dashed line. Figure S9: Histogram of Gene Ontology (GO) and Kyoto Encyclopedia of Genes and Genomes (KEGG) enrichment for the DEGs in salmon module. A. The unigenes corresponded to the biological processes category. B. KEGG results. Figure S10: Histogram of Gene Ontology (GO) and Kyoto Encyclopedia of Genes and Genomes (KEGG) enrichment for the DEGs in green module. A. The unigenes corresponded to biological processes category. B. KEGG results. Figure S11: Histogram of Gene Ontology (GO) and Kyoto Encyclopedia of Genes and Genomes (KEGG) enrichment for the DEGs in tan module. A. The unigenes corresponded to biological processes category. B. KEGG results. Figure S12: The expression pattern of the soybean homologous genes of these known factors in model plants, and further presumed functions of these gene in seed development. ECO: early-stage cotyledon; MCO: mid-stage cotyledon; LCO: late-stage cotyledon; ESC: early-stage seed coat; MSC: mid-stage seed coat; LSC: late-stage seed coat; 50: DN50; 60: DN60; 43: HH43; 25: HF25. For example, ESC501 and ESC502 represent the first and second biological replicates of the RNA-seq of DN50 in the ESC, respectively. Table S1: Primer sequences used for qPCR validation; Table S2: Hub DEGs identified by co-expression network analysis; Table S3: Special DEGs associated with the accumulation of seed storage compounds; Table S4: DEGs high homolog to the known genes affecting seed size in model plants; Table S5: Transcriptome sequencing TPM values of the genes discussed in the text.

Author Contributions

C.Z.: methodology; investigation; formal analysis; visualization; data curation; writing—review and editing; D.W. and E.S.: investigation; resources; H.Z. and X.C.: conceptualization; validation; funding acquisition; project administration; writing—review and editing; All authors have read and agreed to the published version of the manuscript.

Funding

This study was supported by the National Natural Science Foundation of China (32272176), the National Key R&D Program of China (2024YFE0112800), the Science and Technology Development Plan Project of Jilin Province, China (20260205036GH), the Heilongjiang Provincial Key Research and Development Program Innovation Base Project (JD24A011), Hainan Seed Industry Laboratory and China National Seed Group (B23CQ153P), the Program on Industrial Technology System of National Soybean (CARS-04), and the Innovation Team Project of the Northeast Institute of Geography and Agroecology, Chinese Academy of Sciences (2022CXTD03).

Data Availability Statement

The data generated in this study are included in this published article and its Supplementary Materials. All RNA-seq raw reads were uploaded in the BIG Submission Portal (Accession number: PRJCA059091).

Conflicts of Interest

The authors declare no conflicts of interest.

References

  1. Li, H.; Sun, J.; Zhang, Y.; Wang, N.; Li, T.; Dong, H.; Yang, M.; Xu, C.; Hu, L.; Liu, C.; et al. Soybean Oil and Protein: Biosynthesis, Regulation and Strategies for Genetic Improvement. Plant Cell Environ. 2024; epub ahead of print. [Google Scholar] [CrossRef]
  2. Duan, Z.; Xu, L.; Zhou, G.; Zhu, Z.; Wang, X.; Shen, Y.; Ma, X.; Tian, Z.; Fang, C. Unlocking soybean potential: Genetic resources and omics for breeding. J. Genet. Genom. 2025, 52, 1337–1346. [Google Scholar] [CrossRef] [PubMed]
  3. Shi, Q.; Mo, W.; Zheng, X.; Zhao, X.; Chen, X.; Zhang, L.; Qin, J.; Yang, Z.; Zuo, Z. Balancing act: Progress and prospects in breeding soybean varieties with high oil and seed protein content. Front. Plant Sci. 2025, 16, 1560845. [Google Scholar] [CrossRef]
  4. Wang, S.; Liu, S.; Wang, J.; Yokosho, K.; Zhou, B.; Yu, Y.C.; Liu, Z.; Frommer, W.B.; Ma, J.F.; Chen, L.Q.; et al. Simultaneous changes in seed size, oil content and protein content driven by selection of SWEET homologues during soybean domestication. Natl. Sci. Rev. 2020, 7, 1776–1786. [Google Scholar] [CrossRef] [PubMed]
  5. Wang, J.; Zhou, P.; Shi, X.; Yang, N.; Yan, L.; Zhao, Q.; Yang, C.; Guan, Y. Primary metabolite contents are correlated with seed protein and oil traits in near-isogenic lines of soybean. Crop J. 2019, 7, 651–659. [Google Scholar] [CrossRef]
  6. Zhang, D.; Zhang, H.; Hu, Z.; Chu, S.; Yu, K.; Lv, L.; Yang, Y.; Zhang, X.; Chen, X.; Kan, G.; et al. Artificial selection on GmOLEO1 contributes to the increase in seed oil during soybean domestication. PLoS Genet. 2019, 15, e1008267. [Google Scholar] [CrossRef]
  7. Duan, Z.; Zhang, M.; Zhang, Z.; Liang, S.; Fan, L.; Yang, X.; Yuan, Y.; Pan, Y.; Zhou, G.; Liu, S.; et al. Natural allelic variation of GmST05 controlling seed size and quality in soybean. Plant Biotechnol. J. 2022, 20, 1807–1818. [Google Scholar] [CrossRef]
  8. Qi, Z.; Guo, C.; Li, H.; Qiu, H.; Li, H.; Jong, C.; Yu, G.; Zhang, Y.; Hu, L.; Wu, X.; et al. Natural variation in Fatty Acid 9 is a determinant of fatty acid and protein content. Plant Biotechnol. J. 2024, 22, 759–773. [Google Scholar] [CrossRef]
  9. Cai, Z.; Xian, P.; Cheng, Y.; Yang, Y.; Zhang, Y.; He, Z.; Xiong, C.; Guo, Z.; Chen, Z.; Jiang, H.; et al. Natural variation of GmFATA1B regulates seed oil content and composition in soybean. J. Integr. Plant Biol. 2023, 65, 2368–2379. [Google Scholar] [CrossRef]
  10. Duan, Z.; Li, Q.; Wang, H.; He, X.; Zhang, M. Genetic regulatory networks of soybean seed size, oil and protein contents. Front. Plant Sci. 2023, 14, 1160418. [Google Scholar] [CrossRef]
  11. Zhang, C.; Hong, H.; Yuan, R.; Zhao, K.; Zha, B.; Lamlom, S.F.; Xi, X.; Ren, H.; Qiu, L.; Wang, J. Integrating linkage mapping and GWAS reveals novel genetic architecture of seed weight in soybean (Glycine max L.). Front. Plant Sci. 2026, 16, 1711905. [Google Scholar] [CrossRef]
  12. Han, D.; Zhao, X.; Zhang, D.; Wang, Z.; Zhu, Z.; Sun, H.; Qu, Z.; Wang, L.; Liu, Z.; Zhu, X.; et al. Genome-wide association studies reveal novel QTLs for agronomic traits in soybean. Front. Plant Sci. 2024, 15, 1375646. [Google Scholar] [CrossRef] [PubMed]
  13. Yuan, X.; Jiang, X.; Zhang, M.; Wang, L.; Jiao, W.; Chen, H.; Mao, J.; Ye, W.; Song, Q. Integrative omics analysis elucidates the genetic basis underlying seed weight and oil content in soybean. Plant Cell 2024, 36, 2160–2175. [Google Scholar] [CrossRef]
  14. Diers, B.W.; Keim, P.; Fehr, W.R.; Shoemaker, R.C. RFLP analysis of soybean seed protein and oil content. Theor. Appl. Genet. 1992, 83, 608–612. [Google Scholar] [CrossRef] [PubMed]
  15. Brummer, E.C.; Graef, G.L.; Orf, J.; Wilcox, J.R.; Shoemaker, R.C. Mapping QTL for seed protein and oil content in eight soybean populations. Crop Sci. 1997, 37, 370–378. [Google Scholar] [CrossRef]
  16. Csanádi, G.; Vollmann, J.; Stift, G.; Lelley, T. Seed quality QTLs identified in a molecular map of early maturing soybean. Theor. Appl. Genet. 2001, 103, 912–919. [Google Scholar] [CrossRef]
  17. Nichols, D.M.; Glover, K.D.; Carlson, S.R.; Specht, J.E.; Diers, B.W. Fine mapping of a seed protein QTL on soybean linkage group I and its correlated effects on agronomic traits. Crop Sci. 2006, 46, 834–839. [Google Scholar] [CrossRef]
  18. Phansak, P.; Soonsuwon, W.; Hyten, D.L.; Song, Q.; Cregan, P.B.; Graef, G.L.; Specht, J.E. Multi-Population Selective Genotyping to Identify Soybean [Glycine max (L.) Merr.] Seed Protein and Oil QTLs. G3 2016, 6, 1635–1648. [Google Scholar] [CrossRef]
  19. Fliege, C.E.; Ward, R.A.; Vogel, P.; Nguyen, H.; Quach, T.; Guo, M.; Viana, J.P.G.; Dos Santos, L.B.; Specht, J.E.; Clemente, T.E.; et al. Fine mapping and cloning of the major seed protein quantitative trait loci on soybean chromosome 20. Plant J. 2022, 110, 114–128. [Google Scholar] [CrossRef]
  20. Goettel, W.; Zhang, H.; Li, Y.; Qiao, Z.; Jiang, H.; Hou, D.; Song, Q.; Pantalone, V.R.; Song, B.H.; Yu, D.; et al. POWR1 is a domestication gene pleiotropically regulating seed quality and yield in soybean. Nat. Commun. 2022, 13, 3051. [Google Scholar] [CrossRef]
  21. Jia, H.C.; Wang, P.G.; Sun, B.Q.; Jiang, L.W.; Sun, S.; Lu, W.C.; Han, T.F.; Bai, J.P. Research progress on soybean variety breeding and genetic basis and molecular mechanism of growth period in the northern region of Northeast China. Chin. J. Oil Crop Sci. 2025, 47, 826–839. [Google Scholar]
  22. Yakubu, A.B.; Shaibu, A.S.; Mohammed, S.G.; Ibrahim, H.; Mohammed, I.B. NIRS-Based Prediction for Protein, Oil, and Fatty Acids in Soybean (Glycine max (L.) Merrill) Seeds. Food Anal. Methods 2024, 17, 1592–1600. [Google Scholar] [CrossRef]
  23. Amiteye, S. Basic concepts and methodologies of DNA marker systems in plant molecular breeding. Heliyon 2021, 7, e08093. [Google Scholar] [CrossRef] [PubMed]
  24. Fehr, W.R.; Caviness, C.E.; Burmood, D.T.; Pennington, J.S. Stage of Development Descriptions for Soybeans, Glycine Max (L.) Merrill. Crop Sci. 1971, 2, 929–930. [Google Scholar] [CrossRef]
  25. Hurburgh, C.R., Jr. Soybean Drying and Storage. Iowa State University Extension and Outreach. 2008, PM-1636. Available online: https://isuaamncus122stg.blob.core.windows.net/shop/PM1636.pdf (accessed on 1 January 2025).
  26. Zhang, H.; Hu, Z.; Yang, Y.; Liu, X.; Lv, H.; Song, B.H.; An, Y.C.; Li, Z.; Zhang, D. Transcriptome profiling reveals the spatial-temporal dynamics of gene expression essential for soybean seed development. BMC Genom. 2021, 22, 453. [Google Scholar] [CrossRef]
  27. Vennapusa, A.R.; Somayanda, I.M.; Doherty, C.J.; Jagadish, S.V.K. A universal method for high-quality RNA extraction from plant tissues rich in starch, proteins and fiber. Sci. Rep. 2020, 10, 16887. [Google Scholar] [CrossRef]
  28. Liu, J.; Dong, L.; Duan, R.; Hu, L.; Zhao, Y.; Zhang, L.; Wang, X. Transcriptomic Analysis Reveals the Regulatory Networks and Hub Genes Controlling the Unsaturated Fatty Acid Contents of Developing Seed in Soybean. Front. Plant Sci. 2022, 13, 876371. [Google Scholar] [CrossRef] [PubMed]
  29. Schmutz, J.; Cannon, S.B.; Schlueter, J.; Ma, J.; Mitros, T.; Nelson, W.; Hyten, D.L.; Song, Q.; Thelen, J.J.; Cheng, J.; et al. Genome sequence of the palaeopolyploid soybean. Nature 2010, 463, 178–183. [Google Scholar] [CrossRef] [PubMed]
  30. R Core Team. R: A Language and Environment for Statistical Computing; R Foundation for Statistical Computing: Vienna, Austria, 2011. [Google Scholar]
  31. Love, M.I.; Huber, W.; Anders, S. Moderated estimation of fold change and dispersion for RNA-seq data with DESeq2. Genome Biol. 2014, 15, 550. [Google Scholar] [CrossRef]
  32. Jung, K.; Friede, T.; Beissbarth, T. Reporting FDR analogous confidence intervals for the log fold change of differentially expressed genes. BMC Bioinform. 2011, 12, 288. [Google Scholar] [CrossRef]
  33. Zhao, Y.; Li, M.C.; Konaté, M.M.; Chen, L.; Das, B.; Karlovich, C.; Williams, P.M.; Evrard, Y.A.; Doroshow, J.H.; McShane, L.M. TPM, FPKM, or Normalized Counts? A Comparative Study of Quantification Measures for the Analysis of RNA-seq Data from the NCI Patient-Derived Models Repository. J. Transl. Med. 2021, 19, 269. [Google Scholar] [CrossRef] [PubMed]
  34. Zhao, M.; Li, Y.M. Several Applications of Principal Component Analysis and Corresponding R Language Practice. Hans J. Data Min. 2021, 11, 203–216. [Google Scholar] [CrossRef]
  35. Huang, D.W.; Sherman, B.T.; Lempicki, R.A. Systematic and integrative analysis of large gene lists using DAVID bioinformatics resources. Nat. Protoc. 2009, 4, 44–57. [Google Scholar] [CrossRef]
  36. The Gene Ontology Consortium. The Gene Ontology Resource: 20 years and still GOing strong. Nucleic Acids Res. 2019, 47, D330–D338. [Google Scholar]
  37. Kanehisa, M.; Goto, S. KEGG: Kyoto encyclopedia of genes and genomes. Nucleic Acids Res. 2000, 28, 27–30. [Google Scholar] [CrossRef]
  38. Langfelder, P.; Horvath, S. WGCNA: An R package for weighted correlation network analysis. BMC Bioinform. 2008, 9, 559. [Google Scholar] [CrossRef]
  39. Zhang, B.; Horvath, S. A general framework for weighted gene co-expression network analysis. Stat. Appl. Genet. Mol. Biol. 2005, 4, 1128. [Google Scholar] [CrossRef]
  40. Shannon, P.; Markiel, A.; Ozier, O.; Baliga, N.S.; Wang, J.T.; Ramage, D.; Amin, N.; Schwikowski, B.; Ideker, T. Cytoscape: A software environment for integrated models of biomolecular interaction networks. Genome Res. 2003, 13, 2498–2504. [Google Scholar] [CrossRef]
  41. Jin, J.; Tian, F.; Yang, D.C.; Meng, Y.Q.; Kong, L.; Luo, J.; Gao, G. PlantTFDB 4.0: Toward a central hub for transcription factors and regulatory interactions in plants. Nucleic Acids Res. 2017, 45, D1040–D1045. [Google Scholar] [CrossRef]
  42. Alam, I.; Batool, K.; Huang, Y.; Liu, J.; Ge, L. Developing Genetic Engineering Techniques for Control of Seed Size and Yield. Int. J. Mol. Sci. 2022, 23, 13256. [Google Scholar] [CrossRef]
  43. Sun, Y.; Zhao, X.; Gong, Y.; Qi, Z. Genome-wide identification and expression analysis of the actin gene family in soybean (Glycine max). Genetica 2025, 154, 2. [Google Scholar] [CrossRef]
  44. Livak, K.J.; Schmittgen, T.D. Analysis of relative gene expression data using real-time quantitative PCR and the 2(-Delta Delta C(T)) Method. Methods 2001, 25, 402–408. [Google Scholar] [CrossRef]
  45. Tiwari, S.B.; Shen, Y.; Chang, H.C.; Hou, Y.; Harris, A.; Ma, S.F.; McPartland, M.; Hymus, G.J.; Adam, L.; Marion, C.; et al. The flowering time regulator CONSTANS is recruited to the FLOWERING LOCUS T promoter via a unique cis-element. New Phytol. 2010, 187, 57–66. [Google Scholar] [CrossRef] [PubMed]
  46. Gollan, P.J.; Lima-Melo, Y.; Tiwari, A.; Tikkanen, M.; Aro, E.M. Interaction between photosynthetic electron transport and chloroplast sinks triggers protection and signalling important for plant productivity. Philos. Trans. R. Soc. Lond. B Biol. Sci. 2017, 372, 20160390. [Google Scholar] [CrossRef]
  47. Schwarz, D.; Schubert, H.; Georg, J.; Hess, W.R.; Hagemann, M. The gene sml0013 of Synechocystis species strain PCC 6803 encodes for a novel subunit of the NAD(P)H oxidoreductase or complex I that is ubiquitously distributed among Cyanobacteria. Plant Physiol. 2013, 163, 1191–1202. [Google Scholar] [CrossRef] [PubMed]
  48. Song, Q.X.; Li, Q.T.; Liu, Y.F.; Zhang, F.X.; Ma, B.; Zhang, W.K.; Man, W.Q.; Du, W.G.; Wang, G.D.; Chen, S.Y.; et al. Soybean GmbZIP123 gene enhances lipid content in the seeds of transgenic Arabidopsis plants. J. Exp. Bot. 2013, 64, 4329–4341. [Google Scholar] [CrossRef]
  49. Jin, Y.; Ni, D.A.; Ruan, Y.L. Posttranslational elevation of cell wall invertase activity by silencing its inhibitor in tomato delays leaf senescence and increases seed weight and fruit hexose level. Plant Cell. 2009, 21, 2072–2089. [Google Scholar] [CrossRef]
  50. Salminen, T.A.; Blomqvist, K.; Edqvist, J. Lipid transfer proteins: Classification, nomenclature, structure, and function. Planta 2016, 244, 971–997. [Google Scholar] [CrossRef]
  51. Luo, N.; Wang, Y.; Liu, Y.; Wang, Y.; Guo, Y.; Chen, C.; Gan, Q.; Song, Y.; Fan, Y.; Jin, S.; et al. 3-ketoacyl-CoA synthase 19 contributes to the biosynthesis of seed lipids and cuticular wax in Arabidopsis and abiotic stress tolerance. Plant Cell Environ. 2024, 47, 4599–4614. [Google Scholar] [CrossRef]
  52. Hu, C.; Yang, J.; Qi, Z.; Wu, H.; Wang, B.; Zou, F.; Mei, H.; Liu, J.; Wang, W.; Liu, Q. Heat shock proteins: Biological functions, pathological roles, and therapeutic opportunities. MedComm 2022, 3, e161. [Google Scholar] [CrossRef] [PubMed]
  53. Li, J.; Zhou, W.; Francisco, P.; Wong, R.; Zhang, D.; Smith, S.M. Inhibition of Arabidopsis chloroplast β-amylase BAM3 by maltotriose suggests a mechanism for the control of transitory leaf starch mobilisation. PLoS ONE 2017, 12, e0172504. [Google Scholar] [CrossRef] [PubMed]
  54. Nguyen, Q.T.; Kisiala, A.; Andreas, P.; Neil Emery, R.J.; Narine, S. Soybean Seed Development: Fatty Acid and Phytohormone Metabolism and Their Interactions. Curr. Genom. 2016, 17, 241–260. [Google Scholar] [CrossRef] [PubMed]
  55. Yang, M.; Han, X.; Yang, J.; Jiang, Y.; Hu, Y. The Arabidopsis circadian clock protein PRR5 interacts with and stimulates ABI5 to modulate abscisic acid signaling during seed germination. Plant Cell 2021, 33, 3022–3041. [Google Scholar] [CrossRef] [PubMed]
Figure 1. Phenotypic and genotype characterization for four soybean accessions: (A) Seed characteristic of four cultivars, including Dongnong 50 (DN50), Dongnong 60 (DN60), Hefeng 25 (HF25), and Heihe 43 (HH43). (B) The genotype of the POWR1 gene. (C) Phenotypic values of seed oil (%), protein content (%) and seed wight (g). Student’s t-test. Values are means ± SDs ((n  =  10). p  <  0.01 (**), p < 0.001 (***). (D) Seed developmental stages of DN50. E: Early-stage. M: Mid-stage. L: Late-stage.
Agronomy 16 00562 g001
Figure 2. Global transcriptomic analysis of high-protein (HP) and low-protein (LP) soybean seeds at different developmental stages: (A) Principal component analysis (PCA). (B) Spearman correlation analysis. (C) Number of differentially expressed genes (DEGs) between HP and LP groups at cotyledon and seedcoat across all seed developmental stages. (D) Heat-map clustering analysis for upregulated DEGs in HP group. Red represents up-regulated genes, and blue represents down-regulated genes. ECO: Early-stage cotyledon; MCO: Mid-stage cotyledon; LCO: Late-stage cotyledon; ESC: Early-stage seed coat; MSC: Mid-stage seed coat; LSC: Late-stage seed coat. DN50: Dongnong 50; DN60: Dongnong 60; HH43: Heihe 43; HF25: Hefeng 25. For example, “DN50-ECO” represents the RNA-seq of DN50 in the ECO.
Agronomy 16 00562 g002
Figure 3. Stage- and tissue-specific transcriptomic dynamics of differentially expressed genes (DEGs) in soybean seeds: (A) Heat-map clustering analysis for DEGs between high-protein (HP) and low-protein (LP) groups. Red: up-regulated genes; blue: down-regulated genes. (B) Number of stage- and tissue-specific DEGs. (C) The stage- and tissue-specific GO categories. ECO: Early-stage cotyledon; MCO: Mid-stage cotyledon; LCO: Late-stage cotyledon; ESC: Early-stage seed coat; MSC: Mid-stage seed coat; LSC: Late-stage seed coat.
Agronomy 16 00562 g003
Figure 4. Weighted Gene Co-expression Network Analysis (WGCNA) between high-protein (HP) and low-protein (LP) groups: (A) Hierarchical cluster tree showing co-expression the modules identified by WGCNA. Each leaf represents a gene, and major branches constitute nine distinct color-coded modules. (B) Module–trait associations. The correlations between each module and 12 traits are shown with correlation coefficients and p-values. Red indicates positive correlations, and green indicates negative correlations. Traits for each group at each stage are labeled as group HP or LP followed by developmental stage (E, M, L): ECO: Early-stage cotyledon; MCO: Mid-stage cotyledon; LCO: Late-stage cotyledon; ESC: Early-stage seed coat; MSC: Mid-stage seed coat; LSC: Late-stage seed coat. (CE) The core networks for specific modules, including the salmon-module (C), green-module (D), and tan-module (E). The size of the nodes indicates the degree of connectivity within the core network. Red indicates the hub genes most likely involved in seed protein and oil accumulation.
Agronomy 16 00562 g004
Figure 5. Proposed model for transcriptional regulation of carbon partitioning between protein and oil accumulation in soybean seeds. The involved key genes are highlighted: red denotes gene families specific to the high-protein group, blue denotes those specific to the low-protein group, and green denotes gene families containing members putatively associated with either high protein or high oil content. TP: Triose phosphate; Star: Starch; Suc: Sucrose; Glu: Glucose; G6P: Glucose 6-phosphate; FA: Fatty acid; PYR: Pyruvate; ER: Endoplasmic reticulum; Nu: Nucleus; NDF6: NDH-dependent Flow 6; PGR: Proton Gradient Regulation; BAM3: Chloroplast beta-amylase 3; GH10: Glycosyl hydrolase family 10; XTHs: Xylanose invertases/hydrolases; MFC: Major facilitator; CWINV1: Cell wall invertase; C/VIF1: Cell wall/vacuolar inhibitor of fructosidase 1; OLEs: Oleosin; LTPs: Lipid-transfer proteins; LACS: Long-chain acyl-CoA synthetase; KCS: 3-ketoacyl-CoA synthases; GDSL: GDSL-like Lipase/Acylhydrolase superfamily protein; DGATs: Diacylglycerol O-acyltransferases; OLEs: Oleosins; LTPs: Non-specific lipid-transfer proteins; SEIPIN: Seipin; HSPs: Heat shock proteins; LNKs: NIGHT LIGHT–INDUCIBLE AND CLOCK-REGULATED; COR27: Cold-regulated gene 27; FKF1: Flavin-binding, kelch repeat, f box 1; GI: Gigantea; TCP: TEOSINTE BRANCHED1, CYCLOIDEA, and PCF; LSH: Light-sensitive hypocotyls; MLP423: MLP-like proteins 423; CAR: C2-domain ABA-related protein; JAZ: Jasmonate-zim-domain proteins; ERFs: Ethylene response factors; NF-YA9: nuclear factor Y, subunit A9; ABA: abscisic acid; ABF1: Abscisic acid responsive element-binding factor 1.
Agronomy 16 00562 g005
Figure 6. Validation of RNA-Seq data. (A) RT-qPCR results. *, p < 0.05; **, p < 0.01; ***, p < 0.001 (Student’s t-test). Values are means ± SDs ((n  =  3). ECO: Early-stage cotyledon; ESC: Early-stage seed coat; 50: Dongnong 50; 25: Hefeng 25. For example, “ECO50” represents the RT-qPCR in the ECO of DN50. (B) The correlation between RT-qPCR and RNA-seq expression.
Agronomy 16 00562 g006
Disclaimer/Publisher’s Note: The statements, opinions and data contained in all publications are solely those of the individual author(s) and contributor(s) and not of MDPI and/or the editor(s). MDPI and/or the editor(s) disclaim responsibility for any injury to people or property resulting from any ideas, methods, instructions or products referred to in the content.