Article

Dose-Specific Biochar Effects on Cotton Yield Under Drought: Genotypic Variations in the Arid U.S. Cotton Belt


1
Department of Plant and Environmental Sciences, New Mexico State University, Las Cruces, NM 88003, USA
2
School of Agriculture, Tennessee Tech University, Cookeville, TN 38505, USA
3
Agricultural Science Center at Clovis, New Mexico State University, 2346 Sr 288, Clovis, NM 88101, USA
4
Department of Extension Plant Science, New Mexico State University, Las Cruces, NM 88003, USA
5
Department of Agricultural Leadership, Education, and Communications, Texas A&M University, College Station, TX 77843, USA
6
Department of Plant and Soil Sciences, Delaware Biotechnology Institute, University of Delaware, Newark, DE 19713, USA
7
Department of Biosystems Engineering, Auburn University, Auburn, AL 36849, USA
8
Southwestern Cotton Ginning Research Laboratory, USDA-ARS, Mesilla Park, NM 88047, USA
*
Author to whom correspondence should be addressed.
Current Address: Division of Plant Science and Technology, University of Missouri, Columbia, MO 65201, USA.
Agronomy 2026, 16(3), 346; https://doi.org/10.3390/agronomy16030346

Submission received: 25 December 2025 / Revised: 27 January 2026 / Accepted: 28 January 2026 / Published: 30 January 2026
(This article belongs to the Special Issue Plant Stress Tolerance: From Genetic Mechanism to Cultivation Methods)

Abstract

Cotton (Gossypium spp.) is the most important fiber crop for the textile industry globally. Abiotic stresses, including drought, have become prevalent in affecting cotton production worldwide. There is a shortage of studies on the use of biochar as a soil amendment in the semi-arid and arid Southwest and West U.S. Cotton Belt to alleviate drought stress. This study was conducted to examine the effects of biochar at four application rates (0, 6.25, 12.5, and 25.0 t ha−1) on cotton yield and yield components using six tetraploid cotton genotypes, including one Pima (G. barbadense L.) and five Upland cottons (G. hirsutum L.), under well-watered (WW) and drought stress (DS) conditions in an arid region of New Mexico, USA. The six cotton genotypes consistently showed that DS at the flowering stage significantly decreased boll number (BN), boll weight (BW), and lint percentage (LP), and thereby seed cotton weight (SCW) per plant and lint weight (LW) per plant. However, Pima DP 359 RF had the lowest reduction (23–33%) in BN, SCW, and LW due to drought, while DP 2020 B3XF was the most sensitive to drought, with a 45–48% reduction in the traits. Under DS conditions, biochar at the rate of 12.5 t ha−1 had the highest SCW and LW, and the lowest reduction in BN, BW, SCW, and LW due to drought, which was significantly different from the non-biochar control, and no genotype × biochar interaction was detected. However, biochar had no positive effects on cotton productivity under non-drought conditions. This study has demonstrated the positive effects of biochar on cotton yield and yield components in alleviating drought stress, laying the foundation for more follow-up studies toward its utility in cotton production in semi-arid and arid areas.

1. Introduction

Cotton (Gossypium spp.) is grown in more than 100 countries as the most important fiber crop for the world textile industry and one of the most important oilseed crops. The U.S. ranks fourth in cotton production after China, India, and Brazil [1,2]. Upland cotton (G. hirsutum L.) accounts for 97% of world cotton production, together with the remainder produced by extra-long staple (ELS) Egyptian, Pima, or Sea-Island cotton (G. barbadense L.). Cottonseed, often treated as a by-product in cotton production, accounts for 15–20% of the farm-gate value for its use as food oil, animal feed, and fertilizer [3,4]. Sustainable cotton production faces many challenges, including drought, disappearing or depleting water tables, salt, diseases, pests, weeds, and poor soil health [1,2]. For example, although cotton is relatively drought tolerant as compared to many other field crops [5], drought has been one of the most important limiting factors in cotton production in the entire U.S. Cotton Belt, especially in the arid and semi-arid Southwest and West regions, including Texas, New Mexico, Arizona, and California. The above production issues require a comprehensive solution from both genetics and management practices [1,2].
One of the practices in the management toolbox is the use of biochar for soil amendment to mitigate drought stress and improve soil health. Biochar is a form of charcoal produced by pyrolysis, a thermal decomposition process of biomass (such as wood, crop residues, manure, and solid waste) with no oxygen supply in an enclosed system to capture emissions [6]. Based on many studies [7], biochar amendments improve soil water-holding capacity and promote nutrient effectiveness through several key mechanisms, although significant data gaps exist. In cotton production, for example, numerous studies have been conducted in China, India, and Pakistan, and results have shown that the application of biochar improved soil physical and chemical properties, such as reducing soil bulk density, pH, and nitrate and increasing soil porosity, soil water content (soil water storage or water-holding capacity), and soil fertility through increasing soil organic matter and the availability of soil nitrogen (N), phosphorus (P), and potassium (K) [8,9,10,11,12,13,14,15,16,17,18]. Most of the field and pot studies have also demonstrated positive effects of biochar on root growth, chlorophyll content, content of N, P, and K in cotton plants (nutrient-use efficiency), water-use efficiency, leaf area index, plant height, biomass, the number of fruiting branches and bolls, boll weight, and eventually cotton yield [19,20,21,22,23,24,25,26,27]. Several studies also showed that applying biochar to the soil reduced the use of N, P, and K fertilizers [25,28,29].
However, controversial results on the effects of biochar have been reported in cotton, although soil amendment with biochar is generally considered a promising management practice in mitigating drought or saline conditions [23,30,31,32,33,34,35,36]. No positive effect on cotton yield was detected from using biochar in the soil in two reports [28,29]. Lamb et al. [37] also did not detect significant differences in cotton yield among three biochar treatments under three irrigation regimes. Pinnamaneni et al. [38] reported inconsistent results among different testing years in that biochar at the levels of 20 and 40 t ha−1 significantly increased lint and seed yields in the third year but not in the first two years. Sun et al. [23] observed reduced but positive effects of biochar on cotton in the second year rather than the first year, which suggested diminishing effects of biochar over time. In a 4-year study, Bohara et al. [39] observed reduced tissue N content and cotton yield in poultry litter-fertilized soils by the application of pine hardwood biochar.
It is possible that those inconsistent results on biochar effects were caused by environmental conditions including soil (e.g., types, fertility, and moisture), biochar, including characteristics and application amount, genotypic differences, or genotype × environment interactions. Most of the positive effects of biochar on cotton growth and yield were reported in semi-arid and arid areas such as Northwest China, India, and Pakistan. In the U.S., however, only very few studies on the effects of biochar in cotton production were reported in the humid Southeast and Mid-South regions of the Cotton Belt [37,38,39]. No studies on the use of biochar from the semi-arid and arid Southwest and West Cotton Belt have been reported. In addition, it is unknown if cotton genotypes respond to biochar differently because multiple cotton genotypes have not been concurrently evaluated.
To address the effects of biochar in relation to drought stress and cotton genotypes in the arid U.S. Cotton Belt, the objectives of this study were to examine the genotypic effects of biochar on cotton yield and yield component traits in six cotton genotypes and the environmental effects on biochar under normal and reduced irrigation (drought) conditions in the irrigated western region, including New Mexico, of the U.S. Cotton Belt. Effects due to genotype, biochar, irrigation, and their two-way and three-way interactions were investigated. In this study, we hypothesized that biochar was the most effective at a rate of 12–15 t ha−1 and enhanced its positive effect on drought-tolerant genotypes under drought conditions. This report represents one of the first studies of biochar in cotton production in the arid region of the U.S., providing important and novel information for furthering investigations of utilizing biochar in irrigated agriculture.

2. Materials and Methods

2.1. Plant Materials

Six cotton cultivars and lines developed in the U.S. were used in this study. They were five Upland cotton genotypes, i.e., DP 2020 B3XF (Bayer Crop Science U.S., St. Louis, MO, USA), MD 10-5 (Reg. No. GP-999, PI 675077) [40], Acala 1517-08 (Reg. No. CV-126, PI 659505) [41], and two unreleased experimental lines from New Mexico State University NM 21FA-01 and NM 21FA-02 (Zhang 2024, unpublished), and one Pima cotton cultivar, DP 359 RF (Bayer Crop Science U.S., St. Louis, MO, USA).

2.2. Irrigation Treatments

The experiment was conducted in a cotton field with clay soil (Armijo Clay Loam and Harkey Loam soil series) at New Mexico State University’s Leyendecker Plant Science Research Center, south of Las Cruces, NM (Longitude 32.20595 N and Latitude 106.74951 W). Two irrigation treatments, including well-watered (WW) and drought stress (DS) conditions, were used in this study. The DS plots were arranged in the field in a way that there were eight border rows of cotton (8 m wide) from one side of the DS plots. The WW plots were arranged side by side to the DS plots in the same field, but the two treatments were separated by 20 m with 20 rows of cotton planted as a buffer zone.
On average, Las Cruces, NM, receives 220 mm of rainfall annually, with 147 mm of rainfall during the monsoon season (from May to September). However, 2024 represented one of the driest years with only 139 mm of total rainfall including 22.1 (in 13 days), 38.9 (in 6 days), 24.4 (in 4 days), 6.6 (in 5 days), and 0.5 (in 1 day) mm for May through September, respectively. Therefore, frequent irrigations (on a 3–4-week basis) were needed. For the WW treatment, five furrow irrigations (on 14 May, 3 June, 27 June, 26 July, and 20 August) were applied at an approximate amount of 2300 m3 ha−1 of water in each irrigation event during the growing season. However, for the DS treatment, only four furrow irrigations without the 26 July (at the peak flowering stage) irrigation were applied with the same amount of water as the WW treatment at the same time.

2.3. Biochar Treatments

In each irrigation treatment, biochar was applied. We purchased the biochar from a local company (West Fraser Timber Co. Ltd., Cordova, TN, USA), and it was produced from wood and bark of southern yellow pine obtained from mills’ debarkers and purchased biomass, using a train of rotary kilns at around 700–800 °C by the manufacturer. The biochar was characterized using proximate and ultimate analysis including metal composition (Supplementary Table S1), surface area, and pore volume. The detailed characterization was also provided in the published document elsewhere [42]. Four different biochar rates, i.e., rates 0 (R0), 1 (R1), 2 (R2), and 3 (R3) with 0, 6.25, 12.5, and 25.0 t ha−1 of the biochar, respectively, were used. Prior to the application of the biochar, raised planting beds with 1 m row spacing were made after plowing, cultivating, and leveling, followed by a pre-planting furrow irrigation in the 244 m × 224 m cotton field. When the soil was dry enough, a mechanical spreader (Millcreek EA 3100 PTO Spreader, Millcreek Manufacturing Co., Leola, PA, USA) was used to surface-apply the biochar to the beds at the above rates with 2 rows for each rate. A cultivator was subsequently used to incorporate the biochar into the soil at the 0.1 m depth.

2.4. Experimental Design, Planting, and Trait Measurements

The two field tests (WW and DS), including four biochar rates and six cotton genotypes, were each arranged in a randomized complete block design with four replications. Therefore, each replication consisted of 24 (4 biochar rates × 6 genotypes) 2-row plots of 9 m long for each irrigation treatment. Seeds for a total of 384 plots (24 plots × 4 replications × 2 irrigation treatments) were packaged in coin envelopes (2 packets plot−1) and mechanically planted using a 4-row plot planter at the rate of 10 seeds m−1 on 13 May 2024. Crop management followed local recommendations for cotton production in New Mexico. At crop maturity, seed cotton from 20 open bolls (with one from each of 20 representative plants) was hand harvested in each plot for ginning using a 10-saw tabletop laboratory gin. The 20-boll seed cotton was weighed using an AD Precision Scale (0.001 g/0.01 g) (Scientific Industries, Inc., Bohemia, NY, USA) to estimate boll weight (BW, g) boll−1; and the lint percentage (LP, %) was calculated as the percentage of lint weight (LW, g) by the seed cotton weight (SCW, g) after ginning of each boll sample.
To partition the yield components, the number of mature bolls was counted from a subset of five plants that were randomly chosen to estimate the boll number (BN) plant−1 in each plot. SCW (g plant−1) was then estimated from BN × BW, while LW (g plant−1) was estimated from SCW × LP on a plot basis.

2.5. Analysis of Variance (ANOVA) and Multiple Comparisons

All data were subject to ANOVA based on a general linear mixed model procedure to determine the significance of various sources of variation using SAS 9.4 software (SAS Institute 2013). In this study, irrigation treatments, biochar rates, genotypes, and their interactions were all treated as fixed factors, while replications were treated as a random factor. Because the non-biochar treatment (R0) was primarily used as the control to compare with the three biochar rates (R1, R2, and R3), means were separated using the least significant difference (LSD) test at p < 0.05 level.

3. Results

3.1. Analysis of Variance (ANOVA)

3.1.1. A Combined ANOVA Across Irrigation Treatments

As shown in Table 1, a combined ANOVA across the irrigation regimes detected significant variations due to genotypes and irrigations for all the traits measured, including boll number per plant (BN), boll weight (BW, g) per boll, lint percentage (LP, %), seed cotton weight (SCW, g) per plant, and lint weight (LW, g) per plant. However, no significant differences among biochar treatments were detected. There was no genotype × biochar or genotype × irrigation × biochar interaction.
There were significant genotype × irrigation interactions for LP, SCW, and LW (Table 1). The results suggest that genotypes responded differently between well-watered (WW) and drought stress (DS) conditions. There was also an irrigation × biochar interaction for the above three traits except for LW (Table 1), suggesting that the effects of biochar differed between WW and DS conditions. Therefore, the tests warranted a separate ANOVA for genotypes and biochar treatments under the two irrigation treatment conditions.

3.1.2. ANOVA Under WW Conditions

Under WW conditions, there were significant genotypic variations for all the traits measured (Table 2), similar to the results from the combined ANOVA, as shown in Table 1. However, there was no significant variation due to biochar treatments for all traits except for LP (Table 2). The results indicate that biochar did not affect the five traits except for LP under WW conditions. There was also no genotype × biochar interaction for any of the five traits.

3.1.3. ANOVA Under DS Conditions

In contrast, under DS conditions, significant genotypic variations were detected for BN, BW, and LP, but not for SCW and LW (Table 3). However, the opposite was true for biochar treatments in that significant variations due to biochar treatments were detected for SCW and LW but not for the other three traits (Table 3). Once again, no genotype × biochar interaction was detected for any of the five traits (Table 3).

3.1.4. ANOVA of Relative Drought Tolerance with Different Biochar Treatments

The relative drought tolerance was measured based on ratios of trait values between DS and WW conditions for each biochar treatment. ANOVA detected significant variations among genotypes and biochar treatments in all the traits except for LW among genotypes (Table 4).

3.2. Genotypic Differences

3.2.1. Genotypic Differences Under Both WW and DS Conditions

Across both WW and DS conditions, Pima DP 359 RF overall had the lowest BW and LP, and lower SCW and LW than the three Upland lines (Table 5), as expected of a low-yielding cultivated tetraploid species (G. barbadense), as compared to the high-yielding Upland cotton (G. hirsutum). However, it had the highest BN and similar SCW and LW to two NM lines NM 21FA-01 and NM 21FA-02 (Table 5) under WW and DS conditions, unexpected for Pima cotton under normal cotton production conditions. The results further indicated the need for a separate analysis between WW and DS conditions.
Among the five Upland cotton lines, the three Acala lines developed in New Mexico had significantly lower BN and heavier BW than DP 2020 B3XF and MD 10-5 under WW and DS conditions (Table 5). All the Upland cotton lines had LP above 44%, with the exception of MD 10-5. Acala 1517-08, DP 2020 B3XF, and MD10-5 had significantly higher SCW and LW than NM 21FA-01 and NM 21FA-02 (Table 5).

3.2.2. Genotypic Differences Under WW Conditions

Genotypic means for the six lines tested under WW conditions are shown in Table 6. Pima DP 359 RF and two Upland lines—DP 2020 B3XF and MD 10-5—had significantly higher BN than the three New Mexico cotton lines. However, the Pima line had the lowest BW, significantly lower than the five Upland lines (Table 6). Among the five Upland lines, Acala 1517-08 had the highest BW, followed by the two other New Mexico lines; and DP 2020 B3XF and MD 10-5 had lower BW. Similarly, the Pima line had the lowest LP, SCW, and LW, as expected of a low-yielding cultivated tetraploid cotton species under normal cotton production management.
Four of the five Upland lines had similar LP ranging between 44.4 and 45.3%, significantly lower than that of NM 21FA-01. Among the five Upland lines, Acala 1517-08 and DP 2020 B3XF had the highest SCW and LW, followed by MD 10-5. However, NM 21FA-1 and NM 21FA-02 were the lowest in SCW and LW, significantly lower than Acala1517-08 and DP 2020 B3XF.

3.2.3. Genotypic Differences Under DS Conditions

Under DS conditions (Table 7), the Pima line still had the highest BN, smallest bolls, and lowest LP among all six lines. Among the five Upland lines, MD 10-5 had the highest BN, followed by DP 2020 B3XF and Acala 1517-08. Acala 1517-08 had the highest BW, while MD 10-5 had the smallest bolls with the lowest LP.
However, there were no significant differences in SCW and LW among the six lines tested under the drought conditions. In fact, the Pima line had the numerically highest SCW, suggesting that Pima cotton performed better than Upland cotton under DS conditions due to its drought tolerance.

3.2.4. Genotypic Differences in Relative Drought Tolerance with Different Biochar Treatments

Overall, Pima DP 357 RF had the highest ratios (67–77%) in BN, SCW, and LW under DS, i.e., the lowest reduction for those three traits from WW to DS (Table 8). The results suggest that the Pima line had the highest drought tolerance among the six lines tested.
Among the five Upland lines, DP 2020 B3XF had the lowest ratios (51.7–55.0%) for the three traits, suggesting that it was the least drought-tolerant line, while MD 10-5 had the highest ratios for BN, BW, and SCW (Table 8). However, due to the significant and greater reduction in LP, its ratio in LW was close to that of other Upland lines (Table 8). Overall, the differences in ratios for the five traits, except for LP among the five Upland lines, were not significant (Table 8).

3.3. Effects of Drought

Drought treatment significantly reduced BN, BW, LP, SCW, and LW (Table 9). Under WW conditions, BN averaged 14.32 bolls plant−1, significantly higher than that under DS conditions (8.94 bolls plant−1, LSD0.05 = 0.76). The BW averaged 4.83 vs. 4.55 g boll−1 (LSD0.05 = 0.15); LP averaged 44.61 vs. 42.82% (LSD0.05 = 0.39%); SCW averaged 68.24 vs. 39.25 g plant−1 (LSD0.05 = 2.91); and LW averaged 30.56 vs. 16.76 g plant−1 (LSD0.05 = 1.24) under WW and DS conditions, respectively. The DS conditions reduced BN by 37.57%, BW by 5.80%, LP by 4.01%, SCW by 42.48%, and LW by 45.16%. The results suggested that the reduction in SCW and LW was predominantly due to the reduction in BN, although the other two yield components (BW and LP) were also reduced by DS, to a much lesser extent (at 4–5%).

3.4. Effects of Biochar

Significant variations among biochar treatments were detected for LP under WW conditions (Table 2), for SCW and LW under DS conditions (Table 3), and for ratios of all five traits regarding relative drought tolerance (Table 4). Therefore, a comparative analysis was further performed.
Under WW conditions, biochar Rate 0 (i.e., with no biochar, R0) had the overall lowest LP (43.68%), followed by Rate 1 (R1) with 6.25 t ha−1 of biochar applied (44.41%). Rate 2 (R2) with 12.5 t ha−1 of biochar and Rate 3 (R3) with 25.0 t ha−1 of biochar had significantly higher LP than R0, at 45.03 and 45.32%, respectively. LP between R1 and R2 and between R2 and R3 did not significantly differ (LSD0.05 = 0.84).
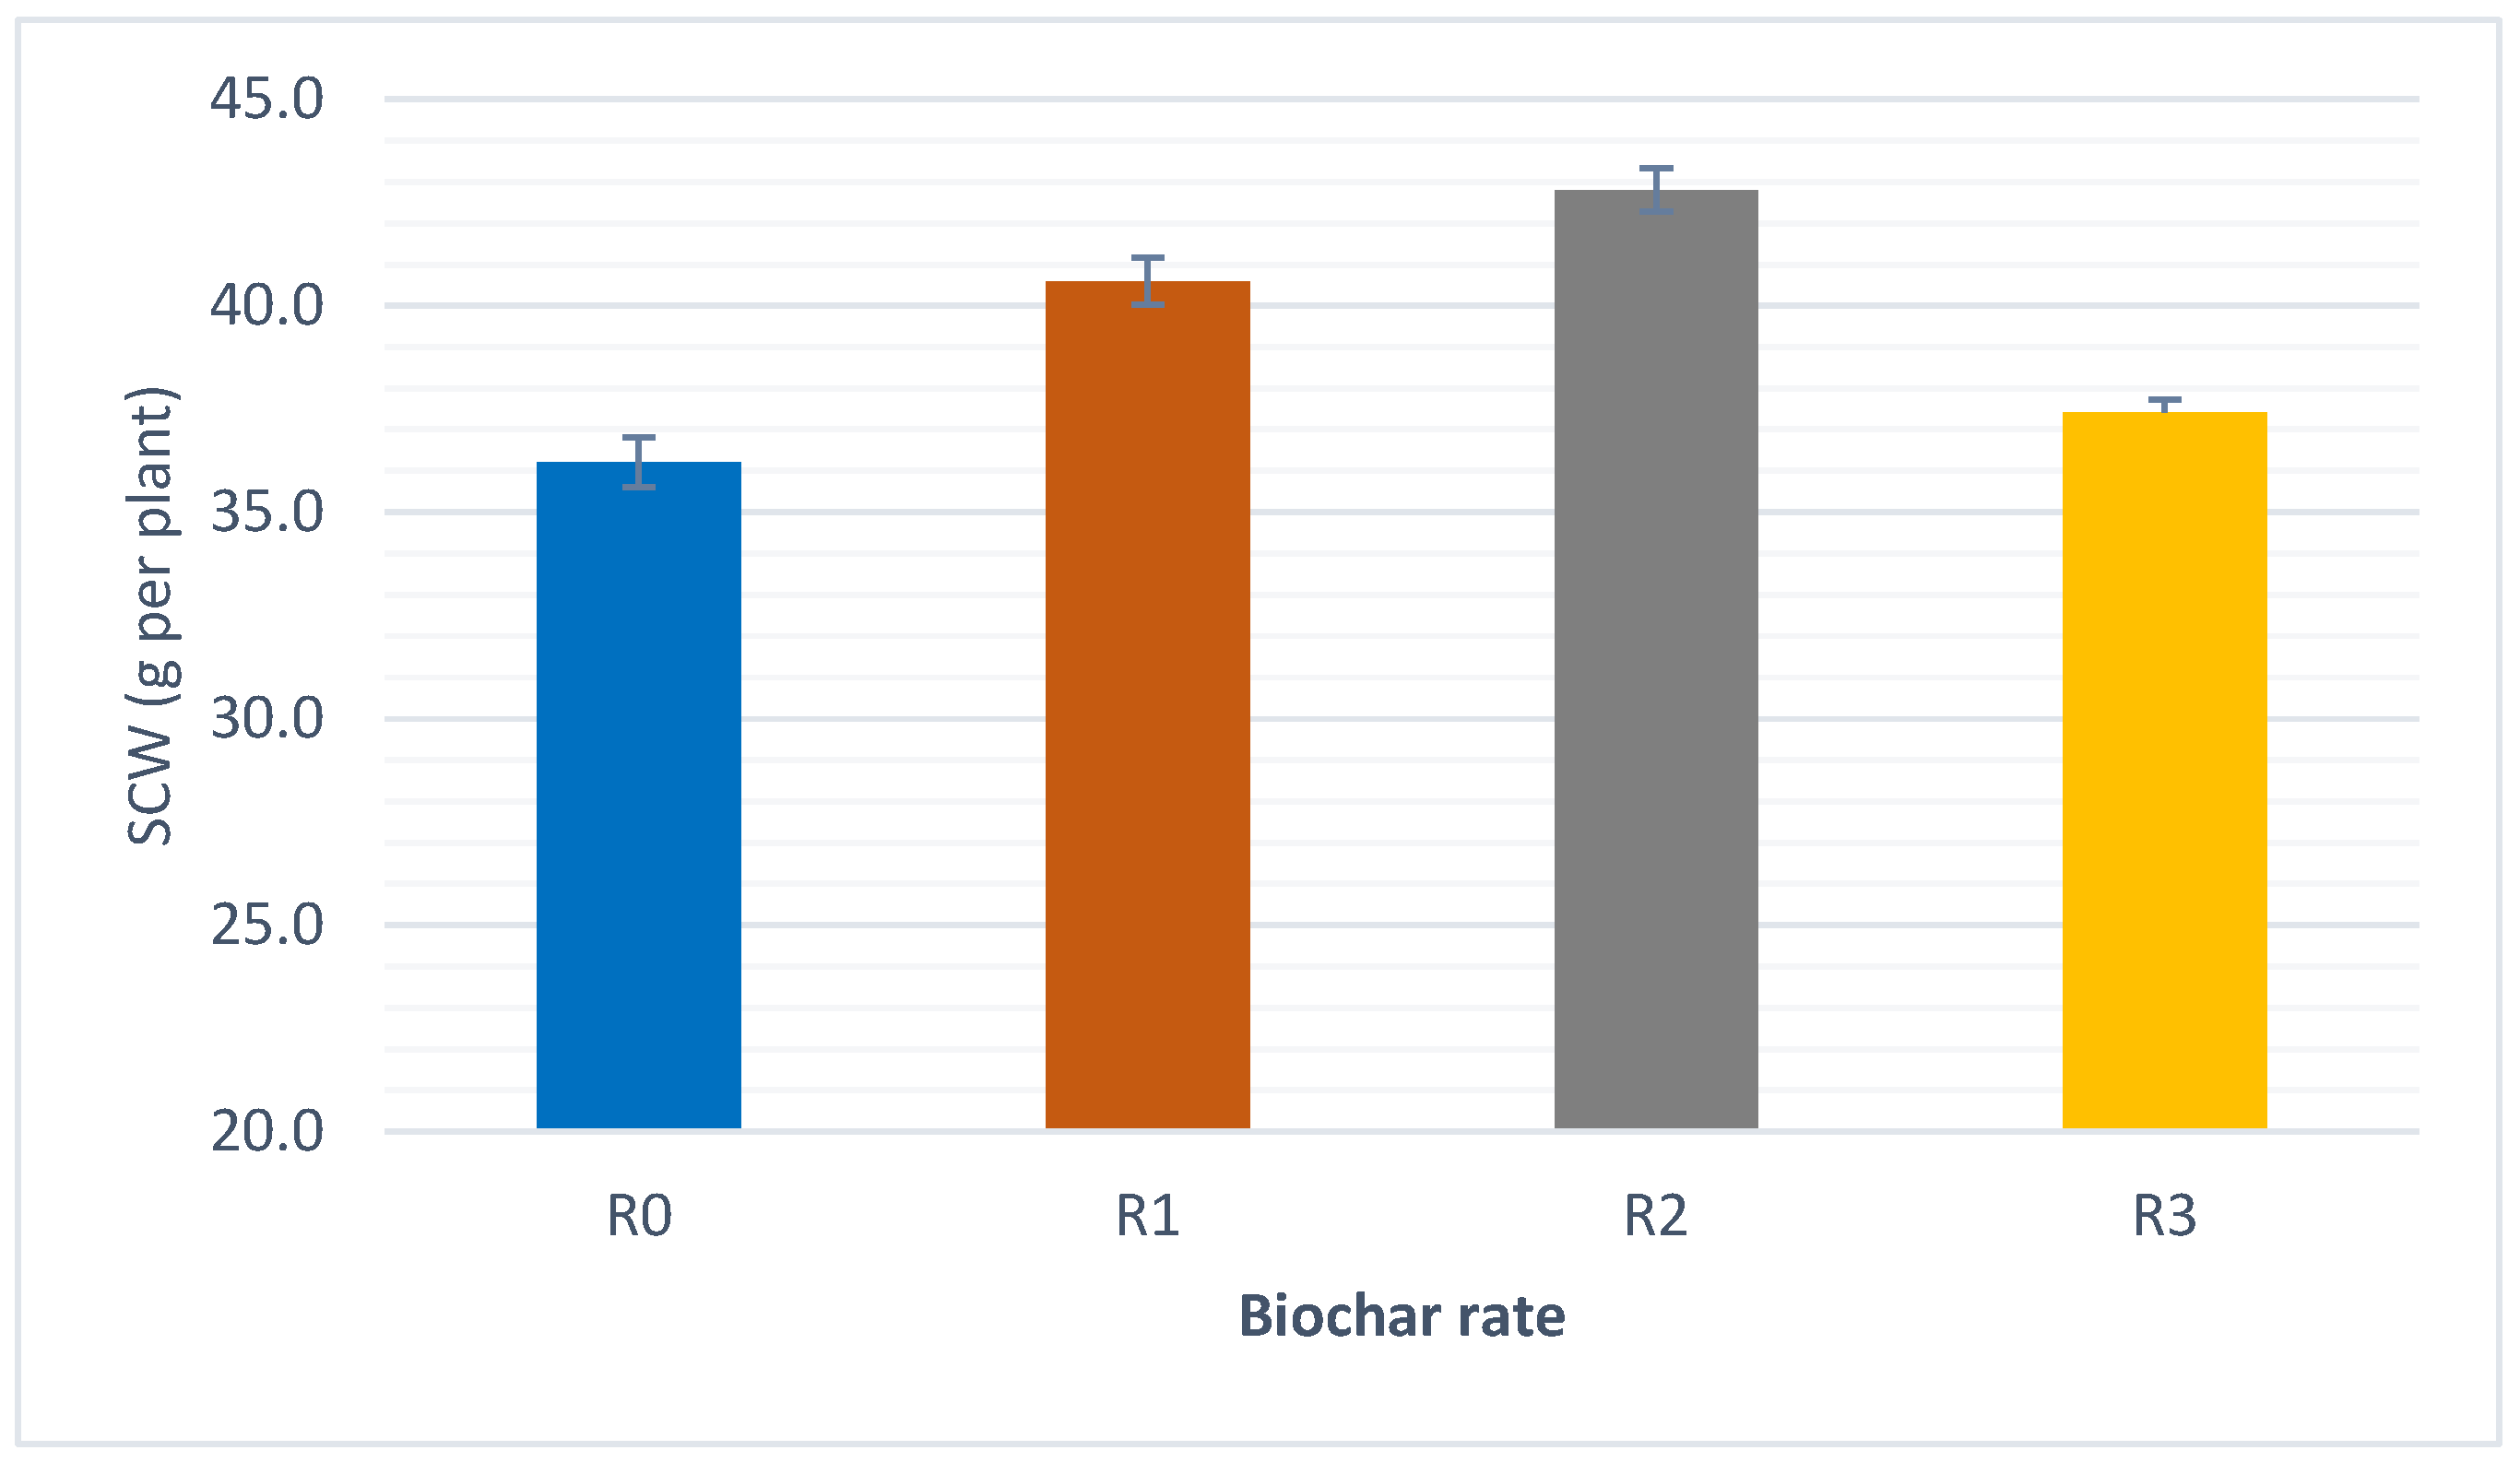
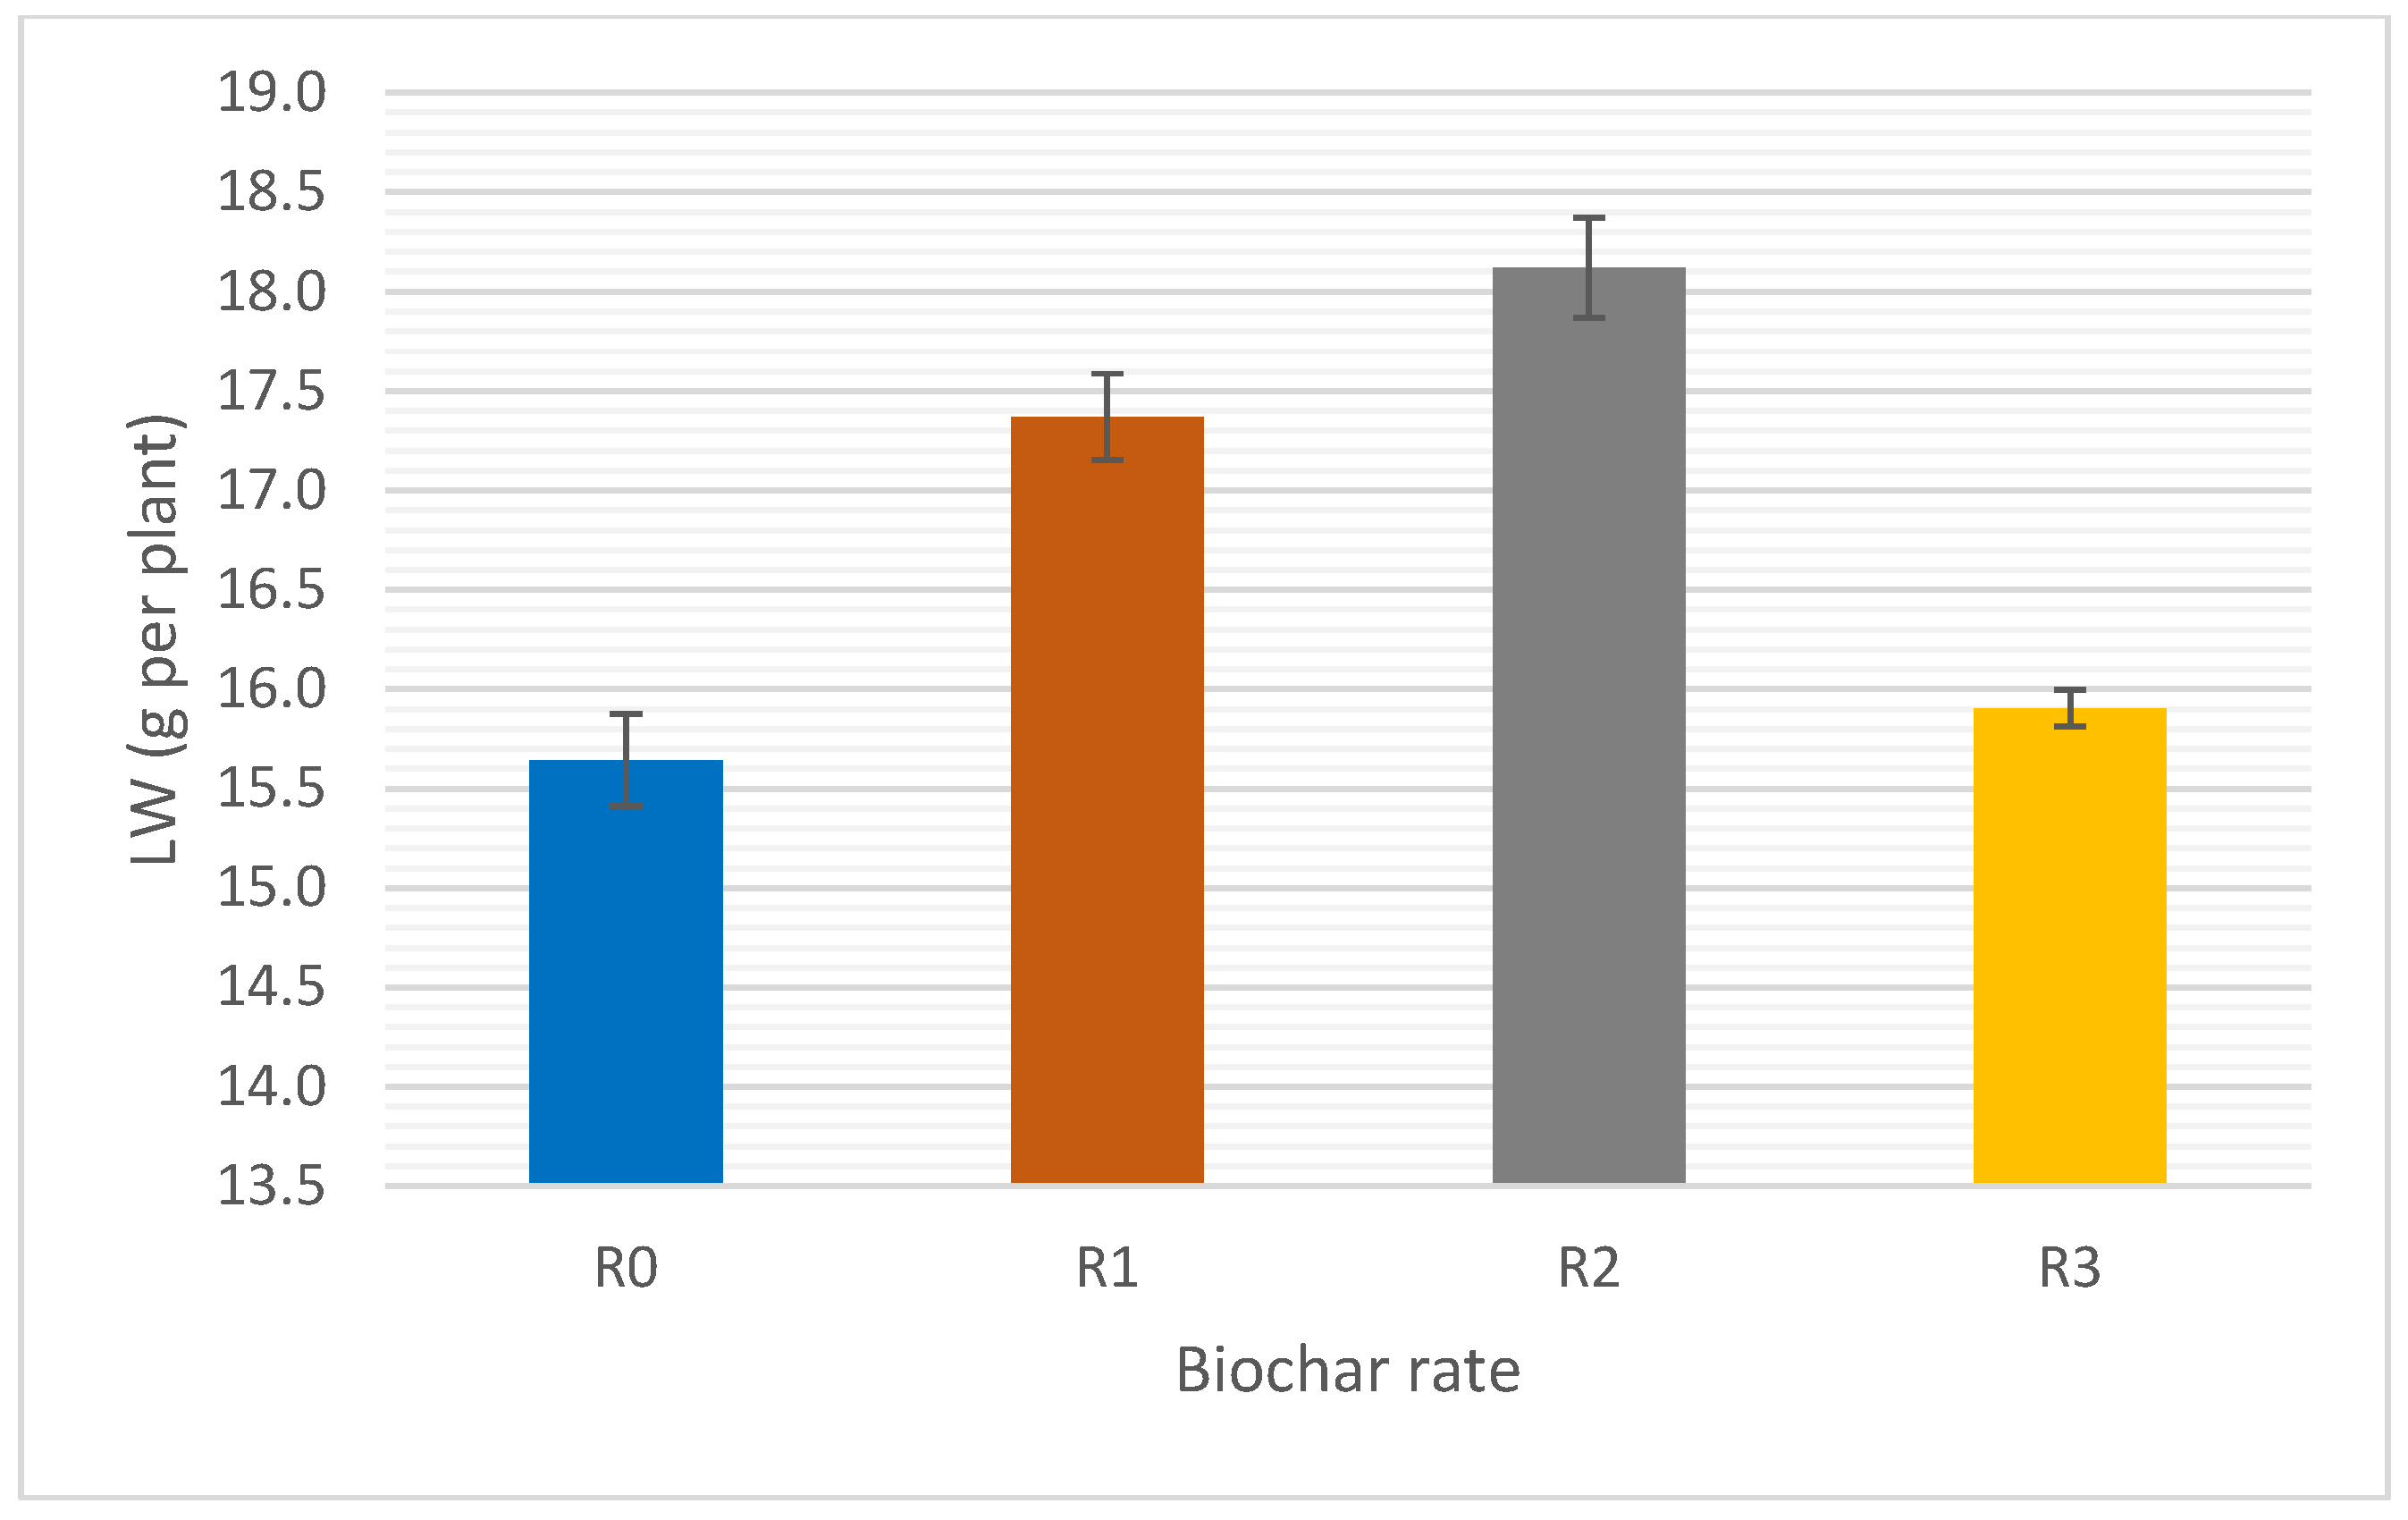
Under DS conditions, cotton grown with no biochar treatment (R0) had the lowest SCW (36.20 g plant−1), followed by R3 (37.41 g plant−1) and R1 (40.60 g plant−1); and R2 had the highest SCW (42.81 g plant−1) (Figure 1). The difference in SCW between R2 and R0 was significant (LSD0.05 = 5.01). LW followed the same trend (Figure 2), in that R2 also had a significantly higher LW than R0 (LSD0.05 = 2.10). Although there was no genotype by biochar interaction, the effect of biochar on SCW and LW based on genotypes can be gauged from Supplementary Figures S1 and S2.
Except for LP, R2 had the highest ratios between DS and WW conditions for BN, BW, SCW, and LW (Table 9), which were significantly higher than for R0. R1 and R3 also had higher ratios than R0; however, the differences were not significant except for significantly higher BW at R3 (Table 9). Unexpectedly, the ratio for LP was the highest at R0, significantly higher than the ratios at R1 to R3, while R2 and R3 had the lowest ratio for LP (Table 9).

4. Discussion

In this study, the effects of biochar on cotton yield and yield component traits were compared among four biochar application rates (0, 6.25, 12.5, and 25 t ha−1) using six cotton lines, including one Pima and five Upland cotton cultivars, and lines grown under WW and DS conditions. A combined ANOVA detected significant variations due to genotype, irrigation, genotype × irrigation, and irrigation × biochar, indicating that the effects of genotype and biochar depended on irrigation treatments. Therefore, the effects of DS, biochar, and cotton genotype required further discussion.

4.1. Effects of DS on Cotton Yield and Yield Components

Drought has become one of the most yield-limiting factors in world cotton production. The effects of soil water deficiency on cotton growth and reproduction have been well documented at the morphological (plant growth traits, yield, and quality), physiological, biochemical, and molecular levels; for a review, see Abdelraheem et al. [5]. Severe drought stress under field conditions can decrease cotton yield by 30–50% [5,43,44]. However, BN in previous reports was usually not determined due to its labor-intensive nature. In this current study, the six cotton genotypes tested consistently showed reduced BN, BW, LP, SCW, and LW under DS conditions at the peak flowering stage, confirming the deleterious effects of drought on cotton yield and yield component traits. Depending on drought tolerance levels, different genotypes indeed had various degrees of trait reductions due to drought. Based on a backcross inbred line population, our previous field study [44] showed that DS at the flowering stage reduced seed cotton yield, lint yield, and BW but increased LP. The increased LP under DS was likely due to a disproportionally greater reduction in seed development than in lint growth due to prolonged DS at the flowering and boll development stages. Although the exact effects of drought on cotton depend on cotton growth stages, total BN will ultimately be reduced by drought [5]. For example, water deficit at the planting and early cotton growth stage could negatively affect seedling emergence and vegetative growth, eventually leading to a decrease in the total number of plants, fruiting branches, and fruiting sites, and ultimately BN at maturity.
In this present study, the observed reduction in cotton yield due to DS was predominantly attributed to the reduction in BN due to greater boll shedding under DS conditions. It is well known that young bolls (<7 days post-anthesis) are highly sensitive to the plant’s physiological status and environmental conditions in that the lack of carbohydrate supply, imbalance of hormones, and environmental stresses such as soil water or nutrient deficiency, heat, shade, insects, and diseases result in greater boll shedding [45]. Therefore, alleviating DS in cotton production through genetic improvement and crop management should prioritize measures to reduce boll shedding and increase boll retention through cotton growth and development during the cotton growing season.

4.2. Irrigation and the Effects of Biochar

In the U.S., to the best of our knowledge, three studies on the effects of biochar on cotton have been reported in the Southeast and Mid-South regions with no positive effects or even negative effects on yield in Georgia [37], Mississippi [38], and Louisiana [39]. It was likely that the cotton plants tested did not encounter severe DS in those field studies. Saba et al. [29] also reported no significant increase in cotton yield during three cropping seasons when biochar was applied to the soil at a rate of <5 t ha−1 in Burkina Faso. Our current field study supports these prior studies, showing that no biochar treatments had a significant positive effect on BN, BW, SCW, and LW under normal WW irrigation conditions. Furthermore, we did not detect any genotype × biochar interaction under WW conditions. Our first-year study (Zhang et al. 2025, unpublished) also did not observe significant differences in seedling establishment and early plant growth (based on fresh and dry weight) when drought stress was not imposed before the peak flowering stage. Therefore, the previous reports and our study have demonstrated little positive effects of biochar under WW conditions using multiple genotypes and do not support the use of biochar in cotton production in areas where drought is not a problem, due likely to the fact that adequate soil moisture through irrigation masked the water-retention benefit provided by biochar.

4.3. Effects of Biochar on Cotton Yield and Yield Component Traits Under DS Conditions

In our study, the effects of biochar were detected under DS conditions, and three application rates of biochar (6.25, 12.5, and 25.0 t ha−1) showed positive effects as compared to the control with no biochar. Our first-year study (Zhang et al. 2025, unpublished) did not detect any significant differences in fiber quality traits (including length, length uniformity, strength, elongation, and micronaire) between the three biochar treatments and the non-biochar control, suggesting that the positive effects of biochar under drought stress conditions were primarily on cotton fiber yield and yield traits. The results in this study and previous reports have demonstrated that biochar application to the soil alleviated drought stress on cotton and improved yield through boll retention, which should be useful for cotton production in semi-arid and arid areas where drought is prevalent, due likely to improved physical and chemical properties of the soil, including improved soil porosity and water-holding capacity [34,46,47].
Our study further showed that only cotton grown in the soil applied with biochar at the rate of 12.5 t ha−1 had significantly higher SCW and LW, and lower reduction in BN, BW, SCW, and LW due to drought, than the control. Previous studies reported that biochar at as low as 2.5 or 4 t ha−1 had positive effects on cotton growth or productivity [19,28]. However, most studies have demonstrated that 10 t ha−1 of biochar is the optimal application rate to exact the highest positive effects on cotton yields [8,9,15,24,27]. Consistent with the results previously reported, our study recommends the application of 10–12.5 t ha−1 of biochar to the soil for the maximum effect under drought conditions. However, the further increase in the usage of biochar to 25.0 t ha −1 did not significantly increase cotton yield in our study. This insignificant effect may be associated with the possibility of pore blockage or nutrient competition caused by high biochar doses [30]. Therefore, coupled with a drought-tolerant cotton cultivar, the use of biochar at 12.5 t ha−1 alleviated yield reduction through saving about 40% yield loss by drought, which can save water through reducing irrigation per hectare.
The positive effects of biochar on cotton productivity in the arid region in the first year of biochar application are highly encouraging to producers in the region, because it would be very difficult to convince them to make such an investment if there were no beneficial effects during the first year of biochar application. However, the cotton producer should decide if additional economic returns would justify the use of biochar due to its price and the associated cost of application. It is noted that biochar has not been utilized in commercial cotton production, and there is a lack of economic analysis of biochar application in cotton worldwide. The long-term multi-year effects of biochar (its persistence or aging) on the soil and cotton growth and reproduction in subsequent years (2025–2026) are being investigated using the established field plots in this study and will be reported after the completion of the multi-year field experiments.

4.4. Genotypic Impact on the Effects of Biochar

In this study, among the six cotton lines tested, Pima cotton DP 359 RF (bred in the arid region of the U.S.) was the most tolerant to drought, with the lowest reduction in BW, BN, SCW, and LW, while DP 2020 B3XF (bred in the Mid-South region) was the most drought sensitive, with the highest reduction. Because no effects from biochar under WW conditions and no genotype × biochar interaction were detected under separate WW and DS conditions, our study showed that the effects of biochar under DS conditions were not dependent on cotton genotypes for the first time. The lack of a genotype × biochar interaction on cotton productivity is likely because biochar mainly acts through soil physics rather than physiological pathways. The results validated the use of one cotton genotype by most of the previously published studies on biochar. Therefore, a researcher may choose one or two cotton genotypes (e.g., one drought-tolerant and one drought-sensitive) to study the effects of biochar under drought conditions.

4.5. Other Issues to Be Addressed

As part of a multi-institutional, multi-disciplinary, and multi-year research project by different teams from crop science (including breeding and molecular biology), soil science and agronomy, agricultural education and economics, and engineering, this current study was by no means intended to address most if not all of issues related to the use of biochar in cotton production in the U.S. In fact, the soil science and agronomy team is focused on a comparative analysis of the soil physical, chemical, and biological characteristics before and after (over several periods during cotton production seasons) biochar was applied. In comparison with baseline soil properties, site-specific responses (if there is a dosage effect) to biochar applications will be evaluated, with results to be reported elsewhere. Due to the limitation of the study conducted in only one location from a single year, multiple field tests are being conducted and used for validation. However, because it represents the typical arid region of cotton production in the U.S. with a minimum rainfall during a growing season (see Section 2), seasonal or climatic variation among years is lower, as compared to other regions with more rains in the Cotton Belt. Furthermore, the consistent results from the use of six cotton genotypes in this study provided statistical assurance that the effects of biochar used in this study were not due to experimental noise or were genotype specific. We also recognize the limitation that the yield data were collected from individual plants not from mechanical harvest of entire plots. This issue will be solved in our subsequent field studies.
It is recognized that the effects of biochar may vary among years and among soils with different textures and fertility management practices in the arid region. However, it is necessary to report positive effects of biochar (if any) from the first year of soil amendment with biochar in a typical arid cotton production area of the U.S. Cotton Belt. Otherwise, without apparent and immediate positive effects on cotton productivity, other analysis of biochar effects on the soil and plants would become moot. Because of the positive effects of biochar on cotton productivity detected in this study, the plant science team of this project will be further evaluating cotton root growth, seedling establishment, plant growth, including biomass and physiological and molecular aspects, and drought tolerance-related characteristics (including photosynthetic rate, stomatal conductance, and leaf water potential).
This study is focused on one of the widely available popular biochar types made from southern yellow pine. It is well known that sources and production methods of biochar differ, which in turn results in diverse types of biochar with different physical and chemical characteristics, causing various effects on the soil and plant. It was not the purpose of this study to comprehensively compare different types of biochar applied to different soil types under different water, nutrient, and crop management conditions. It is further recognized that the use and economic (cost and benefit) analyses of biochar in other crop production systems have been reported, with little data available for cotton in the U.S. It is beyond the scope of the current study to analyze the agronomic and economic feasibility of biochar in large-scale cotton production. However, the importance of such an economic analysis of biochar in cotton production is recognized by the project and will be addressed by the agricultural education and economics team.

5. Conclusions

Cotton is the world’s most important fiber crop and one of the important oil crops. Previous extensive studies have demonstrated the benefits of biochar on cotton growth, physiology, and yield potentials. However, the contradictory results from limited experiments in the Southeast and Mid-South Cotton Belt of the U.S. and the lack of experiments on biochar in the arid and semi-arid West and Southwest regions prompted the current study, to address if drought, genotypes, and biochar rates affected the effects of biochar on cotton. For the first time, the results clearly showed that biochar did not have any positive effects on cotton yield and yield components when cotton was well watered with no drought stress, regardless of cotton genotypes and biochar rates. The results provide a clear explanation of why biochar did not have any positive effects on cotton yield in Georgia, Mississippi, and Louisiana, where drought is often not a production issue. Therefore, biochar is of limited utility in cotton production areas where drought is not prevalent. However, when cotton plants experienced water deficiency during the flowering stage, the application of biochar to the soil before planting alleviated drought stress and reduced yield loss due primarily to lower boll shedding than the control with no biochar in the soil. The application of biochar at an appropriate rate such as 12.5 t ha−1 can be integrated into a water-saving deficit irrigation system, saving 20–30% of water and maximizing water-use efficiency and profit. However, the long-term effects of biochar in arid and semi-arid regions remain to be seen, and the economics of using different biochar rates in cotton production regarding its cost and benefits should also be analyzed, especially in drought-prone regions. Future research work also should include studies such as verifying dosage in multiple regions, synergistic effects of biochar and fertilizer, and biochar combined breeding of drought-tolerant genotypes.

Supplementary Materials

The following supporting information can be downloaded at: https://www.mdpi.com/article/10.3390/agronomy16030346/s1.

Author Contributions

J.Z.: Conceptualization of the study, Experimental design and execution, Data analysis, Writing—original draft and revision. Y.Z.: Statistical analysis, Writing—review and editing. M.A.: Participation. R.G.: Participation, Writing—review and editing. O.J.I.: Participation, Writing—review and editing. S.N.-P.: Participation, Writing—review and editing. E.E.S.: Participation, Writing—review and editing. S.A.: Participation, Writing—review and editing. J.L.: Participation, Writing—review and editing. J.S.T.: Participation, Writing—review and editing. D.P.W.: Participation, Writing—review and editing. All authors have read and agreed to the published version of the manuscript.

Funding

This research project was supported by the National Science Foundation award #2316278.

Institutional Review Board Statement

Not applicable.

Data Availability Statement

Data will be available upon request to Jinfa Zhang.

Acknowledgments

We thank Brendan Glenn for participation in applying biochar in the field and Xiaoping Jin for harvesting cotton boll samples, ginning, and field data collection. We also thank Linghe Zeng, USDA-ARS, for providing seeds of MD 10-5 and reviewing an early version of the manuscript. This research project was supported by the National Science Foundation award #2316278, USDA-ARS Southwestern Cotton Ginning Research Laboratory, USDA-ARS Crop Genetics Research Unit, and New Mexico Agricultural Experiment Station.

Conflicts of Interest

The authors declare no conflicts of interest.

Abbreviations

BN, boll number; BW, boll weight; DS, drought stress; LP, lint percent; LW, lint weight; SCW, seed cotton weight; WW, well-watered.

References

  1. Adeleke, A.A. Technological advancements in cotton agronomy: A review and prospects. Technol. Agron. 2024, 4, e008. [Google Scholar] [CrossRef]
  2. Zhang, J.F.; Zhu, Y.X.; Cole, C. World cotton production, genetic diversity, genetic grain, and genomics. In The Cotton Genome; Zhang, J.F., Kole, C., Zhu, Y.X., Eds.; Springer: Berlin/Heidelberg, Germany, 2025; pp. 1–20. [Google Scholar] [CrossRef]
  3. Decossas, K.M.; Molaison, L.J.; Kleppinger, A.d.B.; Laporte, V.L. Cottonseed oil and meal utilization. J. Am. Oil Chem. Soc. 1968, 45, A52–A54. [Google Scholar] [CrossRef]
  4. O’Brien, R.D.; Wakelyn, P.J. Cottonseed oil: An oil for trans-free options. Food Technol. 2005, 16, 677–679. [Google Scholar]
  5. Abdelraheem, A.; Esmaeili, N.; O’connell, M.; Zhang, J. Progress and perspective on drought and salt stress tolerance in cotton. Ind. Crop. Prod. 2019, 130, 118–129. [Google Scholar] [CrossRef]
  6. US Biochar Initiative (USBI). Available online: https://biochar-us.org/biochar-introduction (accessed on 5 May 2025).
  7. Lehmann, J.; Cowie, A.; Masiello, C.A.; Kammann, C.; Woolf, D.; Amonette, J.E.; Cayuela, M.L.; Camps-Arbestain, M.; Whitman, T. Biochar in climate change mitigation. Nat. Geosci. 2021, 14, 883–892. [Google Scholar] [CrossRef]
  8. Elangovan, R.; Sekaran, N.C. Effect of biochar application on soil properties and quality parameters in cotton. Asian J. Soil Sci. 2014, 9, 1–10. Available online: https://www.cabidigitallibrary.org/doi/pdf/10.5555/20143335033 (accessed on 27 January 2026).
  9. Elangovan, R.; Sekaran, N.C. Effect of biochar application on growth, yield and soil fertility status in cotton. Asian J. Soil Sci. 2014, 9, 41–49. Available online: https://www.cabidigitallibrary.org/doi/pdf/10.5555/20143335040 (accessed on 27 January 2026).
  10. Tian, X.; Li, C.; Zhang, M.; Wan, Y.; Xie, Z.; Chen, B.; Li, W. Biochar derived from corn straw affected availability and distribution of soil nutrients and cotton yield. PLoS ONE 2018, 13, e0189924. [Google Scholar] [CrossRef]
  11. Yu, X.; Tian, X.; Lu, Y.; Liu, Z.; Guo, Y.; Chen, J.; Li, C.; Zhang, M.; Wan, Y. Combined effects of straw-derived biochar and bio-based polymer-coated urea on nitrogen use efficiency and cotton yield. Chem. Speciat. Bioavailab. 2018, 30, 112–122. [Google Scholar] [CrossRef]
  12. Ahmad, S.; Ghaffar, A.; Rahman, M.H.U.; Hussain, I.; Iqbal, R.; Haider, G.; Alam Khan, M.; Ikram, R.M.; Hussnain, H.; Bashir, M.S. Effect of application of biochar, poultry and farmyard manures in combination with synthetic fertilizers on soil fertility and cotton productivity under arid environment. Commun. Soil Sci. Plant Anal. 2021, 52, 2018–2031. [Google Scholar] [CrossRef]
  13. Singh, G.; Mavi, M.S.; Choudhary, O.P.; Gupta, N.; Singh, Y. Rice straw biochar application to soil irrigated with saline water in a cotton-wheat system improves crop performance and soil functionality in north-west India. J. Environ. Manag. 2021, 295, 113277. [Google Scholar] [CrossRef] [PubMed]
  14. Wang, X.; Li, Y.; Wang, H.; Wang, Y.; Biswas, A.; Chau, H.W.; Liang, J.; Zhang, F.; Bai, Y.; Wu, S.; et al. Targeted biochar application alters physical, chemical, hydrological and thermal properties of salt-affected soils under cotton-sugarbeet intercropping. Catena 2022, 216, 106414. [Google Scholar] [CrossRef]
  15. Wang, X.; Li, Y.; Feng, H.; Yu, Q.; Fan, X.; Liu, C.; Chen, J.; Yang, Z.; Biswas, A. Combining biochar with cotton-sugarbeet intercropping increased water-fertilizer productivity and economic benefits under plastic mulched drip irrigation in Xinjiang, China. Ind. Crop. Prod. 2023, 192, 116060. [Google Scholar] [CrossRef]
  16. Pu, S.H.; Wang, Z.Y.; Ma, X.W.; Zhang, Y.; Ding, F.; Xu, W.L.; Yang, J.F. Optimizing biochar strategies to synchronously improve the yield and water productivity of cotton film mulched drip irrigation in arid sandy soil environment. Fresenius Environ. Bull. 2023, 32, 501–513. [Google Scholar]
  17. Shah, S.H.; Hussain, M.B.; Haider, G.; Haq, T.U.; Zahir, Z.A.; Danish, S.; Paray, B.A.; Kammann, C. Acidified manure and nitrogen-enriched biochar showed short-term agronomic benefits on cotton–wheat cropping systems under alkaline arid field conditions. Sci. Rep. 2023, 13, 22504. [Google Scholar] [CrossRef]
  18. Han, Y.; Zhang, J.; Chen, P.; Li, H.; Li, W.; Liu, J.; Zong, R.; Wang, D.; Liang, Y.; Wang, Z. Biochar improves water and nitrogen use efficiency of cotton under mulched drip irrigation in arid regions. Ind. Crop. Prod. 2024, 222, 119830. [Google Scholar] [CrossRef]
  19. Karthik, A.; Duraisamy, V.K.; Prakash, A.H. Influence of different biochars on growth, yield and quality of cotton (Gossypium hirsutum L.). Environ. Ecol. 2019, 37, 797–802. [Google Scholar]
  20. Wu, X.; Wang, D.; Riaz, M.; Zhang, L.; Jiang, C. Investigating the effect of biochar on the potential of increasing cotton yield, potassium efficiency and soil environment. Ecotoxicol. Environ. Saf. 2019, 182, 109451. [Google Scholar] [CrossRef]
  21. Qayyum, M.F.; Haider, G.; Raza, M.A.; Mohamed, A.K.S.; Rizwan, M.; El-Sheikh, M.A.; Alyemeni, M.N.; Ali, S. Straw-based biochar mediated potassium availability and increased growth and yield of cotton (Gossypium hirsutum L.). J. Saudi Chem. Soc. 2020, 24, 963–973. [Google Scholar] [CrossRef]
  22. Qi, H.; Wang, Z.; Lin, H.; Song, L.; Chen, P.; Chen, R.; Tang, Y. Effects of biochar application before and after freeze-thaw on soil hydrothermal and cotton growth under drip irrigation. Water 2022, 14, 3818. [Google Scholar] [CrossRef]
  23. Sun, J.; Yang, R.; Li, Y.; Geng, Y.; Pan, Y.; Zhang, Z. Fading positive effect of biochar on cotton yield in a coastal saline soil during a 2-year field trial. J. Soil Sci. Plant Nutr. 2022, 23, 991–1002. [Google Scholar] [CrossRef]
  24. Li, Y.; Yao, N.; Liang, J.; Wang, X.; Niu, B.; Jia, Y.; Jiang, F.; Yu, Q.; Liu, D.L.; Feng, H.; et al. Rational biochar application rate for cotton nutrient content, growth, yields, productivity, and economic benefits under film-mulched trickle irrigation. Agric. Water Manag. 2023, 276, 108079. [Google Scholar] [CrossRef]
  25. Hao, H.B.; Li, T.; Liu, K. Effects of nitrogen reduction with biochar application on soil organic nitrogen and cotton yield in drip-irrigated cotton fields. Agric. Res. Arid Areas 2024, 2024, 112–120, (In Chinese with an English abstract). [Google Scholar]
  26. Jin, W.; Liu, Z.; Wang, Q.; Cheng, Z.; Zhang, Y.; Cao, N.; Hu, W.; Zhou, Z.; Meng, Y.; Zhao, W. Straw-derived biochar incorporation improves seedcotton yield and fiber quality by optimizing photosynthetic carbon and nutrients partitioning and boll formation patterns. Ind. Crop. Prod. 2024, 214, 118617. [Google Scholar] [CrossRef]
  27. Wang, S.; Wang, C.; Xie, L.; Li, Y.; Siddique, K.H.; Qi, X.; Luo, H.; Yang, G.; Hou, Z.; Wang, X.; et al. Optimizing biochar application for enhanced cotton and sugar beet production in Xinjiang: A comprehensive study. J. Sci. Food Agric. 2024, 104, 6626–6639. [Google Scholar] [CrossRef]
  28. Cissé, D.; Cornelis, J.; Traoré, M.; Saba, F.; Coulibaly, K.; Lefebvre, D.; Colinet, G.; Nacro, H.B. Co-composted biochar to decrease fertilization rates in cotton–maize rotation in Burkina Faso. Agron. J. 2021, 113, 5516–5526. [Google Scholar] [CrossRef]
  29. Saba, F.; Cornelis, J.; Sawadogo, H.; Lefebvre, D.; Bacia, R.K.I.; Cisse, D.; Bandaogo, A.A.; Mamadou, T.; Nacro, H. Nutrient-charged biochars increased nutrient-use efficiency in a cotton–maize rotation in Burkina Faso. Agron. J. 2023, 115, 958–975. [Google Scholar] [CrossRef]
  30. Hou, J.; Liu, X.; Zhang, J.; Wei, Z.; Ma, Y.; Wan, H.; Liu, J.; Cui, B.; Zong, Y.; Chen, Y.; et al. Combined application of biochar and partial root-zone drying irrigation improves water relations and water use efficiency of cotton plants under salt stress. Agric. Water Manag. 2023, 290, 108584. [Google Scholar] [CrossRef]
  31. Hou, J.; Wan, H.; Liang, K.; Cui, B.; Ma, Y.; Chen, Y.; Liu, J.; Wang, Y.; Liu, X.; Zhang, J.; et al. Biochar amendment combined with partial root-zone drying irrigation alleviates salinity stress and improves root morphology and water use efficiency in cotton plant. Sci. Total. Environ. 2023, 904, 166978. [Google Scholar] [CrossRef]
  32. Hou, J.; Zhang, J.; Liu, X.; Ma, Y.; Wei, Z.; Wan, H.; Liu, F. Effect of biochar addition and reduced irrigation regimes on growth, physiology and water use efficiency of cotton plants under salt stress. Ind. Crops Prod. 2023, 198, 116702. [Google Scholar] [CrossRef]
  33. Qian, L.; Huang, S.; Song, Z.; Fahad, S.; Dawar, K.; Danish, S.; Saif, H.; Shahzad, K.; Ansari, M.J.; Salmen, S.H. Effect of carboxymethyl cellulose and gibberellic acid-enriched biochar on osmotic stress tolerance in cotton. BMC Plant Biol. 2024, 24, 137. [Google Scholar] [CrossRef]
  34. Wang, Y.T.; Tian, G.L.; Tian, Y.Y.; Zhao, Q.Q.; Zhen, B.; Li, H.Z.; Zhou, X.G. Optimizing biochar amendment to improve soil property and cotton seedling growth in saline soils. J. Irrig. Drain. 2024, 42, 72–79, (In Chinese with an English abstract). [Google Scholar]
  35. Wang, Z.Y.; Ma, X.W.; Li, W. Effects of acidified biochar amendment on water and salt movement in saline-alkali soil in drip-irrigated cotton field. J. Irrig. Drain. 2024, 43, 33–38, (In Chinese with an English abstract). [Google Scholar]
  36. Yang, L.; Tang, G.; Xu, W.; Zhang, Y.; Ning, S.; Yu, P.; Zhu, J.; Wu, Q.; Yu, P. Effect of combined application of wood vinegar solution and biochar on saline soil properties and cotton stress tolerance. Plants 2024, 13, 2427. [Google Scholar] [CrossRef] [PubMed]
  37. Lamb, M.C.; Sorensen, R.B.; Butts, C.L. Crop response to biochar under differing irrigation levels in the southeastern USA. J. Crop. Improv. 2018, 32, 305–317. [Google Scholar] [CrossRef]
  38. Pinnamaneni, S.R.; Lima, I.; Boone, S.A.; Anapalli, S.S.; Reddy, K.N. Effect of continuous sugarcane bagasse-derived biochar application on rainfed cotton (Gossypium hirsutum L.) growth, yield and lint quality in the humid Mississippi delta. Sci. Rep. 2023, 13, 10941. [Google Scholar] [CrossRef]
  39. Bohara, H.; Dodla, S.; Wang, J.J.; Darapuneni, M.; Kongchum, M.; Fromme, D.D.; Harrell, D. Impacts of N-stabilizers and biochar on nitrogen losses, nitrogen phytoavailability, and cotton yield in poultry litter-fertilized soils. Agron. J. 2018, 110, 2016–2024. [Google Scholar] [CrossRef]
  40. Zeng, L.; Manning, R.O.; Meredith, W.R. Registration of cotton germplasm line, MD 10-5. J. Plant Regist. 2016, 10, 47–50. [Google Scholar] [CrossRef]
  41. Zhang, J.; Flynn, R.; Hughs, S.E.; Bajaj, S.; Waddell, C.; Jones, D.C. Registration of ‘Acala 1517–08’ Cotton. J. Plant Regist. 2011, 5, 156–163. [Google Scholar] [CrossRef]
  42. Kumar, R.; Lamba, J.; Adhikari, S.; Kasera, N.; Torbert, H.A. Influence of iron-modified biochar on phosphate transport and deposition in saturated porous media under varying pH, ionic strength, and biochar dosage. Chemosphere 2025, 370, 143932. [Google Scholar] [CrossRef]
  43. Levi, A.; Paterson, A.H.; Barak, V.; Yakir, D.; Wang, B.; Chee, P.W.; Saranga, Y. Field evaluation of cotton near-isogenic lines introgressed with QTLs for productivity and drought related traits. Mol. Breed. 2009, 23, 179–195. [Google Scholar] [CrossRef]
  44. Abdelraheem, A.; Adams, N.; Zhang, J. Effects of drought on agronomic and fiber quality in an introgressed backcross inbred line population of Upland cotton under field conditions. Field Crop. Res. 2020, 254, 107850. [Google Scholar] [CrossRef]
  45. Hake, K.; Guinn, G.; Oosterhuis, D. Environmental Causes of Shed. National Cotton Council, 1989; Physiology Today. 4 Pages. Available online: https://www.cotton.org/tech/physiology/cpt/plantphysiology/upload/CPT-Dec89-REPOP.pdf (accessed on 5 May 2025).
  46. Guan, R.; Li, Y.; Jia, Y.; Jiang, F.; Li, L. Acidified biochar one-off application for saline-alkali soil improvement: A three-year field trial evaluating the persistence of effects. Ind. Crop. Prod. 2024, 222, 119972. [Google Scholar] [CrossRef]
  47. Qi, X.; Yang, G.; Li, Y.; Hou, Z.; Shi, P.; Wang, S.; Wang, X.; Liang, J.; Sun, B.; Siddique, K.H.; et al. Optimizing biochar application rates for improved soil chemical environments in cotton and sugarbeet fields under trickle irrigation with plastic mulch. Soil Tillage Res. 2024, 235, 105893. [Google Scholar] [CrossRef]
Figure 1. Biochar effect on seed cotton weight (SCW) under drought conditions for different biochar application rates, i.e., R0, R1, R2, and R3 with 0, 6.25, 12.5, and 25.0 t ha−1 of the biochar, respectively.
Agronomy 16 00346 g001
Figure 2. Biochar effect on lint weight (LW) under drought conditions for different biochar application rates, i.e., R0, R1, R2, and R3 with 0, 6.25, 12.5, and 25.0 t ha−1 of the biochar, respectively.
Agronomy 16 00346 g002
Table 1. Mean squares from a combined analysis of variance (ANOVA) of six cotton genotypes tested in four biochar treatments under well-watered and drought conditions.
Source of Variationd.f.Bolls
(No. Plant−1)
BW
(g Boll−1)
Lint (%)SCW
(g Plant−1)
LW
(g Plant−1)
Replication320.610.033.57574.8189.55
Genotype585.65 ***9.99 ***72.12 ***358.60 **104.06 ***
Biochar35.810.051.6999.0411.89
Irrigation11392.13 ***3.76 ***154.71 ***40,326.40 ***9144.00 ***
Genotype × Biochar155.420.030.91111.3122.81
Genotype × Irrigation510.890.096.50 **242.67 *54.90 *
Irrigation × Biochar310.600.1614.68 ***341.75 *33.42
Genotype × Irrigation × Biochar153.020.040.9363.3012.55
Error1417.140.271.84103.8718.81
* p < 0.05; ** p < 0.01; *** p < 0.001. d.f.—degrees of freedom. BW—boll weight; SCW—seed cotton weight; and LW—lint weight.
Table 2. Mean square from an analysis of variance (ANOVA) of six cotton genotypes tested in four biochar treatments under well-watered conditions.
Source of Variationd.f.Bolls
(No. Plant−1)
BW
(g Boll−1)
Lint (%)SCW
(g Plant−1)
LW
(g Plant−1)
Replication332.150.045.361030.31154.64
Genotype541.91 ***5.35 ***31.48 ***487.33 ***146.40 ***
Biochar34.190.2012.67 ***223.6211.70
Genotype × Biochar156.080.040.95145.3129.91
Error696.200.301.44115.8522.29
*** p < 0.001. d.f.—degrees of freedom. BW—boll weight; SCW—seed cotton weight; and LW—lint weight.
Table 3. Mean square from an analysis of variance (ANOVA) of six cotton genotypes tested in four biochar treatments under drought conditions.
Source of Variationd.f.Bolls
(No. Plant−1)
BW
(g Boll−1)
Lint (%)SCW
(g Plant−1)
LW
(g Plant−1)
Replication32.660.092.4916.101.66
Genotype554.63 ***4.73 ***47.14 ***113.9412.56
Biochar312.220.023.70217.17 *33.60 #
Genotype × Biochar152.350.030.8829.315.44
Error697.770.262.1475.9013.24
# p < 0.10; * p < 0.05; *** p < 0.001. d.f.—degrees of freedom. BW—boll weight; SCW—seed cotton weight; and LW—lint weight.
Table 4. Mean square from an analysis of variance (ANOVA) of trait ratios between drought and well-water conditions for six cotton genotypes tested in four biochar treatments.
Source of Variationd.f.Bolls
(%)
BW
(%)
Lint (%)SCW
(%)
LW
(%)
Replication30.030.0110.0040.0400.021
Genotype50.09 *0.009 #0.007 ***0.058 #0.047
Biochar30.08 *0.012 *0.014 ***0.095 *0.052 #
Genotype × Biochar150.010.0030.0010.0120.011
Error950.030.0040.0010.0290.025
# p < 0.10; * p < 0.05; *** p < 0.001. d.f.—degrees of freedom. BW—boll weight; SCW—seed cotton weight; and LW—lint weight.
Table 5. Overall means of six cotton genotypes tested in four biochar treatments under well-watered and drought conditions.
LineBolls
(No. Plant−1)
BW
(g Boll−1)
Lint (%)SCW
(g Plant−1)
LW
(g Plant−1)
Acala 1517-0810.49 a5.39 e44.43 c57.11 c25.51 c
DP 2020 B3XF12.29 b4.63 bc44.57 c57.25 c25.55 c
MD 10-512.47 b4.58 b42.86 b55.65 bc24.45 bc
NM 21FA-110.09 a4.84 c44.89 c49.40 a22.29 a
NM 21FA-210.25 a5.00 d44.51 c51.66 ab23.02 ab
Pima DP 359 RF14.21 c3.72 a41.02 a51.40 ab21.15 a
LSD (0.05)1.320.260.675.042.14
Means followed by different letters within a column indicate significant differences. BW—boll weight; SCW—seed cotton weight; and LW—lint weight.
Table 6. Means of six cotton genotypes tested in four biochar treatments under well-watered conditions.
LineBolls
(No. Plant−1)
BW
(g Boll−1)
Lint (%)SCW
(g Plant−1)
LW
(g Plant−1)
Acala 1517-0813.01 a5.61 d45.27 b73.03 bc33.06 c
DP 2020 B3XF15.94 b4.72 bc45.03 b75.20 c33.78 c
MD 10-515.35 b4.65 bc44.44 b70.15 bc31.99 bc
NM 21FA-112.64 a5.01 bc46.08 c63.52 ab29.19 b
NM 21FA-212.96 a5.13 c44.89 b66.52 ab29.76 b
Pima DP 359 RF16.06 b3.88 a41.97 a61.02 a25.60 a
LSD (0.05)1.770.380.857.593.33
Means followed by different letters within a column indicate significant differences. BW—boll weight; SCW—seed cotton weight; and LW—lint weight.
Table 7. Means of six cotton genotypes tested in four biochar treatments under drought conditions.
LineBolls
(No. Plant−1)
BW
(g Boll−1)
Lint (%)SCW
(g Plant−1)
LW
(g Plant−1)
Acala 1517-087.96 ab5.17 d43.60 c41.2017.97
DP 2020 B3XF8.65 ab4.54 bc44.11 c39.3117.33
MD 10-59.59 b4.50 b41.27 b41.1616.91
NM 21FA-17.55 a4.67 bc43.71 c35.2815.39
NM 21FA-27.54 a4.87 cd44.13 c36.8016.27
Pima DP 359 RF12.36 c3.57 a40.07 a41.7816.69
LSD (0.05)1.970.361.03nsns
Means followed by different letters within a column indicate significant differences. BW—boll weight; SCW—seed cotton weight; and LW—lint weight. ns—not significant.
Table 8. Ratios between drought and well-watered conditions of six cotton genotypes tested in four biochar treatments.
LineBolls
(%)
BW
(%)
Lint (%)SCW
(%)
LW
(%)
Acala 1517-0862.76 a92.28 ab96.35 bc57.95 a55.80 a
DP 2020 B3XF55.00 a96.25 ab98.03 c52.93 a51.67 a
MD 10-563.13 a97.66 b92.97 a62.34 ab55.58 a
NM21FA-160.22 a93.34 ab95.00 ab56.17 a53.06 a
NM21FA-260.36 a95.38 ab98.39 c57.96 a56.79 ab
Pima DP 359 RF77.39 b91.80 a95.53 b70.18 b67.04 b
LSD (0.05)12.604.502.5012.0011.10
Means followed by different letters within a column indicate significant differences. BW—boll weight; SCW—seed cotton weight; and LW—lint weight.
Table 9. Biochar effects on drought tolerance based on ratios between drought and well-watered conditions.
Biochar TreatmentBolls
(%)
BW
(%)
Lint (%)SCW
(%)
LW
(%)
R056.02 a91.90 a99.12 c51.58 a50.98 a
R165.12 ab93.69 ab96.83 b60.53 ab58.42 ab
R269.35 b96.75 b94.27 a66.93 b61.92 b
R362.08 ab95.67 b93.96 a59.32 ab55.29 ab
LSD (0.05)10.313.642.049.819.06
R0—no biochar; R1—6.25 t ha−1; R2—12.5 t ha−1; and R3—25 t ha−1. Means followed by different letters within a column indicate significant differences. BW—boll weight; SCW—seed cotton weight; and LW—lint weight.
Disclaimer/Publisher’s Note: The statements, opinions and data contained in all publications are solely those of the individual author(s) and contributor(s) and not of MDPI and/or the editor(s). MDPI and/or the editor(s) disclaim responsibility for any injury to people or property resulting from any ideas, methods, instructions or products referred to in the content.