Synchronous Spray Effect Based on Dual Plant-Protection UAV Collaboration in Corn Fields
 , ,
, ,
Abstract
1. Introduction
2. Materials and Methods
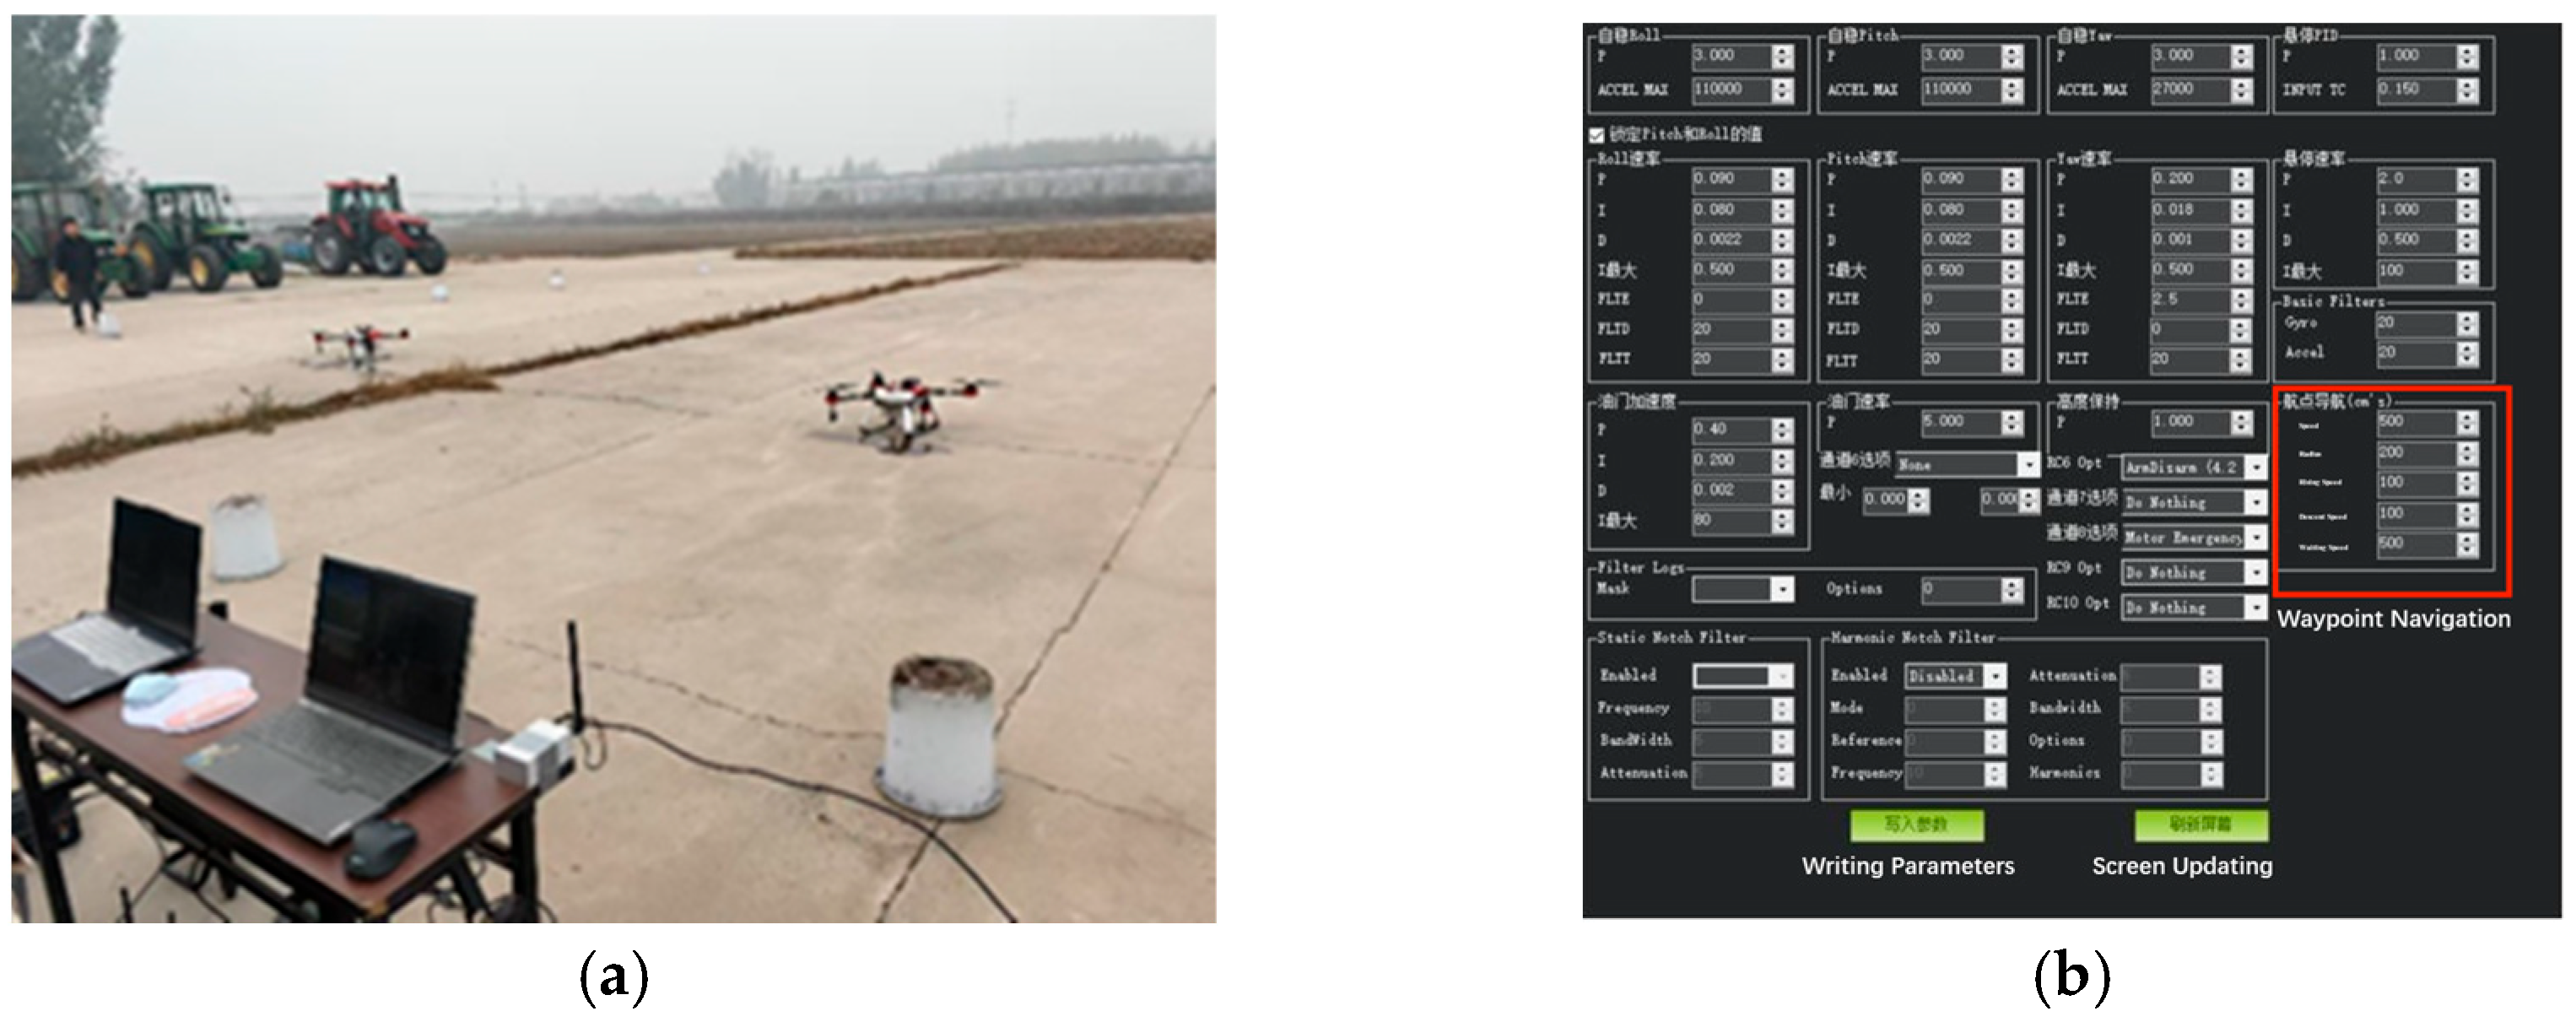
2.1. Hardware
2.2. Experiments and Data Processing
2.2.1. Experiment Design
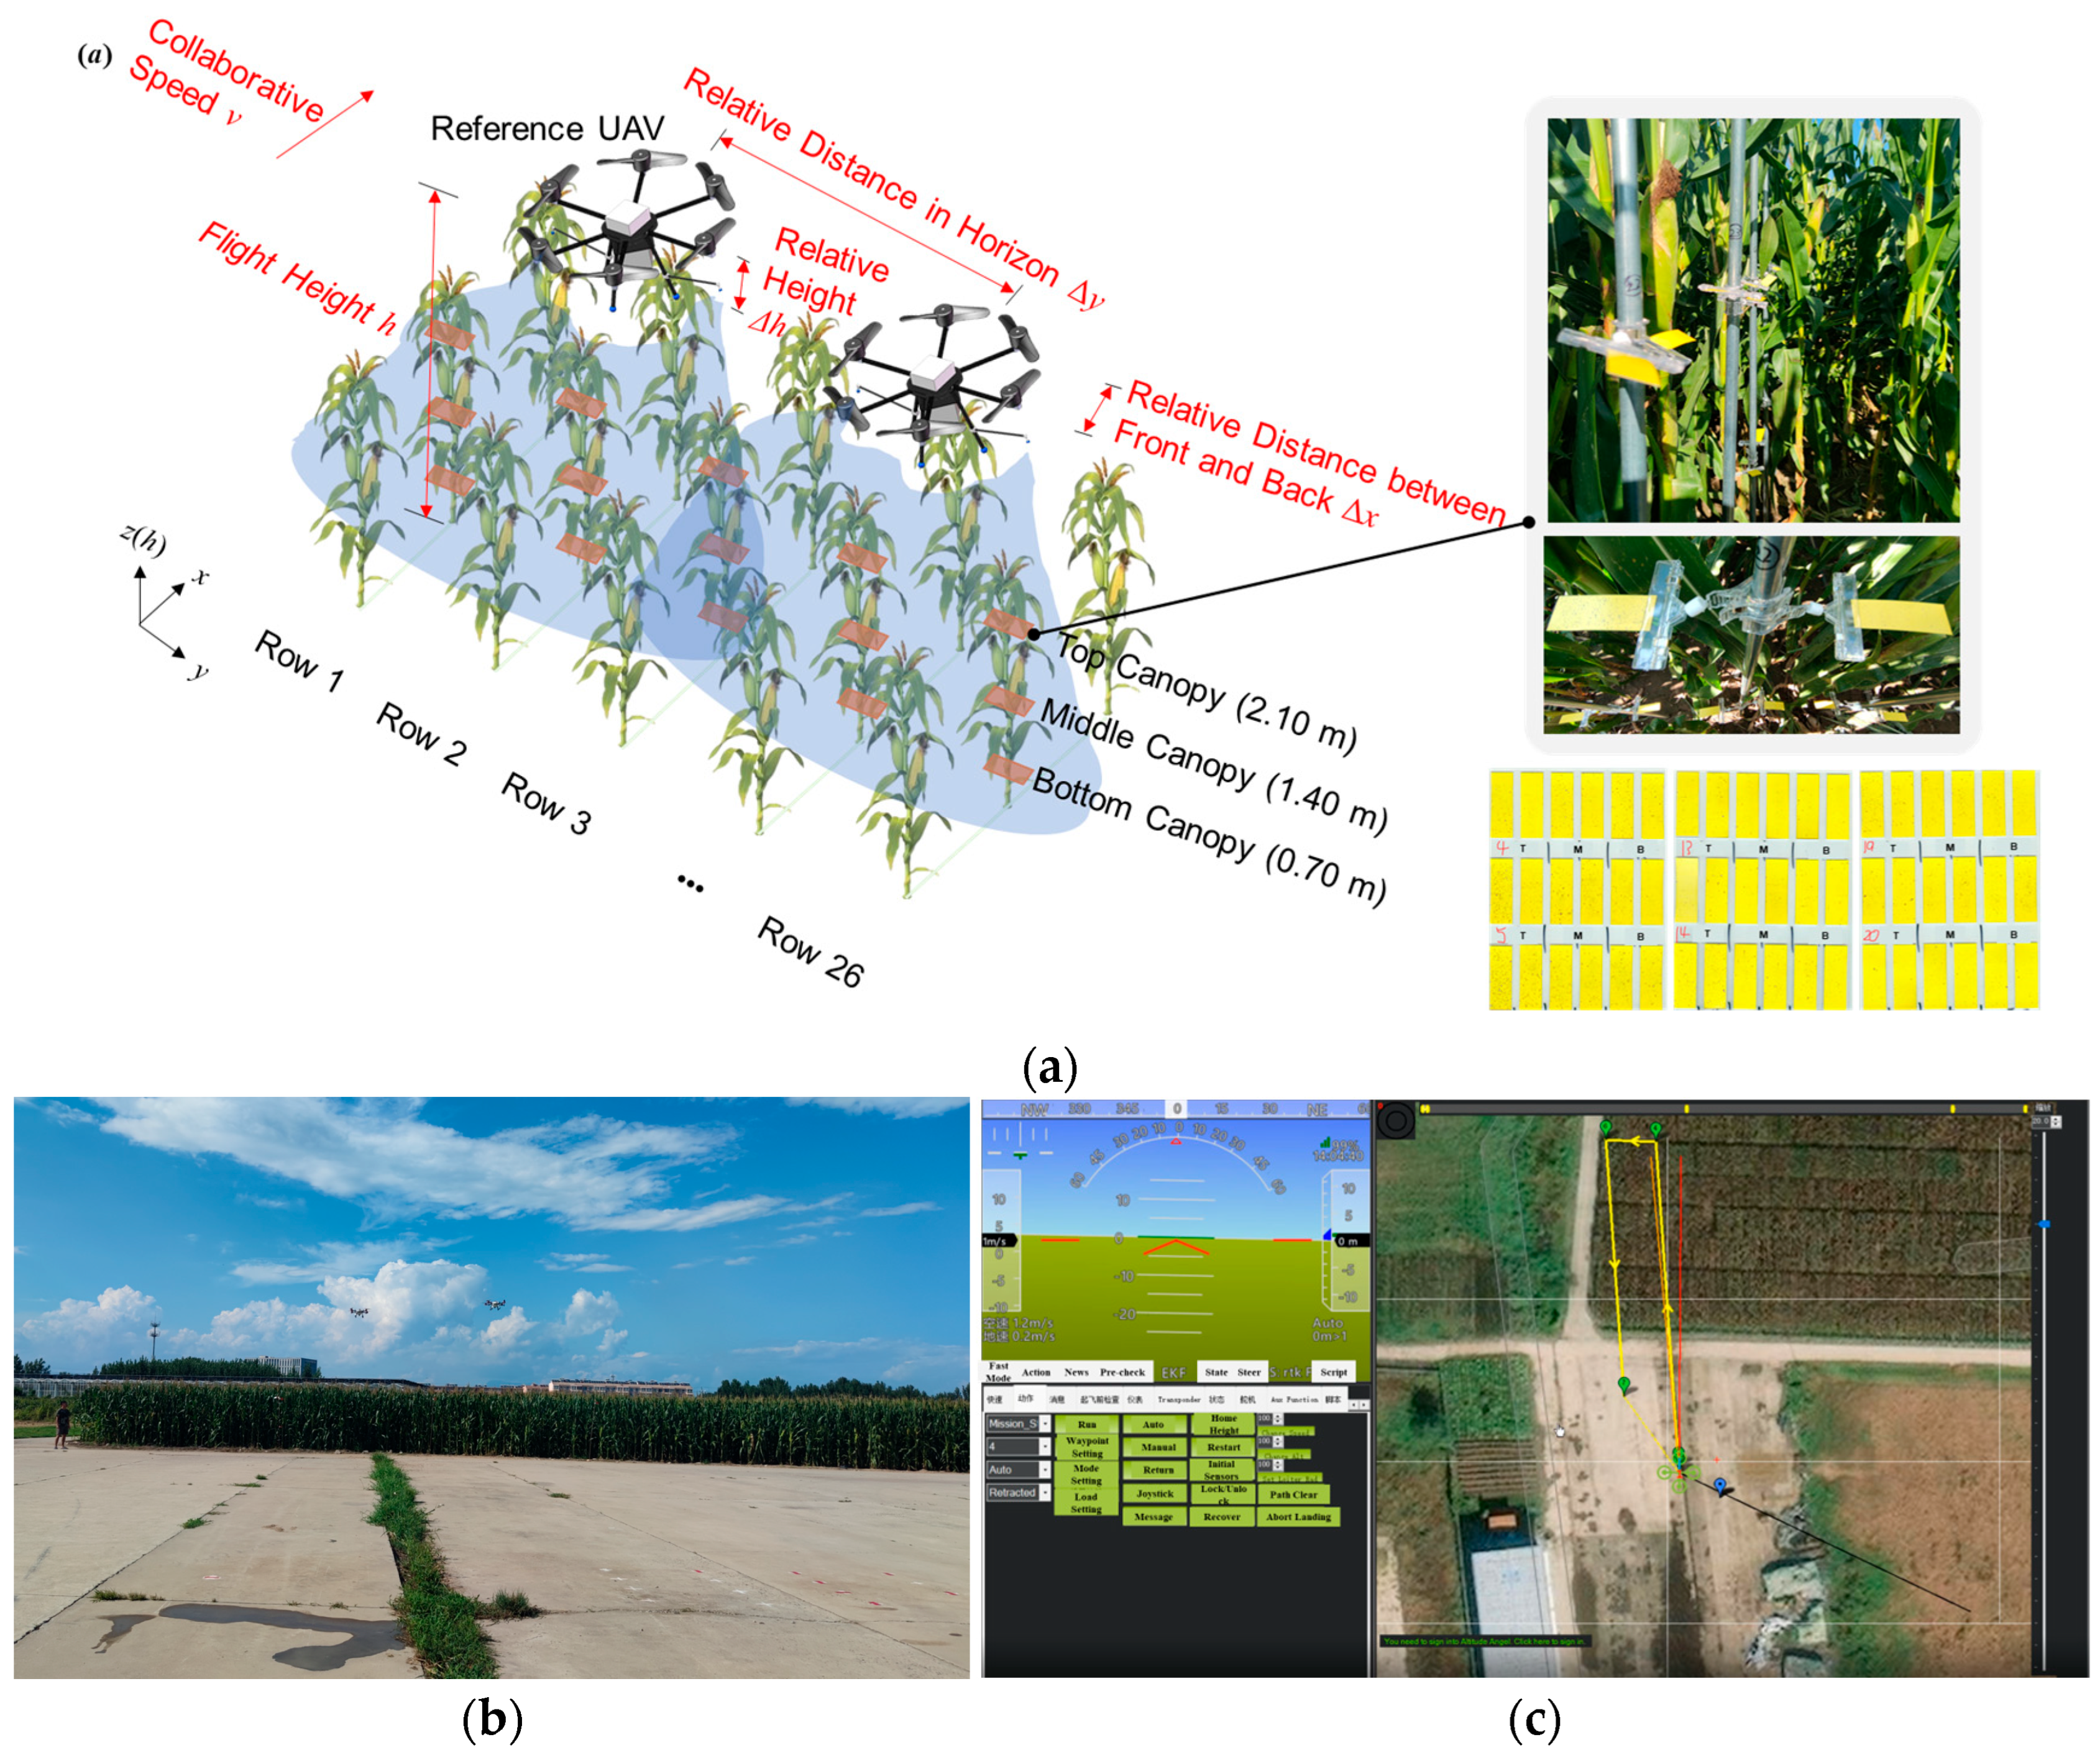
- the collaborative speed (v) under 3.5 m/s, 4 m/s, 4.5 m/s and 5 m/s;
- the flight height of the reference UAV (h) under 5 m, 5.5 m, 6.0 m and 6.5 m;
- the relative height of the two UAVs (Δh) under −0.5 m, 0 m, 0.5 m and 1 m;
- the relative distance between front and back (Δx) under −0.5 m, 0 m, 0.5 m and 1 m;
- the relative distance between the UAVs in horizon (Δy) under 4.0 m, 5.0 m, 6.0 m and 7.0 m.
- v under 3.5 m/s, h under 5.5 m, Δh under 0 m and Δy under 5 m;
- v under 4 m/s, h under 5 m, Δh under 1 m and Δy under 6 m;
- v under 4.5 m/s, h under 6.5 m, Δh under 0.5 m and Δy under 4 m;
- v under 5 m/s, h under 5.5 m, Δh under −0.5 m and Δy under 7 m.
2.2.2. Responses
- the layered droplet deposition number in average ():
- the droplet deposition number of the entire plant in average ():
- the layered coverage rate in average ():
- the droplet deposition number of the entire plant in average ():
- and the coefficient of variation in the entire plant (CV):
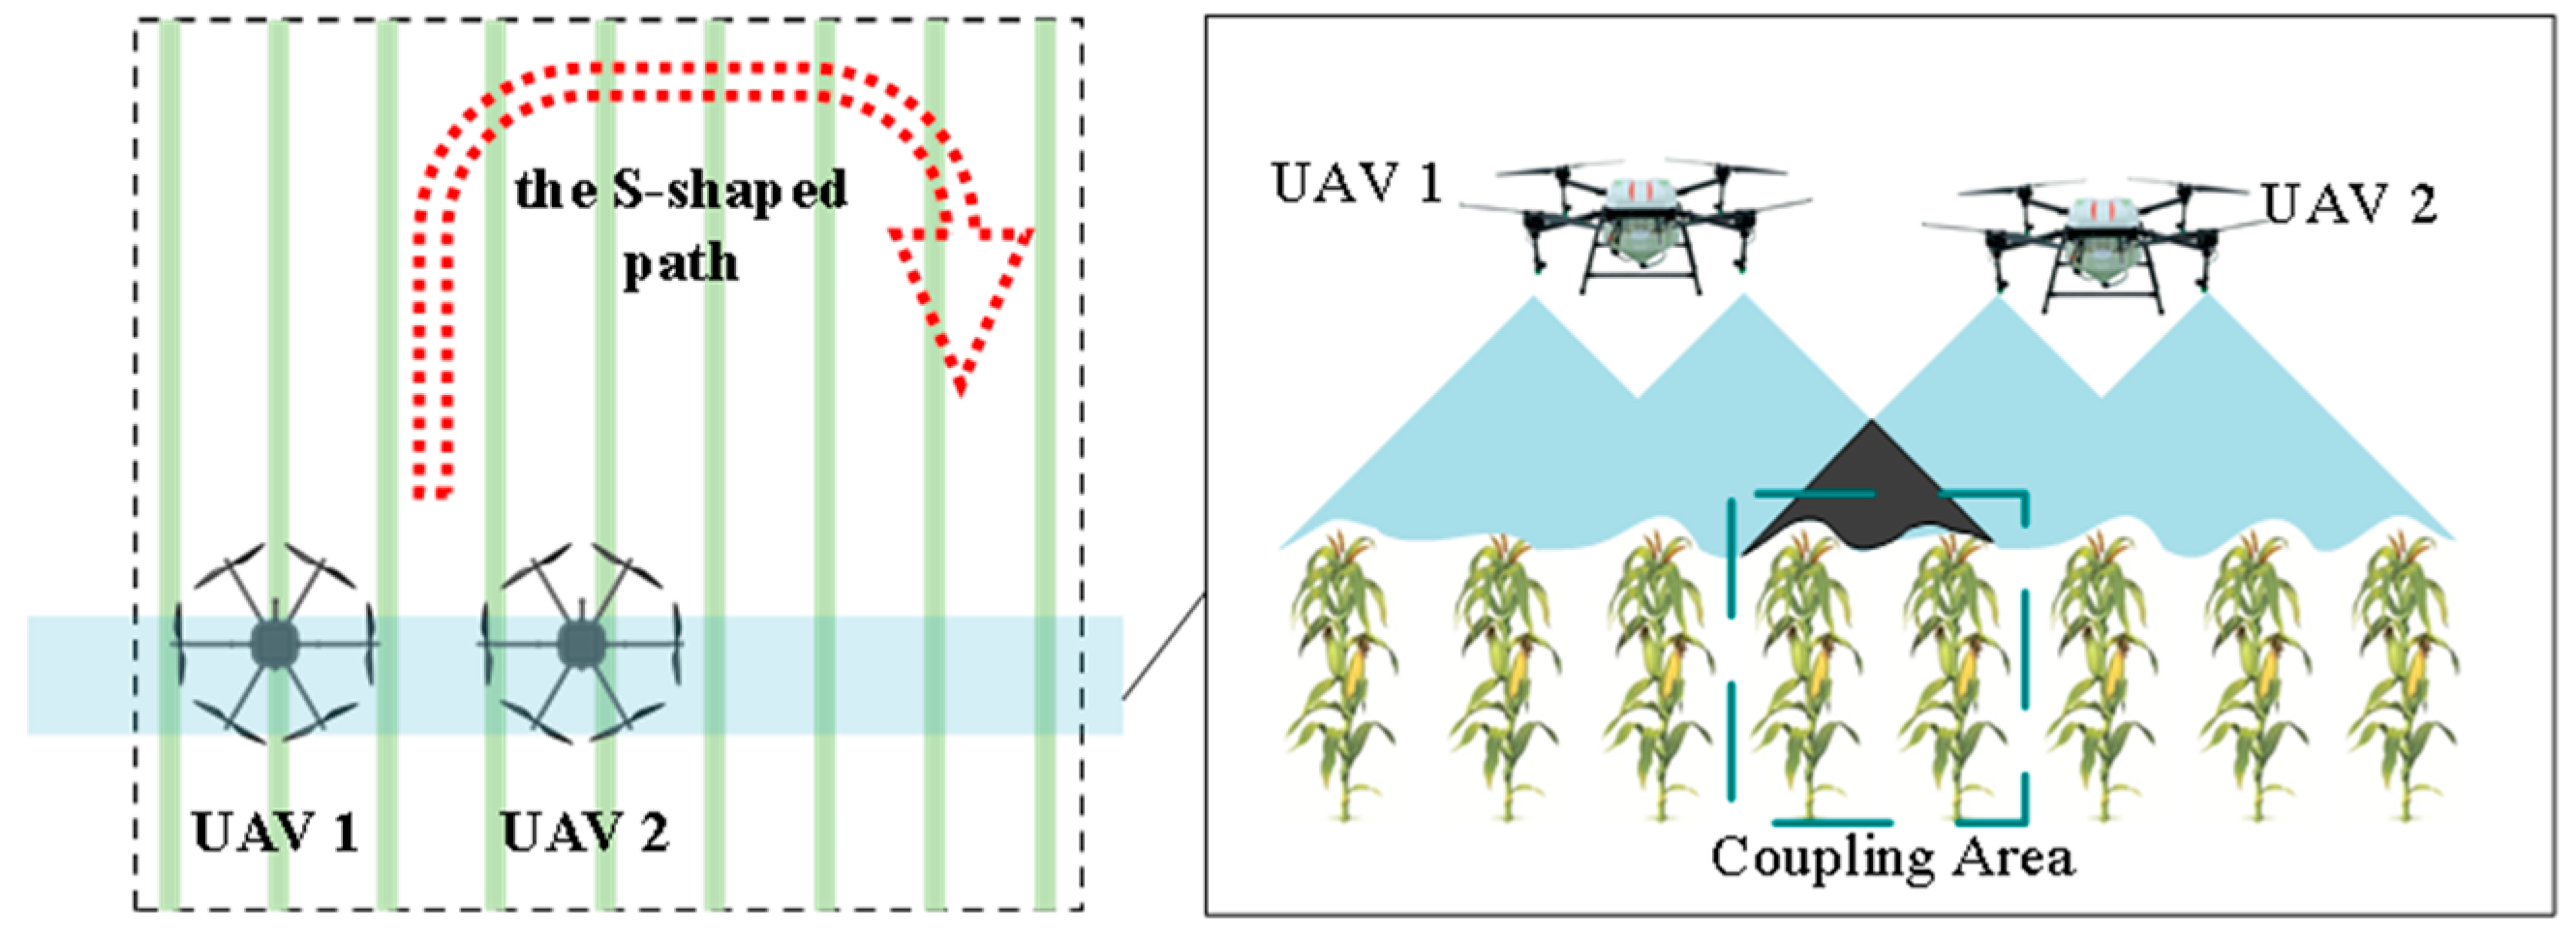
2.2.3. Definition of Wind Coupling Area
2.3. Main Effect Analysis and Trend Modelling of Synchronous Spray
2.3.1. Data Distribution Trend and Main Effect Analysis
- (1)
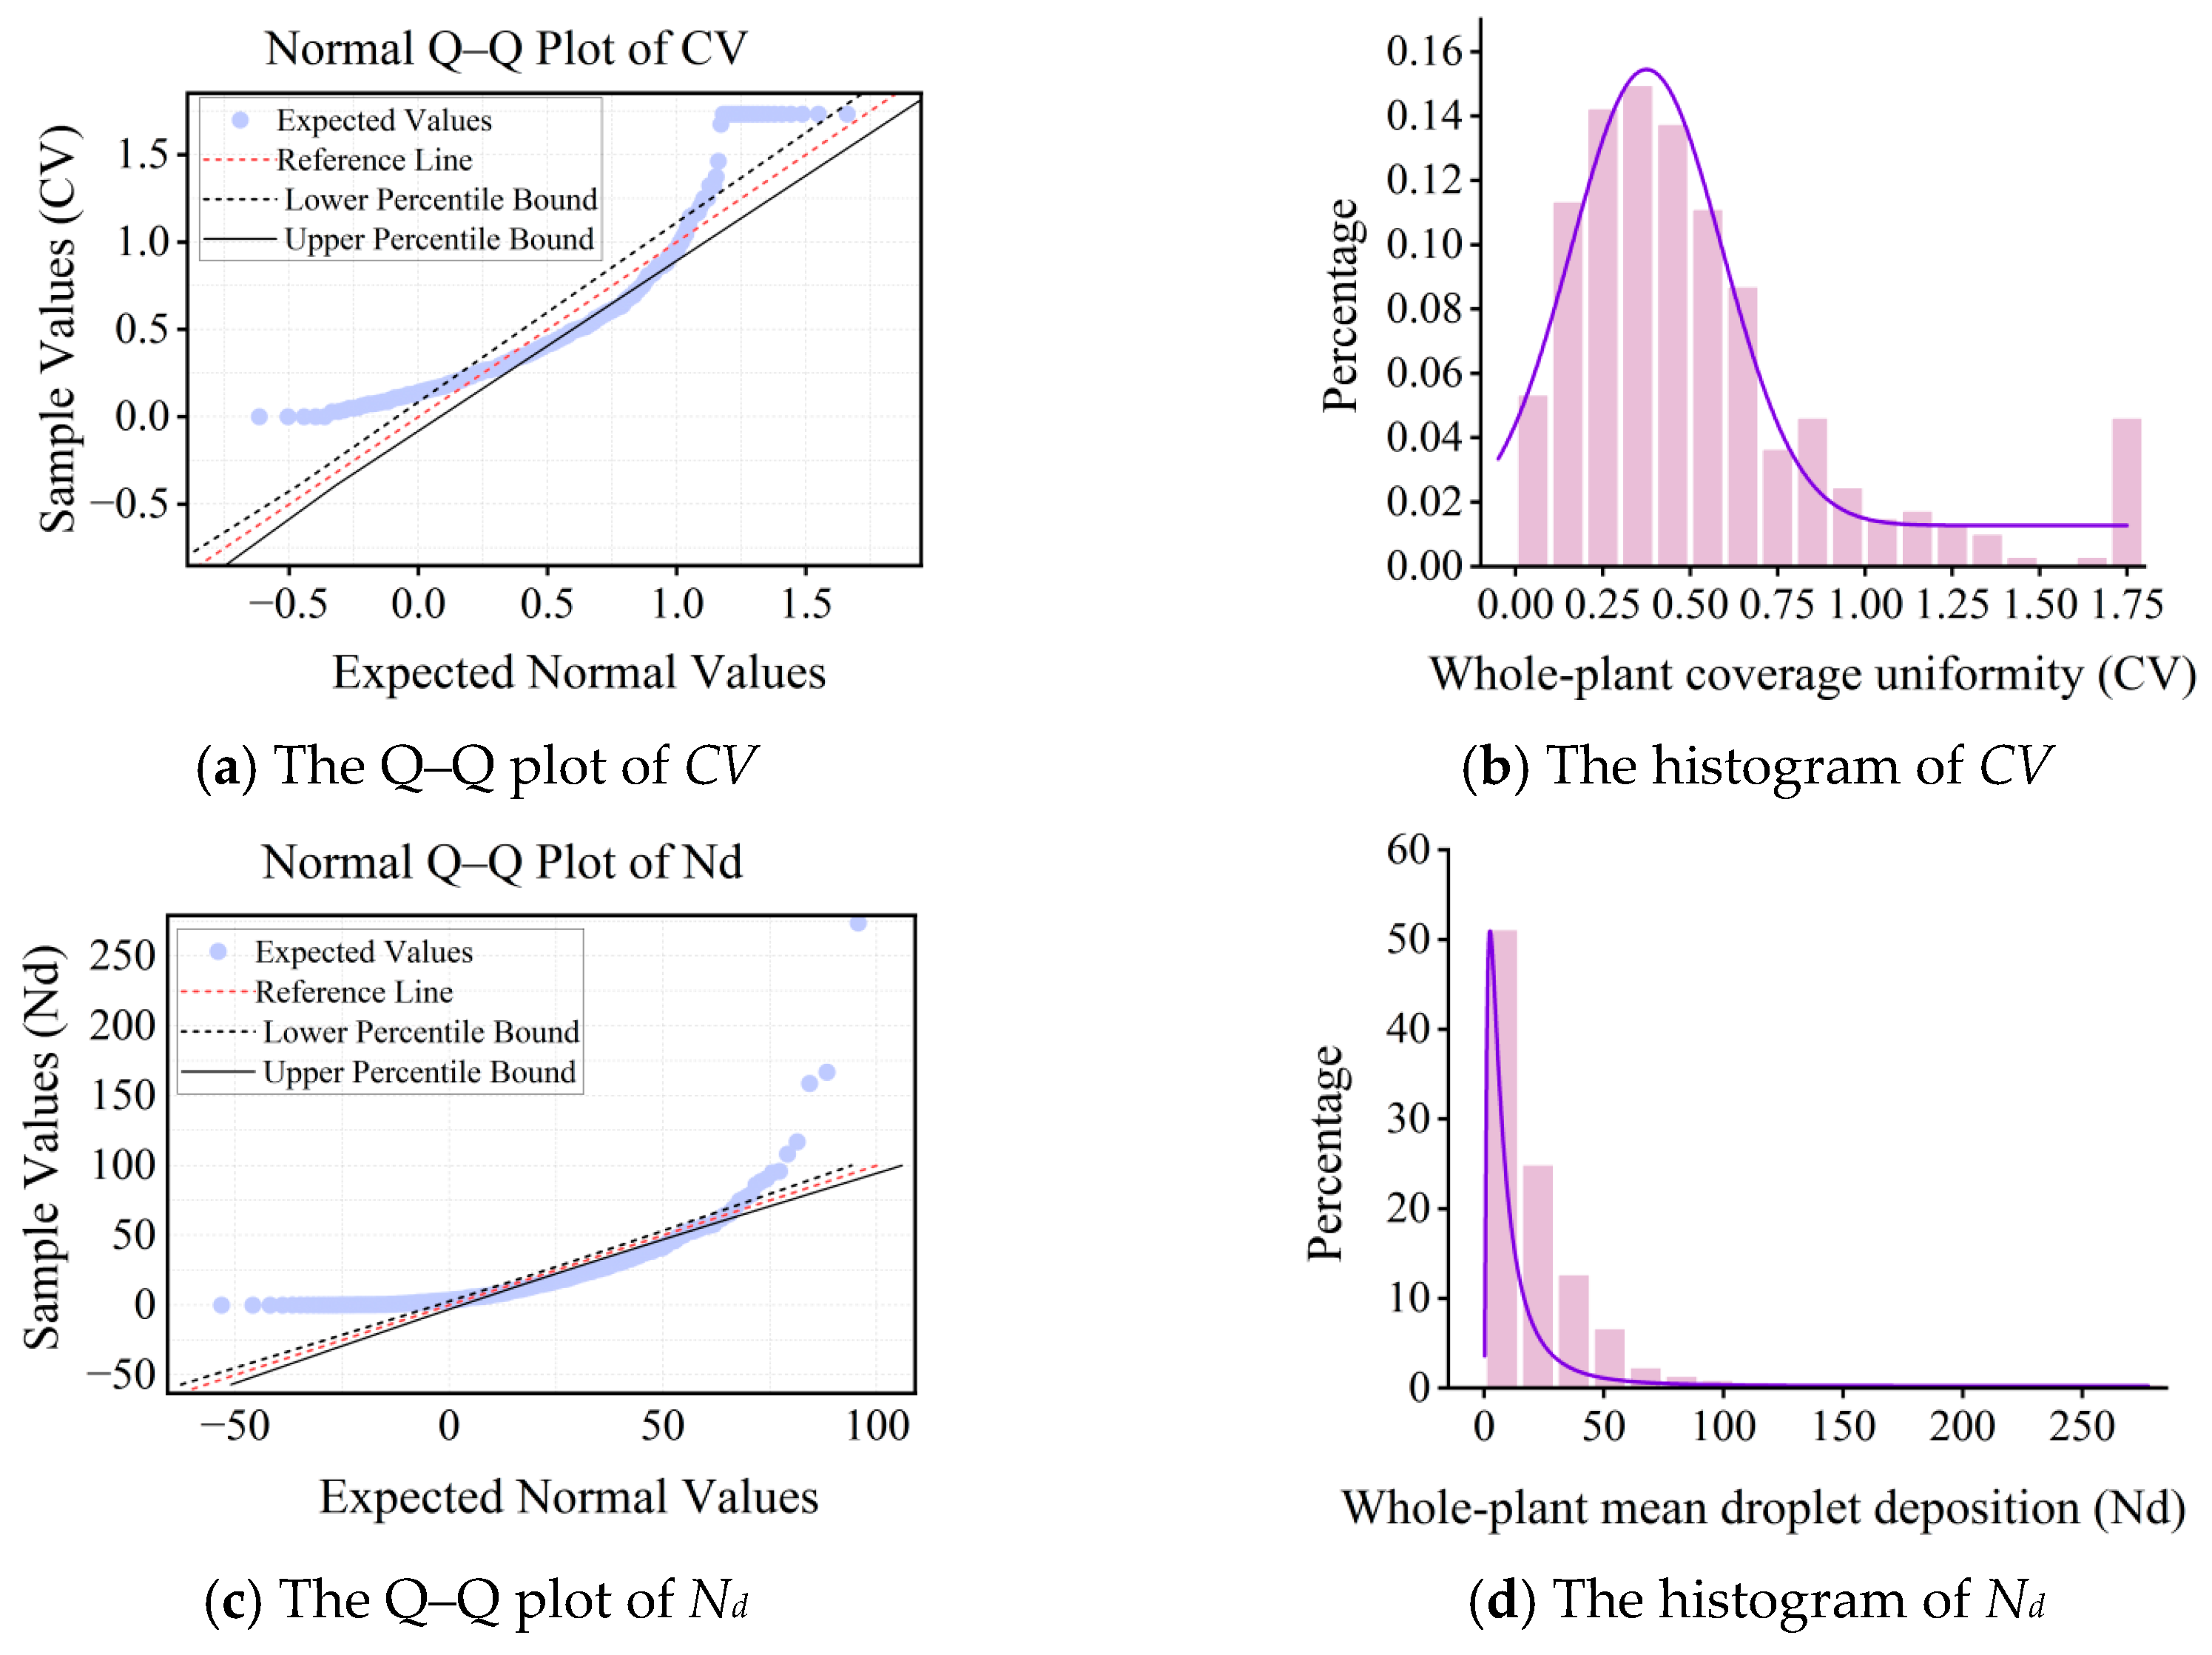
- Diagnostic and Statistical Methods for Data Distribution
- (2)
- Main Effect Analysis and Significance Testing
2.3.2. Trend Modelling and Operation Parameter Optimisation of Synchronous Spray
2.4. Joint Evaluation Indicators: Quadrant Division and High-Quality Spray Rate
- Quadrant A: high deposition with high uniformity (), which means high-quality spray;
- Quadrant B: low deposition with high uniformity (), which means droplet uniformity was qualified, but deposition was not sufficient;
- Quadrant C: high deposition with low uniformity (), which means spray deposition was qualified, but uniformity was not sufficient;
- Quadrant D: low deposition with low uniformity (), which means a high-risk operation due to non-ideal deposition and uniformity.
2.5. Analysis of Synchronous Effect
2.5.1. Effect Difference Between Synchronous and Asynchronous Spray
- (1)
- Analysis of the Entire Spray Area
- (2)
- Analysis of the Coupling Spray Area
2.5.2. Effect Differences Between Ideal Linear Superposition Spray and Synchronous and Asynchronous Spray
- (1)
- Deposition Comparison
- (2)
- Uniformity Comparison
3. Results and Discussions
3.1. Significance and Modelling of Variables for Synchronous Spray
3.1.1. Main Effect and Significance of Synchronous Operation Parameters
3.1.2. Trend Modelling of Synchronous Spray
- (1)
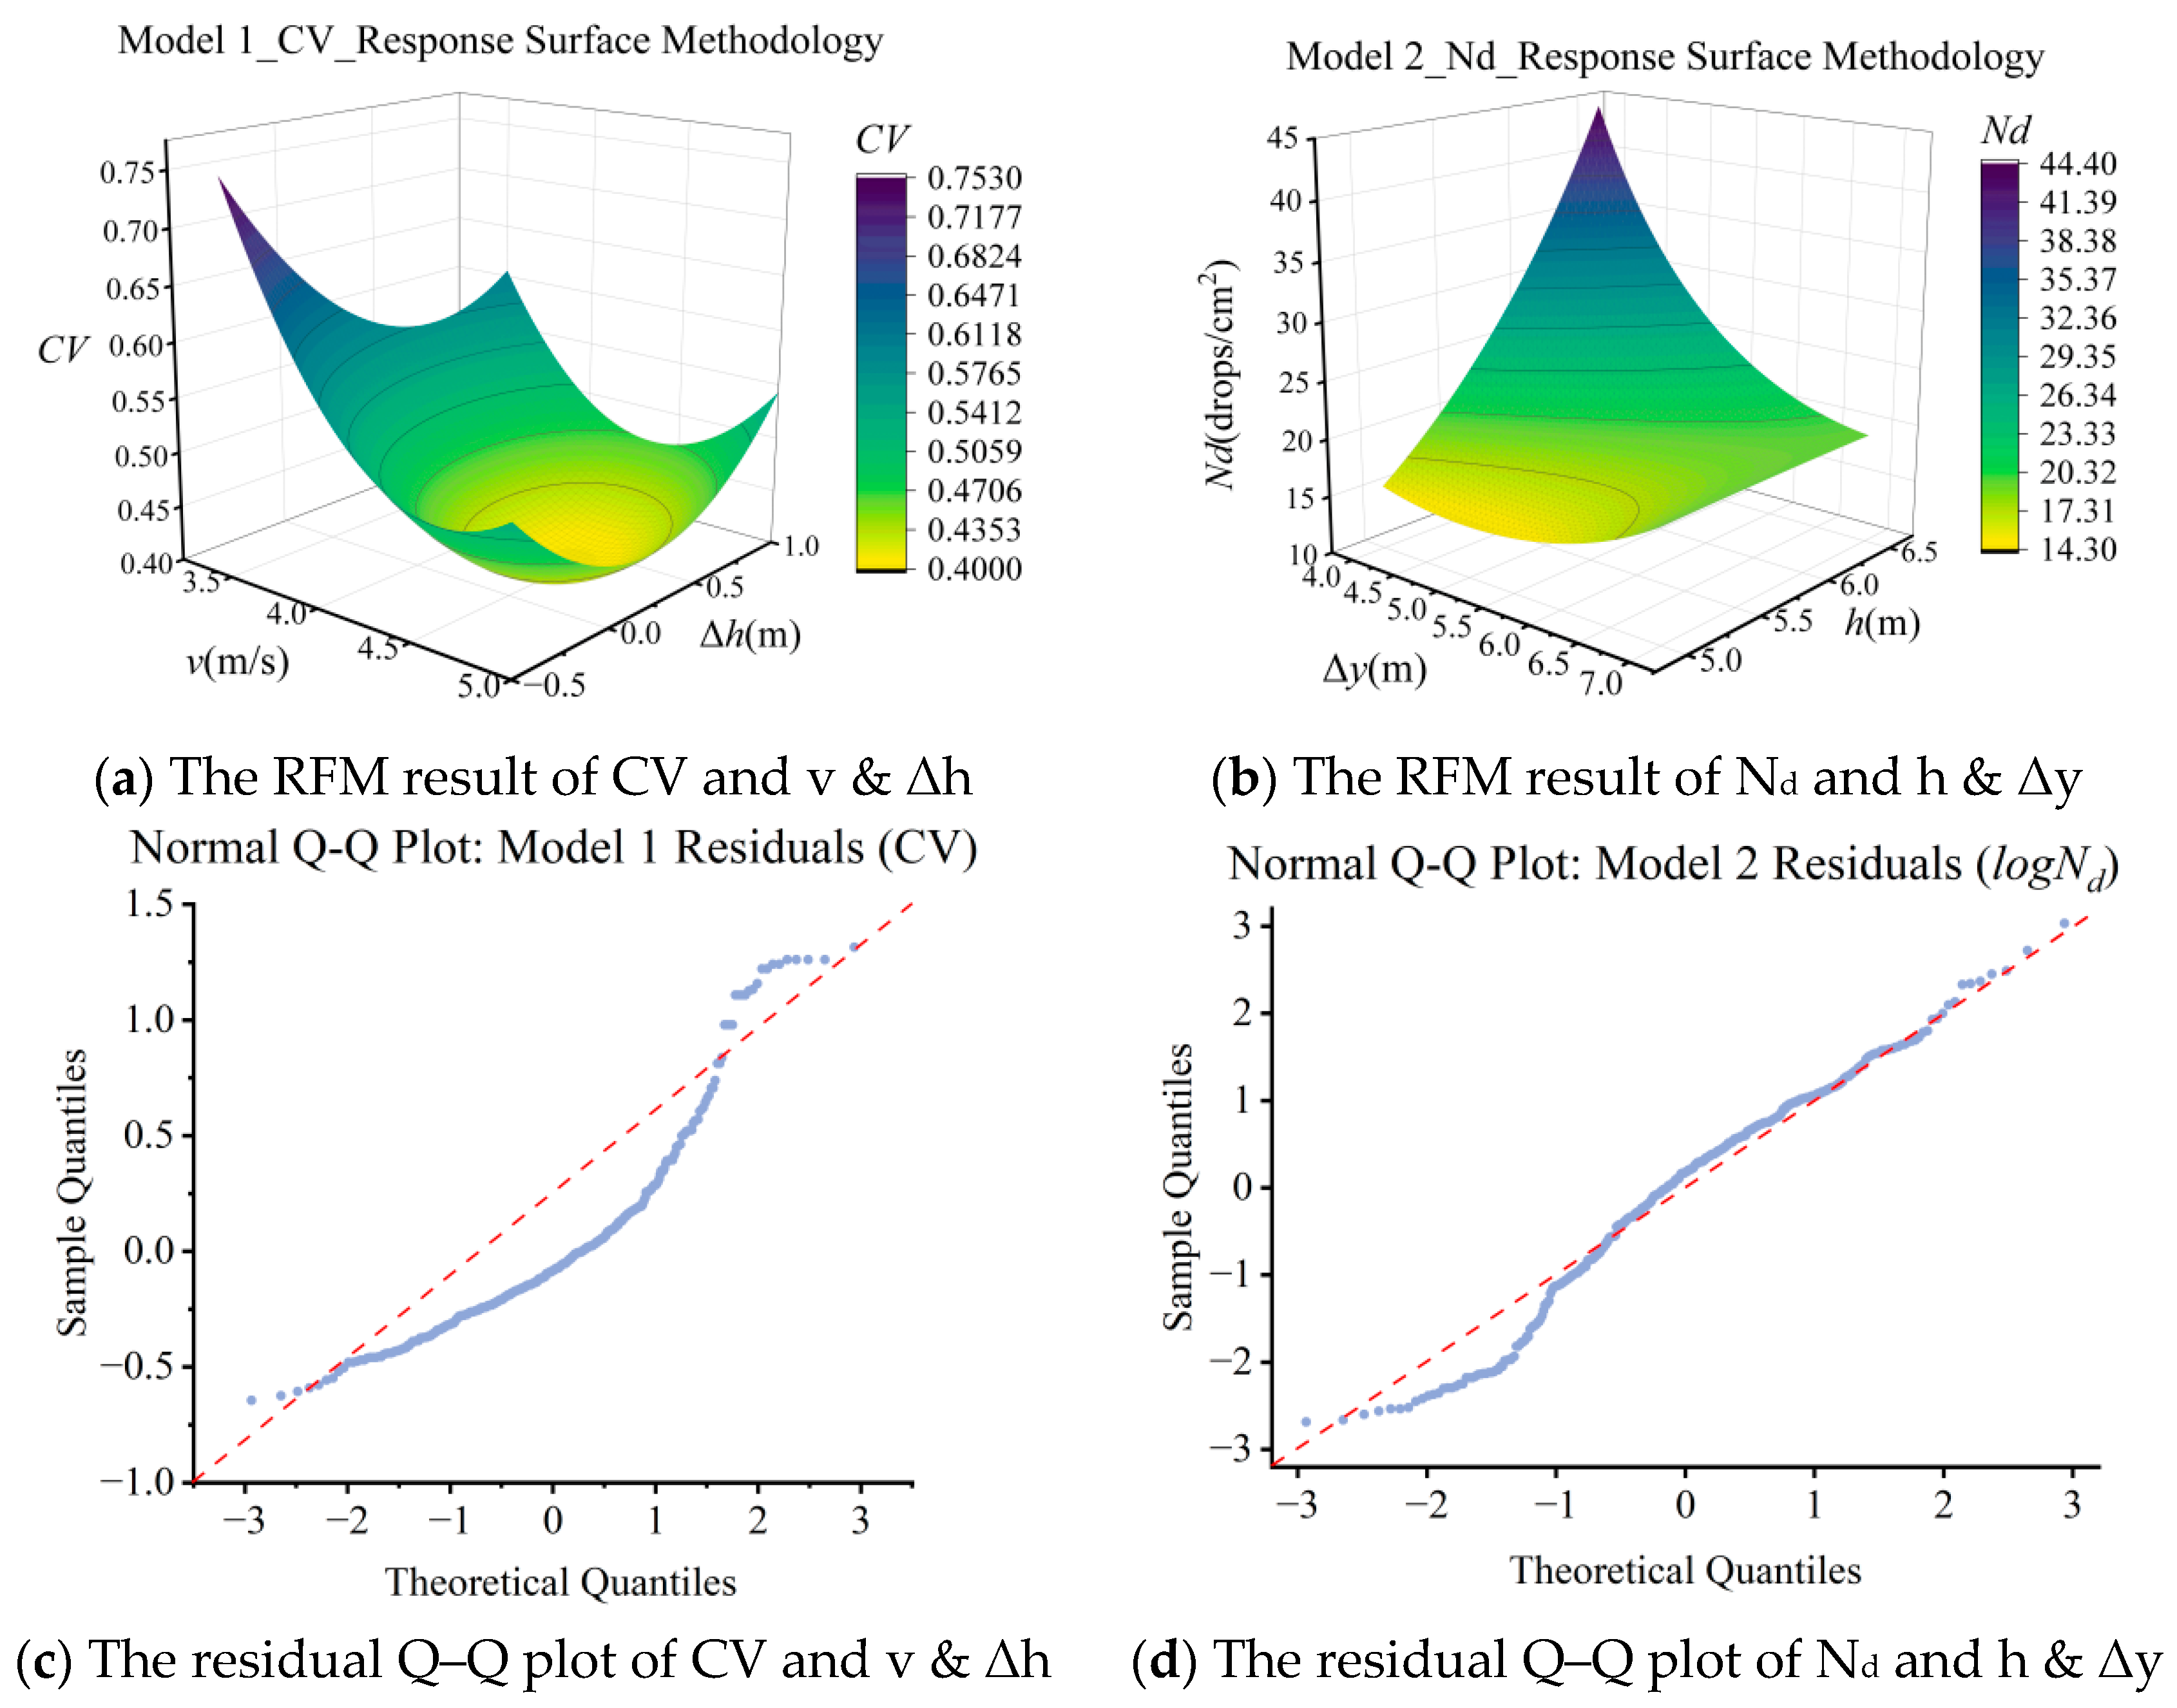
- The adopted modelling method improved the ability to capture global evolutionary laws, as HC3 RSE ensured the reliability of characterising the average response trend, and the logarithmic transformation effectively weakened the effect of extreme values.
- (2)
- The optimal operation parameters could be further determined. In terms of CV, the optimal condition should be v ≈ 4.486 m/s and Δh ≈ 0.342 m (predicted theoretical minimum CV ≈ 0.4007), which means that the UAVs under moderate speed with moderate relative height are beneficial for the overall uniformity. For improving Nd, the optimal condition occurred at the boundary condition (h = 6.5 m and Δy = 4.0 m), with the predicted Nd corrected ≈ 44.32/cm2. These ranges are close to the main effects.
3.2. Joint Evaluation Based on Quadrant Division of Spray Quality
- (1)
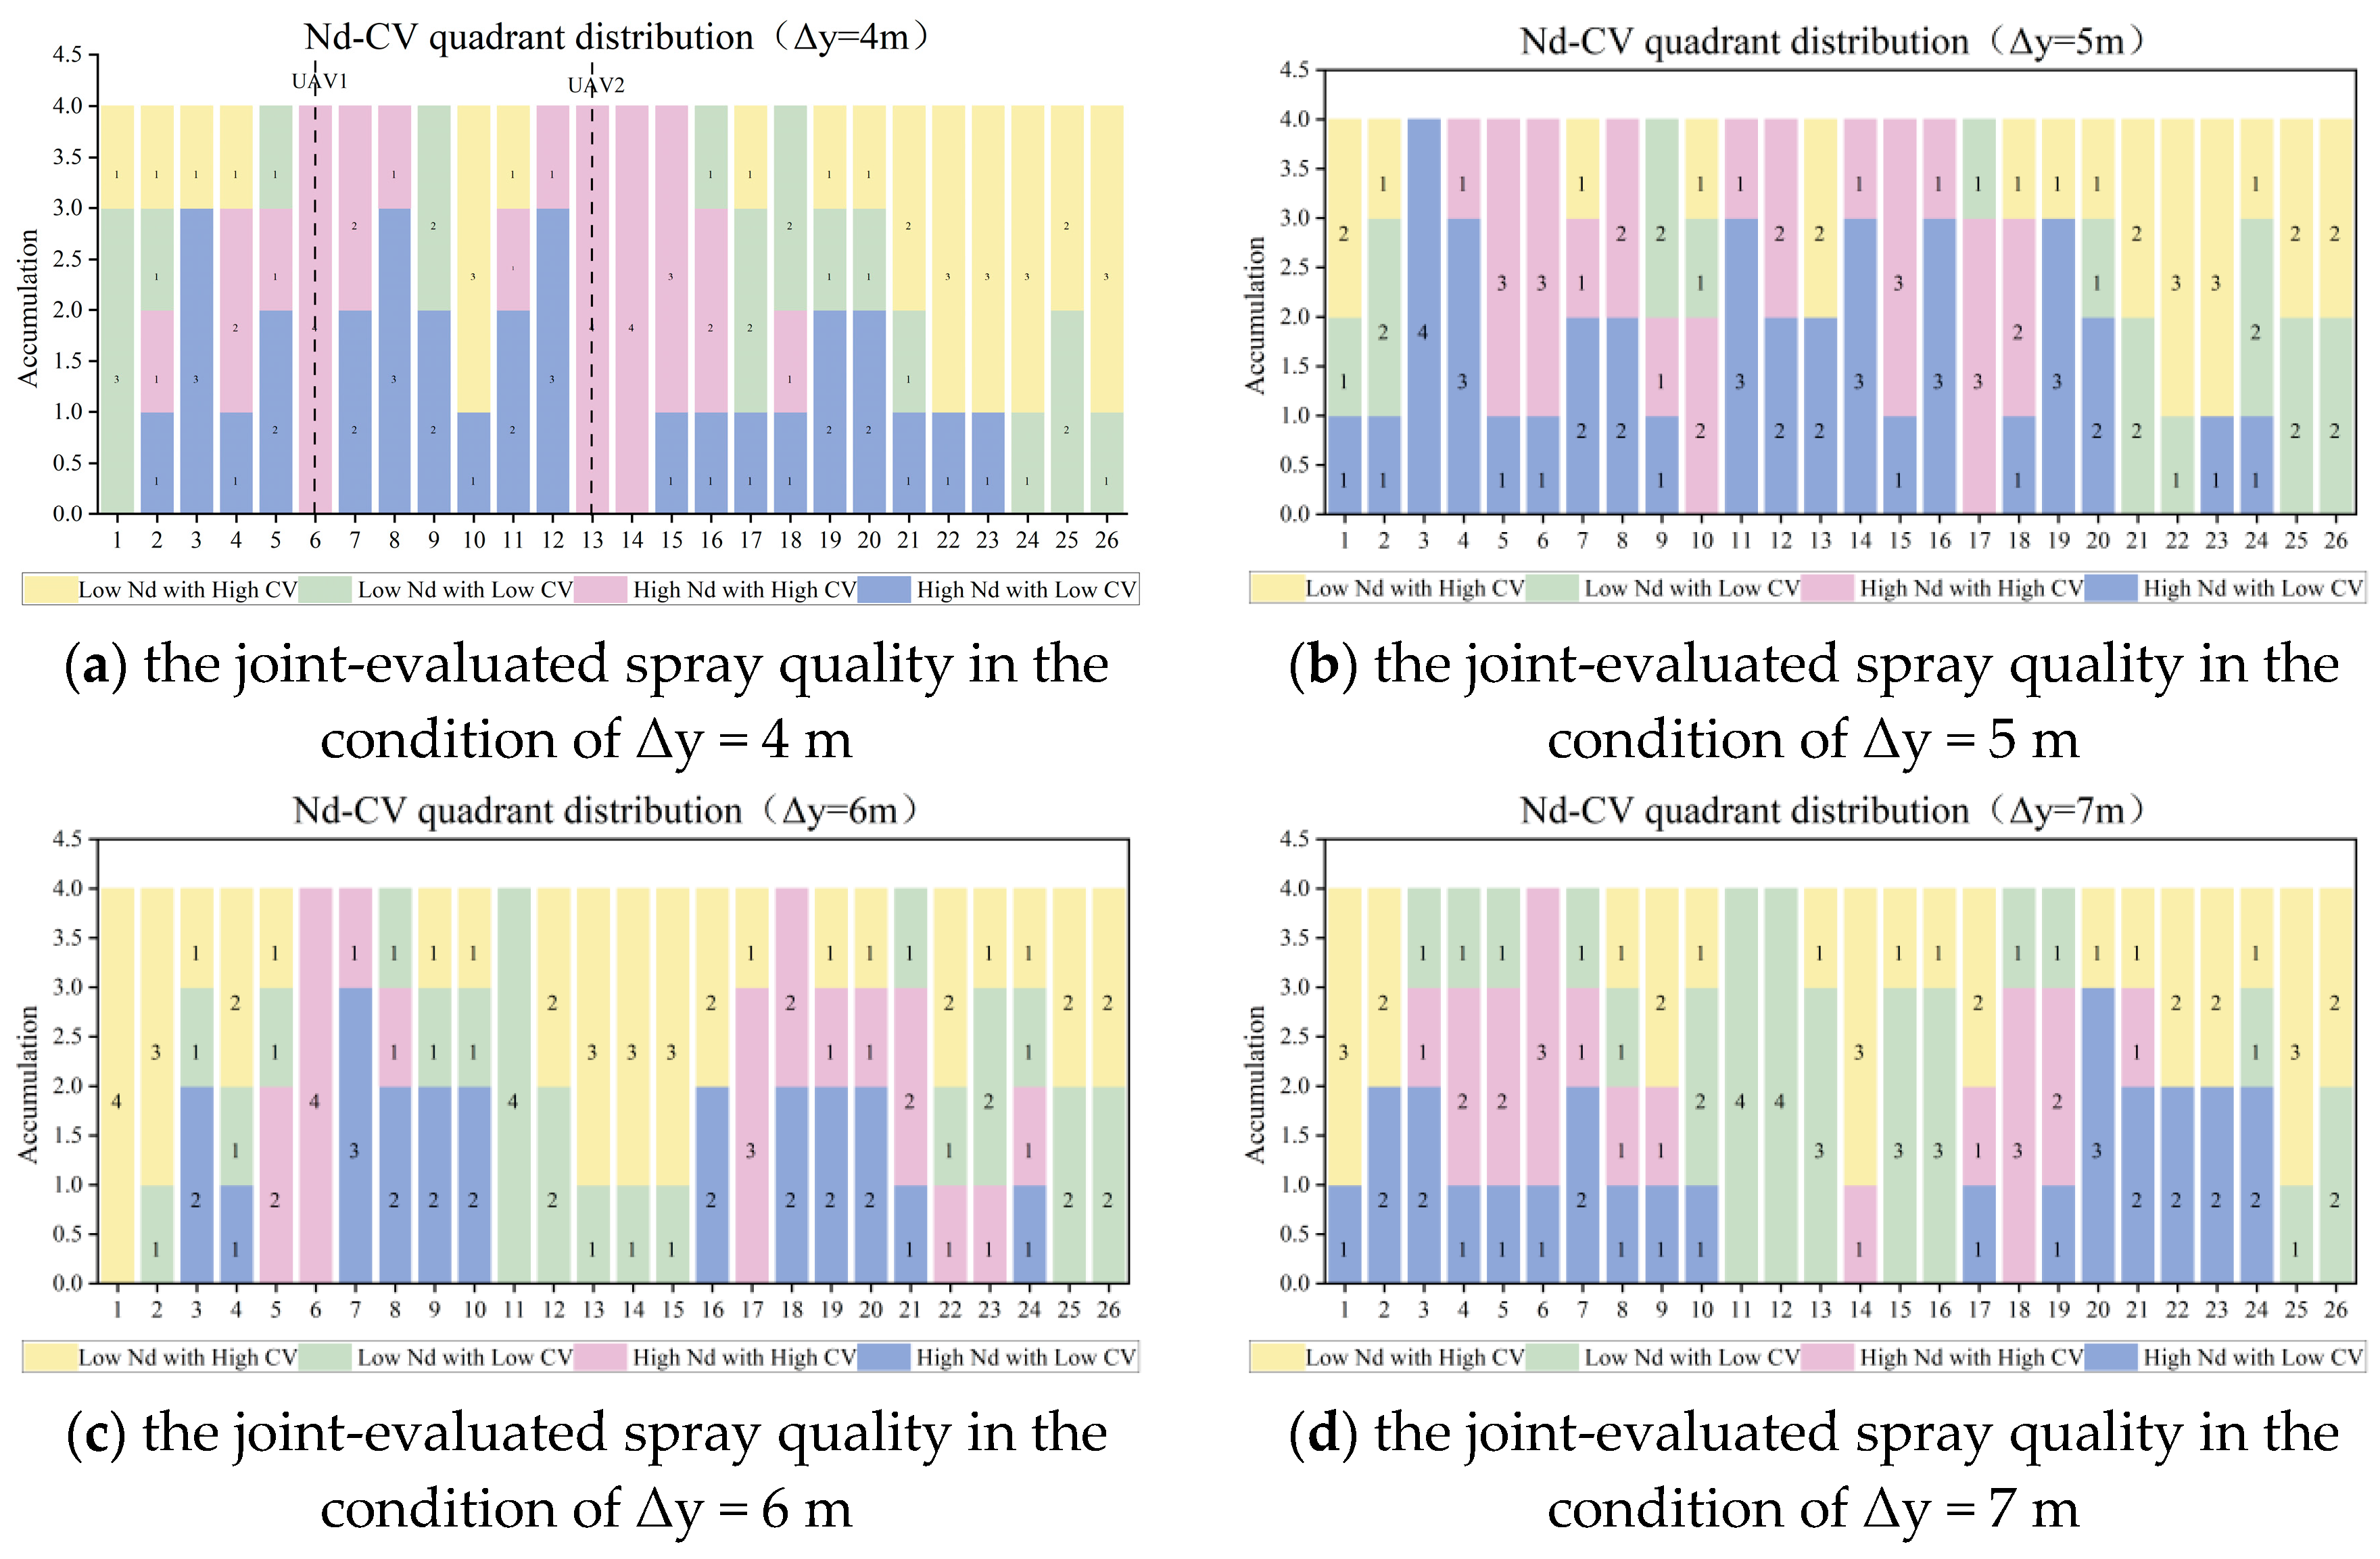
- The increase in the relative horizontal distance (Δy) reduced the proportion of high-quality spray in the coupling areas. When Δy was 4 m and 5 m, high-quality spray (high Nd with low CV) accounted for about 40% and 43%, respectively, whilst it decreased to 25% and 18% when Δy was 6 m and 7 m. In particular, when Δy was high (6 m and 7 m), the spray in the coupling areas showed deterioration in uniformity or insufficient sedimentation.
- (2)
- The effective coupling distance for synchronous collaboration showed threshold characteristics at about Δy = 5 m. When Δy was 4 m and 5 m, high-quality spray was concentrated at the centre of the coupling areas (Crops 7 to 9 and Crops 11 to 12, respectively). When Δy increased to 6 m, spray quality declined markedly, particularly for the poor-quality spray (Quadrant D) of Crops 12 to 16. When Δy increased to 7 m, the contribution of the synergistic stacking of the two UAVs to deposition was further weakened, and the coupling area showed insufficient sedimentation.
3.3. Synchronous Effect Results
3.3.1. Results of the Effect Difference Between Synchronous and Asynchronous Spray
- (1)
- Effect Difference in the Entire Spray Area
- (1)
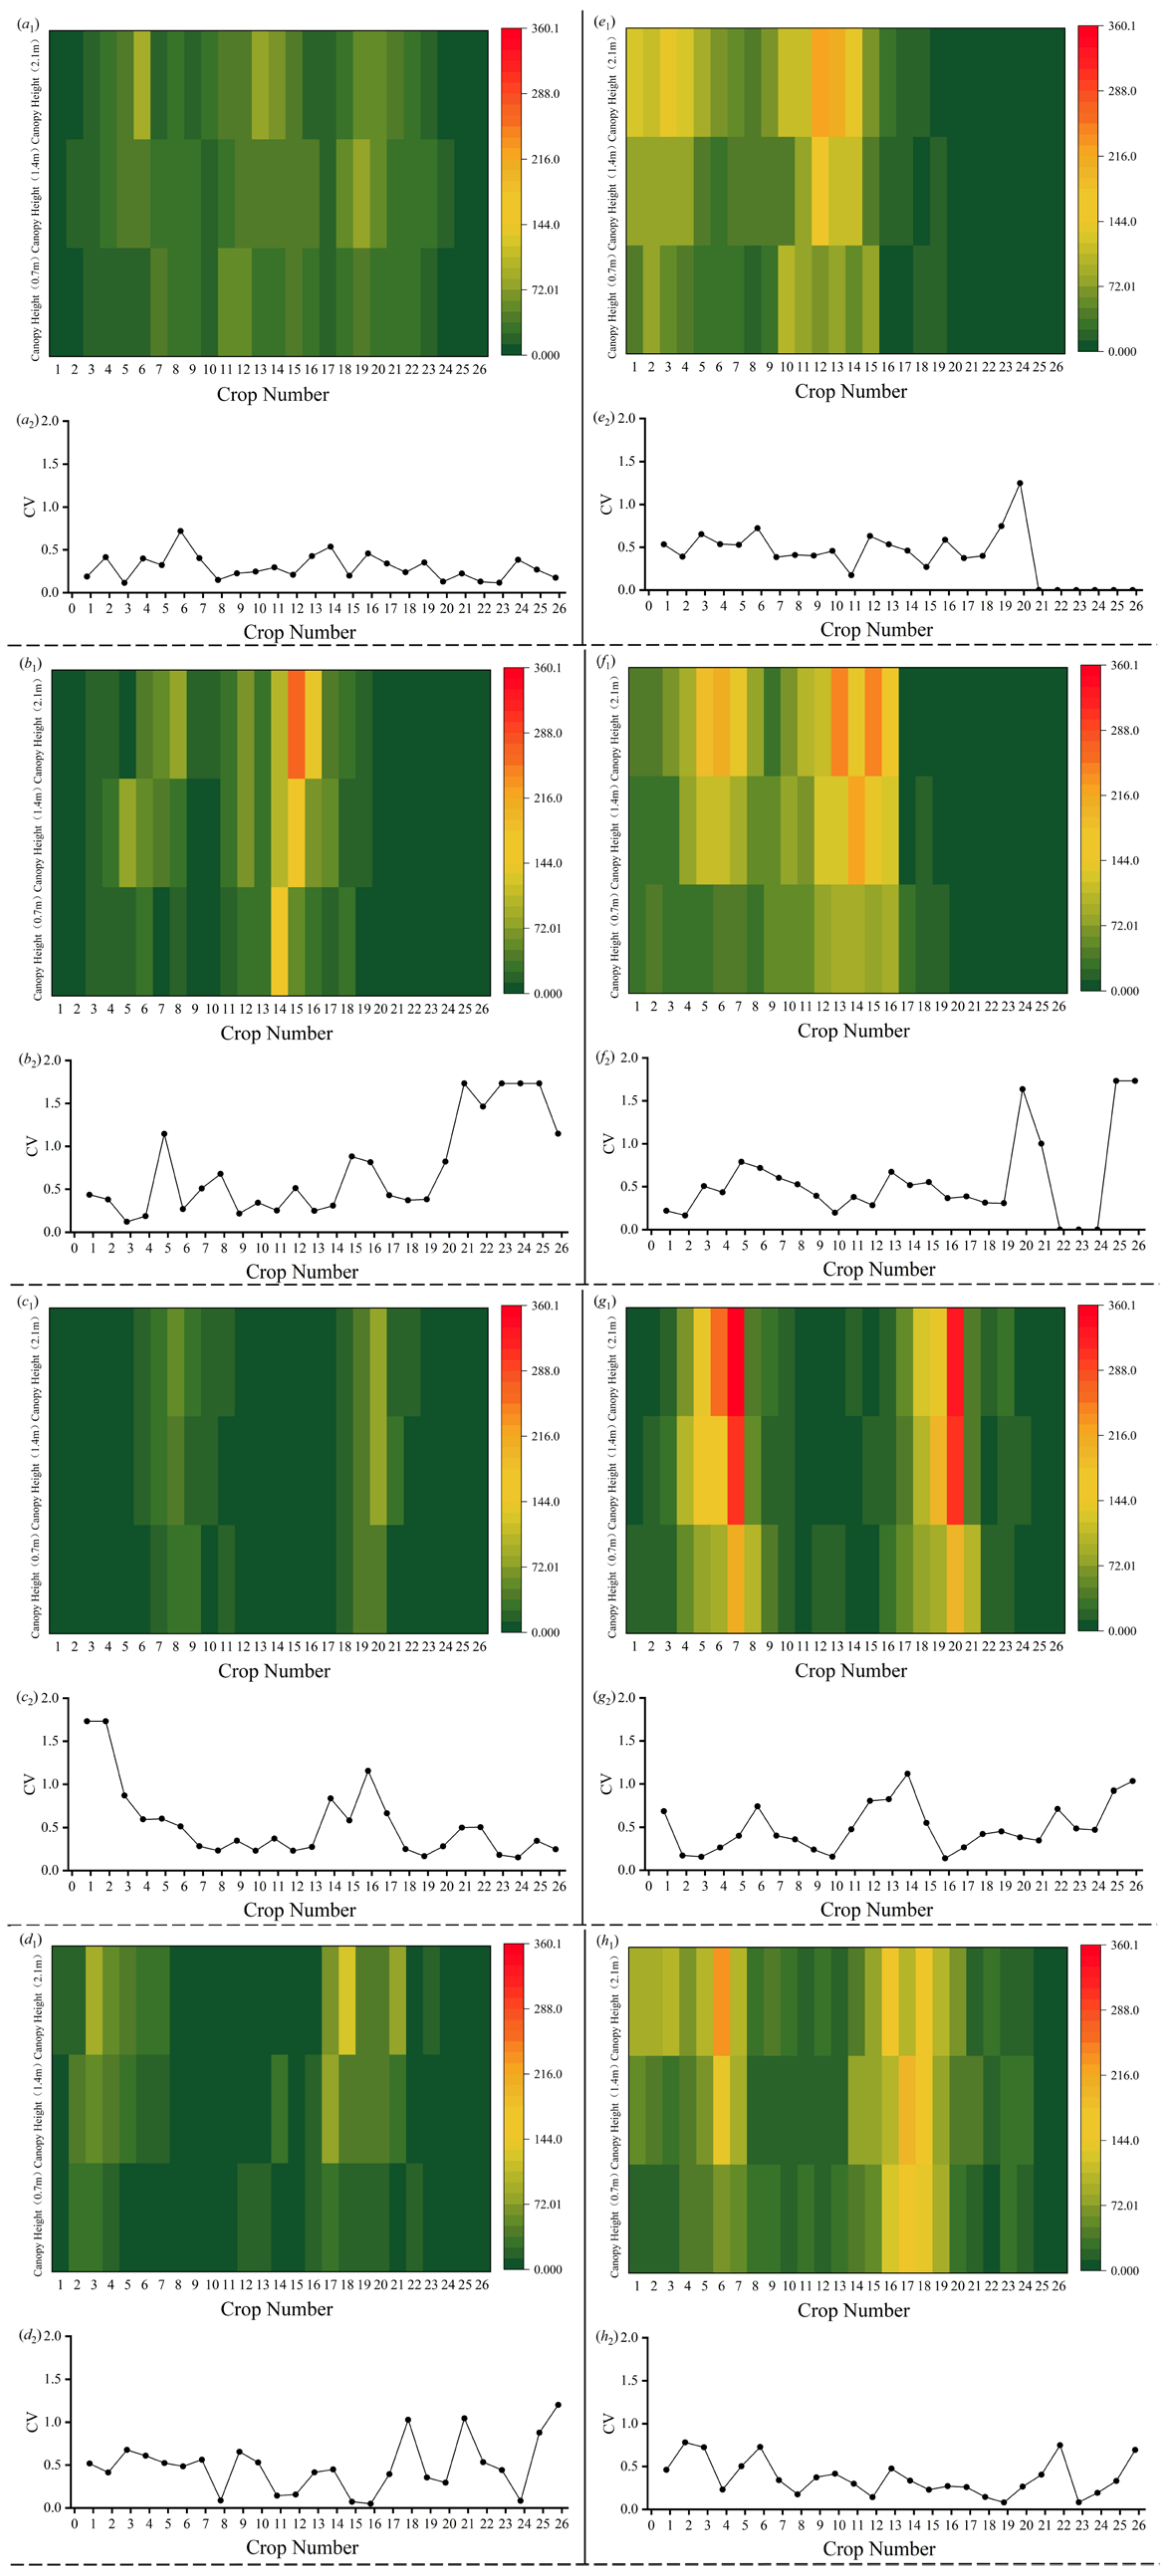
- Deposition across the whole spray area shows that the asynchronous mode produced higher Nd than the synchronous mode at all the four Δy levels. The increase in Nd was evident at Δy = 4 m, whereas the improvements were statistically significant (p-value by Holm-corrected < 0.05) at Δy = 5–7 m. Meanwhile, the asynchronous spray could form more continuous medium-to-high-value bands across the top, middle and bottom layers, which might result in a stable increase in deposition intensity across the entire plant zone.
- (2)
- In terms of layered-specific deposition, the advantage of the asynchronous spray shifted from being “localised to certain layers” to “consistent enhancement across all the layers” with the increase in Δy. The layered results showed a clear progression: at Δy = 4 m, differences in Nd between the two modes were not significant in any layer. At Δy = 5, 6 and 7 m, Nd in all the three layers was significantly higher for the asynchronous mode (Holm-corrected p < 0.05), demonstrating that the gain was no longer confined to individual layers but extends consistently throughout the crops.
- (3)
- From the perspective of CV: only under a strong-coupling condition (Δy = 4 m) was the synchronous mode significantly better than the asynchronous mode. The difference in CV exhibited a distinct “spacing dependence”: at Δy = 4 m, CV was significantly lower in the synchronous mode (p < 0.01), indicating that synchronisation was more effective at maintaining coverage uniformity at close spacing. At Δy = 5–7 m, the increase in deposition by the asynchronous spray was not accompanied by systematic deterioration in uniformity (all the p-values > 0.05). Moreover, the asynchronous curve fluctuated at Δy = 4 m in the line charts, whereas the fluctuation of the two modes became similar at Δy ≥ 5 m.
- (2)
- Effect Difference in the Coupling Spray Area
- (1)
- In terms of the whole-crop deposition, greater flight spacing (Δy ≥ 5 m) more effectively demonstrates the advantages of asynchronous operation in the coupling spray area, as the deposition amount of the asynchronous spray was larger than the synchronous, and all the p-values (Δy ≥ 5 m) were < 0.05.
- (2)
- For the layered deposition, the deposition by asynchronous spray gradually shifted from being “predominantly in the top and middle layers” (p-value = 0.041 and 0.029, respectively) to “predominantly in the middle and bottom layers” (p-value = 0.040 and 0.031, respectively), and eventually extended to “all the layers” (p-value < 0.01 in all the three layers). This provides more detail than the perspective of the whole spray area.
- (3)
- The primary contribution of the asynchronous spray in the coupling zone was to enhance deposition intensity and spatial coverage, since CV did not show significant differences across the four Δy conditions (p-value > 0.05).
3.3.2. Effect Differences Between Ideal Linear Superposition and Synchronous and Asynchronous Spray
- (1)
- Asynchronous coordination could yield gains over single-UAV spray at most spacings, though it fell short of achieving the ideal doubling effect. However, synchronous spraying tended to reduce performance relative to a single UAV. The synergistic gain coefficients (GA and GB) for both synchronous and asynchronous modes across the four horizontal spacings (Δy = 4–7 m) were negative, indicating that overall crop deposition under dual-UAV spray was generally lower than the linear superposition. That is, neither synchronous nor asynchronous spray could achieve ideal doubling. Moreover, the synchronous mode showed a more substantial weakening effect (GA = −0.697 to −0.868), particularly at Δy = 6 m (p < 0.05). In contrast, the asynchronous mode achieved 44.2–68.1% of the ideal doubling target. When Δy was 5–7 m, it still provided a deposition gain relative to single-UAV operation (+15.0–36.2%), though it did not reach the ideal linear superposition.
- (2)
- Regarding penetration uniformity, no significant differences were observed between linear superposition and the two coordination modes. However, to improve uniformity, at larger horizontal spacings, synchronous dual-UAV spray might increase local deposition at the expense of penetration uniformity, whereas the asynchronous mode showed greater potential for balancing deposition volume and uniformity. The improvement rate (ICV) relative to single-UAV operation varied with Δy. When Δy was 4 m, CV decreased slightly for the synchronous mode but increased for the asynchronous mode. At Δy = 5 m, both modes exhibited higher CV than the single unit. If Δy was 6 m, both synchronous and asynchronous modes presented reduced CV, with a larger improvement under asynchronous operation. When Δy was 7 m, the synchronous mode showed markedly higher CV than the single UAV, while the asynchronous mode remained close to the single-UAV level. Only at Δy = 7 m did the synchronous mode display a notable tendency towards uniformity deterioration (p ≈ 0.08).
3.4. Spray Strategy of Multi-UAV Collaboration
- (1)
- One of the key factors in multi-UAV spraying is to control the horizontal spacing between drones, and synchronous coupling should be avoided as much as possible. It is recommended that the horizontal spacing between drones be at least the spray swath (5 m in the study). Moreover, asynchronous collaborative work can be utilised to improve the amount and uniformity of droplet deposition.
- (2)
- If synchronous collaboration is unavoidable, the minimum spacing (4 m in the study) should be used as much as possible while maintaining flight safety. In addition, based on the forward direction of flight, the left-side UAV should fly at a higher altitude (5 m or 6.5 m in the study) and be slightly higher than the right (0.5 m in the study). Meanwhile, combined with low or medium flight speed (3.5 m/s–4.5 m/s in the study), high-quality spray (high Nd with low CV) can be achieved.
3.5. Discussions
4. Conclusions
- (1)
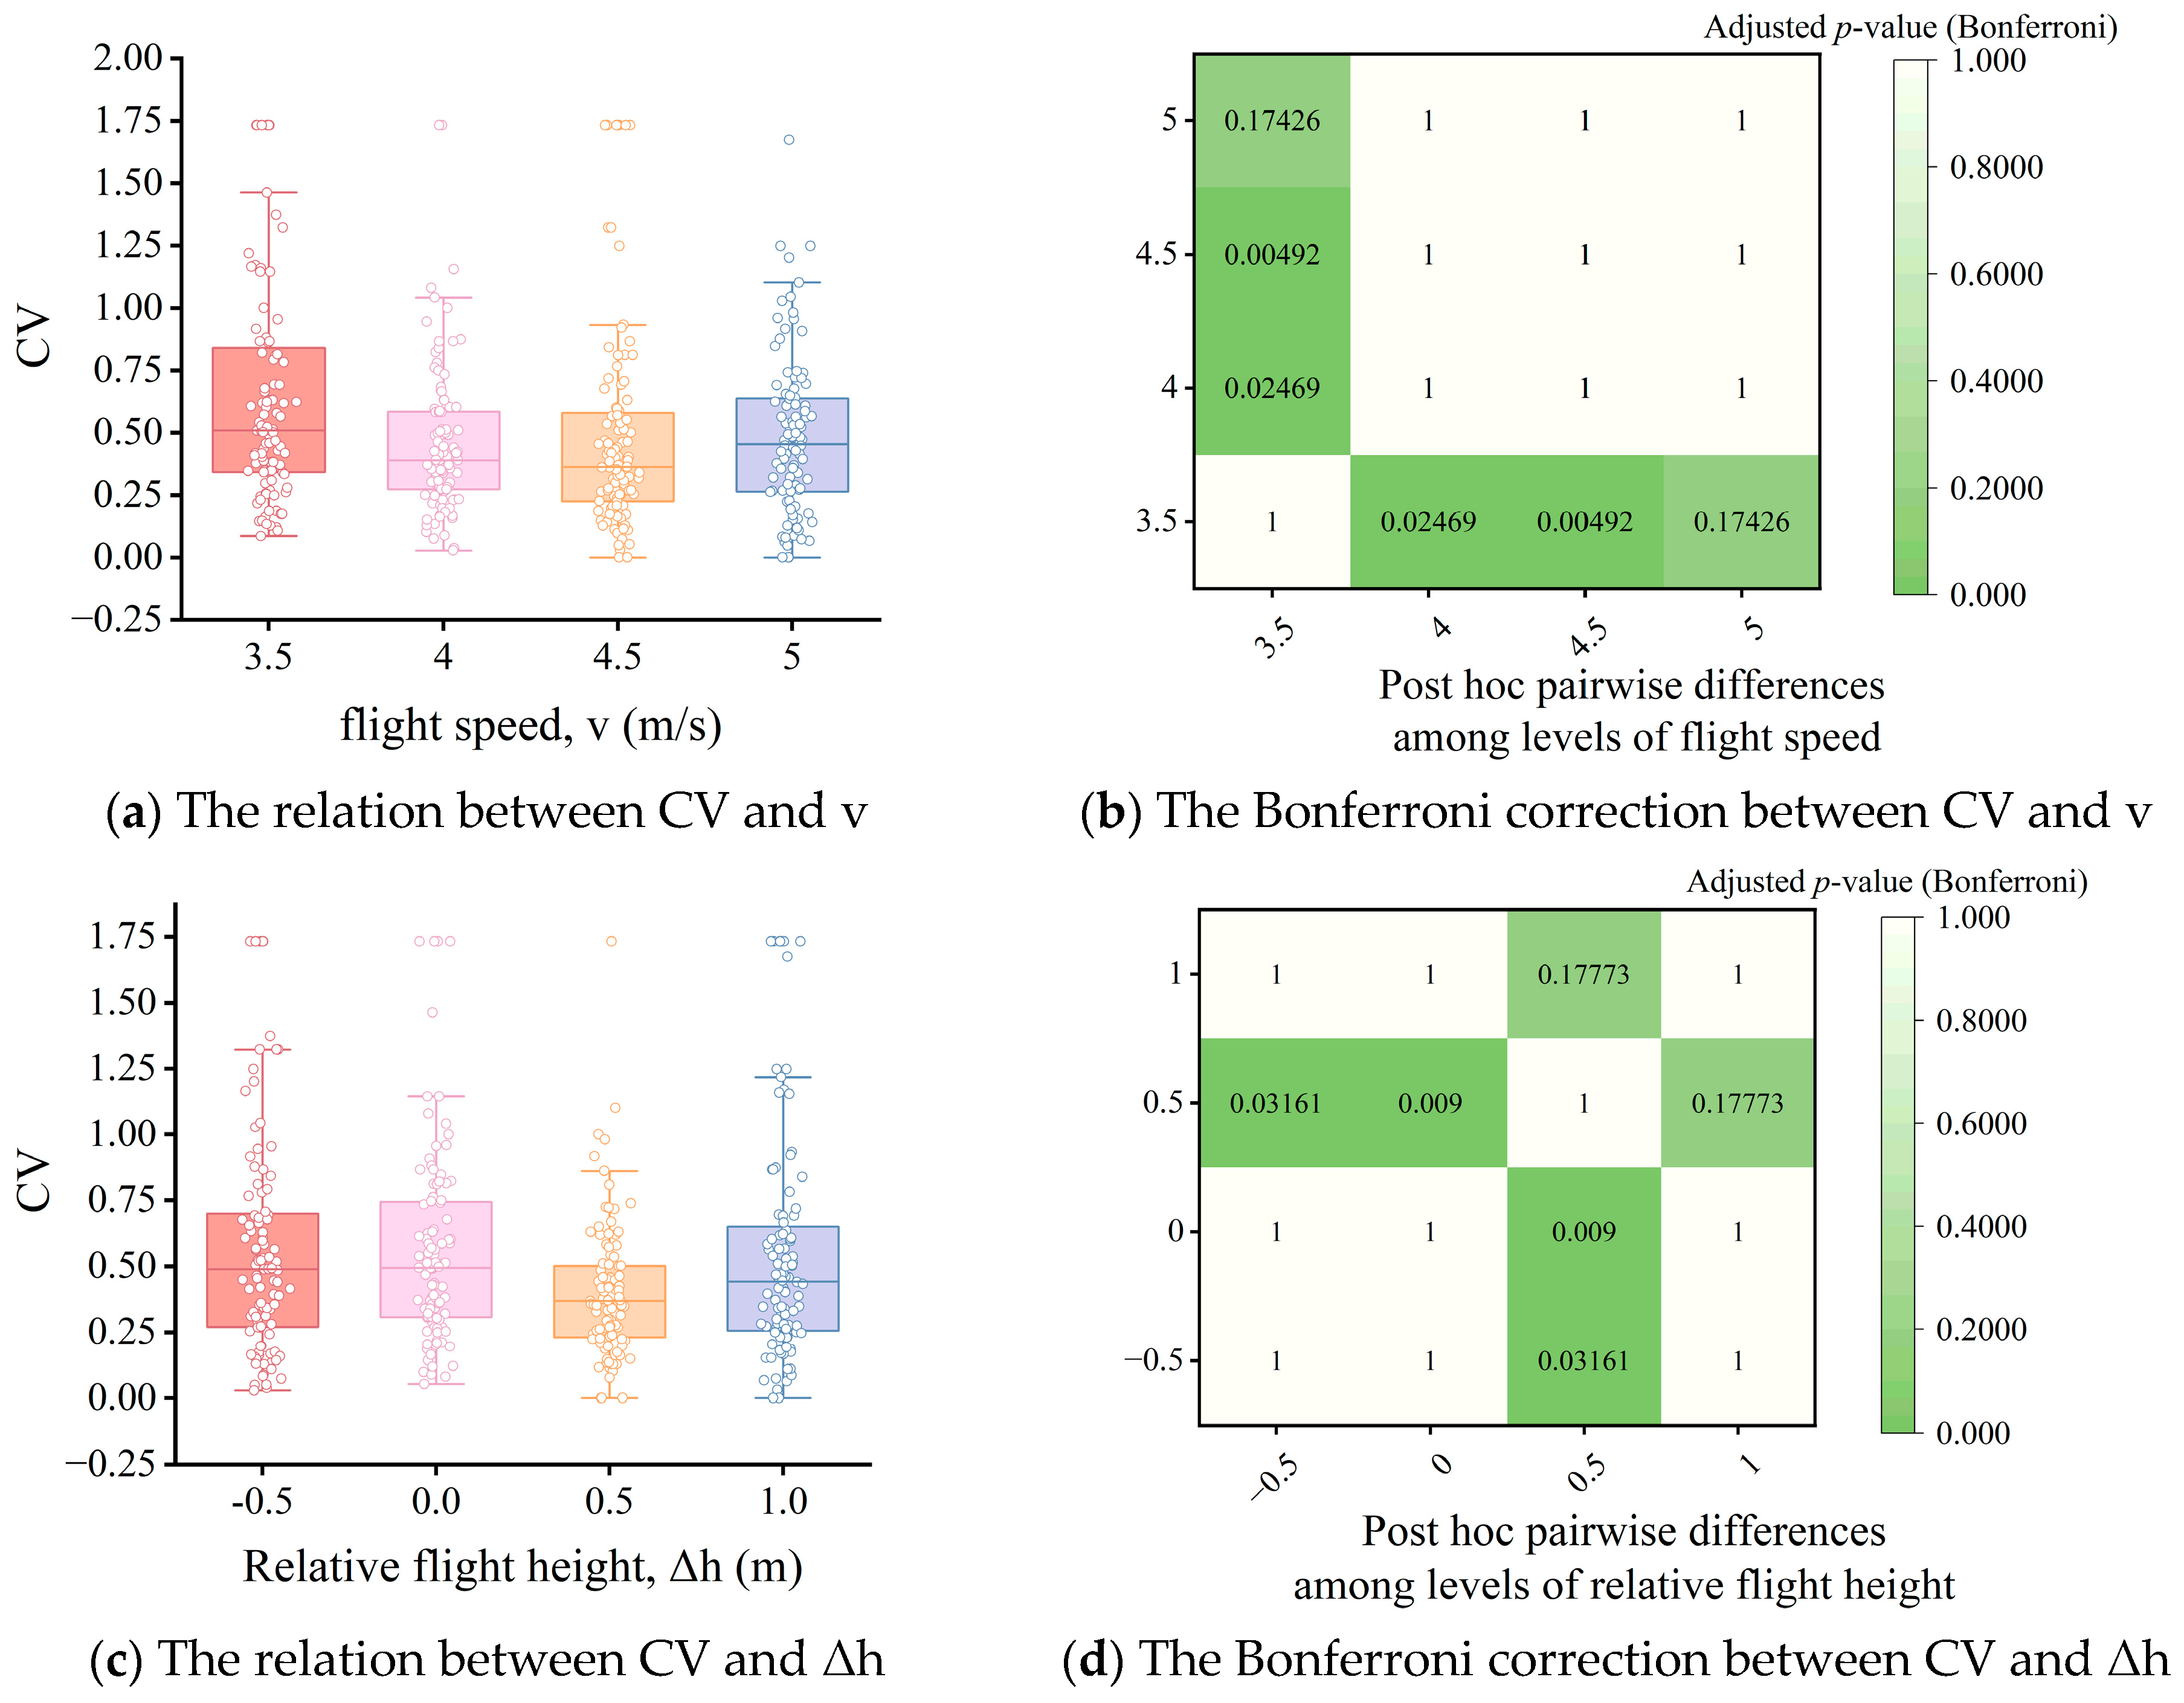
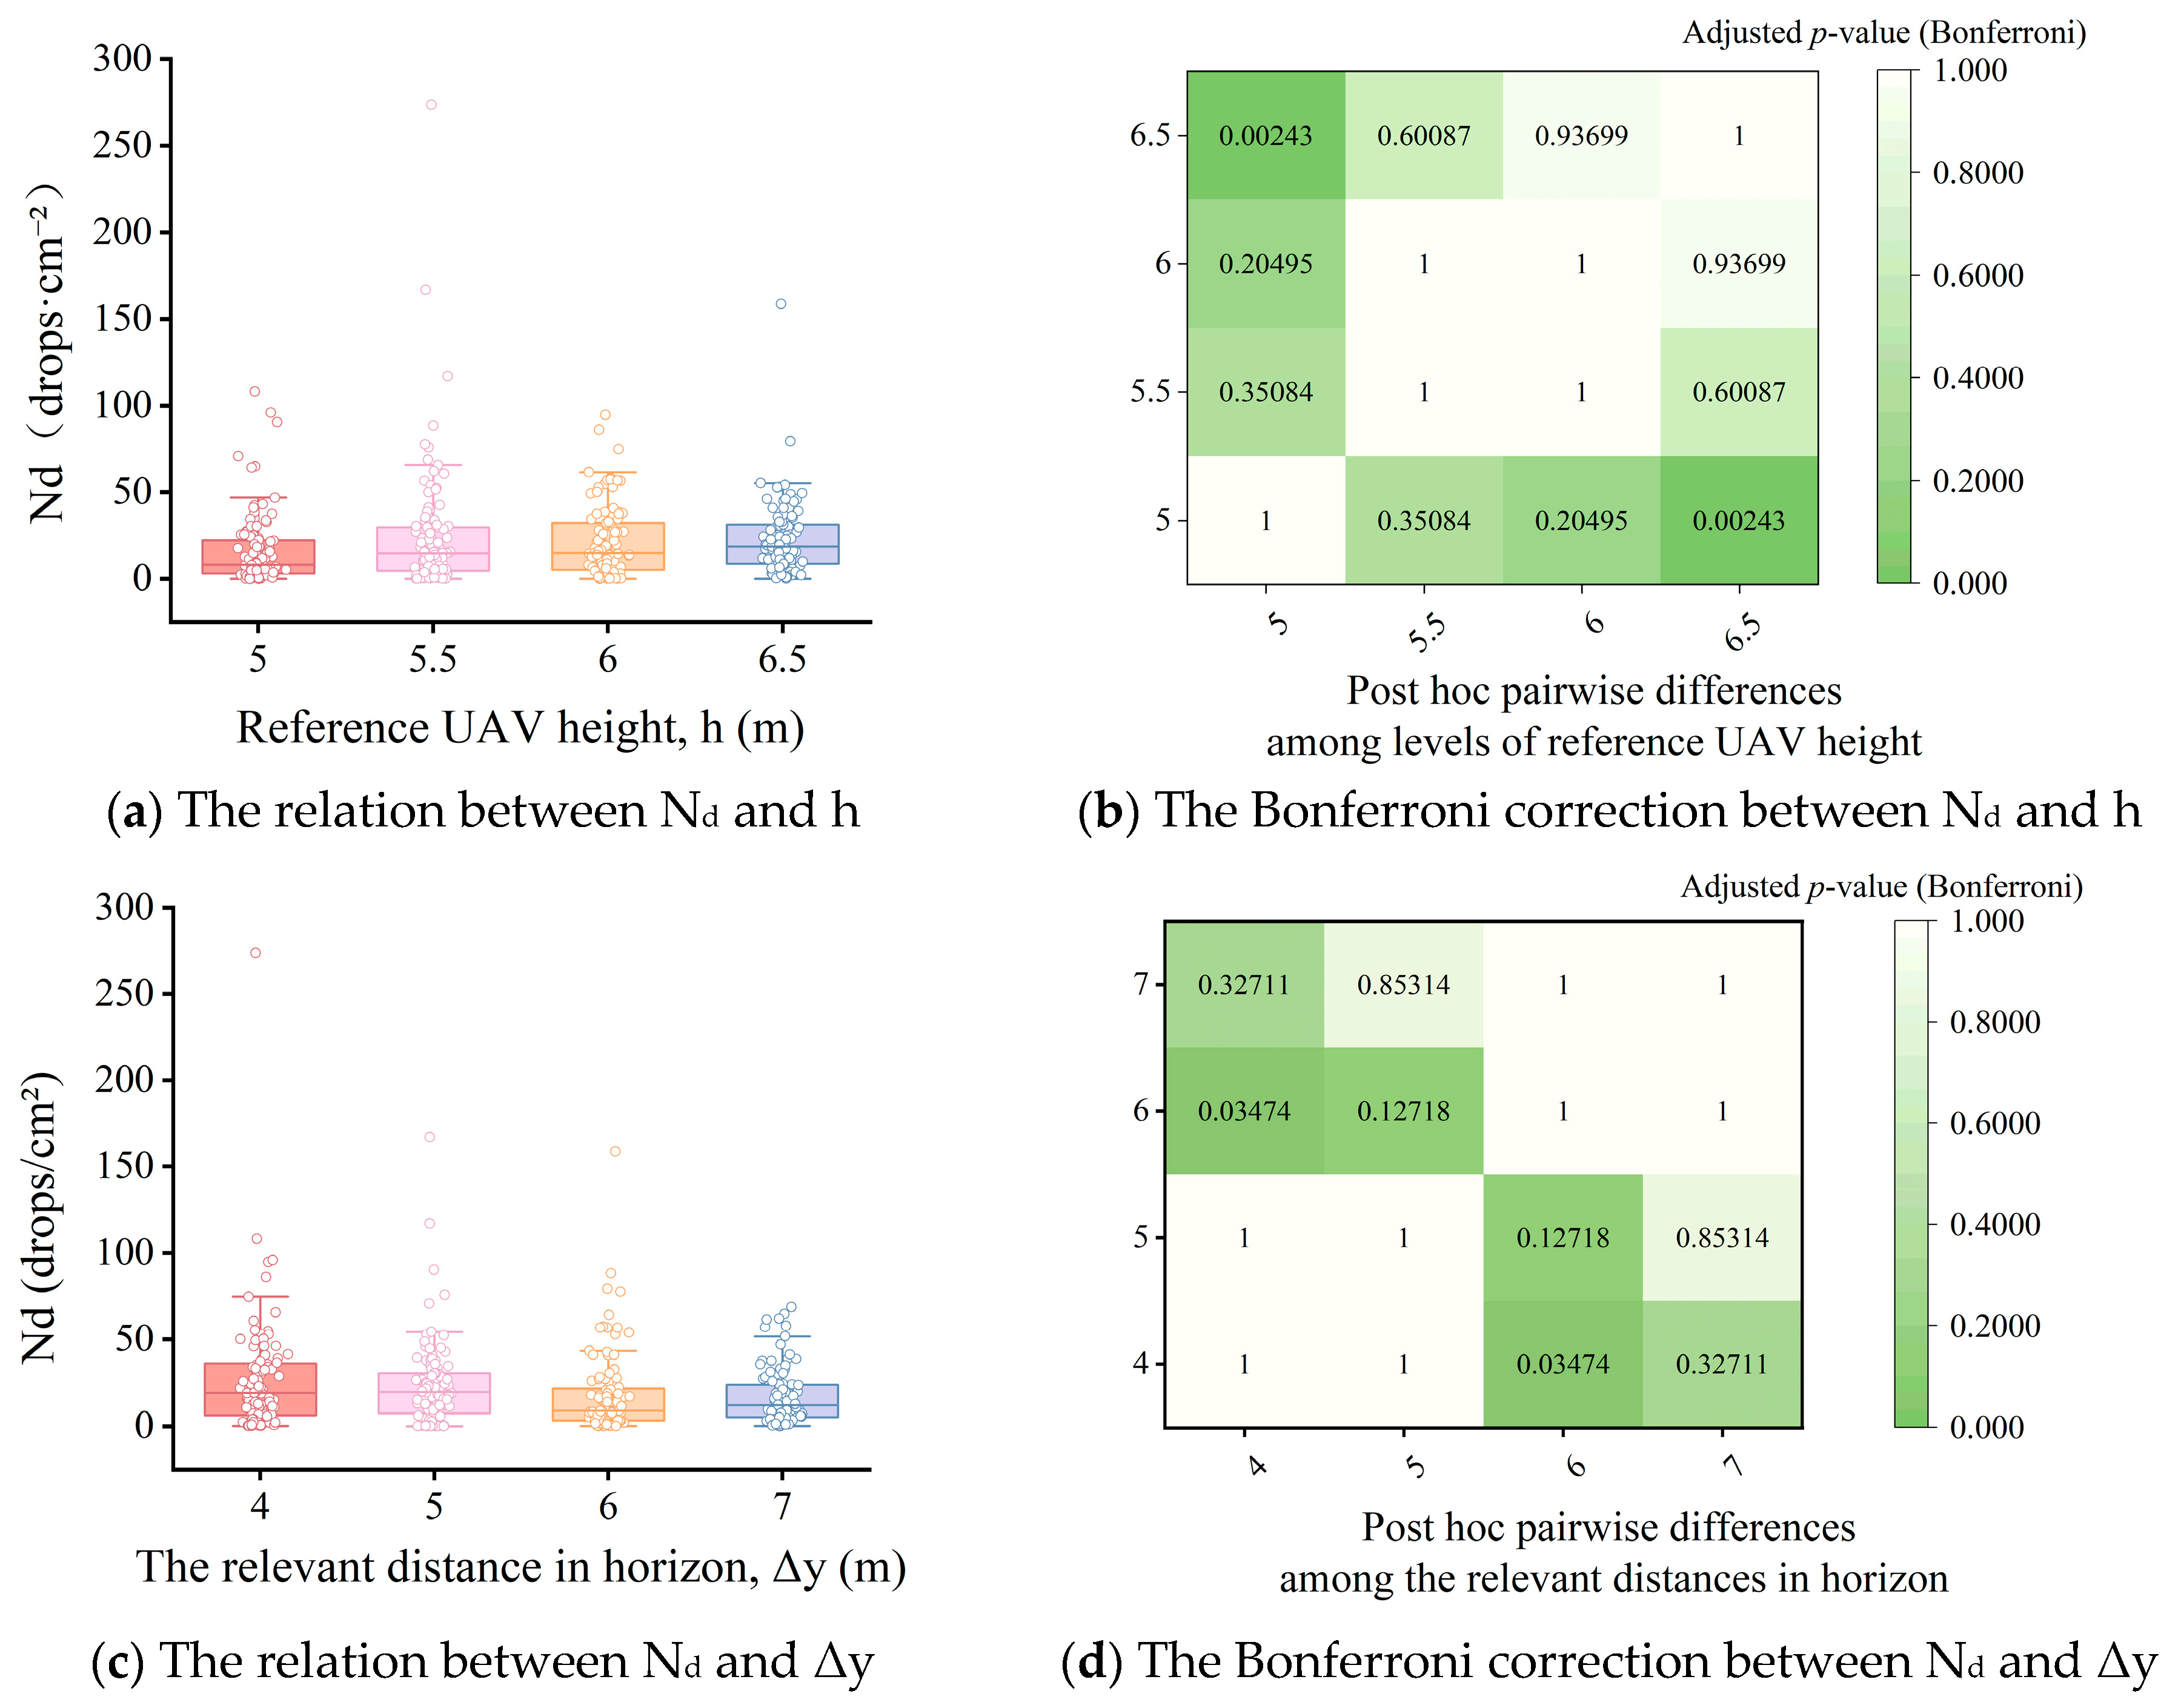
- The relative height between the UAVs and the flight speed of the UAVs were significant for spray uniformity (all the p-values < 0.02), whilst the relative horizontal spacing between the UAVs and the height of the left UAV relative to the forward flight direction were significant for spray deposition amount (all the p-values < 0.04). These mean that using two factors could independently adjust one response without changing the outcome of the other.
- (2)
- The increase in the relative horizontal distance of the two UAVs (Δy) reduced the proportion of high-quality spray in the coupling areas, and the effective coupling distance for synchronous collaboration showed threshold characteristics at about Δy = 5 m. Meanwhile, asynchronous spray outperformed synchronous spray across all the Δy levels.
- (3)
- Combined with the joint evaluation of spray qualities and coupling effects, synchronous coupling should be avoided as much as possible. If not, the left-side UAV (according to the forward direction of flight) should fly at a higher altitude (5 m or 6.5 m in the study), be slightly higher than the right (0.5 m higher in the study) and work with a low or medium flight speed (3.5 m/s–4.5 m/s in the study). This can achieve high-quality spray (high deposition amount and uniformity) during synchronous collaboration.
Author Contributions
Funding
Data Availability Statement
Conflicts of Interest
References
- Yan, Y.; Song, F.; Sun, J. The application of UAV technology in maize crop protection strategies: A review. Comput. Electron. Agric. 2025, 237, 110679. [Google Scholar] [CrossRef]
- Feng, H.; Zhao, H.; Yang, S.; Zheng, Y.; Li, W.; Liu, W.; Wang, X. Modelling and application of fluid-structure interaction in the study of wind fields and crops interaction: A review. Comput. Electron. Agric. 2025, 238, 110821. [Google Scholar] [CrossRef]
- Zhang, X.Q.; Song, X.P.; Liang, Y.J.; Qin, Z.Q.; Zhang, B.Q.; Wei, J.J.; Li, Y.R.; Wu, J.M. Effects of spray parameters of drone on the droplet deposition in sugarcane canopy. Sugar Tech 2020, 22, 583–588. [Google Scholar] [CrossRef]
- Sheikhigarjan, A.; Safari, M.; Ghazi, M.M.; Zarnegar, A.; Shahrokhi, S.; Bagheri, N.; Moein, S.; Seyedin, P. Chemical control of wheat sunn pest, Eurygaster integriceps, by UAV sprayer and very low volume knapsack sprayer. Phytoparasitica 2024, 52, 49. [Google Scholar] [CrossRef]
- Li, H.; Li, Y.; Zeeshan, M.; Yang, L.; Gao, Z.; Yang, Y.; Zhang, G.; Wang, C.; Han, X. The Influence of Unmanned Aerial Vehicle Wind Field on the Pesticide Droplet Deposition and Control Effect in Cotton Fields. Agronomy 2025, 15, 1221. [Google Scholar] [CrossRef]
- Martin, D.E.; Perine, J.W.; Grant, S.; Abi-Akar, F.; Henry, J.L.; Latheef, M.A. Spray Deposition and Drift as Influenced by Wind Speed and Spray Nozzles from a Remotely Piloted Aerial Application System. Drones 2025, 9, 66. [Google Scholar] [CrossRef]
- Wen, S.; Han, J.; Lan, Y.B.; Yin, X.; Lu, Y. Influence of Wing Tip Vortex on Drift of Single Rotor Plant Protection Unmanned Aerial Vehicle. Trans. Chin. Soc. Agric. Mach. 2018, 49, 127–137+160. [Google Scholar] [CrossRef]
- Zhang, Y.H. Effect of Downwash Airflow in Hover and Soybean Canopy on Droplet Motion law for Multi-Rotor Unmanned Plant Protection Machine. Master’s Thesis, Henan Agricultural University, Zhengzhou, China, 2021. [Google Scholar] [CrossRef]
- Yang, F.; Xue, X.; Cai, C.; Sun, Z.; Zhou, Q. Numerical simulation and analysis on spray drift movement of multirotor plant protection unmanned aerial vehicle. Energies 2018, 11, 2399. [Google Scholar] [CrossRef]
- Zhan, Y.; Chen, P.; Xu, W.; Chen, S.; Han, Y.; Lan, Y.; Wang, G. Influence of the downwash airflow distribution characteristics of a plant protection UAV on spray deposit distribution. Biosyst. Eng. 2022, 216, 32–45. [Google Scholar] [CrossRef]
- Lan, Y.; Qian, S.; Chen, S.; Zhao, Y.; Deng, X.; Wang, G.; Zang, Y.; Wang, J.; Qiu, X. Influence of the downwash wind field of plant protection UAV on droplet deposition distribution characteristics at different flight heights. Biosyst. Eng. 2021, 11, 2399. [Google Scholar] [CrossRef]
- Zhang, G.; Liu, J.; Luo, W.; Zhao, Y.; Tang, R.; Mei, K.; Wang, P. A Shortest Distance Priority UAV Path Planning Algorithm for Precision Agriculture. Sensors 2024, 24, 7514. [Google Scholar] [CrossRef] [PubMed]
- Li, K.; Xie, S.; Zhu, T.; Wang, H. Constrained multiobjective optimization for UAV-assisted mobile edge computing in smart agriculture: Minimizing delay and energy consumption. IEEE Trans. Sustain. Comput. 2024, 9, 948–957. [Google Scholar] [CrossRef]
- Li, J.Y.; Luo, H.Y.; Zhu, C.W.; Li, Y.; Tang, F. Research and Implementation of Combination Algorithms about UAV Spraying Planning Based on Energy Optimization. Trans. Chin. Soc. Agric. Mach. 2019, 50, 106–115. [Google Scholar] [CrossRef]
- Kan, P. Cooperative and Precise Operation Method of Multi-Sprayer-UAVs Based on Path Planning. Master’s Thesis, Shandong University, Jinan, China, 2021. [Google Scholar] [CrossRef]
- Chen, J.; Cao, Y.; Du, N.; Zhang, Z.; Liu, X.; Han, Y. Gaussian pseudospectral longitudinal trajectory optimization algorithm of a solar powered communication/remote-sensing UAV. In Proceedings of the 2019 IEEE International Conference on Unmanned Systems and Artificial Intelligence (ICUSAI), Xi’an, China, 22–24 November 2019; IEEE: Piscataway, NJ, USA, 2019; pp. 303–308. [Google Scholar]
- Ivic, S.; Andrejcuk, A.; Druzeta, S. Autonomous control for multi-agent non-uniform spraying. Appl. Soft Comput. 2019, 80, 742–760. [Google Scholar] [CrossRef]
- Yang, S.H.; Xu, P.F.; Jiang, S.J.; Zheng, Y.J. Downwash characteristics and analysis from a six-rotor unmanned aerial vehicle configured for plant protection. Pest Manag. Sci. 2022, 78, 1707–1720. [Google Scholar] [CrossRef] [PubMed]
- Xu, G.; Chen, L.P.; Zhang, R.R. An image processing system for evaluation of aerial application quality. In Proceedings of the 2016 International Conference on Intelligent Information Processing (ICIIP), Wuhan, China, 23–25 December 2016; Association for Computing Machinery: New York, NY, USA, 2016. [Google Scholar] [CrossRef]
- Miao, Z.H.; Guo, H.W.; Xu, Z.Y.; Ou, F.; Wang, D.D.; Zhang, Y.B.; Wu, H.H.; Liu, C.L.; Zhao, C.J. Swarm intelligence in agricultural robotics: Key technologies and future prospects. Trans. Chin. Soc. Agric. Eng. (Trans. CSAE) 2025, 41, 1–17, (In Chinese with English abstract). [Google Scholar] [CrossRef]
- Zheng, Y.J.; Zhai, S.Y.; Wang, Y.K.; Yang, S.H.; Wang, H.Y.; Feng, H.; Zhao, H. Research advance and development trend of intelligent decision-making technology for agricultural machinery in farmland and orchard scenarios. Trans. Chin. Soc. Agric. Eng. (Trans. CSAE) 2025, 41, 1–27. [Google Scholar] [CrossRef]
- Jin, C.Q.; Chen, J.L.; Liu, Z.; Yang, T.X.; Liu, G.W. Review of the developments of cooperative operation technologies for agricultural machinery in field operation scenarios. Trans. Chin. Soc. Agric. Eng. (Trans. CSAE) 2025, 41, 1–13, (In Chinese with English abstract). [Google Scholar] [CrossRef]
- Chen, J.; Wu, K. New plant protection: New challenge and new opportunity for plant protection. New Plant Prot. 2024, 1, E9. [Google Scholar] [CrossRef]
- Cunha, M.; Carvalho, C.; Marcal, A.R.S. Assessing the ability of image processing software to analyse spray quality on water-sensitive papers used as artificial targets. Biosyst. Eng. 2012, 111, 11–23. [Google Scholar] [CrossRef]





| Perspectives | Main Approaches | Study Points | Benefits | Limitations | Citations |
|---|---|---|---|---|---|
| The relation between operation parameters and droplet distribution | Real tests based on water-sensitive papers or fluorescence | Parameter optimisation for a quad-rotor UAV in sugarcane fields | Optimal parameters for different heights of canopies | Single UAV without a unified parameter | [3] |
| Optimisation of the chemical amount used for P20-type UAV | Prevention effect of different chemicals compared with manual spray | Single UAV and not related to UAV operation parameters | [4] | ||
| Spray deposition of all-day operation by P20 and the prevention effect on cotton aphid | Enhancing the prevention advantages during night | Single UAV | [5] | ||
| parameter optimisation for coverage rate performance based on fluorescence | Comparing fluorescence and water-sensitive papers | Single UAV | [6] | ||
| The consistency from wind Fields to droplet distribution | CFD models with droplets and winds | Impact of wing tip vortex on drifts in different flight speeds of an S-40 UAV | Drifts compared with real tests | Single UAV and Tail vortex not validated | [7] |
| Impact of wind fields on drifts based on an SLK-5 UAV | CFD accuracy improved | Single UAV and drift in wake not validated | [8,9] | ||
| Real tests | Direct measurement by anemometers to verify the consistency between wind and droplets | Analysing the effect of operation parameters on deposition | Single UAV and open-field tests | [10,11] |
| Perspectives | Questions | Algorithms | Study Points | Benefits | Limitations | Citations |
|---|---|---|---|---|---|---|
| The optimisation of collaborative paths | Multiple flights based on a single UAV | TSP | Optimal path planning and transfer for adjacent multi-fields | Simulation combined with actual field shapes | Based on the nominal spray swath and lack of verifications | [12] |
| SA | Optimal path based on the minimum power consumption in hilly areas | Simulation combined with actual orchard terrains | Based on the nominal spray swath and lack of verifications | [13] | ||
| The optimal modelling by mileage, energy and load | Energy-optimal path to minimise total range, payload and safe operation | Field tests | Regular rectangular area verified and simplified verification conditions | [14] | ||
| Multi-UAV operation simultaneously | PSO | Minimising the total number of operation sorties, total return supply time, total time consumption, supply time interval and total boundary return points | Algorithm simulation and comparison based on the prescription map and actual plot features | Based on the nominal spray swath and lack of verifications | [15] | |
| Optimal probability, GT, artificial potential field, etc. | Path coverage and formation control strategy for complex polygonal regions with obstacles | Complex regions and formation control involved | Based on the nominal spray swath and lack of verifications | [16] | ||
| Collaborative spray strategies | Multi-UAV operation simultaneously | Autonomous control for multi-agent non-uniform spraying by the Heat Equation Driven Area Coverage | A multi-UAV non-uniform spraying control system combined with CFD fog spectrum and Dubins motion model | Novel thinking based on CFD results | Lack of field tests | [17] |
| Factors | Responses (Independent Variables) | |||||
|---|---|---|---|---|---|---|
| CV | Nd | |||||
| KW_H (df = 3) | p-Value K-W | Significance | KW_H (df = 3) | p-Value K-W | Significance | |
| Speed v | 13.1227 | 0.00438 | ** | 7.4475 | 0.0589 | ns |
| Reference UAV Height h | 4.6041 | 0.203 | ns | 12.6688 | 0.00541 | ** |
| Relative Distance between Front and Back Δx | 7.4161 | 0.0598 | ns | 4.0697 | 0.254 | ns |
| Relative Distance in Horizontal Δy | 3.1668 | 0.366 | ns | 9.8417 | 0.02 | * |
| Relative Height between the UAVs Δh | 12.0595 | 0.00718 | ** | 7.1765 | 0.0665 | ns |
| Models | Variables | p-Value > |t| | Coefficient |
|---|---|---|---|
| β1 | 1.32027 × 10⁻²⁴ *** | — | |
| v | 0.004357689 ** | −0.071719234 | |
| Δh | 0.182649286 | — | |
| v2 | 0.013366593 * | 0.104236158 | |
| Δh2 | 0.034364246 * | 0.089058887 | |
| v·Δh | 0.230381292 | — | |
| h | 0.000865575 *** | 0.2528 | |
| Δy | 0.056713162 | −0.1440 | |
| h2 | 0.977033137 | — | |
| Δy2 | 0.209835348 | — | |
| h·Δy | 0.012747849 * | 0.2533 |
| Relative Horizontal Distance Δy | Synchronous vs. Asynchronous Nd | Synchronous vs. Asynchronous CV | ||||||||
|---|---|---|---|---|---|---|---|---|---|---|
| Top-Layer Nd | Middle-Layer Nd | Bottom-Layer Nd | ||||||||
| Magnitude Size | Magnitude Size | Magnitude Size | Magnitude Size | Magnitude Size | ||||||
| 4 m | Syn < Asy | 0.368 | Syn < Asy | 0.174 | Syn < Asy | 0.583 | Syn > Asy | 0.583 | Syn < Asy | 0.003 (**) |
| 5 m | Syn < Asy | 0.011 (*) | Syn < Asy | 0.024 (*) | Syn < Asy | 0.011 (*) | Syn < Asy | 0.009 (**) | Syn > Asy | 0.867 |
| 6 m | Syn < Asy | 0 (*) | Syn < Asy | 0.006 (*) | Syn < Asy | 0 (*) | Syn < Asy | 0 (*) | Syn < Asy | 0.671 |
| 7 m | Syn < Asy | 0 (*) | Syn < Asy | 0 (*) | Syn < Asy | 0 (*) | Syn < Asy | 0 (*) | Syn > Asy | 0.15 |
| Relative Horizontal Distance Δy | Synchronous vs. Asynchronous Nd | Synchronous vs. Asynchronous CV | ||||||||
|---|---|---|---|---|---|---|---|---|---|---|
| Top-Layer Nd | Middle-Layer Nd | Bottom-Layer Nd | ||||||||
| Magnitude Size | Magnitude Size | Magnitude Size | Magnitude Size | Magnitude Size | ||||||
| 4 m | Syn < Asy | 0.195 | Syn < Asy | 0.195 | Syn < Asy | 0.195 | Syn < Asy | 0.25 | Syn < Asy | 0.219 |
| 5 m | Syn < Asy | 0.029 (*) | Syn < Asy | 0.041 (*) | Syn < Asy | 0.029 (*) | Syn < Asy | 0.129 | Syn < Asy | 0.625 |
| 6 m | Syn < Asy | 0.032 (*) | Syn > Asy | 0.488 | Syn < Asy | 0.040 (*) | Syn < Asy | 0.031 (*) | Syn < Asy | 0.488 |
| 7 m | Syn < Asy | 0.0003 (***) | Syn < Asy | 0.0003 (***) | Syn < Asy | 0.001 (***) | Syn < Asy | 0.0003 (***) | Syn > Asy | 0.489 |
| Spray Mode | Effect Differences in Nd | Effect Differences in CV | |||||||||||||||
|---|---|---|---|---|---|---|---|---|---|---|---|---|---|---|---|---|---|
| Syn (A) | Asy (B) | Lin (C) | Δy | GA | GB | ||||||||||||
| A | B | C | 4 | 108.003 | 29.699 | 47.685 | −0.725 | −0.558 | 0.087 | 0.144 | 0.416 | 0.294 | 0.522 | 0.292 | −0.256 | 0.279 | 0.381 |
| A | B | C | 5 | 98.511 | 29.805 | 56.658 | −0.697 | −0.425 | 0.066 | 0.540 | 0.497 | 0.725 | 0.627 | −0.459 | −0.262 | 0.322 | 0.741 |
| A | B | C | 6 | 102.886 | 13.593 | 60.303 | −0.868 | −0.414 | 0.0005 | 0.106 | 0.685 | 0.534 | 0.499 | 0.219 | 0.270 | 0.120 | 0.093 |
| A | B | C | 7 | 80.450 | 20.403 | 54.790 | −0.746 | −0.319 | 0.172 | 0.838 | 0.353 | 0.484 | 0.372 | −0.373 | −0.055 | 0.182 | 0.937 |
Disclaimer/Publisher’s Note: The statements, opinions and data contained in all publications are solely those of the individual author(s) and contributor(s) and not of MDPI and/or the editor(s). MDPI and/or the editor(s) disclaim responsibility for any injury to people or property resulting from any ideas, methods, instructions or products referred to in the content. |
© 2026 by the authors. Licensee MDPI, Basel, Switzerland. This article is an open access article distributed under the terms and conditions of the Creative Commons Attribution (CC BY) license.
Share and Cite
Yang, S.; Zhai, S.; Yu, X.; Liu, W.; Zheng, Y.; Zhao, H.; Feng, H.; Wang, H.; Xu, W. Synchronous Spray Effect Based on Dual Plant-Protection UAV Collaboration in Corn Fields. Agronomy 2026, 16, 292. https://doi.org/10.3390/agronomy16030292
Yang S, Zhai S, Yu X, Liu W, Zheng Y, Zhao H, Feng H, Wang H, Xu W. Synchronous Spray Effect Based on Dual Plant-Protection UAV Collaboration in Corn Fields. Agronomy. 2026; 16(3):292. https://doi.org/10.3390/agronomy16030292
Chicago/Turabian StyleYang, Shenghui, Shuyuan Zhai, Xiangye Yu, Weihong Liu, Yongjun Zheng, Hangxing Zhao, Han Feng, Haoyu Wang, and Wenbo Xu. 2026. "Synchronous Spray Effect Based on Dual Plant-Protection UAV Collaboration in Corn Fields" Agronomy 16, no. 3: 292. https://doi.org/10.3390/agronomy16030292
APA StyleYang, S., Zhai, S., Yu, X., Liu, W., Zheng, Y., Zhao, H., Feng, H., Wang, H., & Xu, W. (2026). Synchronous Spray Effect Based on Dual Plant-Protection UAV Collaboration in Corn Fields. Agronomy, 16(3), 292. https://doi.org/10.3390/agronomy16030292