3.2. Data Imbalance and Mitigation Techniques
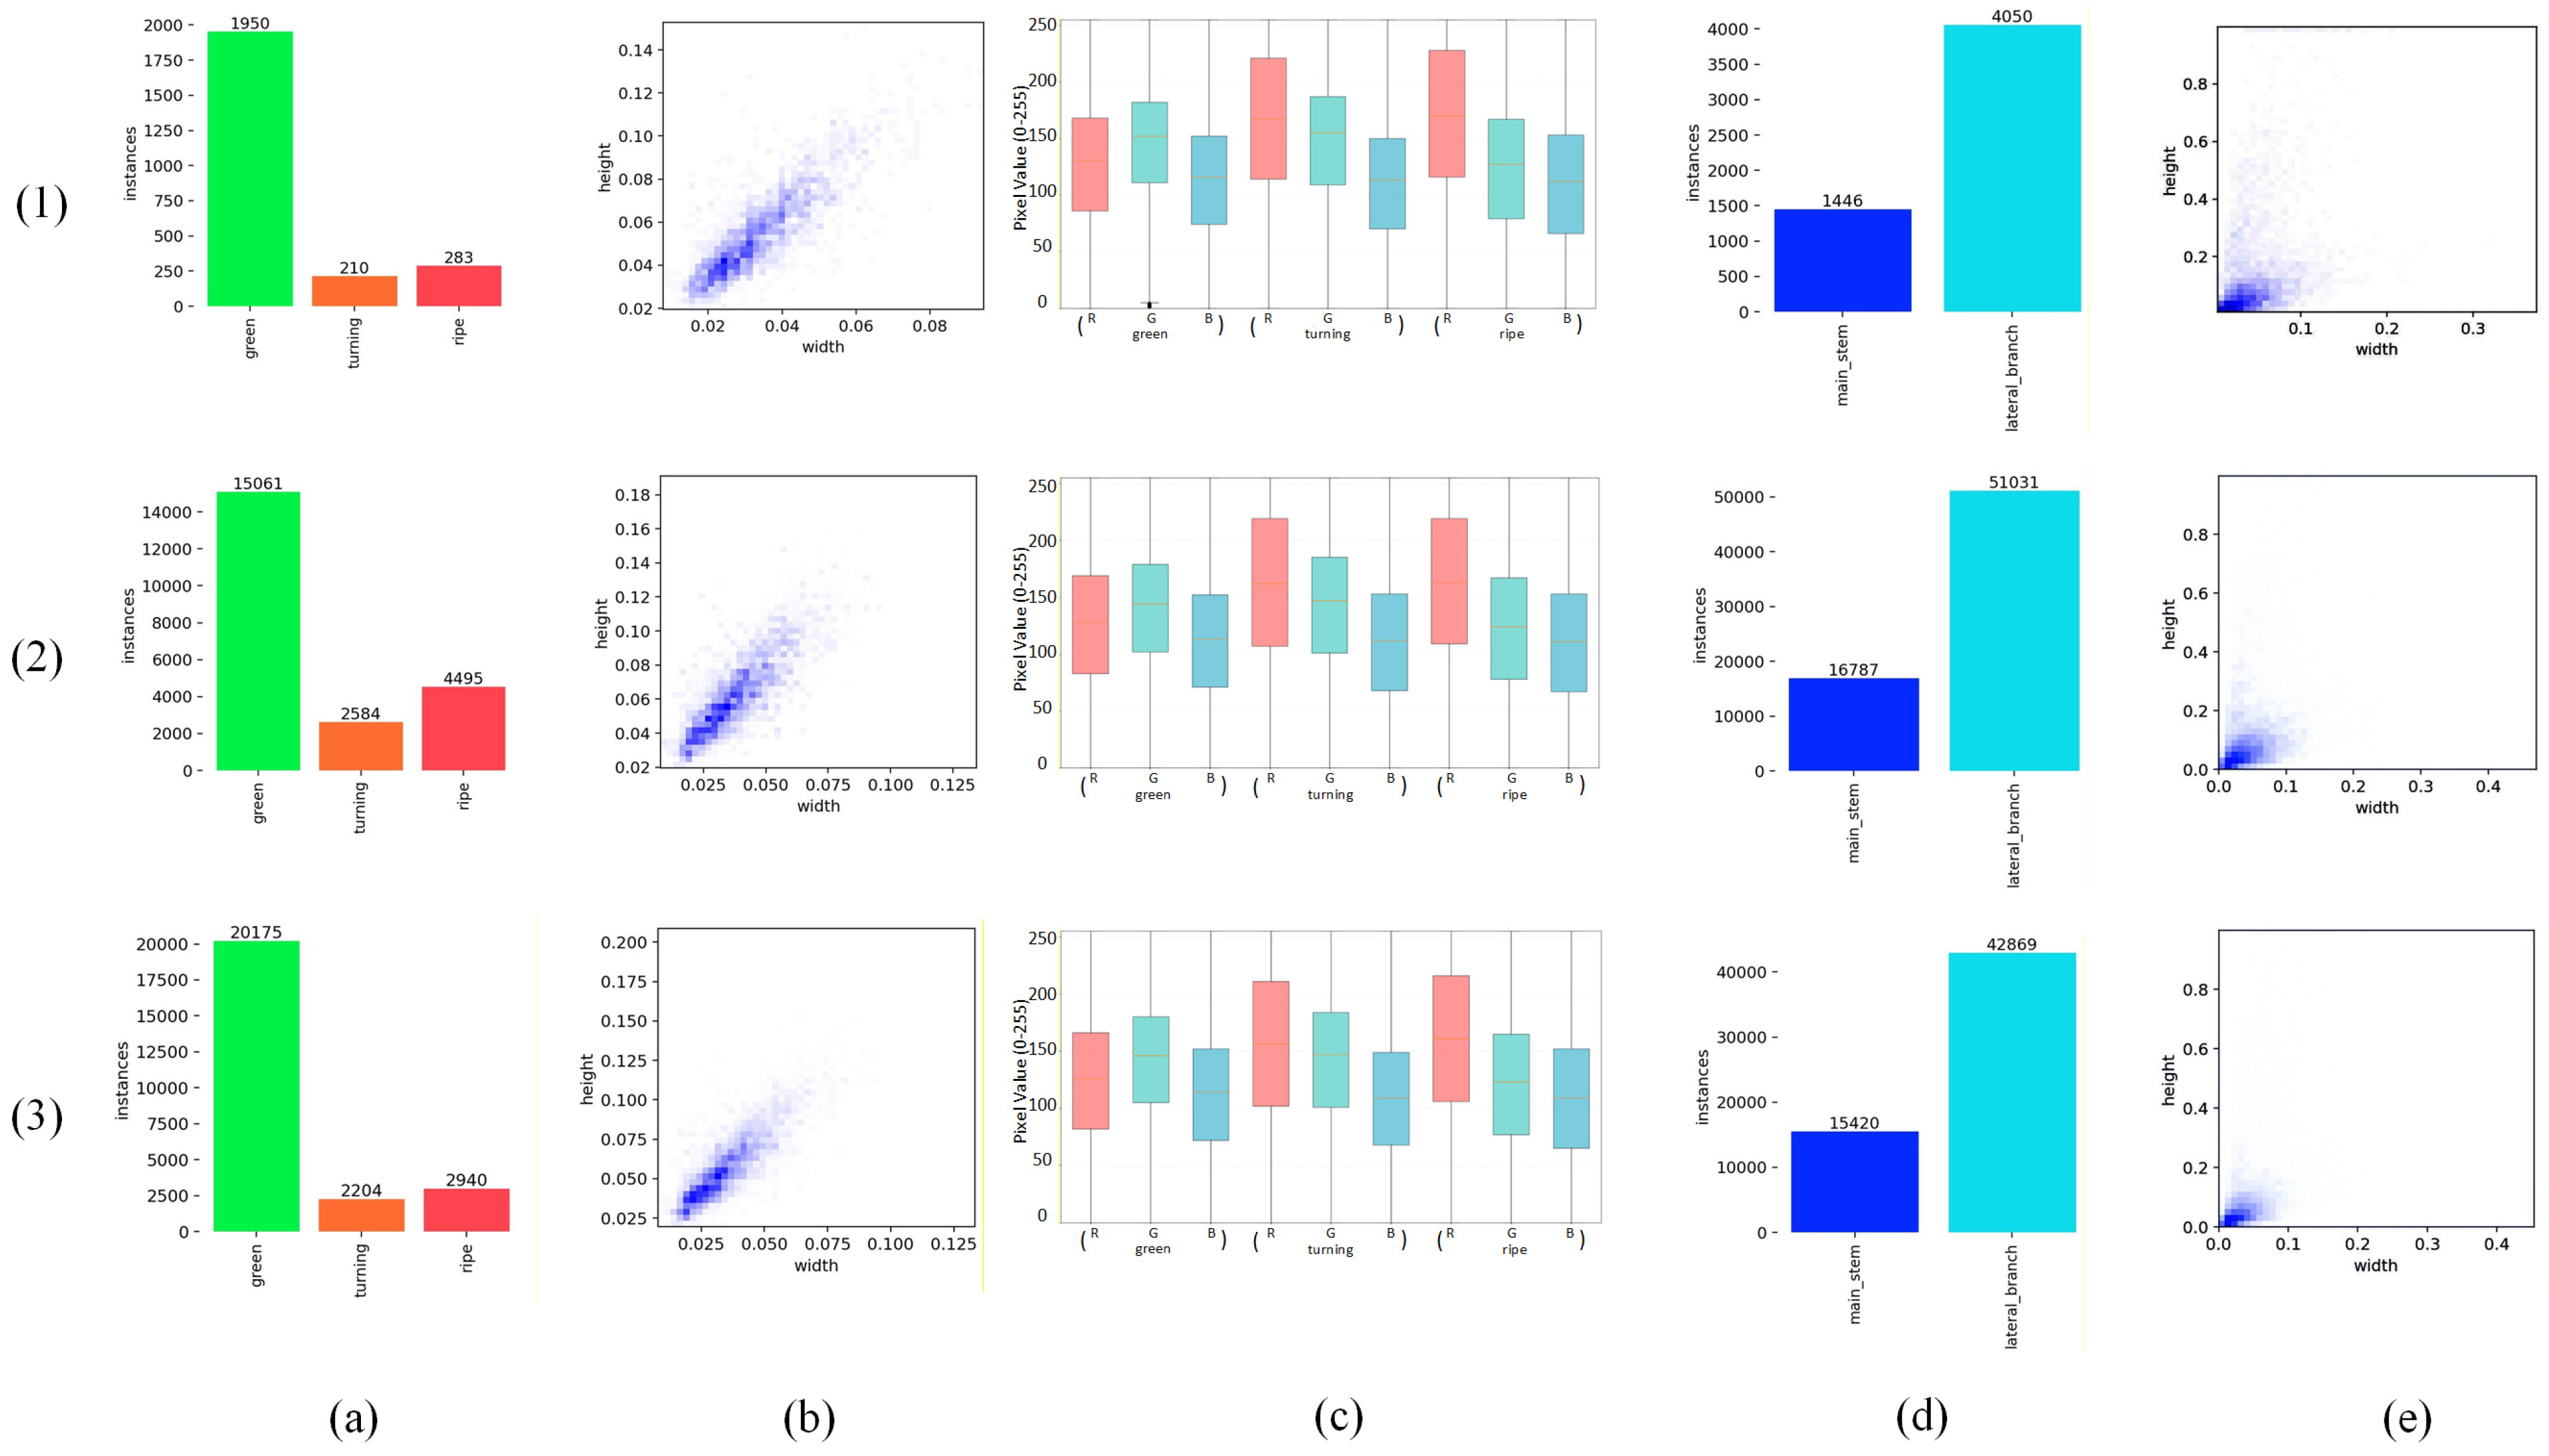
The original dataset contains 1950 instances of green tomatoes, 210 instances of turning tomatoes, and 283 instances of ripe tomatoes. The presence of unripe fruits is more pronounced. In general, the occurrence of tomato instances is limited, and compared to green tomatoes, the number of ripe and turning tomato instances is smaller. This necessitates dataset augmentation to expand the data. Two data augmentation strategies were employed. The first utilized oversampling, selecting images of turning and ripe tomatoes for augmentation. This expanded the number of images primarily containing turning and ripe tomatoes by 20 times, while increasing the number of images primarily containing green tomatoes by 5. The second augmented the entire dataset by a factor of 10.
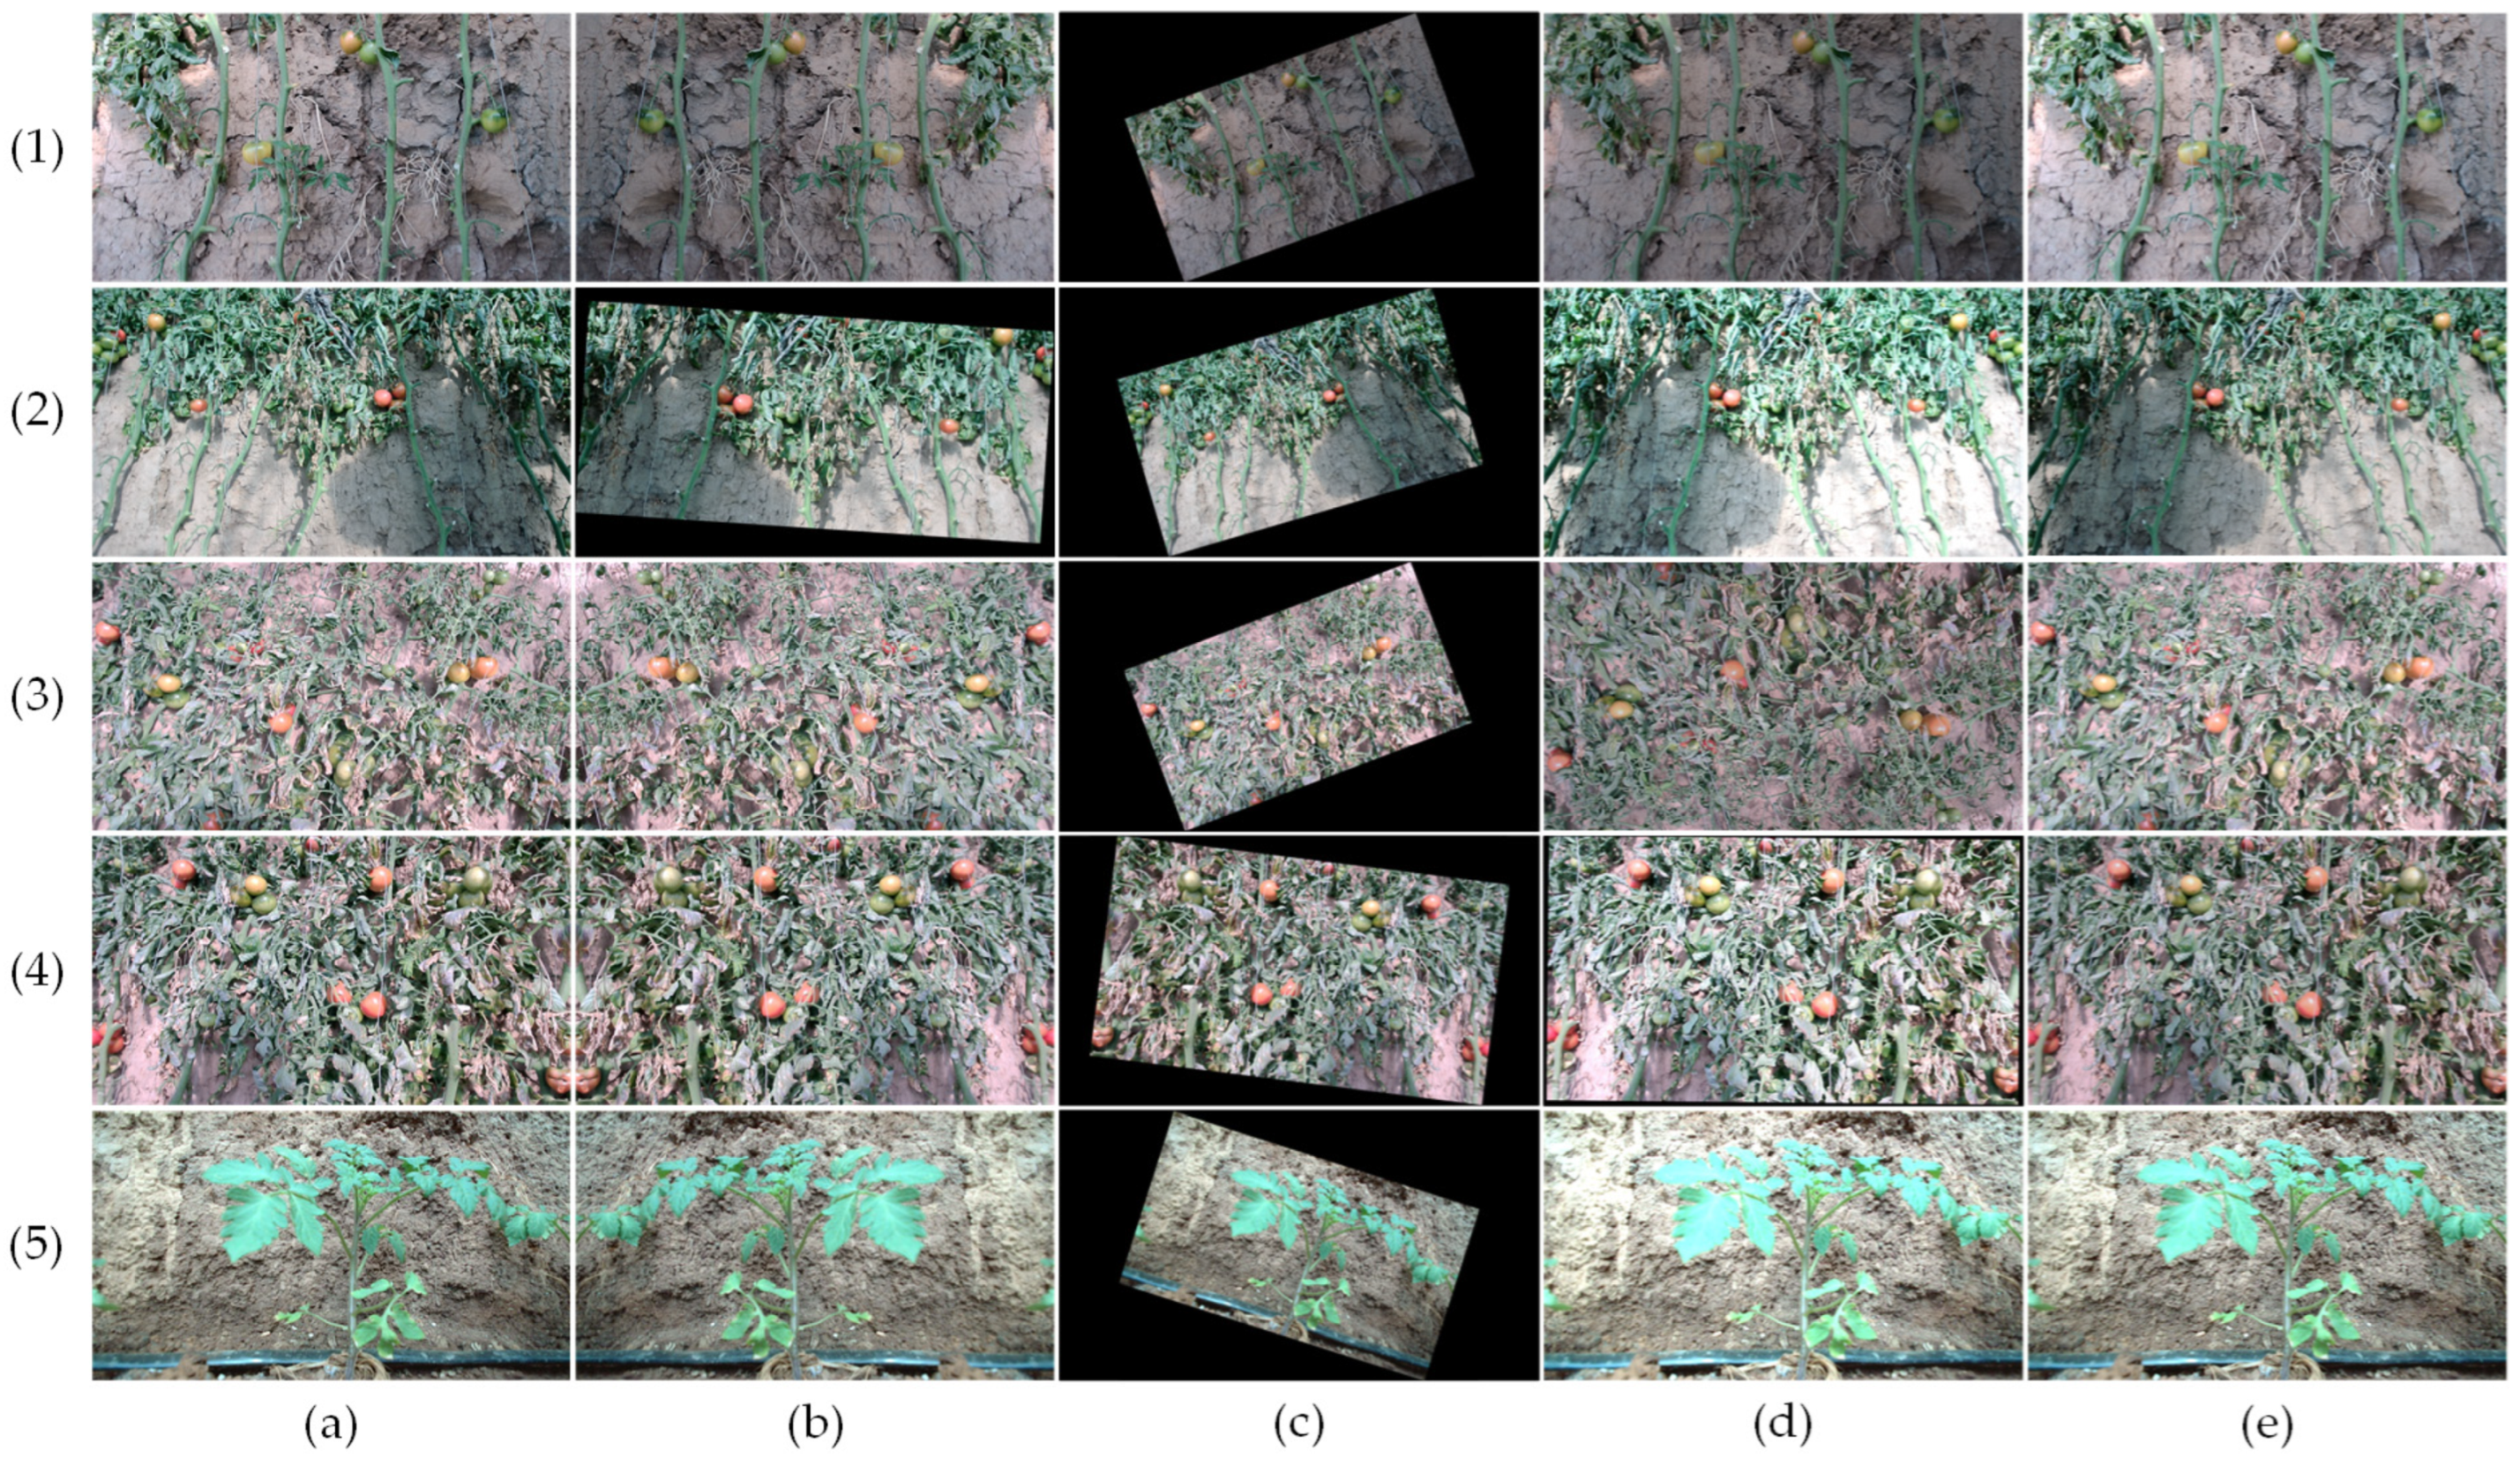
During the process of dataset augmentation, the enhancement methods employed, as delineated in
Section 2.2, encompassed horizontal flipping, vertical flipping, rotation, scaling, cropping, brightness adjustment, Gaussian blur, and Gaussian noise. The specific enhancement methods and their corresponding parameters are illustrated in
Table 5.
The fruit of the tomato plant is typically spherical or elliptical in shape. An expanded range of rotation angles could enhance data diversity; however, it is imperative to exercise caution and avoid excessive rotation, as this may result in the alteration of the orientation of the main stem and lateral branches. Consequently, the rotation angle is set to ±30°. The scale range has been set to 0.8–1.2, ensuring that the pixel proportion of instances aligns with the original dataset distribution. Given the relatively diminutive mask pixel proportions and slender shapes exhibited by certain lateral branches, an excessively broad crop range would result in the discarding of a substantial number of valid pixels. The crop range is set to 0.7–1.0 to prevent damaging segmentation instances and masks. The brightness setting is adjusted to a range of 0.6–1.4. Given that the width-to-height ratio of tomatoes and some lateral branches ranges from 0.02 × 0.02 to 0.08 × 0.06, the Gaussian blur kernel size range is set to 3–5. The range of the Gaussian noise variance is set to 5–30, thereby facilitating the application of localized blurring and noise. During the data augmentation process, two–three methods are randomly selected to transform the same image.
A comparison of the distributions of classes, bounding boxes, and masks between the original training set and the augmented training set was conducted to assess the similarity between the augmented data and the original data distributions. The results of this study are presented in
Figure 10.
As demonstrated in
Figure 10, the ratios of green, turning, and ripe after expansion using Strategy 1 are 15,061:2584:4495. The ratios subsequent to expansion employing Strategy 2 are 20,175:2204:2940. Observation (b) indicates that the overall height and width distributions of bounding boxes subsequent to expansion by both strategies demonstrate a resemblance to those of the original training set, with heights ranging from [0.02, 0.08] and widths from [0.02, 0.06], exhibiting a positive correlation overall. Given the high degree of similarity in the overall appearance and texture of tomatoes, color information becomes a pivotal factor in their classification. Observation (c) demonstrates that following the utilization of the brightness-enhanced dataset, the aggregate RGB channel distributions for green, turning, and ripe tomato targets exhibit a high degree of similarity, thereby ensuring consistency in color distribution across the augmented dataset. A quantitative analysis of the mask distribution of segmented instances in (d) reveals that the ratio of main stem to lateral branches remains approximately 2.5:7.5, indicating a relatively stable proportion between these two components. Following the implementation of ±30° rotation, observing (e) shows that the width and height distribution of the augmented masks generally aligns with the original training set.
The baseline model YOLOv8n was trained to compare the impact of different strategies on various metrics. Despite the augmentation of the dataset, which led to an increase in both the number and diversity of instances, the overall sample distribution remained imbalanced. For instance, green tomatoes continued to outnumber both turning and ripe tomatoes. Consequently, the implementation of dynamic data augmentation techniques during the training process led to a notable enhancement in the model’s generalization capability and a substantial reduction in category imbalance. The analysis was conducted across multiple dimensions, including precision (P), recall (R), mAP
50, mAP
50–95 for tomato detection, and mIoU for instance segmentation, and the results are illustrated in
Table 6.
After expanding the dataset, YOLOv8n was employed as the baseline model for testing to evaluate the performance of the expanded datasets under different strategies. The analysis was conducted across multiple dimensions, including precision (P), recall (R), mAP
50, mAP
50–95 for tomato detection, and mIoU for instance segmentation, and the results are illustrated in
Table 7.
Training data enhanced using Strategy 1 are highly recall-friendly, achieving an overall recall rate of 86.4%, with recall rates of 88.2% and 91.2% for turning and ripe tomatoes, respectively. The efficacy of Strategy 1, which involves the oversampling of mature tomatoes, was demonstrated by the mAP50 and mAP50–95, which reached 95.5% and 66.4%, respectively. The application of Strategy 2 generally yields superior outcomes in precision metrics when compared with Strategy 1. For mAP50, Strategy 2 attains 91.7% for green tomatoes and 93.1% for turning tomatoes. In mAP50–95, it achieves 53.0% for green tomatoes and 63.3% for turning tomatoes, surpassing Strategy 1. In the concurrent segmentation task, Strategy 2 achieved mIoU scores of 85.0% for main stems and 67.4% for lateral branches, thereby demonstrating superior performance in both categories when compared to Strategy 1. In summary, Strategy 1 prioritizes the recall, mAP50, and mAP50–95 metrics for accurately predicting the ripeness of tomatoes by increasing their representation in the dataset. Conversely, Strategy 2 exhibited a marked predilection for predicting precision, mAP50, and mAP50–95 for green and turning tomatoes. When taking into account the mIoU metric for segmentation tasks, Strategy 2 emerges as a more balanced choice overall. Consequently, the dataset that was trained using Strategy 2 is selected for further analysis.
3.3. Ablation Experiments
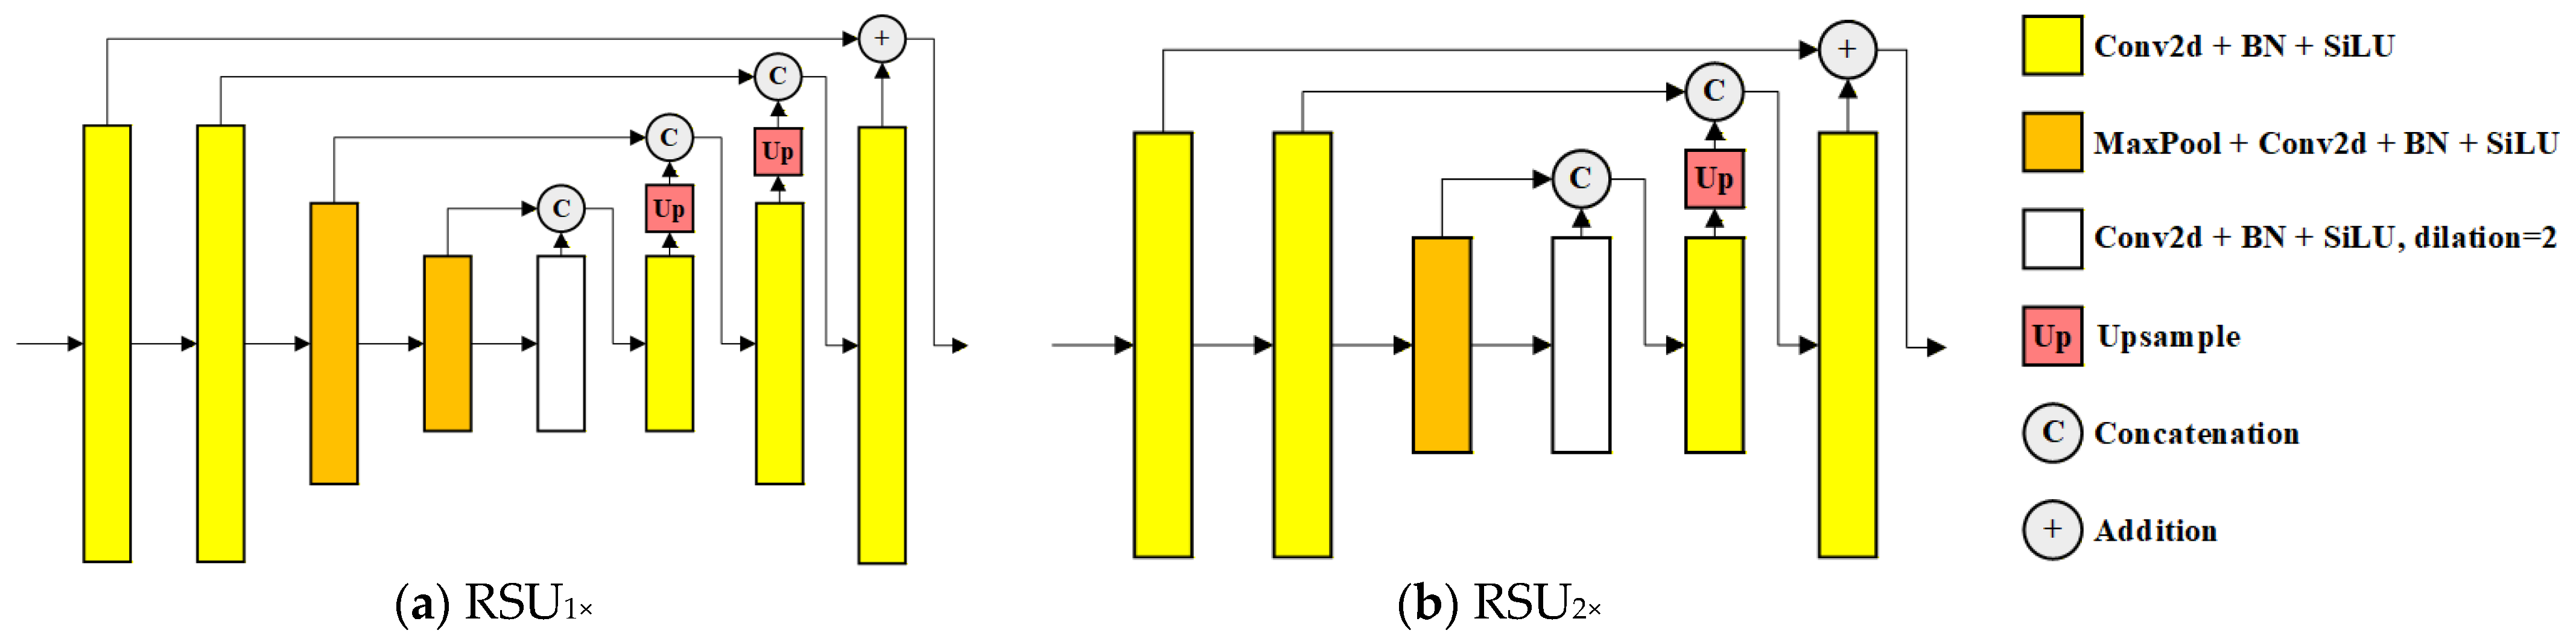
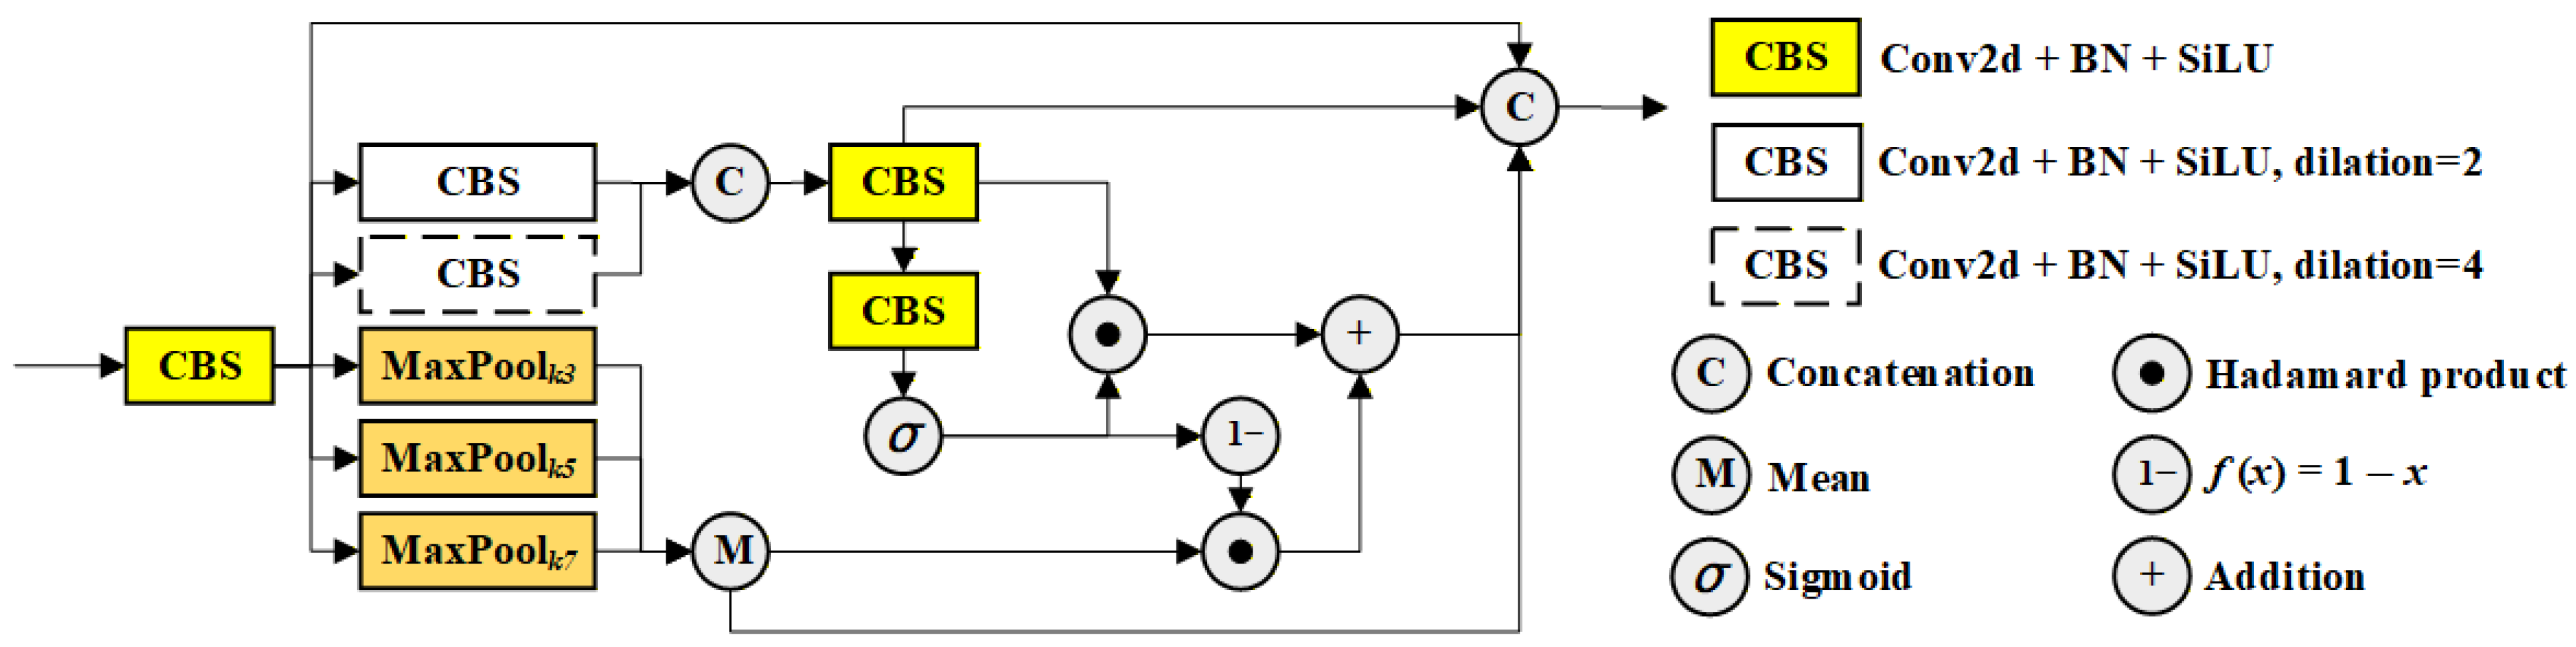
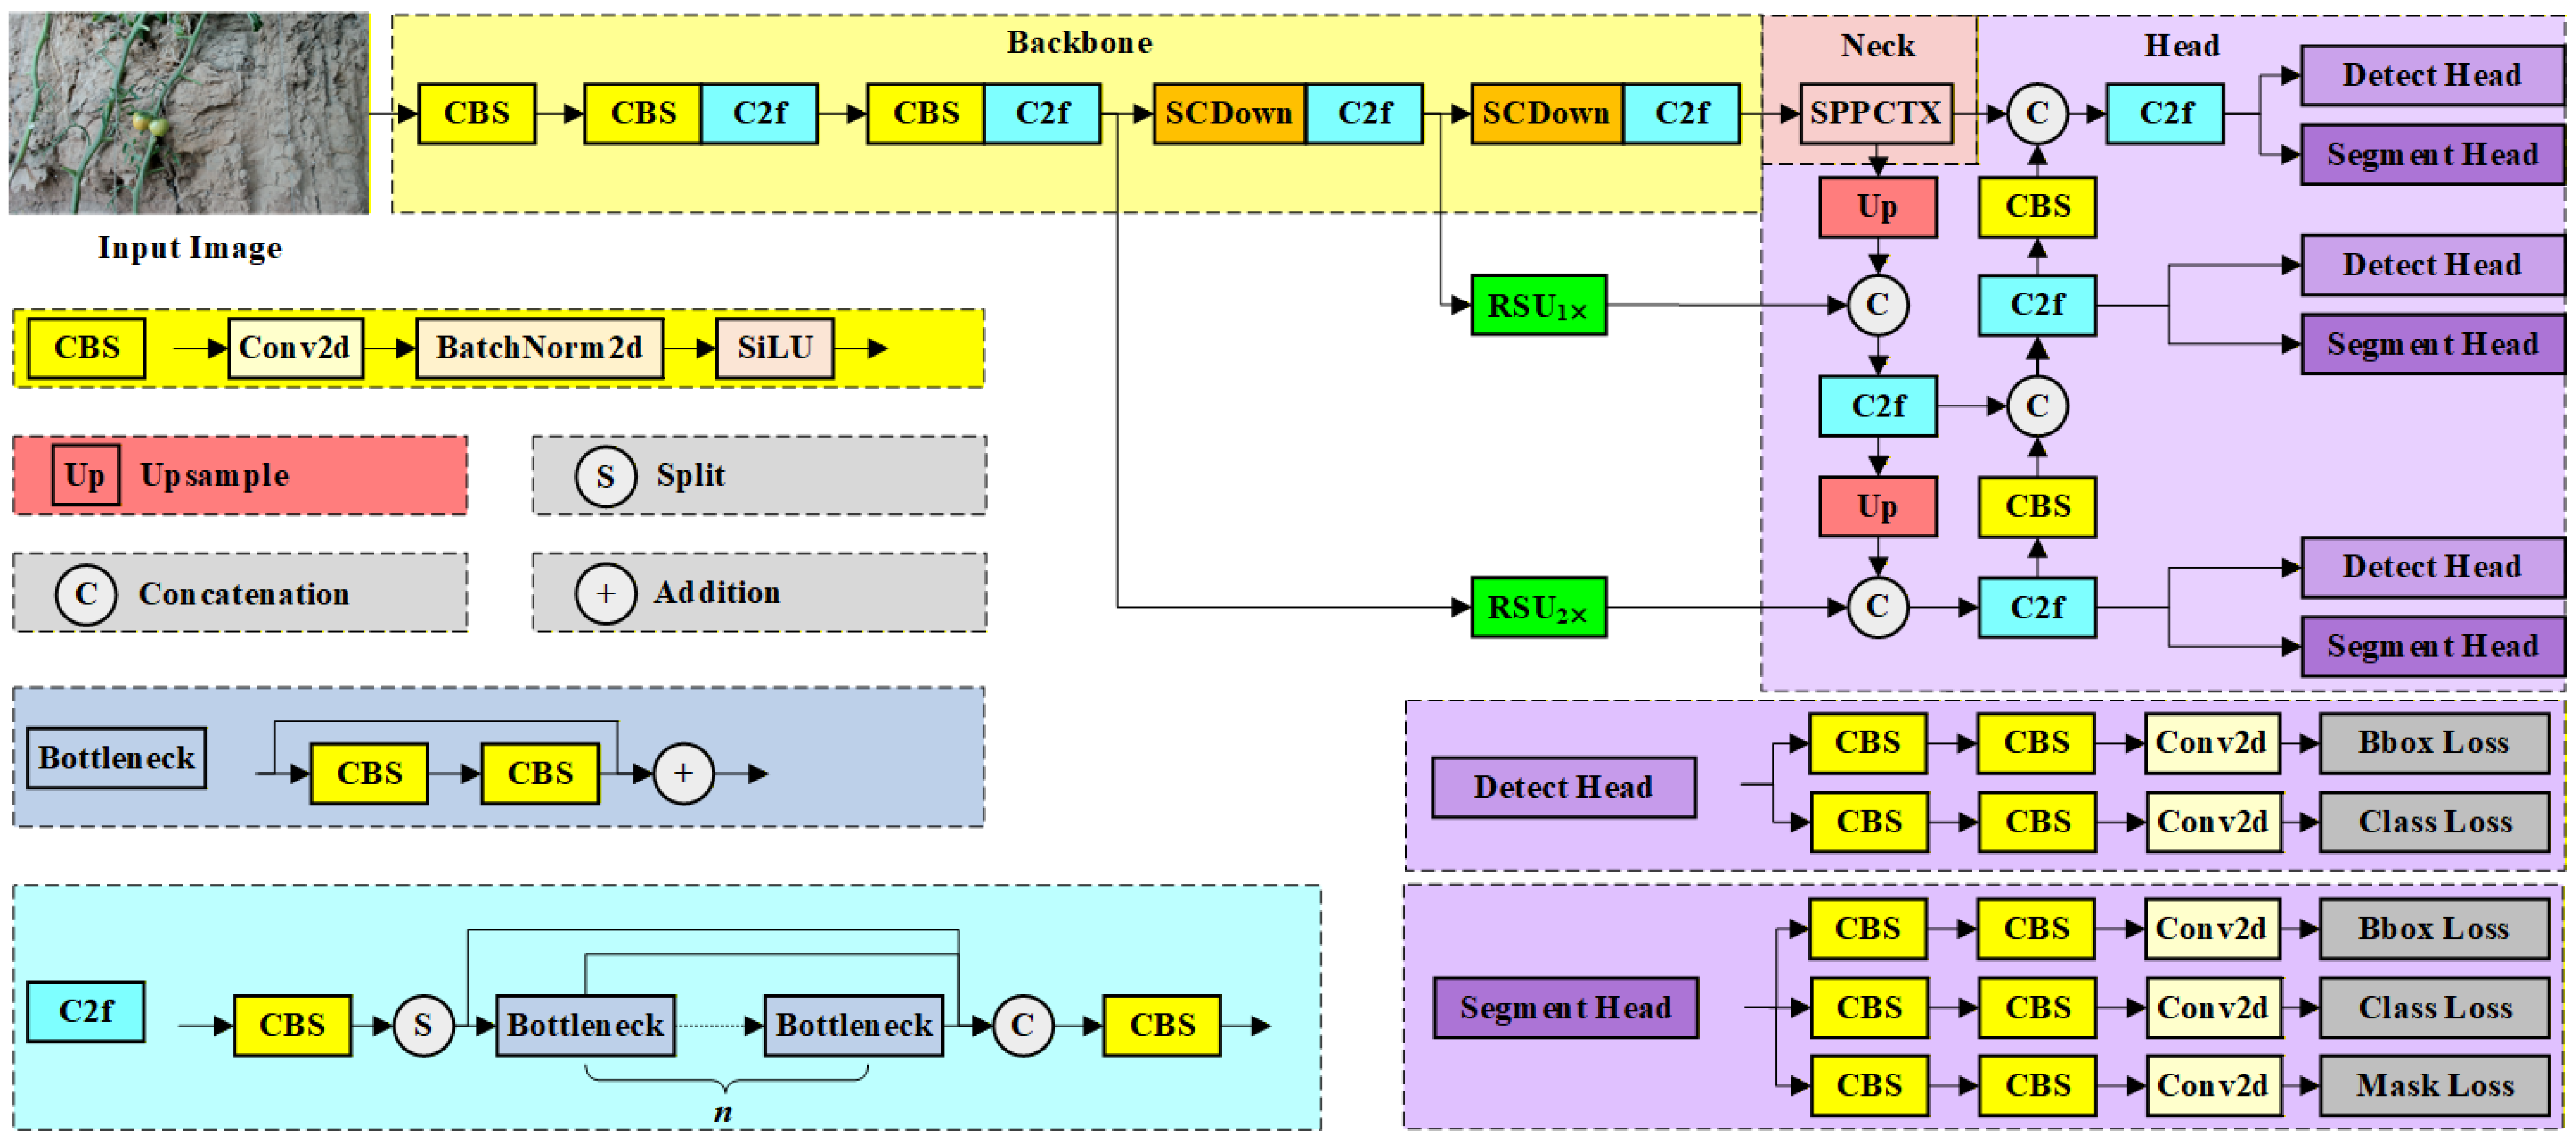
To investigate the impact of RSU, SPPCTX, and SCDown on model performance, eight comparative experiments were designed with YOLOv8n as the baseline. The evaluation indicators included precision (P), recall (R), mAP
50, mAP
50–95 for tomato detection, mIoU for instance segmentation, and inference speed. In order to mitigate hardware load fluctuations, the inference speed is reported as the average of ten repeated experiments, rounded to two decimal places. The results of this study are illustrated in
Table 8.
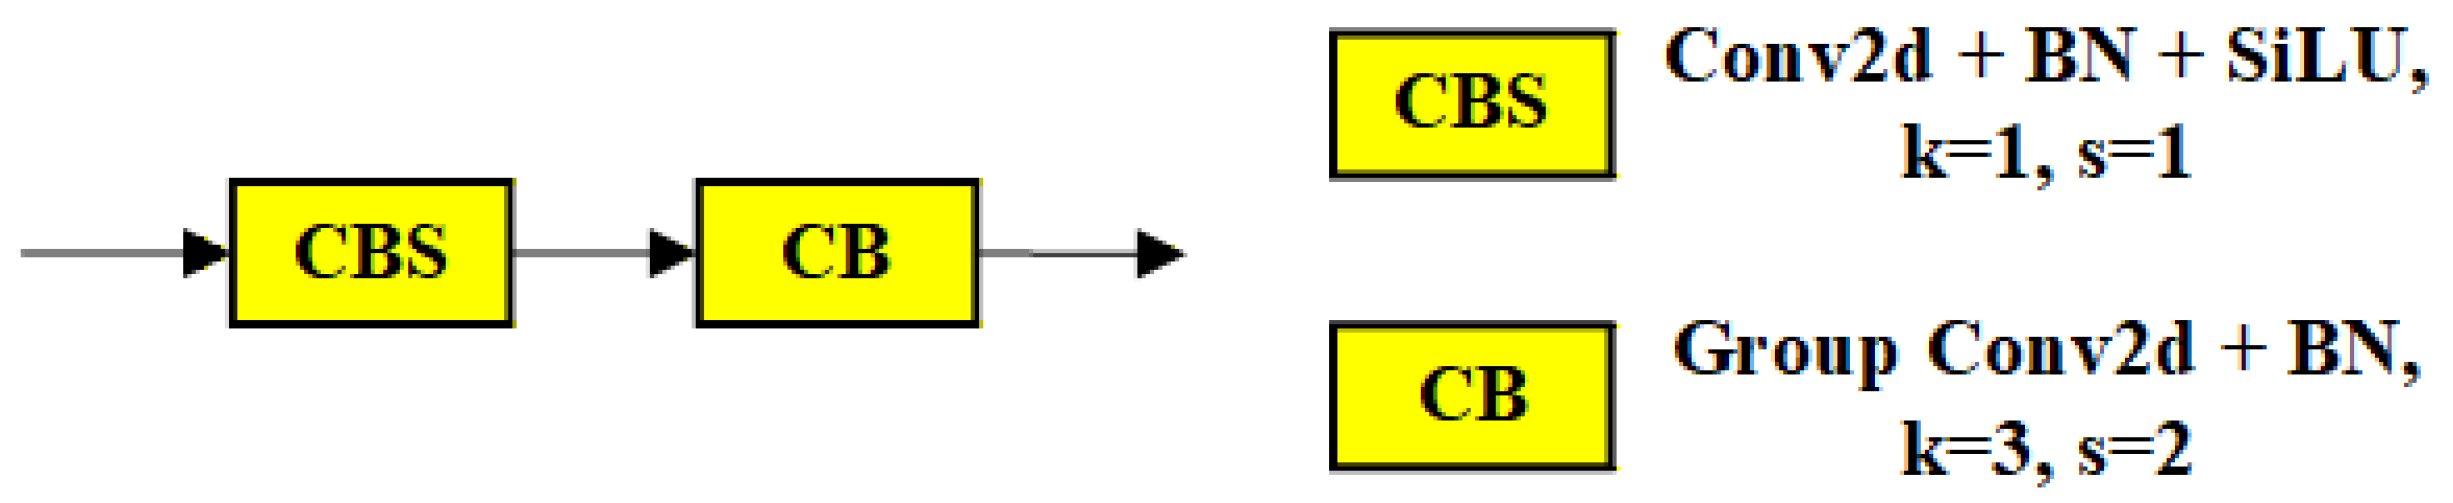
Among single-module performances, to integrate multi-scale instance features and enhance the representational power of tomatoes, stems and branches, the RSU module (Id = 2) was employed, achieving a precision of 94.8% and an mIoU of 77.6%, the precision, mAP50–95, and mIoU value increased by 2.4%, 0.5%, 0.1%, and 1.4%, though recall and mAP50 experienced slight reductions. The SPPCTX module (Id = 3) enhanced mAP50–95 to 61.8% and optimized inference speed to 7.54 ms, thereby attaining the optimal performance across all experiments. On the one hand, the SPPCTX enhances the system’s robustness toward tomato targets, elevating the mAP50–95 and mIoU. On the other hand, the substitution of traditional convolutions with dilated convolutions has been demonstrated to reduce computational complexity. The SCDown module (Id = 4) demonstrated a significant enhancement in recall, achieving 88.7%, and in mIoU, reaching 78.0%. These outcomes were the most optimal across all experimental iterations. However, the accuracy of tomato detection did not reach 90%, suggesting the potential for enhancement. With respect to the configuration of modules, the combination of RSU and SCDown (Id = 6) yielded the maximum mAP50–95 of 62.0%. The combination of SPPCTX and SCDown (Id = 7) exhibited high recall (86.9%) and mIoU (77.9%), the recall, mAP50–95, and mIoU value increased by 2.0%, 0.9%, and 1.7%, The integration of SCDown and SPPCTX produces a more comprehensive array of features, facilitating the aggregation of context information to facilitate a more focused examination of the tomato target region. This reduction in background interference enhances target localization, thereby optimizing segmentation accuracy while maintaining high recall rates.
When all three were used in conjunction (Id = 8), precision (94.9%), and mAP50 (93.6%) achieved optimal values, while recall (85.0%) and mIoU (77.6%) ranked among the top three. Although mAP50–95 (60.9%) ranked fourth, 1.1% lower than the optimal value (Id = 6, 62.0%), it demonstrated a 1.1% improvement over the baseline model (59.8%). Compared to the baseline, the precision, recall, mAP50, mAP50–95, and mIoU value increased by 2.5%, 0.1%, 1.5%, 1.1%, and 1.4%. Furthermore, the inference speed of the three-module combination was 8.14 ms, which is comparable to the baseline model. This demonstrates that the three proposed improvement modules form an efficient synergistic complementary effect. Specifically, the structural optimization of the original model not only captures multidimensional feature flow information more accurately, significantly enhancing the model’s multi-scale feature extraction capability and feature fusion efficiency, but also effectively controls model complexity while improving core metrics such as tomato detection accuracy and stem–branch segmentation precision. The synergistic interaction among these three components collectively drives a comprehensive performance enhancement in tomato detection and stem–branch segmentation tasks.
In summary, the combination of three modules (Id = 8) achieves the optimal balance between accuracy and performance, demonstrating a clear advantage in detection accuracy and providing an effective reference for model structure optimization.
3.4. Performance Comparison and Analysis
3.4.1. Comparison with Foundational Models
To further evaluate the performance of YOLOP-Tomato, this study selected main-stream models for comparison, including Faster R-CNN, SSD, RT-DETR-l, YOLOv5n, YOLOv8n, YOLOv10n, and YO-LO11n. These models were trained under identical experimental environments and parameter conditions, and their performance was assessed using the test set. The results are illustrated in
Table 9.
As illustrated in
Table 9, Faster R-CNN, SSD, and RT-DETR-l represent classic object detection models. These models were utilized to execute the tomato detection task and were subsequently compared against the object detection metrics within the YOLOP-Tomato multi-task framework.
YOLOP-Tomato attained an optimal precision of 94.9%, signifying more precise classification decisions for tomatoes and a substantial reduction in false detection rates. The YOLOv10n model demonstrated the highest recall rate of 85.9%, while the YO-LO-Tomato model exhibited a recall of 85.0%, indicating a marginal difference of 0.9% between the two models. This observation underscores the efficacy of the YOLOv10n model in capturing features of tomatoes with notable precision. The two models demonstrate a high level of proficiency in reducing false negatives in the classification of tomatoes. This suggests that they are capable of comprehensive feature capture for tomatoes. YOLOP-Tomato attains an optimal mAP50 of 93.6%, signifying its superior performance. At mAP50–95, YOLOP-Tomato achieves a 60.9% success rate, placing it among the top three models. With regard to mIoU, YOLOP-Tomato achieves a leading score of 77.6%, signifying its proficiency in differentiating stem semantic information. This attribute renders it particularly well-suited for scenarios that demand precise segmentation, such as in agricultural contexts. In terms of FLOPs, YOLOP-Tomato consumes 16.9 G, reflecting increased computational overhead due to its three optimization modules. The model size is 9.6 MB, indicating that multi-task optimization introduces storage overhead but remains within the lightweight model category. YOLOP-Tomato demonstrates an inference speed of 8.14 ms, which generally meets real-time detection requirements.
In summary, YOLOP-Tomato offers a valuable trade-off between accuracy and efficiency.
3.4.2. Performance Evaluation on Tomato Ripeness Detection
To assess the efficacy of various models in the tomato detection task, a comparative analysis was conducted on the detection results for three distinct tomato ripeness stages: green, turning, and ripe. The evaluation metrics employed included precision (P), recall (R), and AP
50. The results are illustrated in
Table 10.
Among these, YOLOP-Tomato demonstrated exceptional precision, ranking first in the green (95.5%) and turning (93.5%) categories. Its ripe (95.7%) accuracy was second only to SSD (96.5%). This finding suggests that the model exhibits exceptional accuracy in tomato classification, effectively distinguishing between tomato and background. Concurrently, the capacity of model to accurately detect the onset of tomato turning is indicative of its aptitude for effectively mitigating the misclassification of turning fruit as green or ripe. YOLOP-Tomato demonstrated a recall rate of 91.2% for ripe tomatoes, the highest among all models, indicating the lowest false negative rate for ripe tomatoes. For turning tomatoes, the recall reached 88.0%, placing it in third position overall. However, it is important to note that the recall for green tomatoes was 75.8%, indicating a substantial opportunity for enhancement in this particular category. YOLOP-Tomato attained an AP50 of 91.9% for green stage tomatoes, placing second behind YOLOv5n with an AP50 of 93.2%. For turning stage tomatoes, the AP50 reached 93.6%, a mere 0.2% behind the top-performing YOLO11n. The model demonstrated its superiority by attaining the maximum AP50 of 95.3% for ripe stage tomatoes, thereby evidencing its remarkable overall detection performance across AP50 metrics.
In summary, YOLOP-Tomato demonstrated optimal performance in terms of accuracy and detection capability for ripe tomatoes, thereby evidencing its efficacy in reducing false positives in fruit detection.
3.4.3. Performance Evaluation on Main Stem–Lateral Branch Segmentation
The accuracy of the segmentation of the aforementioned models was compared to evaluate their performance on the segmentation task. The segmentation targets encompassed the main stem and lateral branches of tomato plants. The evaluation metrics employed included mIoU and IoU, as illustrated in
Table 11.
YOLOP-Tomato demonstrated the highest pixel-level accuracy for main stem and lateral branch segmentation on both mIoU and IoU metrics. Specifically, the mIoU reached 77.6%, while the IoU for main stems and lateral branches was 85.1% and 70.1%, respectively. Due to their thinner diameter and smaller pixel coverage relative to the main stem, lateral branches present greater segmentation challenges, resulting in lower accuracy compared to the main stem. The YOLOv10n and YOLO11n models exhibited performance that was marginally inferior to that of the YOLO-Tomato model, thereby positioning them in the second tier. It is noteworthy that YOLOP-Tomato has been shown to achieve an average accuracy enhancement of 0.65% for the main stem and an average accuracy improvement of 2.05% for the lateral branches. This finding indicates that YOLOP-Tomato exhibits superior feature extraction capabilities while concurrently and efficiently aggregating multi-scale features across diverse contexts. It is noteworthy that the segmentation accuracy for lateral branches exceeds 70%, indicating a superior performance in segmenting minute lateral branches.
In summary, YOLOP-Tomato demonstrates superior performance in comparison to other models across all metrics, thereby substantiating the efficacy of the optimized model in enhancing segmentation accuracy.
3.4.4. Comparison with Different Model Structure
The framework employed in this research is an extension of YOLO structure. In order to investigate the impact of different model architectures on performance, the multi-task detection and segmentation head was retained while replacing the model architecture with that of RT-DETR. This facilitated a comparative analysis of the performance implications of YOLO and RT-DETR architectures, as illustrated in
Table 12.
Table 12 illustrates the performance of two model architectures—RT-DETR and YOLOP-Tomato across object detection and segmentation tasks, where (n) is nano and (l) is large scales. Among the aforementioned methods, RT-DETR (l) attains the highest level of precision, with a score of 95.7%, while YOLOP-Tomato (n) achieves an precision of 94.9%, placing second in terms of precision. The YOLOP-Tomato model demonstrates a recall rate of 85.0%, which is significantly higher than the recall rates of other models. In mAP
50, YOLOP-Tomato achieves a leading performance with 93.6%. The results indicated that RT-DETR (l) achieved 93.2%. RT-DETR (l) demonstrated the highest mAP
50–95 at 62.8%. In the context of segmentation tasks, RT-DETR (n) and RT-DETR (l) attained the highest score of 80.0%. The RT-DETR series exhibited a high degree of segmentation precision, with an average of approximately 80.0% accuracy, thereby underscoring the RT-DETR model architecture’s aptitude for segmentation tasks.
3.5. Visualization and Analysis
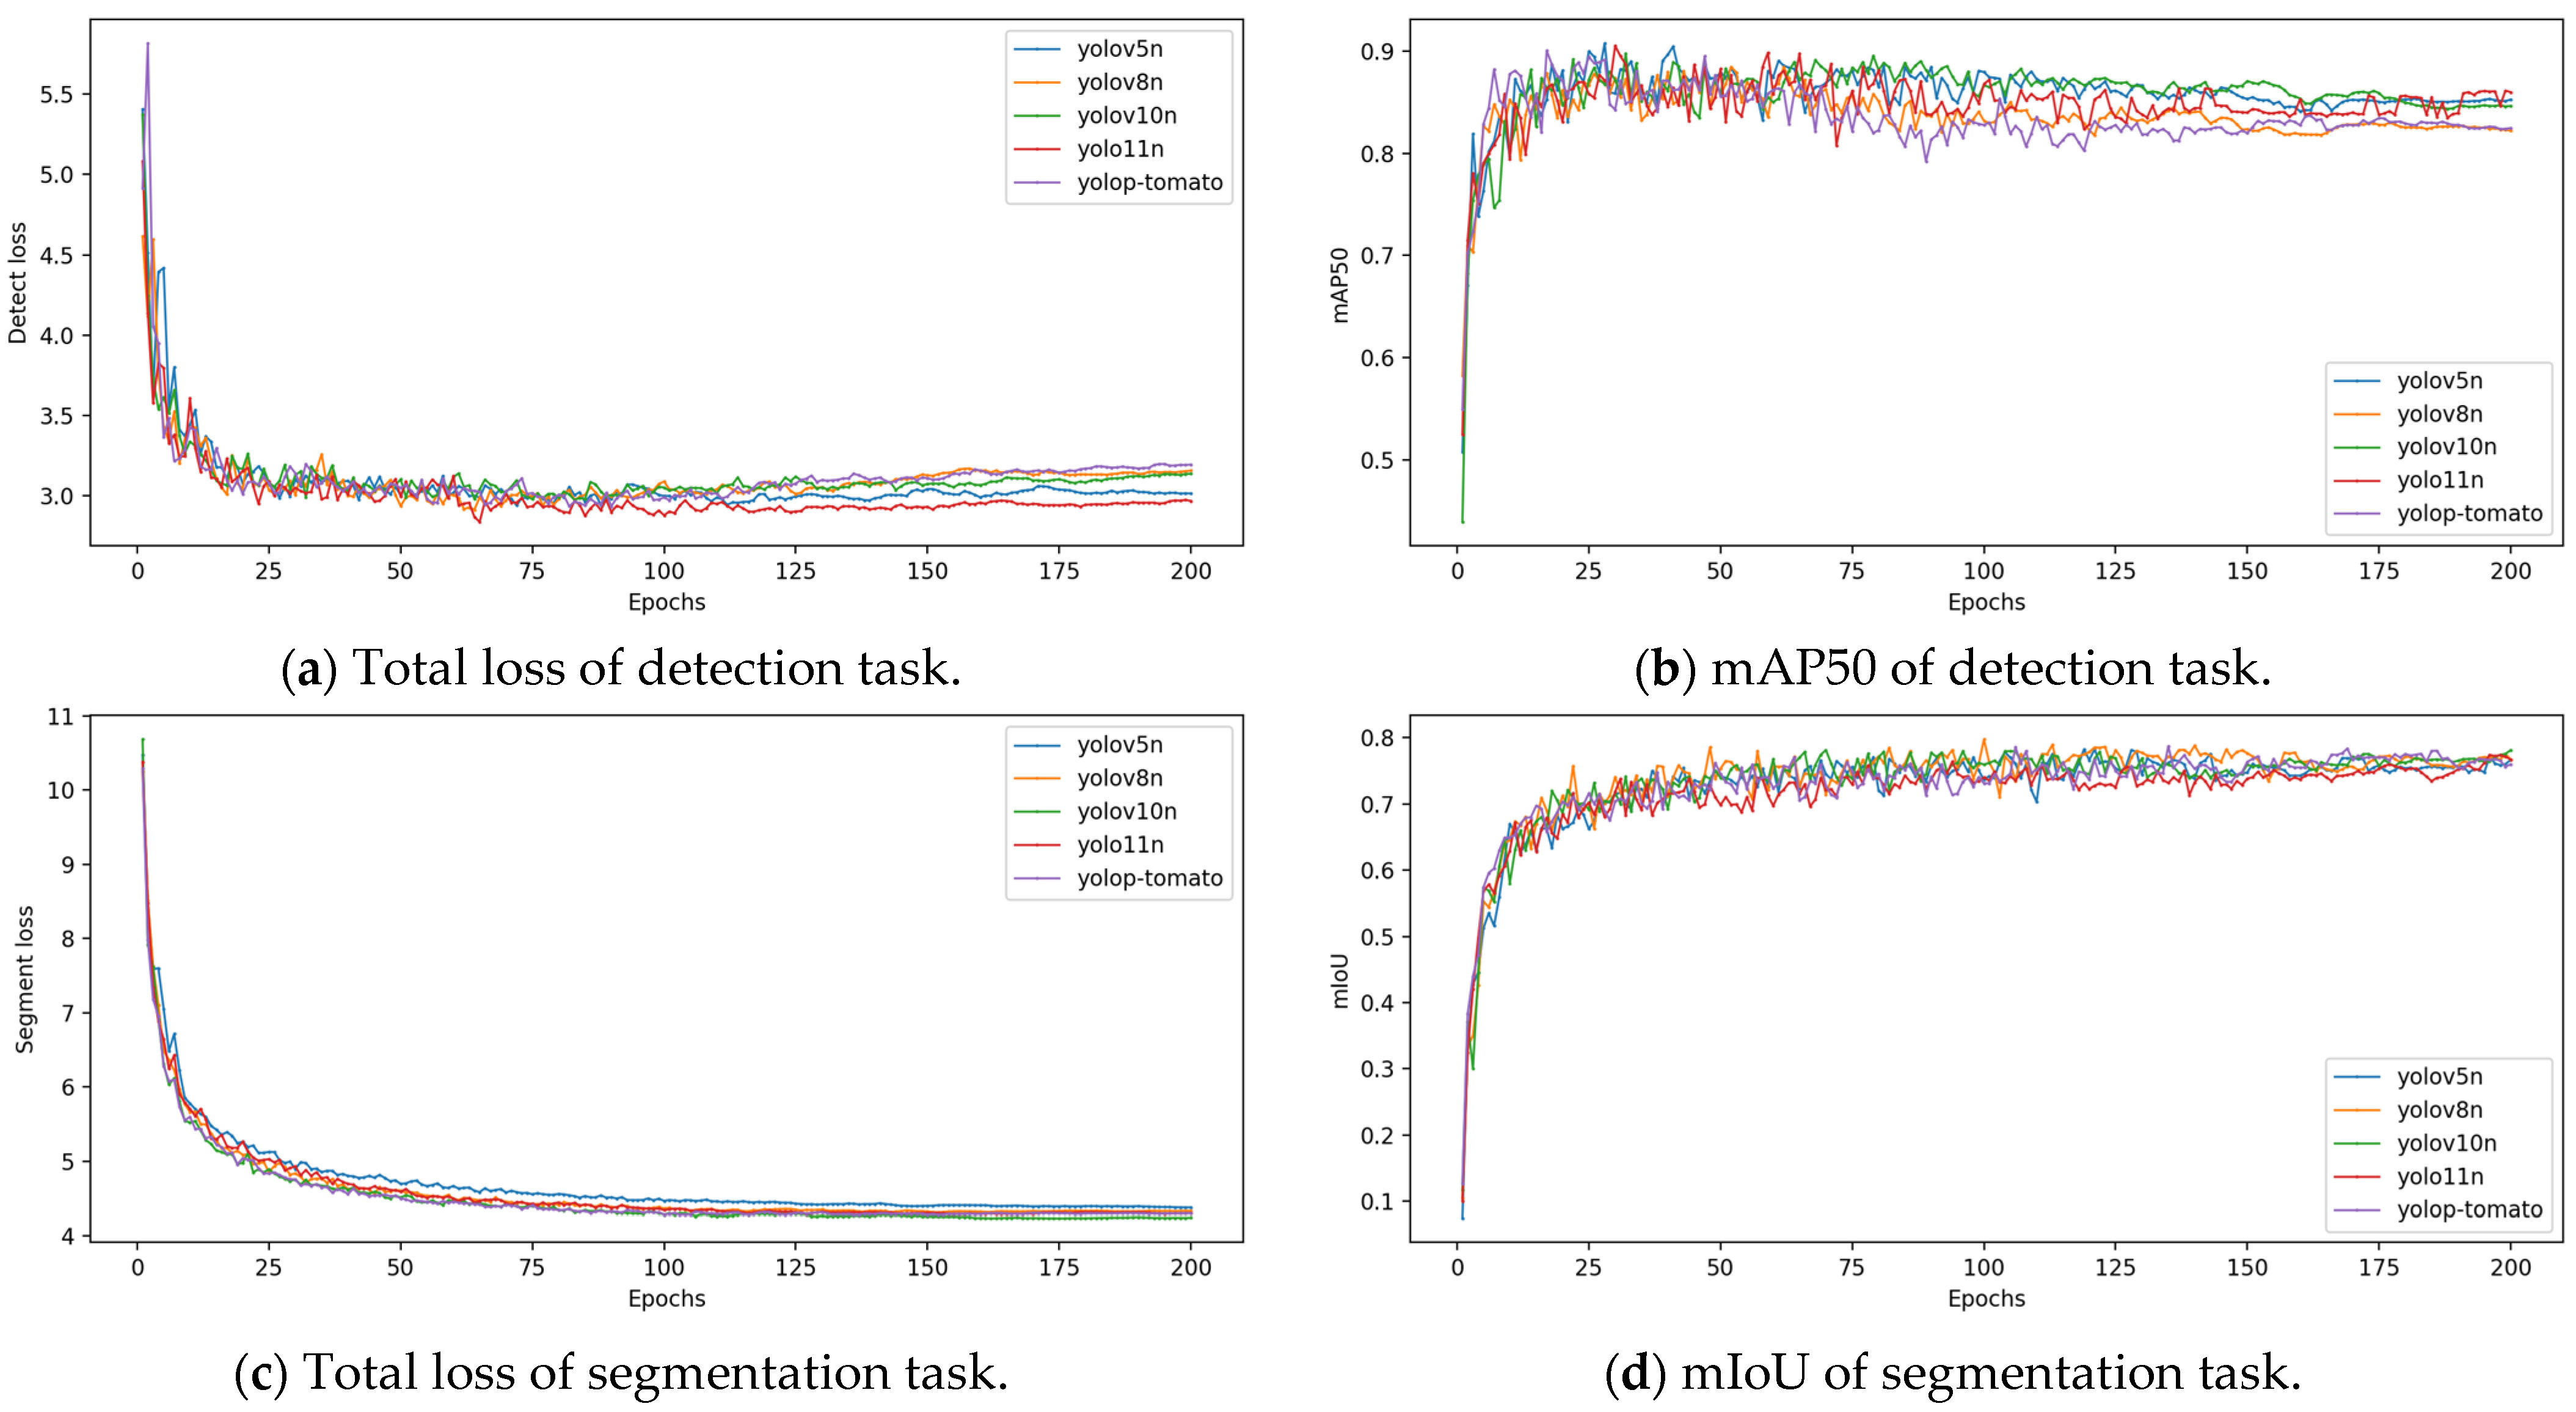
During the training phase, the validation set is employed to monitor the performance of model. The training process is illustrated in
Figure 11. The tracked models encompass YOLOv5n, YOLOv8n, YOLOv10n, YOLOv11n, and the YOLO-Tomato models. Visualized metrics include loss and mAP
50 for detection tasks and loss and mIoU for segmentation tasks.
In terms of detection loss (a), YOLOv5n (blue) and YOLOv11n (red) generally demonstrate reduced loss on the validation set, while YOLOv8n (orange) and YOLO P-Tomato (purple) exhibit slightly elevated detection loss on the validation set. YOLOv10n (green) occupies an intermediate position. All five models demonstrate oscillatory behavior prior to 125 epochs, subsequently converging.
In the mAP50 metric (b), YOLOv5n and YOLO11n also exhibited superior performance in comparison to YOLOv8n and YOLO-Tomato on the validation set. However, YOLO11n (red) exhibited persistent oscillations beyond 150 epochs, suggesting less stable validation set fitting compared to alternative models. Following 150 iterations, YOLOP-Tomato attains marginally higher validation set accuracy compared to YOLOv8n. A consideration of the performance of the test set reveals that YOLOP-Tomato achieved precision, recall, mAP50, and mAP50–95 scores of 94.9%, 85.0%, 93.6%, and 60.9%, respectively. These metrics were consistently ranked among the top performers, underscoring the model’s robust generalizability.
In the context of (c) segmentation loss, the YOLOP-Tomato model demonstrates superior performance in comparison to the YOLOv5n, YOLOv8n, YOLOv10n, and YOLO11n models on the validation set, while exhibiting a marginal edge over the YOLOv10n model. All models converge on the validation set after 150 iterations.
For the mIoU metric in (d), all models converged to similar validation set fits around 75% after 180 iterations. A consideration of the test set performance reveals that YOLOP-Tomato achieved the highest mean intersection over union (mIoU) of 77.6%, while YOLOv5n recorded the lowest at 75.7%. This further substantiates the superior accuracy of YOLOP-Tomato in segmentation tasks.
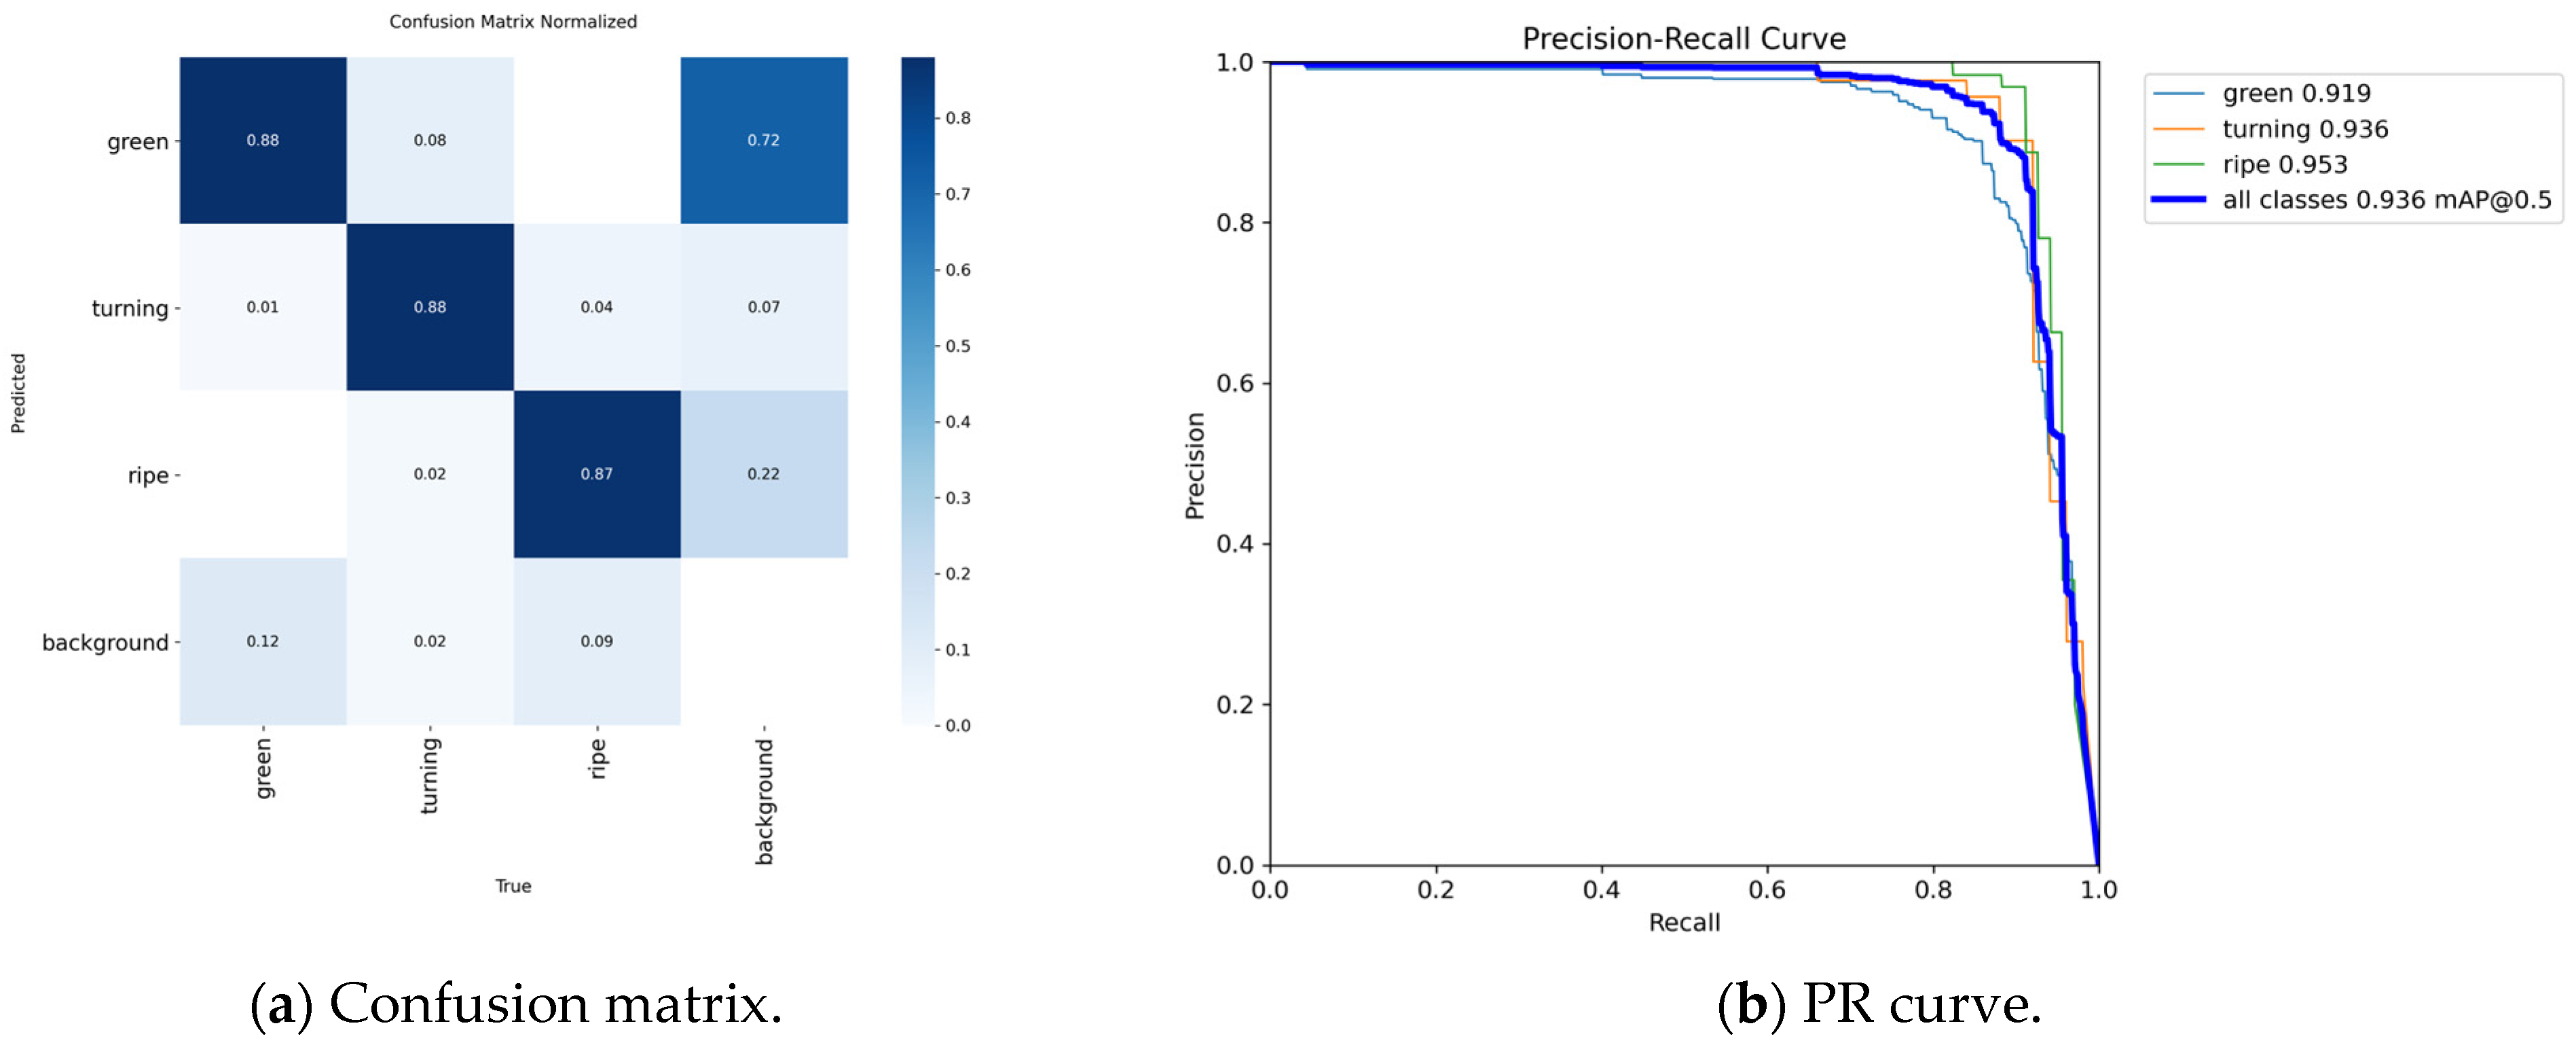
The PR curve and confusion matrix of YOLOP-Tomato are illustrated in
Figure 12.
In (a), the values on the main diagonal of the matrix correspond to the accuracy rates for each category. For instance, the value of green is 0.88, indicating that 88% of true green samples were correctly classified by the model. The value of turning is also 0.88, meaning that 88% of true turning samples were correctly classified. Similarly, the value of ripe is 0.87, indicating that 87% of true ripe samples were accurately classified. The values situated off the primary diagonal in the matrix signify the misclassification rates. Among the true green samples, 1% were misclassified as turning, and 12% were misclassified as background. Among the true turning samples, 8% were misclassified as green, 2% as ripe, and 2% as background. Among true ripe samples, 4% were misclassified as turning, and 9% as background. Furthermore, the model exhibited misclassification of 46 background instances as tomatoes, indicating a misinterpretation of the data. Of these, 72% were misclassified as green tomatoes, indicating that some backgrounds resemble tomatoes, which confuses the model’s classification. The deep blue in the main diagonal region visually represents the model’s core classification capability for each category, while the lighter shades in the off-diagonal regions reflect the overall low misclassification rate.
The (b) presents the PR curves for the green, turning, ripe categories and all classes, annotated with key metrics. The PR curve plots recall on the x-axis and precision on the y-axis; its shape reflects the model’s performance under the precision–recall trade-off. For green tomatoes, the AP is 0.919. Its PR curve maintains high precision at low recall levels (recall < 0.6) before rapidly declining as recall increases. The AP for turning tomatoes is 0.936, exhibiting a trend similar to green tomatoes; the range of recall values covered within the high precision interval is slightly broader. The AP for ripe tomatoes is 0.953, the highest among the three categories, with a relatively gradual decline in precision within the high recall range. The AP values for all three classes fall between 0.919 and 0.953, indicating the model achieves high recognition accuracy across target categories.
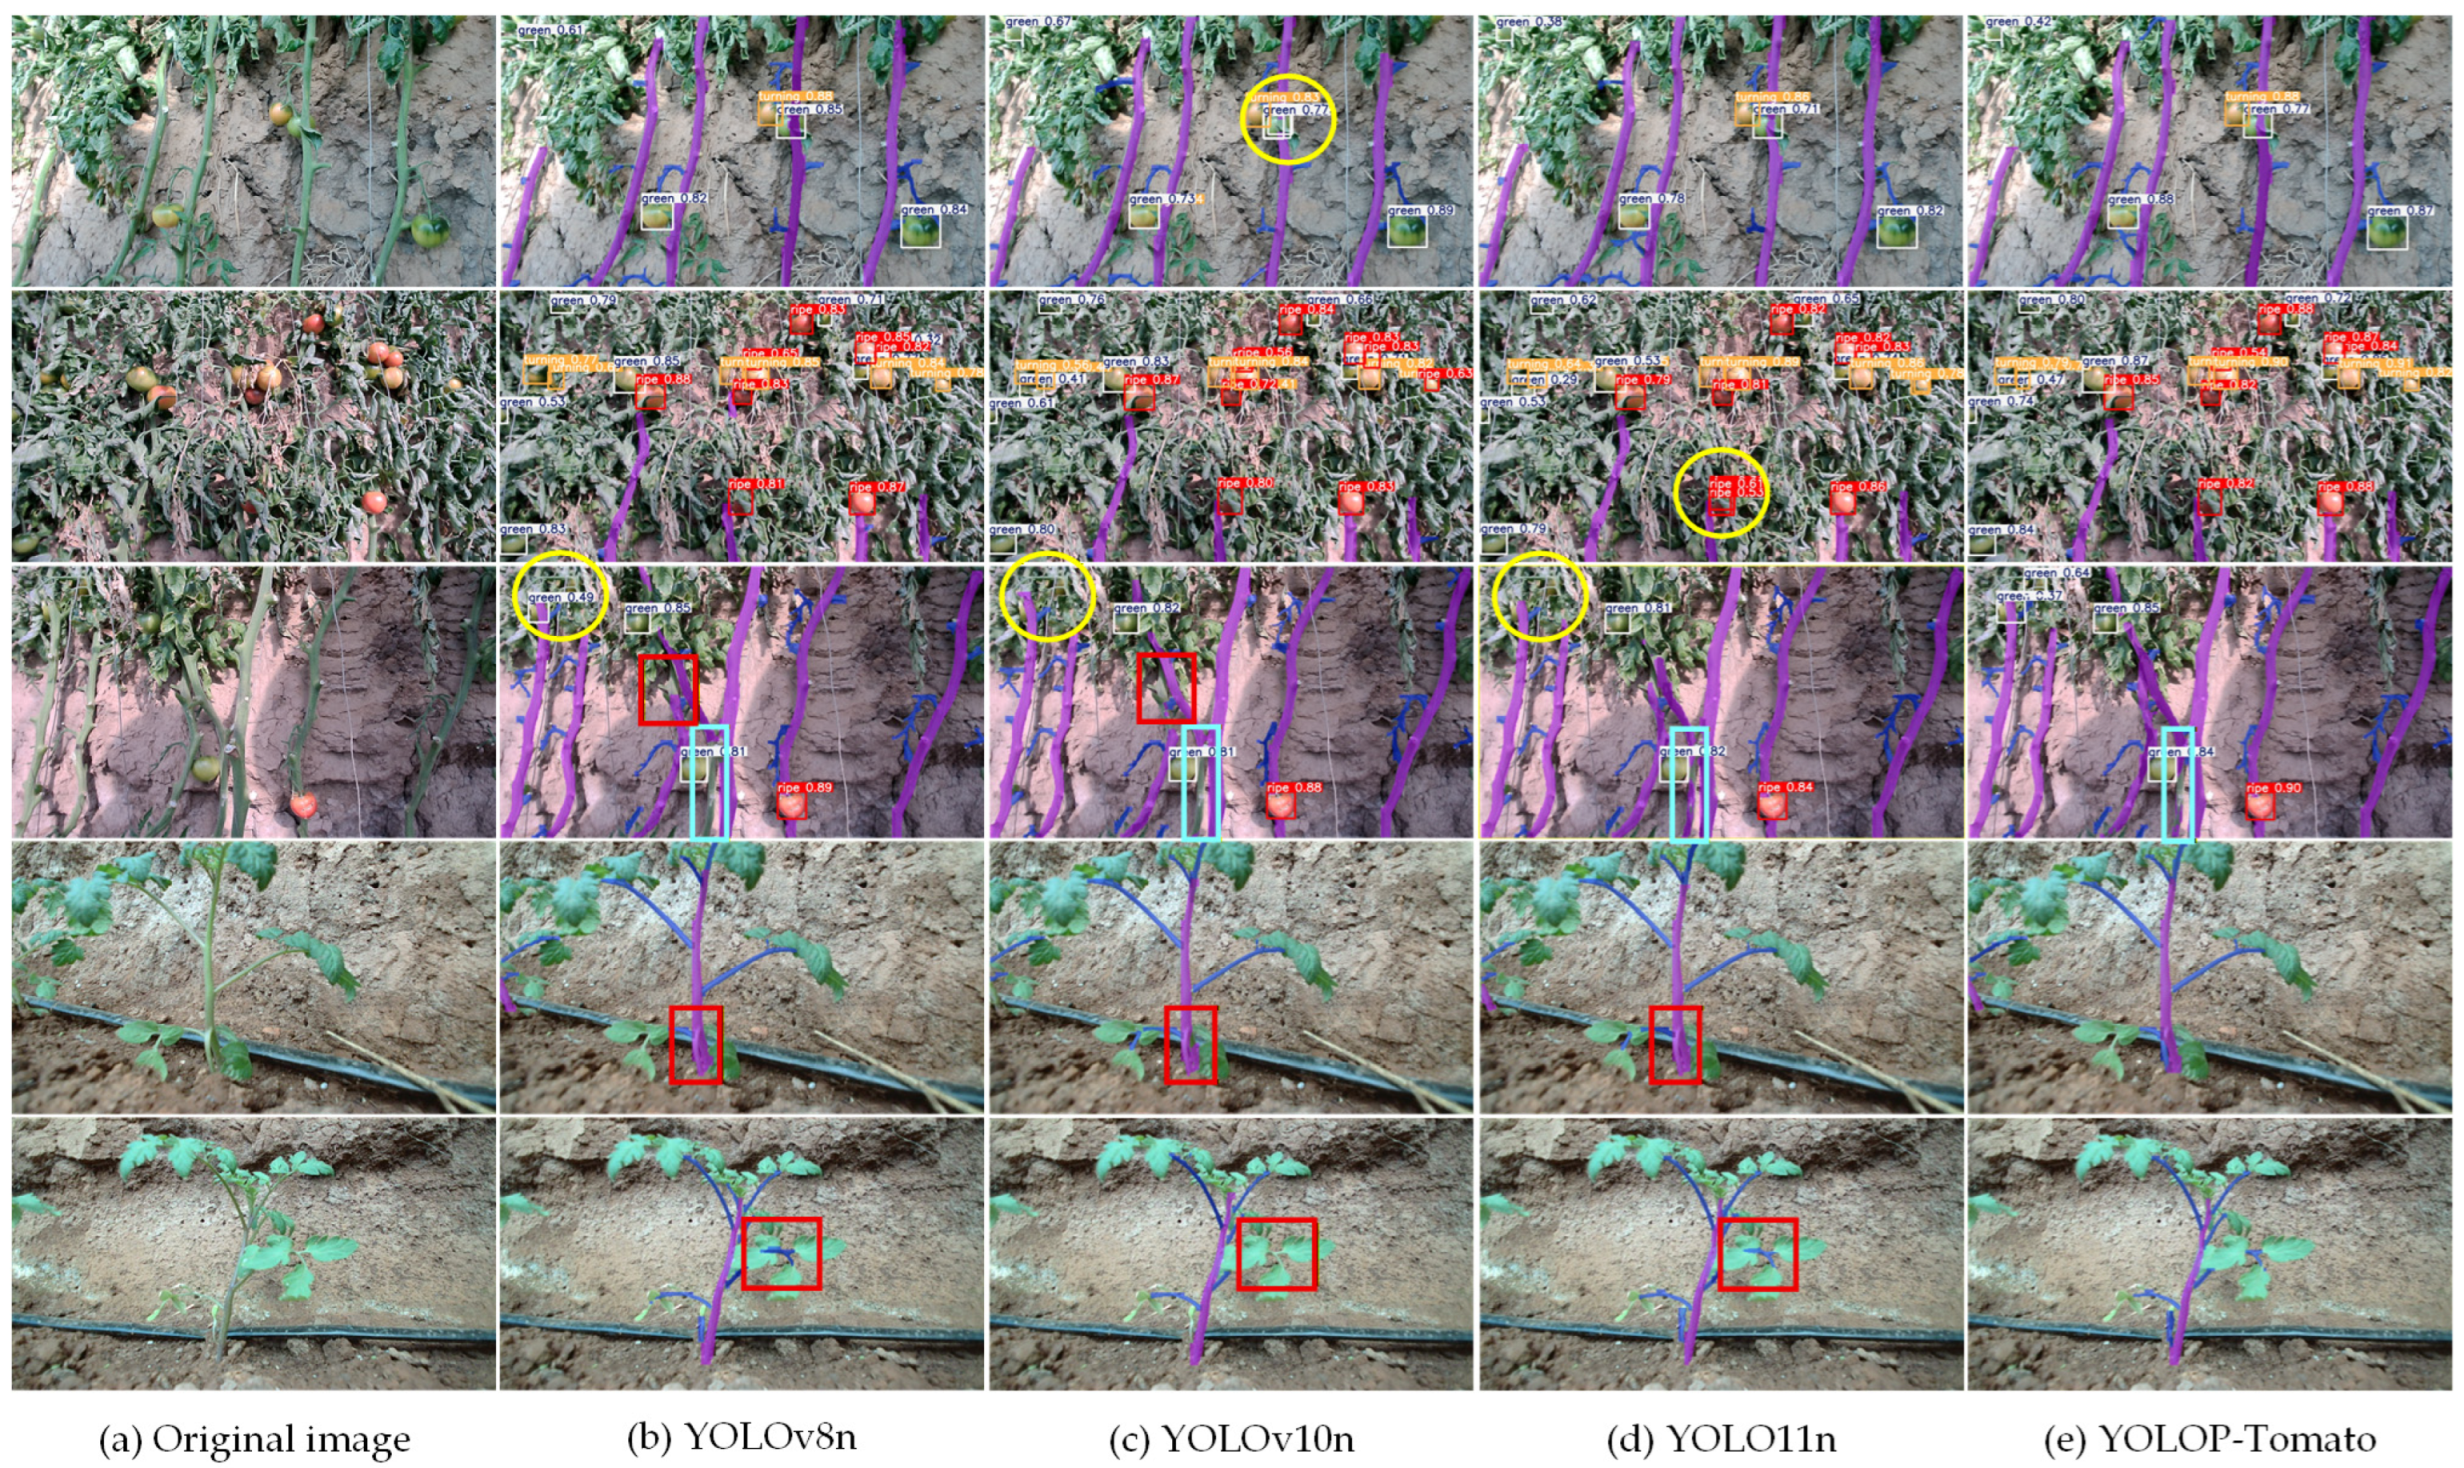
In order to present the inference results of different models on tomatoes in a more convenient and intuitive manner, the inference results on the test set are illustrated in
Figure 13.
As illustrated in the image presented in the first row, the YOLOv10n model demonstrated an inability to effectively filter out the bounding box for the green tomato, consequently resulting in the generation of multiple detection boxes for a single tomato (yellow circles).
In the second row, there is a preponderance of tomatoes exhibiting more severe occlusions. The ripe tomato in the lower-middle section is partially obscured by leaves, causing its features to become less distinct. A similar failure was observed in YOLOv11n, which also failed to filter out redundant bounding boxes (yellow circles).
In the third row, the two tomatoes in the upper left corner are partially blocked by branches. The inference results from the YOLOv8n, YOLOv10n, and YOLOv11n models all exhibit varying degrees of omission (yellow circles). In the main stem segmentation below, YOLOv8n and YOLOv10n failed to complete the segmentation (red rectangle). In the lower stem segmentation, all four models exhibit varying degrees of omission (light blue rectangles). YOLOv8n and YOLOv10n almost entirely fail to segment the main stem. YOLOP-Tomato achieves superior segmentation compared to the previous two models, though it still contains some omissions. YOLO11n demonstrates the fewest omissions.
In the fourth row image, a lateral branch is observed to overlap the lower portion of the main stem. The YOLOv8n, YOLOv10n, and YOLO11n models identified this area as part of the main stem (red rectangle), while the YOLOP-Tomato model accurately identified it as a lateral branch.
In the fifth row, both YOLOv8n and YOLOv11n made incorrect classifications, labeling some leaves as lateral branches. YOLOv10n failed to detect the pixels of the lateral branch (red rectangle). YOLOP-Tomato correctly segmented the middle lateral branch.
In summary, YOLOP-Tomato exhibits robust comprehensive capabilities in tomato detection and main stem and lateral branch segmentation. The model has been demonstrated to successfully infer the ripeness of partially obscured tomatoes and perform precise segmentation of stems and branches.
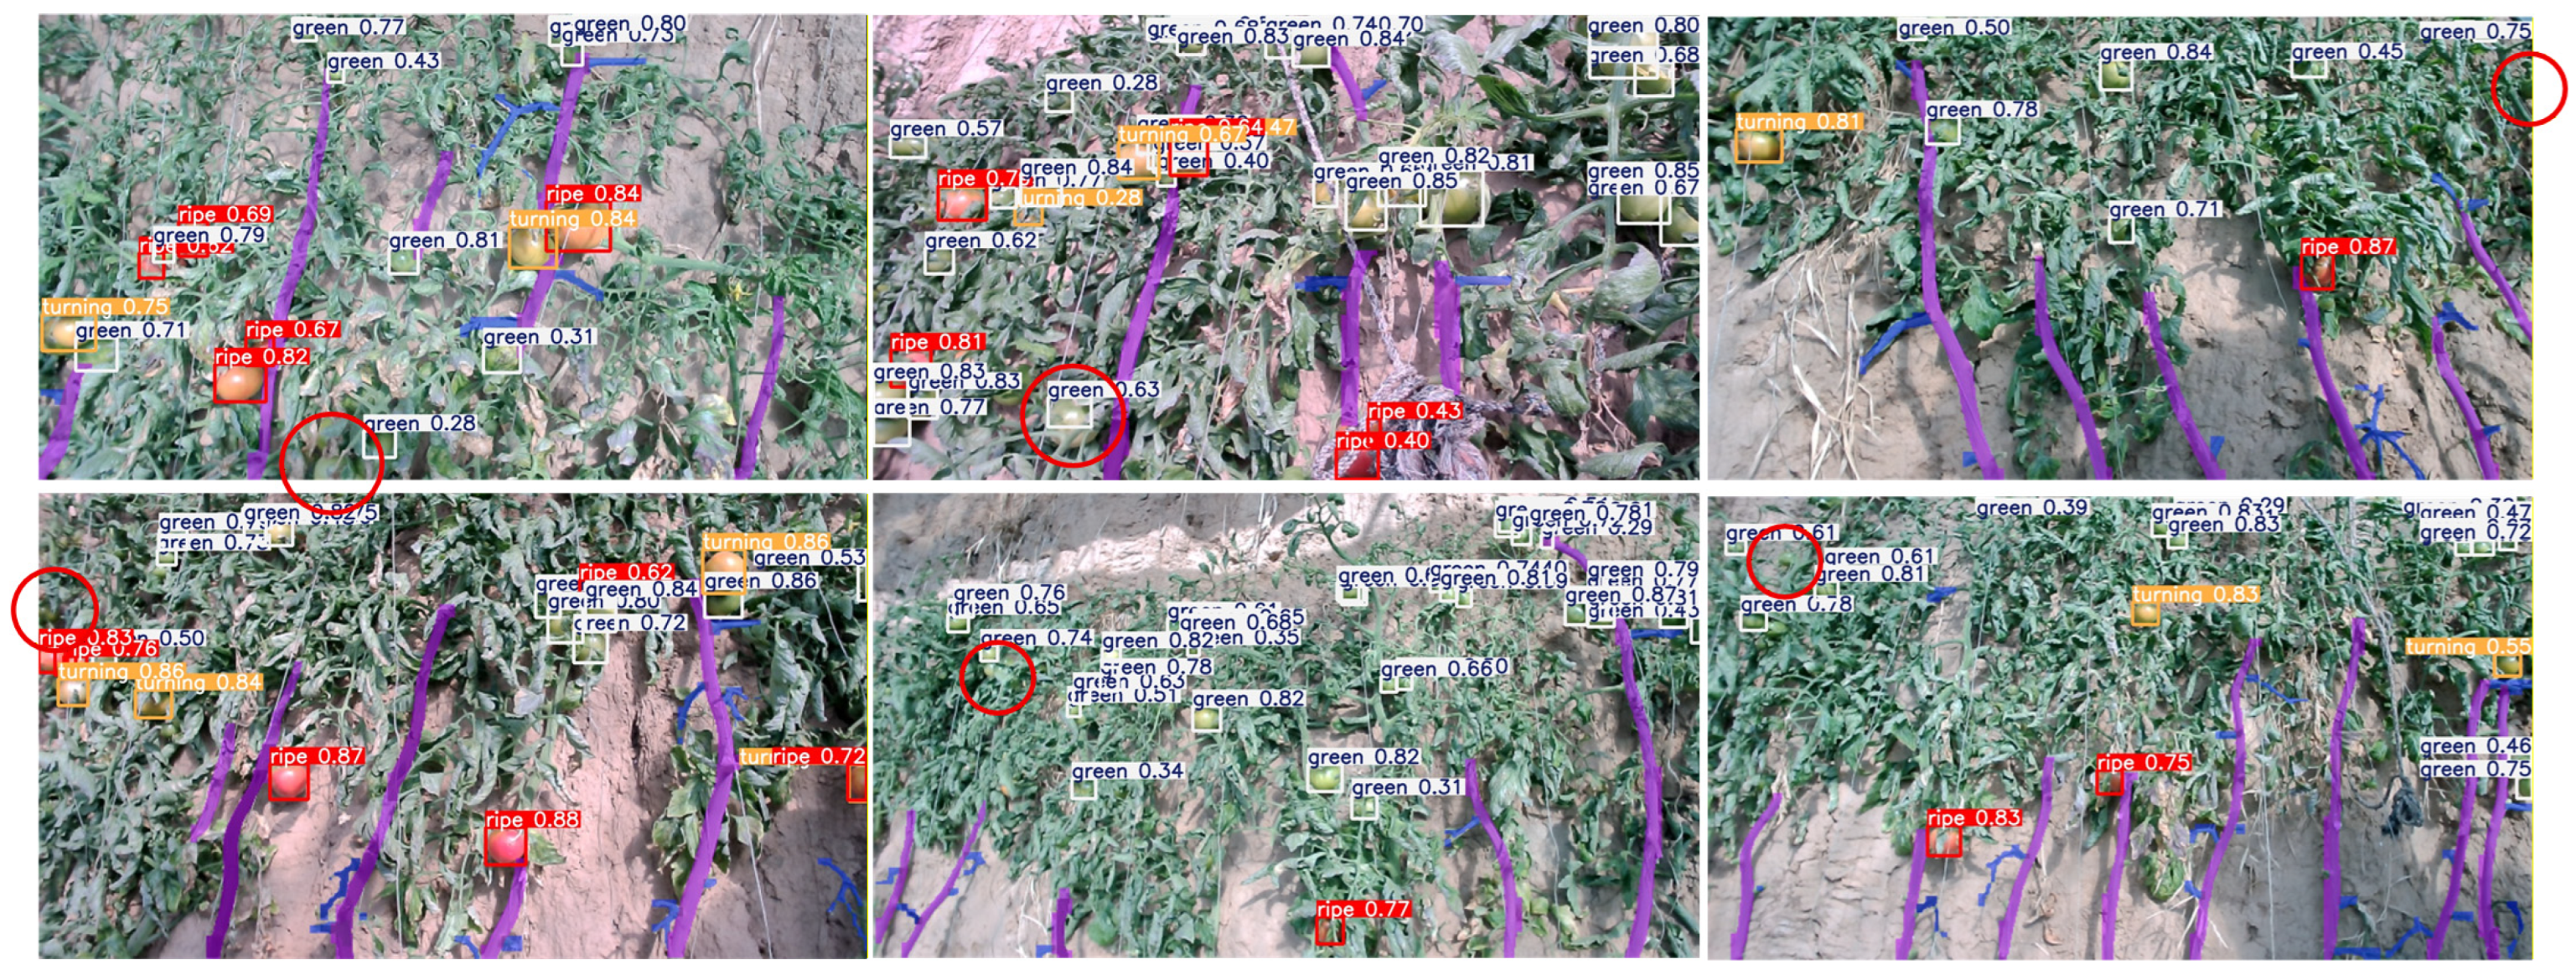
YOLOP-Tomato has certain limitations in detecting some green tomatoes, as illustrated in
Figure 14.
As illustrated in the figure, YOLOP-Tomato demonstrates a propensity for false negatives in unripe green tomatoes, indicated by the red circles. The location of these tomatoes is at the image edges, with some partially obscured or having features extending beyond the pixel boundaries. In the red circle at row 1, column 2, the green tomato is obscured by a branch. While the model successfully identifies the tomato, the bounding box is smaller than the actual tomato box due to the influence of the branch. Consequently, YOLOP-Tomato experiences some limitations when detecting pixels at the image edges.