1. Introduction
Drought stress represents one of the most significant constraints to global crop production, with projected increases in frequency and severity under climate change scenarios threatening food security worldwide [
1]. Quantitative analyses reveal that drought and extreme heat events between 1964 and 2007 caused cumulative production losses of over 3000 million Mg in global cereal production, with drought alone reducing national production by 10.1% through combined effects on yield (−5.1%) and harvested area (−4.1%) [
2]. In recent years, the effects have become stronger during just the 8-year period from 2000 to 2007, 6.2% of global cereal crop losses were recorded due to climate-related damage [
2]. This shows that such damage is increasing and highlights the urgent need to deal with drought. Comprehensive drought management requires integrated approaches combining genetic improvement, agronomic practices, and chemical ameliorants to address the multifaceted physiological impacts of water deficit [
3]. While conventional breeding approaches focus on developing drought-tolerant cultivars through genetic selection, an alternative strategy involves modulating plant stress responses through targeted nutrient management. However, understanding how nutrient limitation priorities shift under water deficit—and whether these shifts reflect intrinsic physiological adaptations or can be manipulated through fertilization—remains poorly understood. Classical nutrient management, grounded in Liebig’s Law of the Minimum [
4,
5], has long assumed that plant growth is constrained by the scarcest essential nutrient—most often nitrogen or phosphorus under field conditions. However, emerging evidence indicates that nutrient limitations are not static but arise from complex physiological interactions and environmental contexts. Modern crop growth models integrating phenological observations and environmental drivers have demonstrated that maize growth dynamics are governed by cumulative thermal time (Growing Degree Days) and interactions between nutrient availability and water stress [
6], underscoring the need for integrated approaches that account for multiple interacting factors rather than single-nutrient limitation paradigms.
Environmental stresses—including drought—impose complex physiological challenges on plants. They must not only sustain essential metabolic functions but also activate intricate adaptive mechanisms that enhance their tolerance to unfavorable environmental conditions. In such circumstances, both macro- and micronutrients play pivotal roles in supporting key metabolic pathways and modulating defense responses. Understanding whether plants naturally reallocate nutrients toward protective functions under drought stress, or whether such reallocation requires targeted nutritional interventions, is essential for developing effective nutrient management strategies in water-limited environments [
7].
An imbalance between the production and detoxification of reactive oxygen species (ROS) is often observed during drought stress [
8].
However, under drought-induced oxidative stress, sulfur becomes critical for synthesizing glutathione and other sulfur-containing antioxidants that protect cellular components from reactive oxygen species damage and maintain redox homeostasis. Elemental sulfur (ES) application has been shown to enhance drought tolerance in various crops [
9], reporting N/S = 4.1 as optimal in wheat, substantially lower than traditional recommendations of N/S = 10–15. This discrepancy provides the rationale for the present investigation into sulfur-mediated shifts in nutrient limitation under drought. Salicylic acid (SA), a phenolic phytohormone, plays a central role in plant stress signaling and defense responses. Recent comprehensive reviews of SA research highlight its multifaceted role in drought stress mitigation through stomatal regulation, antioxidant enzyme activation, osmolyte accumulation, and photosynthetic protection [
10,
11]. SA application has been shown to enhance drought tolerance through multiple mechanisms [
11], confirming a significant gap in current knowledge.
Most previous studies examining nutrient dynamics under drought have focused on individual nutrient concentrations or simple N:P ratios, without considering multivariate interactions among major macronutrients [
12]. Moreover, fertilization trials are often interpreted as revealing intrinsic plant nutritional requirements, without explicitly testing whether observed patterns arise from treatment effects rather than universal physiological responses. This overlap between treatment-driven and intrinsic patterns may obscure accurate interpretation of plant drought physiology.
We hypothesized that elemental sulfur supplementation would shift nutrient limitation priorities toward sulfur-dependent defensive functions under drought, but that this shift would be treatment-mediated rather than representing a universal drought response in unfertilized plants. Our specific objectives were to: (1) characterize macronutrient limitation hierarchies under drought versus optimal irrigation using multivariate regression tree analysis; (2) distinguish treatment-mediated nutrient limitation patterns from intrinsic drought responses by comparing fertilized treatments with unfertilized controls; (3) evaluate the individual and combined effects of elemental sulfur and salicylic acid, applied via different methods (foliar vs. soil), on plant growth, nutrient uptake, and stress tolerance; and (4) quantify the relative importance of treatment type versus water availability in determining plant nutrient composition. The present study addresses these knowledge gaps through a factorial experiment examining elemental sulfur and salicylic acid effects on maize (Zea mays L.) under contrasting water regimes.
2. Materials and Methods
2.1. Experimental Site and Description
This study was conducted in a controlled vegetation hall at the Department of Plant Nutrition, University of Life Sciences in Wrocław (Poland). On 18 May 2023, six independent replicates were established in Wagner pots, each filled with 5 kg of soil. Twelve maize seeds were sown per pot and, after emergence, plants were thinned to six. A composite sample of six plants from each pot was used for chemical analyses. A medium–late silage maize cultivar, Kadryl, known for its high yield potential, high nutritive value, and very good digestibility, was grown. The crop was maintained for 110 days and harvested at the grain (kernel) development stage. Temperature and light followed ambient conditions, while soil moisture was strictly controlled with distilled water to maintain approximately 60% field capacity throughout the growing period.
The pots were filled with topsoil collected from the organic layer of an agricultural site in Miłoszyce, Poland (51°05′ N, 17°31′ E). The soil was classified as Albic Luvisol (Epiarenic) and had a sandy texture, consisting of 86% sand, 7% silt, and 7% clay. Soil pH (in KCl) was 5.9, and total carbon (C_tot) was 0.95%. Available nutrient concentrations were as follows: phosphorus, 98 mg kg−1 (high); potassium, 105 mg kg−1 (high); magnesium, 110 mg kg−1 (high); manganese, 168 mg kg−1 (medium); iron, 973 mg kg−1 (medium); copper, 3.4 mg kg−1 (high); and zinc, 13.6 mg kg−1 (high). Before sowing, the soil was limed with calcium carbonate (CaCO3) at 1.75 g pot−1, calculated from the soil’s hydrolytic acidity. To ensure optimal maize nutrition, pre-sowing fertilization was applied at 0.6 g N pot−1, 0.5 g P pot−1, and 1.2 g K pot−1. During the growing season, plants were top-dressed with nitrogen at 1.2 g pot−1 at the 6-leaf stage (BBCH 16).
2.2. Experimental Design
A factorial design was used with two factors: (1) Treatment (six levels): Control (no ES or SA), ES-foliar (elemental sulfur applied as foliar spray), SA-foliar (salicylic acid applied as foliar spray), SA-soil (salicylic acid applied to soil), ES-soil (elemental sulfur applied to soil), and ES + SA-soil (combined elemental sulfur and salicylic acid applied to soil); and (2) Field water capacity (FWC) with two levels: 60% FWC (optimal irrigation) and 30% FWC (drought stress). Each treatment combination was replicated six times, giving 72 pots (6 treatments × 2 FWC levels × 6 replicates).
2.3. Treatment Application
Elemental sulfur (ES) was applied at 0.5 g S pot−1, equivalent to 100 mg S kg−1 soil (5 kg soil per pot). Salicylic acid (SA) was dissolved in distilled water and applied uniformly to the soil to achieve 0.10 mmol kg−1 soil (13.8 mg kg−1); with 5 kg soil per pot, this corresponded to 69.1 mg pot−1.
For elemental sulfur, plants were sprayed with 10.0 cm
3 of working solution per pot to supply 200 mg S pot
−1. The sulfur formulation was Prosiarka S 800 SC (80% S
w/
w, density 1.35 g cm
−3). For salicylic acid, plants were sprayed with 10.0 cm
3 of a 1.0 mM solution (138.1 mg SA L
−1), providing 1.38 mg SA pot
−1. This concentration was selected within the optimal range (0.5–1.0 mM) established for stress tolerance without toxicity [
11,
13]. Foliar sprays were applied with a hand sprayer to incipient runoff, ensuring uniform leaf coverage.
Soil applications of ES and SA were performed once at experiment establishment by thoroughly mixing the products into the entire pot soil. Foliar applications of ES and SA were carried out at two stages: 9-leaf stage (BBCH 19) and the onset of tassel emergence (BBCH 51).
2.4. Plant and Soil Measurements
A total of 110 days after sowing (grain development stage, BBCH 75–85), aboveground plant material was harvested from each pot. A composite sample of six plants per pot was used for all measurements. Fresh mass (sw_m) was recorded immediately after harvest using an analytical balance. Plant material was then oven-dried at 65 °C until a constant weight was achieved (approximately 72 h) to determine dry mass (sm). Dried samples were ground to pass through a 1 mm sieve and stored in sealed containers for subsequent chemical analysis.
Chlorophyll fluorescence parameters were measured on fully expanded upper leaves during the late vegetative to early reproductive stage using a portable chlorophyll fluorometer. Maximum quantum yield of PSII (Fv/Fm) was determined after 30 min of dark adaptation using leaf clips. The Performance Index (PI-abs) was calculated automatically by the instrument based on the polyphasic chlorophyll fluorescence transient (OJIP curve), integrating absorption flux, trapping efficiency, and electron transport beyond QA. Chlorophyll Content Index (CCI) was measured non-destructively during weeks 5–8 of growth using a chlorophyll content meter. For each pot, measurements were taken on three fully expanded leaves, and the mean value was used for statistical analysis.
Dried and ground plant samples (1 g) were subjected to dry mineralization at elevated temperature, and the ash was taken up with nitric acid (HNO
3) for subsequent elemental analysis. Total nitrogen (N) content was determined using the Kjeldahl method. Total sulfur (S) content was determined using the modified Butters–Chenery turbidimetric method [
14], which involves oxidation of sulfur-containing compounds and turbidimetric measurement of sulfate precipitated as barium sulfate (BaSO
4). Phosphorus (P) concentration was determined using the vanadic–molybdate colorimetric method. Potassium (K) and calcium (Ca) were measured using flame photometry, while magnesium (Mg) and micronutrients (copper, iron, manganese, zinc) were quantified using atomic absorption spectrophotometry (AAS). Analytical procedures followed established protocols previously validated in our laboratory [
9]. Quality control included analysis of certified reference materials (plant tissue standards) and procedural blanks with each batch of samples. Nutrient uptake (mg pot
−1) was calculated as the product of nutrient concentration (g kg
−1 DM or mg kg
−1 DM) and total dry mass per pot (g pot
−1).
Soil samples were collected from each pot immediately after plant harvest. Samples were air-dried, sieved (2 mm), and analyzed for selected chemical properties. Soil pH was measured potentiometrically in 1 M KCl solution (1:2.5 soil-to-solution ratio). Total carbon (C
tot) and nitrogen (N
tot) contents were determined using a CHN elemental analyzer (TruSpec, LECO Corporation, Benton Harbor, MI, USA). Total sulfur (S
tot) content was determined using the modified Butters–Chenery method [
14], following the same turbidimetric procedure as for plant material but with appropriate modifications for soil matrix. Available phosphorus (P) and potassium (K) were extracted using the Egner–Riehm method, while exchangeable magnesium (Mg) were extracted using the Schachtschabel method. Extractable micronutrients (Cu, Fe, Mn, Zn) were determined using the Rinkis extraction method followed by atomic absorption spectrophotometry (AAS). All soil analyses were performed in duplicate, and mean values were used for statistical analysis. Detailed descriptions of these analytical procedures for both plant and soil samples are provided in our previous work [
9].
2.5. Statistical Analysis
Statistical analyses were performed using R version 4.3.0 [
15]. The experimental design followed a two-factorial randomized complete block design with Treatment (6 levels) and Field Water Capacity (2 levels) as fixed factors, with six replicates per treatment combination (
n = 72 total observations).
Effects of Treatment, FWC, and their interaction were evaluated using two-way analysis of variance (ANOVA). Prior to the ANOVA, assumptions were tested: normality of residuals using Shapiro–Wilk test, homogeneity of variance using Levene’s test, and independence of residuals using Durbin–Watson test. Outliers were identified using the interquartile range (IQR) method (values beyond 1.5 × IQR from quartiles). For variables violating normality assumptions, log-transformation was applied. Effect sizes were quantified using generalized eta-squared (η2G). Post hoc pairwise comparisons were performed using Tukey’s Honest Significant Difference (HSD) test at α = 0.05 using the HSD.test() function from the agricolae package.
To identify macronutrient limitation hierarchies, regression tree analysis was performed using plant dry mass as the response variable and macronutrient concentrations (N, S, P, K, Mg) as predictors. Analyses were conducted separately for each water regime (FWC 30% and FWC 60%).
The dataset for each FWC level (
n = 36 observations) was randomly split into training (80%,
n ≈ 29) and testing (20%,
n ≈ 7) sets using stratified random sampling. Model performance was evaluated using R
2 and root mean squared error (RMSE) calculated on the held-out test set [
16].
Macronutrient concentrations are inherently correlated due to biochemical coupling (e.g., N–S in amino acid synthesis), competitive uptake mechanisms (e.g., SO42− vs. H2PO4−), and shared environmental drivers (e.g., drought effects). Such intercorrelations can affect variable importance rankings in tree-based models, as correlated predictors may substitute for one another in split decisions. However, primary splits (i.e., root nodes) are generally robust to multicollinearity, as they are selected based on maximum variance reduction across the entire dataset and thus provide the strongest discriminatory power. The consistency of our primary splits across water regimes (S concentration as the root split in both FWC 30% and FWC 60%) and their convergence with independent multivariate methods (PCA, RDA) support the robustness of the identified nutrient limitation patterns.
PCA was conducted on standardized macronutrient concentrations (N, S, P, K, Mg) to visualize overall nutrient variation patterns across treatments and water regimes. Data were centered and scaled prior to analysis. Biplots were constructed showing both observations (treatment groups) and variable loadings.
To quantify the relative contributions of Treatment and FWC to macronutrient composition, redundancy analysis was performed using the same five macronutrients as response variables. The full model included Treatment, FWC, and their interaction as explanatory variables. Variance partitioning was conducted to separate pure Treatment effects, pure FWC effects, and shared variance. Model fit was evaluated using R2 and adjusted R2.
Claude Code v2.0.46 (Anthropic, San Francisco, CA, USA;
https://www.anthropic.com, accessed on 20 November 2025) was used to assist with debugging the R code.
3. Results
3.1. Plant Photosynthetic Parameters
The effects of sulfur and salicylic acid treatments on chlorophyll content index and photosynthetic efficiency are presented in
Table 1. Both treatment type (F1) and water availability (F2) significantly affected all measured photosynthetic parameters (
p < 0.001), with very large effect sizes (η
2G = 0.60–0.99).
Chlorophyll Content Index (CCI): Soil-applied treatments significantly increased chlorophyll content compared to control and foliar applications. The highest CCI values were observed in ES-soil and ES + SA-soil treatments, which were 3.3-fold higher than the control. Drought stress (FWC 30%) significantly increased CCI compared to optimal irrigation (21.9 vs. 14.1, p < 0.001). The interaction effect was highly significant (p < 0.001, η2G = 0.84), with the strongest response in ES-soil and ES + SA-soil treatments under drought conditions.
Maximum Quantum Yield of PSII (Fv/Fm): All treatments improved Fv/Fm compared to the control (0.77), with ES + SA-soil showing the highest value (0.813). Under drought stress, Fv/Fm was slightly higher than under optimal irrigation, indicating proper functioning of photosystem II. The combination treatment ES + SA-soil under FWC 30% achieved the highest Fv/Fm value (0.823).
The Performance Index (PI-abs) showed a consistent pattern across treatments, with all applications improving photosynthetic performance compared to the control (0.956). ES + SA-soil treatment resulted in the highest PI-abs values (0.986). Drought stress significantly enhanced PI-abs (0.989 vs. 0.954, p < 0.001). However, the interaction effect was non-significant (p = 0.859, η2G = 0.03), indicating that treatment effects on PI-abs were consistent across both water regimes. The maximum PI-abs value (1.0) was achieved with ES + SA-soil under FWC 30%.
The superior photosynthetic performance of ES + SA-soil across all parameters (under FWC 30%) may result from integrated mechanisms: (1) sulfur-mediated antioxidant protection glutathione synthesis may shield photosystem II from ROS damage during drought-induced stomatal closure; (2) salicylic acid activation of antioxidant enzymes (SOD, CAT, APX), potentially preventing photoinhibition; and (3) enhanced potassium uptake, likely maintaining osmoregulation and stomatal function under water deficit. Soil-applied treatments outperformed foliar applications, possibly due to sustained nutrient availability throughout the growing season, whereas foliar ES and SA delivered transient pulses subject to rapid degradation and limited translocation.
3.2. Plant Growth–Biomass Yield
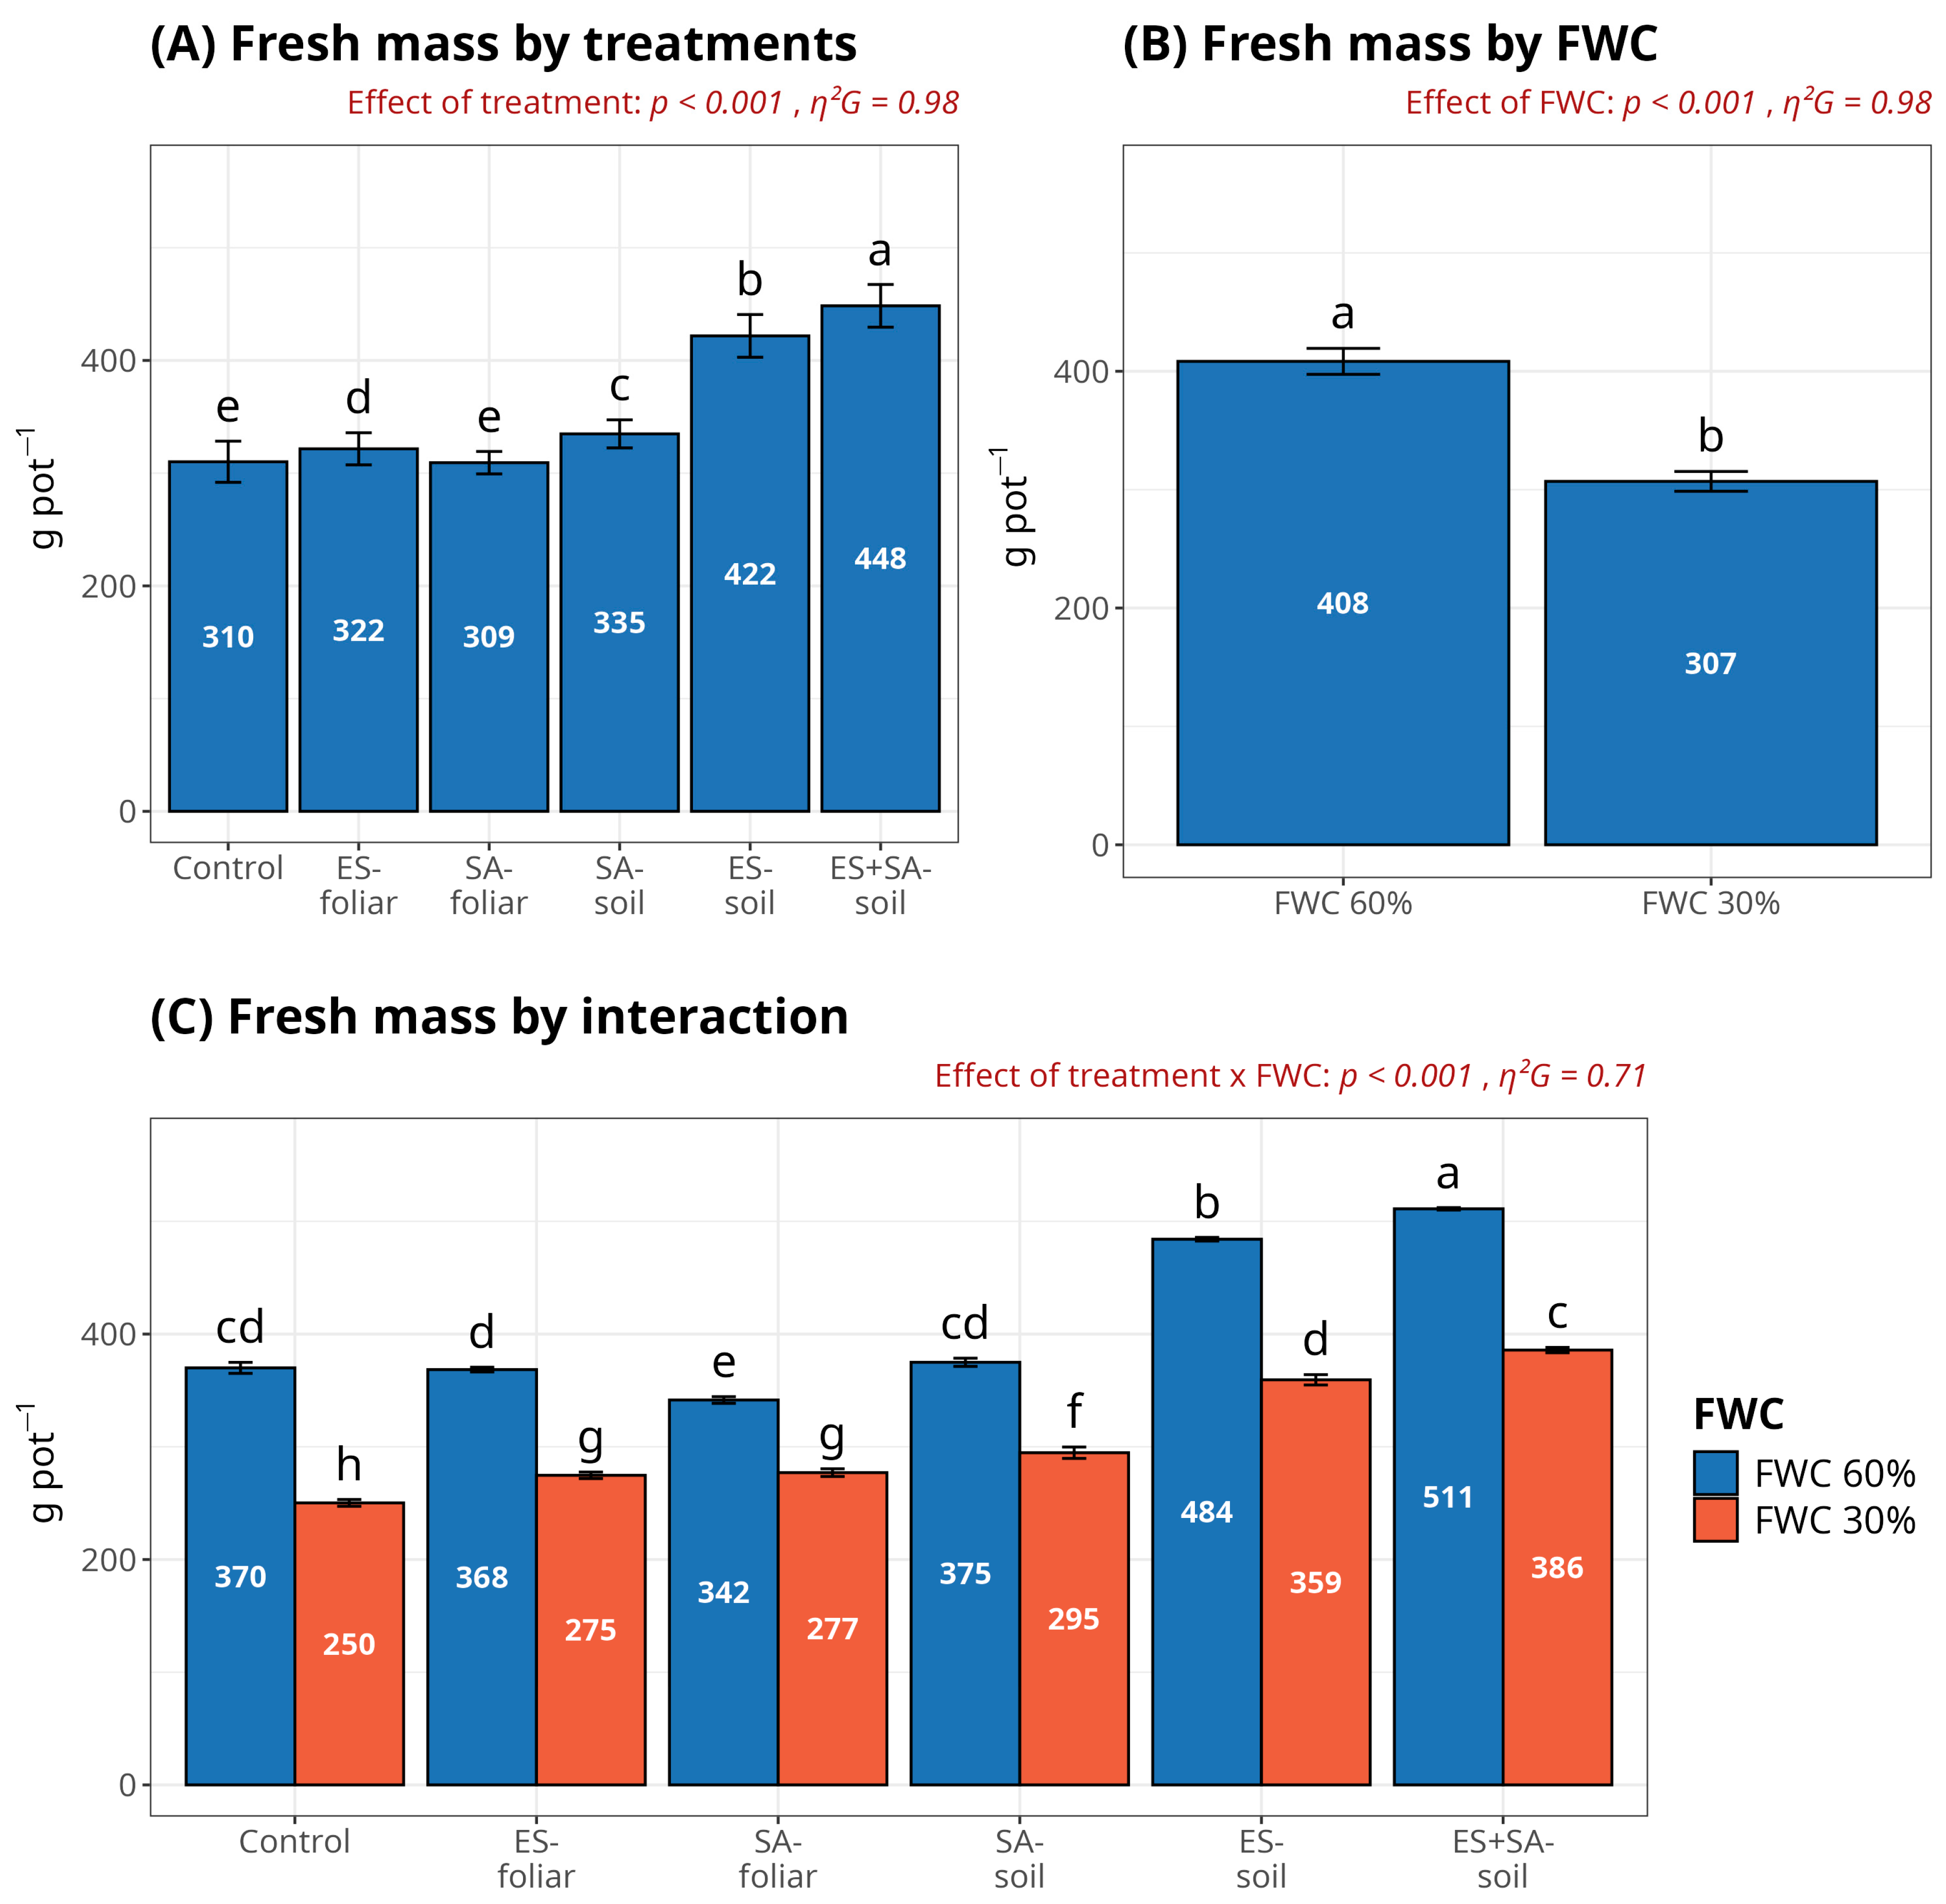
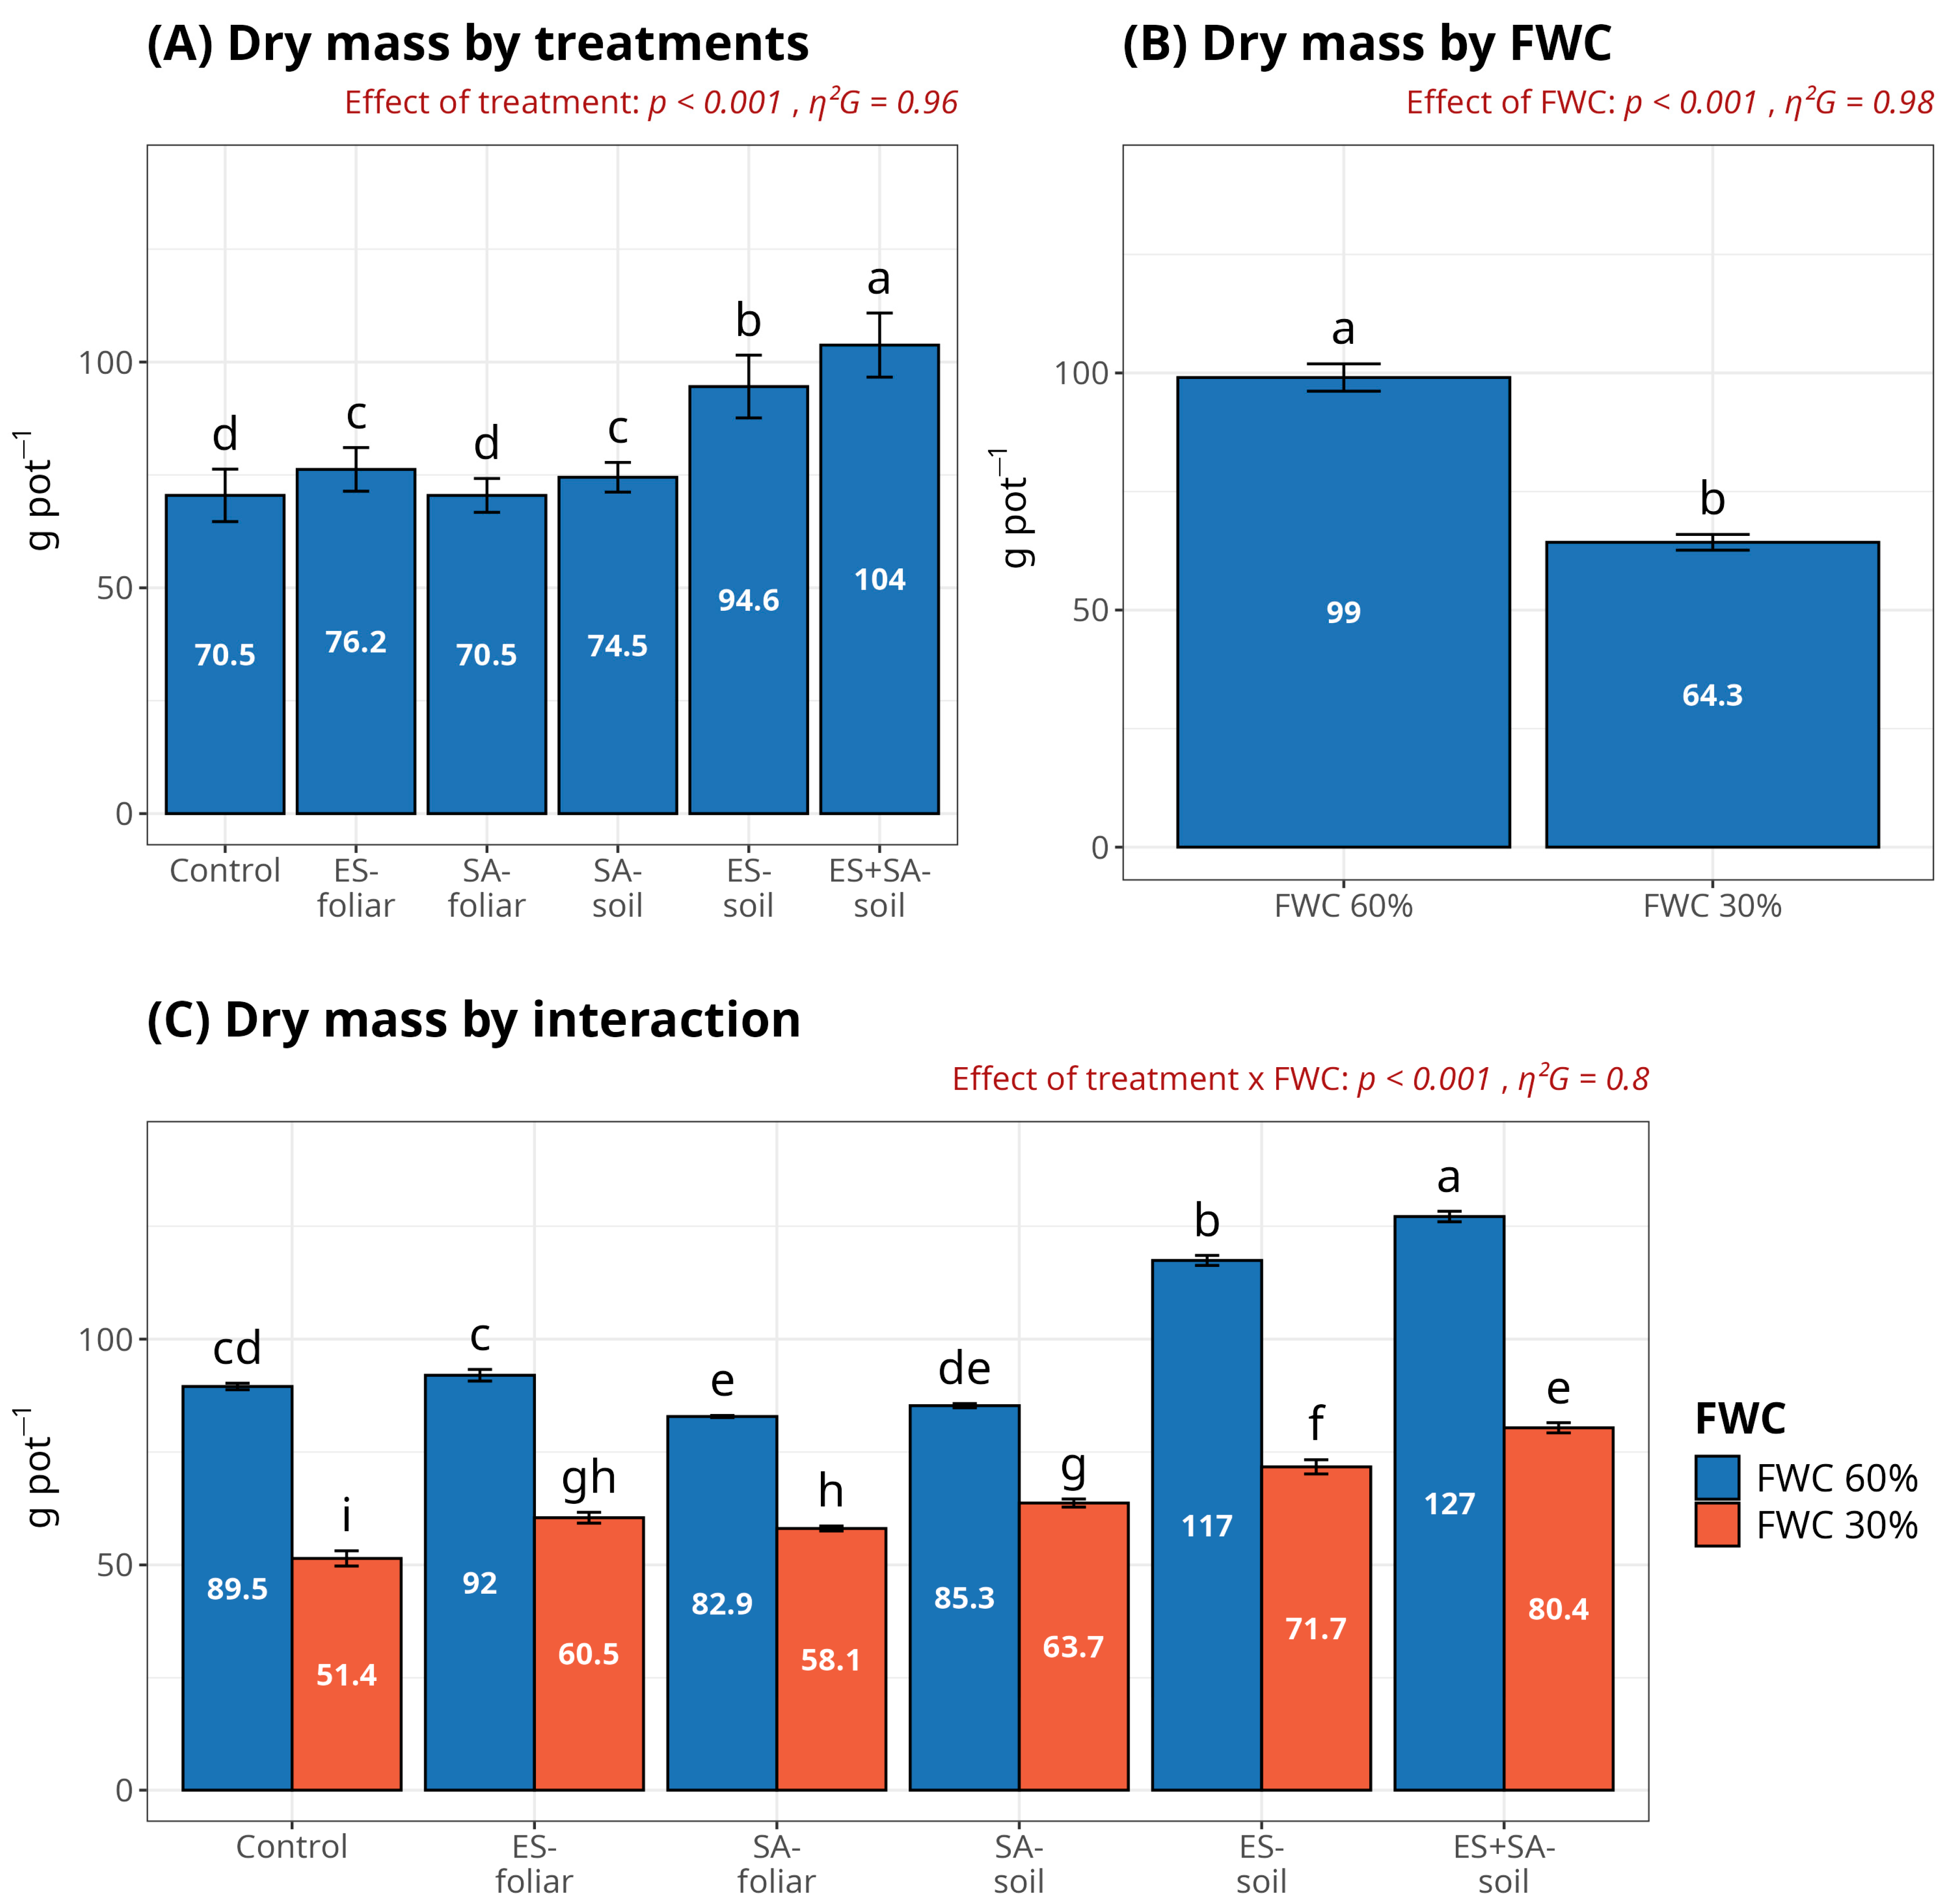
Treatment application and field water capacity significantly affected maize biomass yield (
Figure 1 and
Figure 2).
Fresh mass yield: Both treatment and water availability showed highly significant effects on fresh mass production, with a strong treatment × FWC interaction. Soil-applied treatments substantially outperformed foliar applications and control. The ES + SA-soil treatment achieved the highest fresh mass (448 g pot−1), followed by ES-soil (422 g pot−1). Optimal irrigation (FWC 60%) resulted in 33% higher fresh mass compared to drought stress (408 vs. 307 g pot−1).
The interaction analysis revealed distinct response patterns under contrasting water regimes. Under FWC 60%, soil treatments demonstrated superior performance: ES + SA-soil (511 g pot−1) and ES-soil (484 g pot−1) significantly outperformed all other treatments. Under drought stress (FWC 30%), the beneficial effect of soil treatments was less pronounced but still evident, with ES + SA-soil showing the highest value (386 g pot−1).
Dry mass yield: Treatment effects on dry mass followed a similar pattern to fresh mass (p < 0.001, η2G = 0.96), with water availability showing an even stronger effect (p < 0.001, η2G = 0.98). The treatment × FWC interaction was highly significant (p < 0.001, η2G = 0.80), indicating that treatment efficacy strongly depended on water availability. The ES + SA-soil treatment produced the highest dry mass (104 g pot−1), representing a 47% increase over control (70.5 g pot−1). ES-soil also showed substantial improvement (94.6 g pot−1), while foliar applications (ES-foliar: 76.2 g pot−1; SA-foliar: 70.5 g pot−1) and SA-soil (74.5 g pot−1) showed minimal effects. Optimal irrigation (FWC 60%) resulted in 54% higher dry mass compared to drought conditions (99 vs. 64.3 g pot−1).
Under optimal water availability (FWC 60%), soil treatments dramatically enhanced biomass accumulation: ES + SA-soil (127 g pot−1) and ES-soil (117 g pot−1) produced 42–84% more biomass than the control (89.5 g pot−1). However, under drought stress (FWC 30%), the benefits of soil treatments were substantially diminished. ES + SA-soil maintained the highest dry mass (80.4 g pot−1) under drought, but this represented only a 56% increase over control (51.4 g pot−1) compared to the 42% increase under optimal conditions. Foliar treatments showed inconsistent responses: ES-foliar performed similarly to control under both water regimes, while SA-foliar and SA-soil treatments showed reduced biomass under drought stress compared to the control.
The 47% biomass increase in ES + SA-soil likely reflects integration of multiple benefits: optimal photosynthetic efficiency, balanced N/S ratio (9.64–9.86) potentially supporting both growth and defense metabolism, greater sulfur uptake enabling antioxidant synthesis, and soil acidification enhancing micronutrient availability.
3.3. Concentration and Uptake of Macronutrients
Macronutrient concentrations and uptake were significantly affected by both treatment and water availability, with highly significant interaction effects for most nutrients (
Table 2 and
Table 3). The results demonstrate complex patterns of nutrient accumulation influenced by fertilization strategy and water regime.
Nitrogen and sulfur dynamics (
Table 2):
Both nitrogen concentration and uptake showed highly significant effects of treatment (p < 0.001, η2G = 0.90 and 0.72, respectively) and water availability (p < 0.001, η2G = 0.96 and 0.75). Soil-applied elemental sulfur (ES-soil and ES + SA-soil) significantly reduced nitrogen concentration (12.4–12.5 g kg−1 DM) compared to the control (15.1 g kg−1) but achieved the highest nitrogen uptake (1130–1230 mg pot−1) due to superior biomass production. Drought stress increased nitrogen concentration by 31% (15.7 vs. 12.0 g kg−1) but decreased uptake by 15% (1000 vs. 1170 mg pot−1), indicating a concentration effect under reduced growth.
Elemental sulfur application substantially affected plant sulfur content and uptake. ES-soil and ES + SA-soil treatments resulted in sulfur concentrations of 1.26–1.27 g kg−1 DM, representing a 52% increase relative to the control (0.831 g kg−1 DM). Sulfur uptake showed the same pattern, with ES-soil and ES + SA-soil reaching 111–112 mg pot−1 compared to 73.4 mg pot−1 in the control. Drought stress increased both sulfur concentration and uptake by 21%, suggesting that water deficit stimulates sulfur assimilation.
The N/S ratio showed remarkable treatment effects (p < 0.001, η2G = 0.97), with ES-soil and ES + SA-soil achieving optimal ratios of 9.64–9.86 for balanced nutrition. In contrast, control plants exhibited excessive N/S ratios (18.2), indicating relative sulfur deficiency. Notably, ES-soil and ES + SA-soil treatments maintained near-optimal N/S ratios even under drought stress (10.1–10.8), demonstrating effective nutrient balance management under water limitation. Control plants showed a further deterioration in N/S balance under drought (20.3 vs. 16.0), confirming that sulfur supplementation is essential for maintaining balanced nutrition under water deficit conditions. The optimal nitrogen-to-sulfur (N/S) ratio in the ES + SA soil (9.64–9.86) likely reflects a good balance between two key functions: nitrogen supports plant growth (by building proteins, chlorophyll, and photosynthesis-related enzymes), while sulfur is important for stress protection (mainly through glutathione, which helps neutralize harmful reactive oxygen species).
Phosphorus, potassium, calcium, and magnesium (
Table 3):
Phosphorus content and uptake were significantly affected by treatment (p < 0.001, η2G = 0.81 and 0.80), with SA-soil showing the highest concentration (2.93 g kg−1 DM) and uptake (258 mg pot−1). Elemental sulfur treatments (ES-soil and ES + SA-soil) reduced phosphorus concentration (2.02–2.25 g kg−1) and uptake (178–199 mg pot−1), suggesting an antagonistic relationship between sulfur and phosphorus accumulation. Drought stress slightly increased phosphorus concentration and uptake.
Potassium showed a strong response to water availability (p < 0.001, η2G = 0.91), with drought stress markedly increasing potassium concentration by 41% (18.2 vs. 12.9 g kg−1 DM) and uptake by 41% (1610 vs. 1140 mg pot−1). This pronounced potassium accumulation under drought reflects its critical role in osmotic adjustment. Treatment effects were also significant (p < 0.001, η2G = 0.88), with control and SA treatments maintaining higher potassium levels (17.1–17.9 g kg−1) compared to ES-soil and ES + SA-soil (12.1–13.2 g kg−1), again indicating sulfur–potassium antagonism.
Calcium concentration and uptake were strongly influenced by water availability (p < 0.001, η2G = 0.86), with drought stress increasing calcium levels by 22% (3.00 vs. 2.45 g kg−1 DM). Treatment effects were moderate (p < 0.001, η2G = 0.52), with relatively uniform calcium distribution across most treatments (2.49–2.85 g kg−1). The significant interaction effect (p < 0.001, η2G = 0.56) indicated that calcium accumulation patterns varied between water regimes.
Magnesium showed similar patterns to calcium, with both treatment and water availability significantly affecting concentration and uptake (all p < 0.001). Control, SA-foliar, and SA-soil treatments maintained higher magnesium levels (2.81–2.90 g kg−1) compared to elemental sulfur treatments (2.48–2.63 g kg−1), indicating lower magnesium concentration under sulfur application.
Micronutrient concentrations and uptake were significantly affected by both treatment and water availability (
Table 4).
3.4. Regression Tree Analysis—Macronutrient Hierarchy Under Contrasting Water Regimes
To identify nutrients limiting biomass accumulation under different water regimes, regression tree analysis (CART) was performed using macronutrient content data. Macronutrients (N, S, P, K, Mg) were selected as primary predictors of biomass accumulation, as micronutrients, though essential as enzyme cofactors, exhibit low variability and narrow concentration ranges that limit their discriminatory power in tree-based classification models.
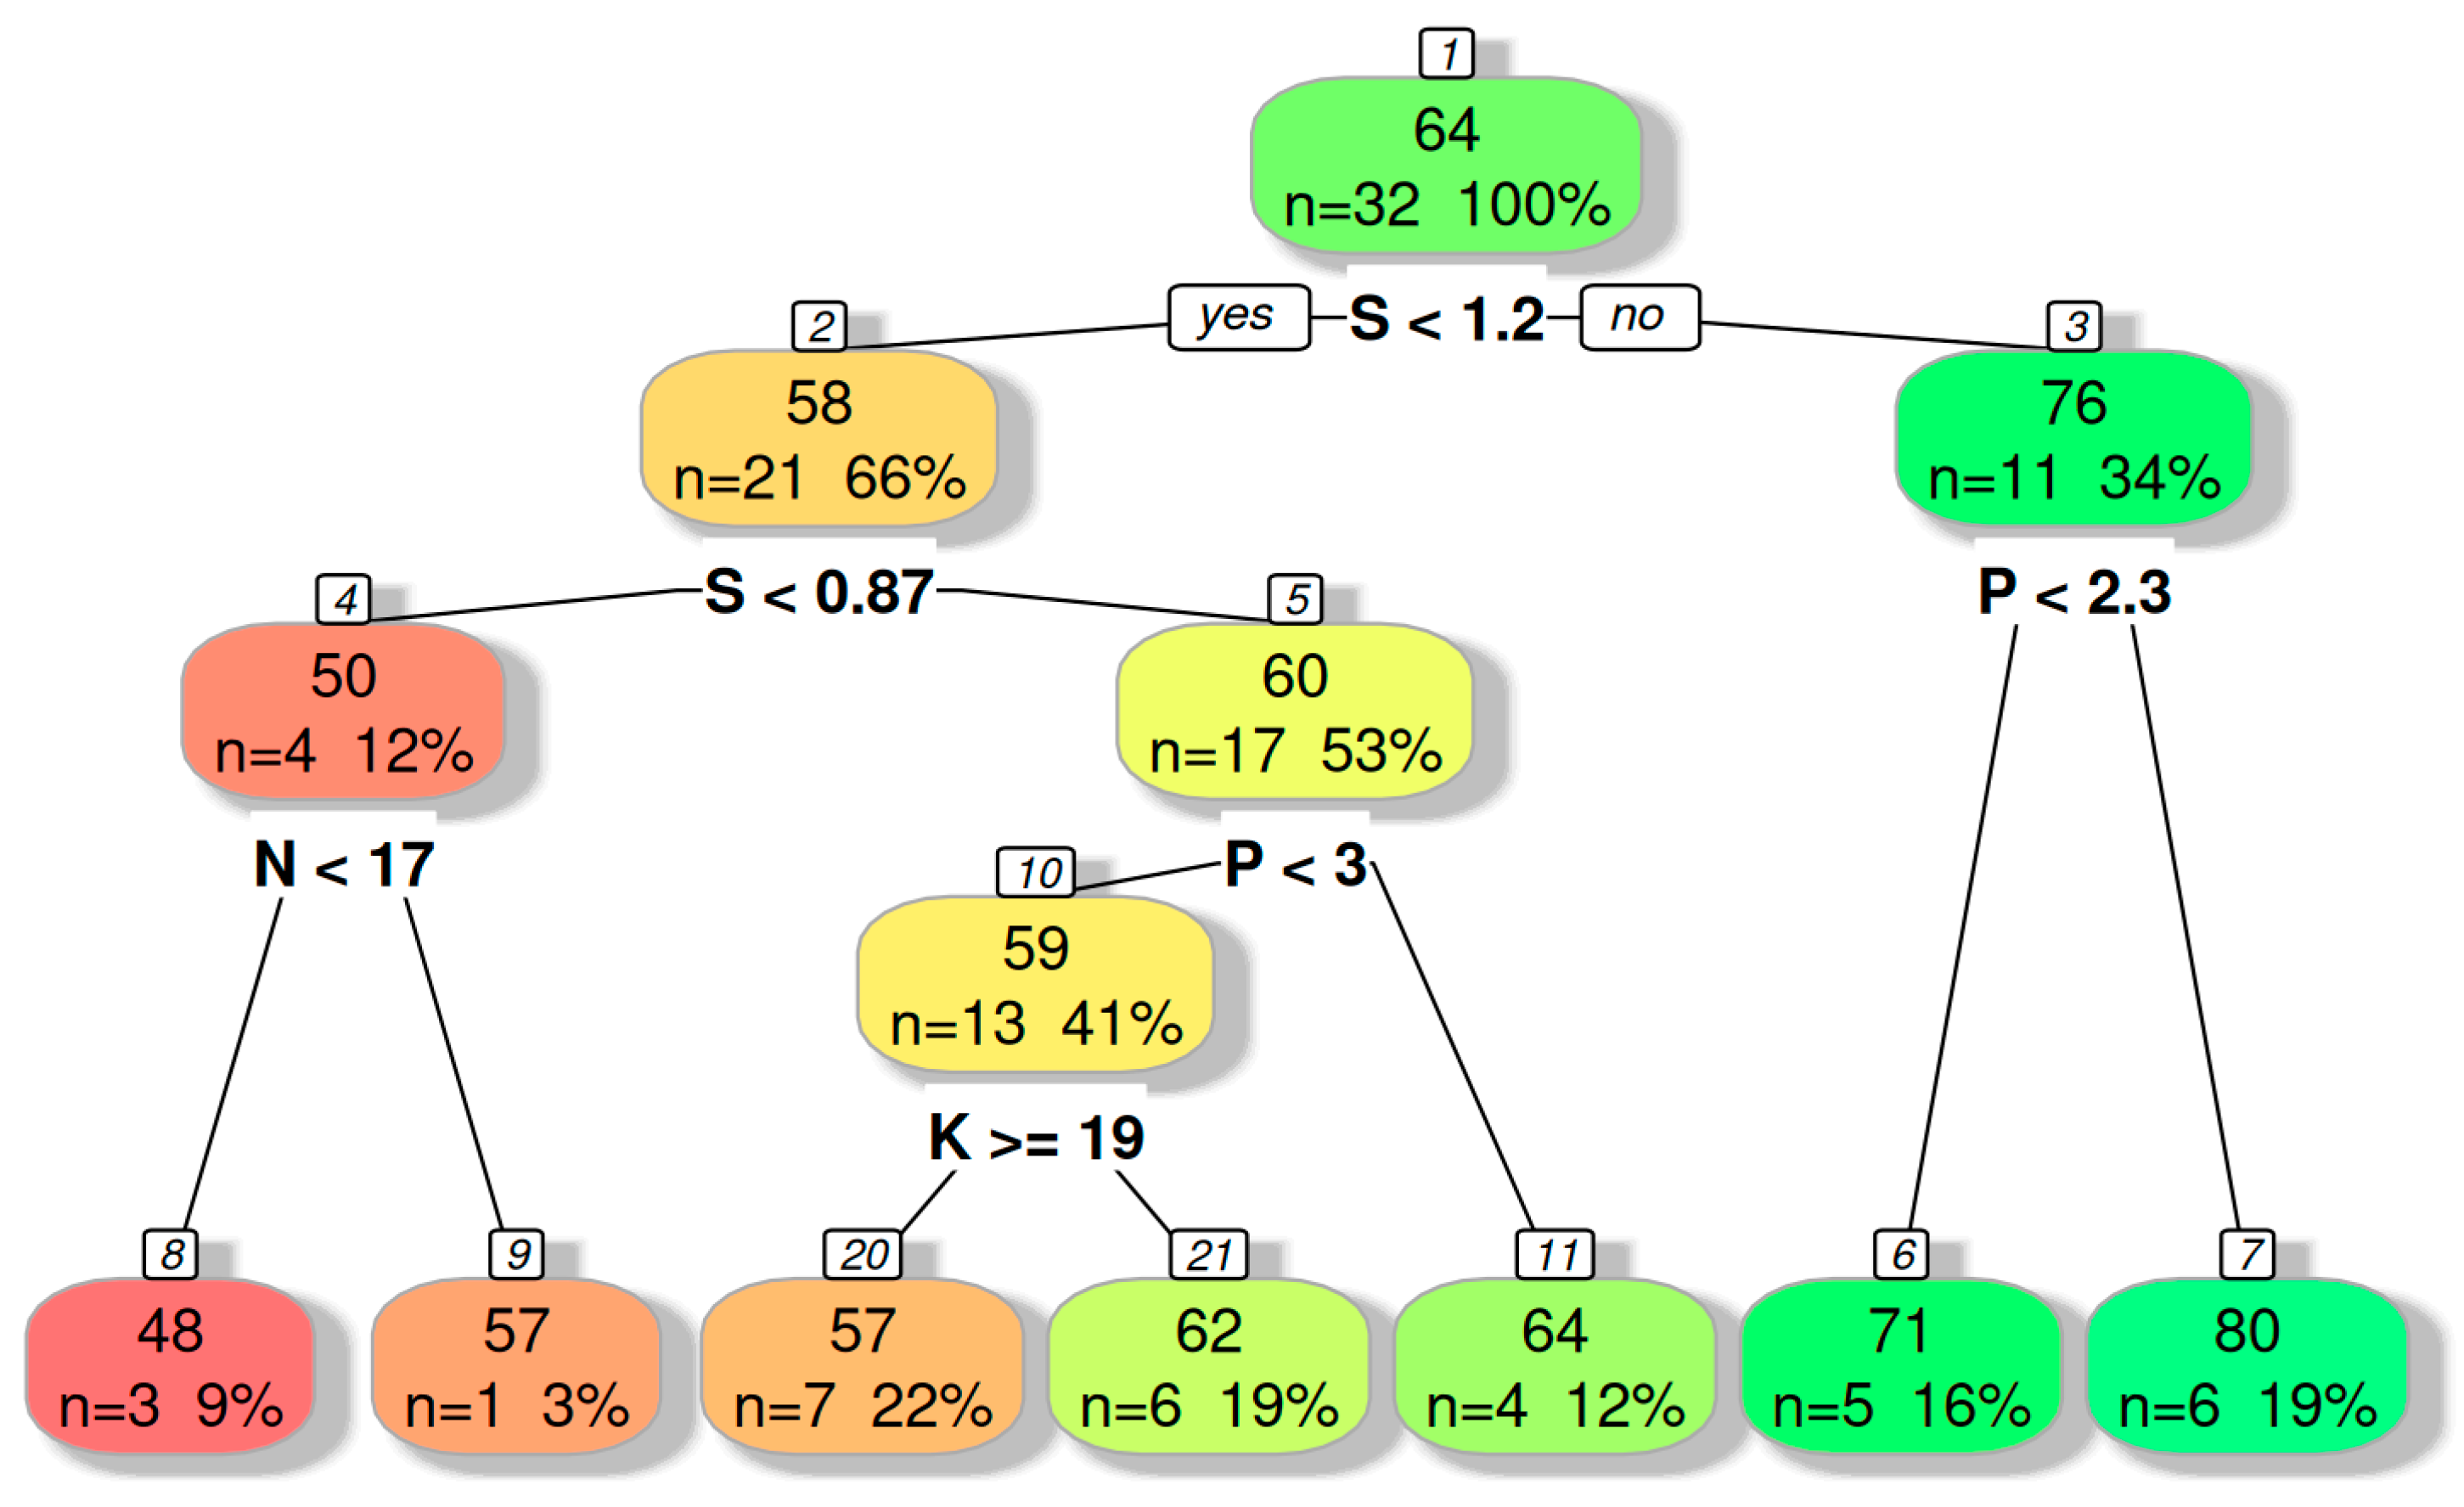
Drought stress conditions (FWC 30%): Variable importance analysis indicated that sulfur (S) and potassium (K) co-dominated dry mass prediction under drought, contributing equally (24.6% each) to model performance (
Figure 3). Phosphorus (P, 20.7%) and nitrogen (N, 20.3%) followed with moderate importance, while magnesium (Mg, 9.8%) showed a relatively minor effect. The dominance of S and K (49.2% combined) highlights their critical role in nutrient regulation under water deficit conditions.
Optimal irrigation conditions (FWC 60%): Under optimal irrigation (FWC 60%), the regression tree explained 99.1% of the variation in dry mass (R
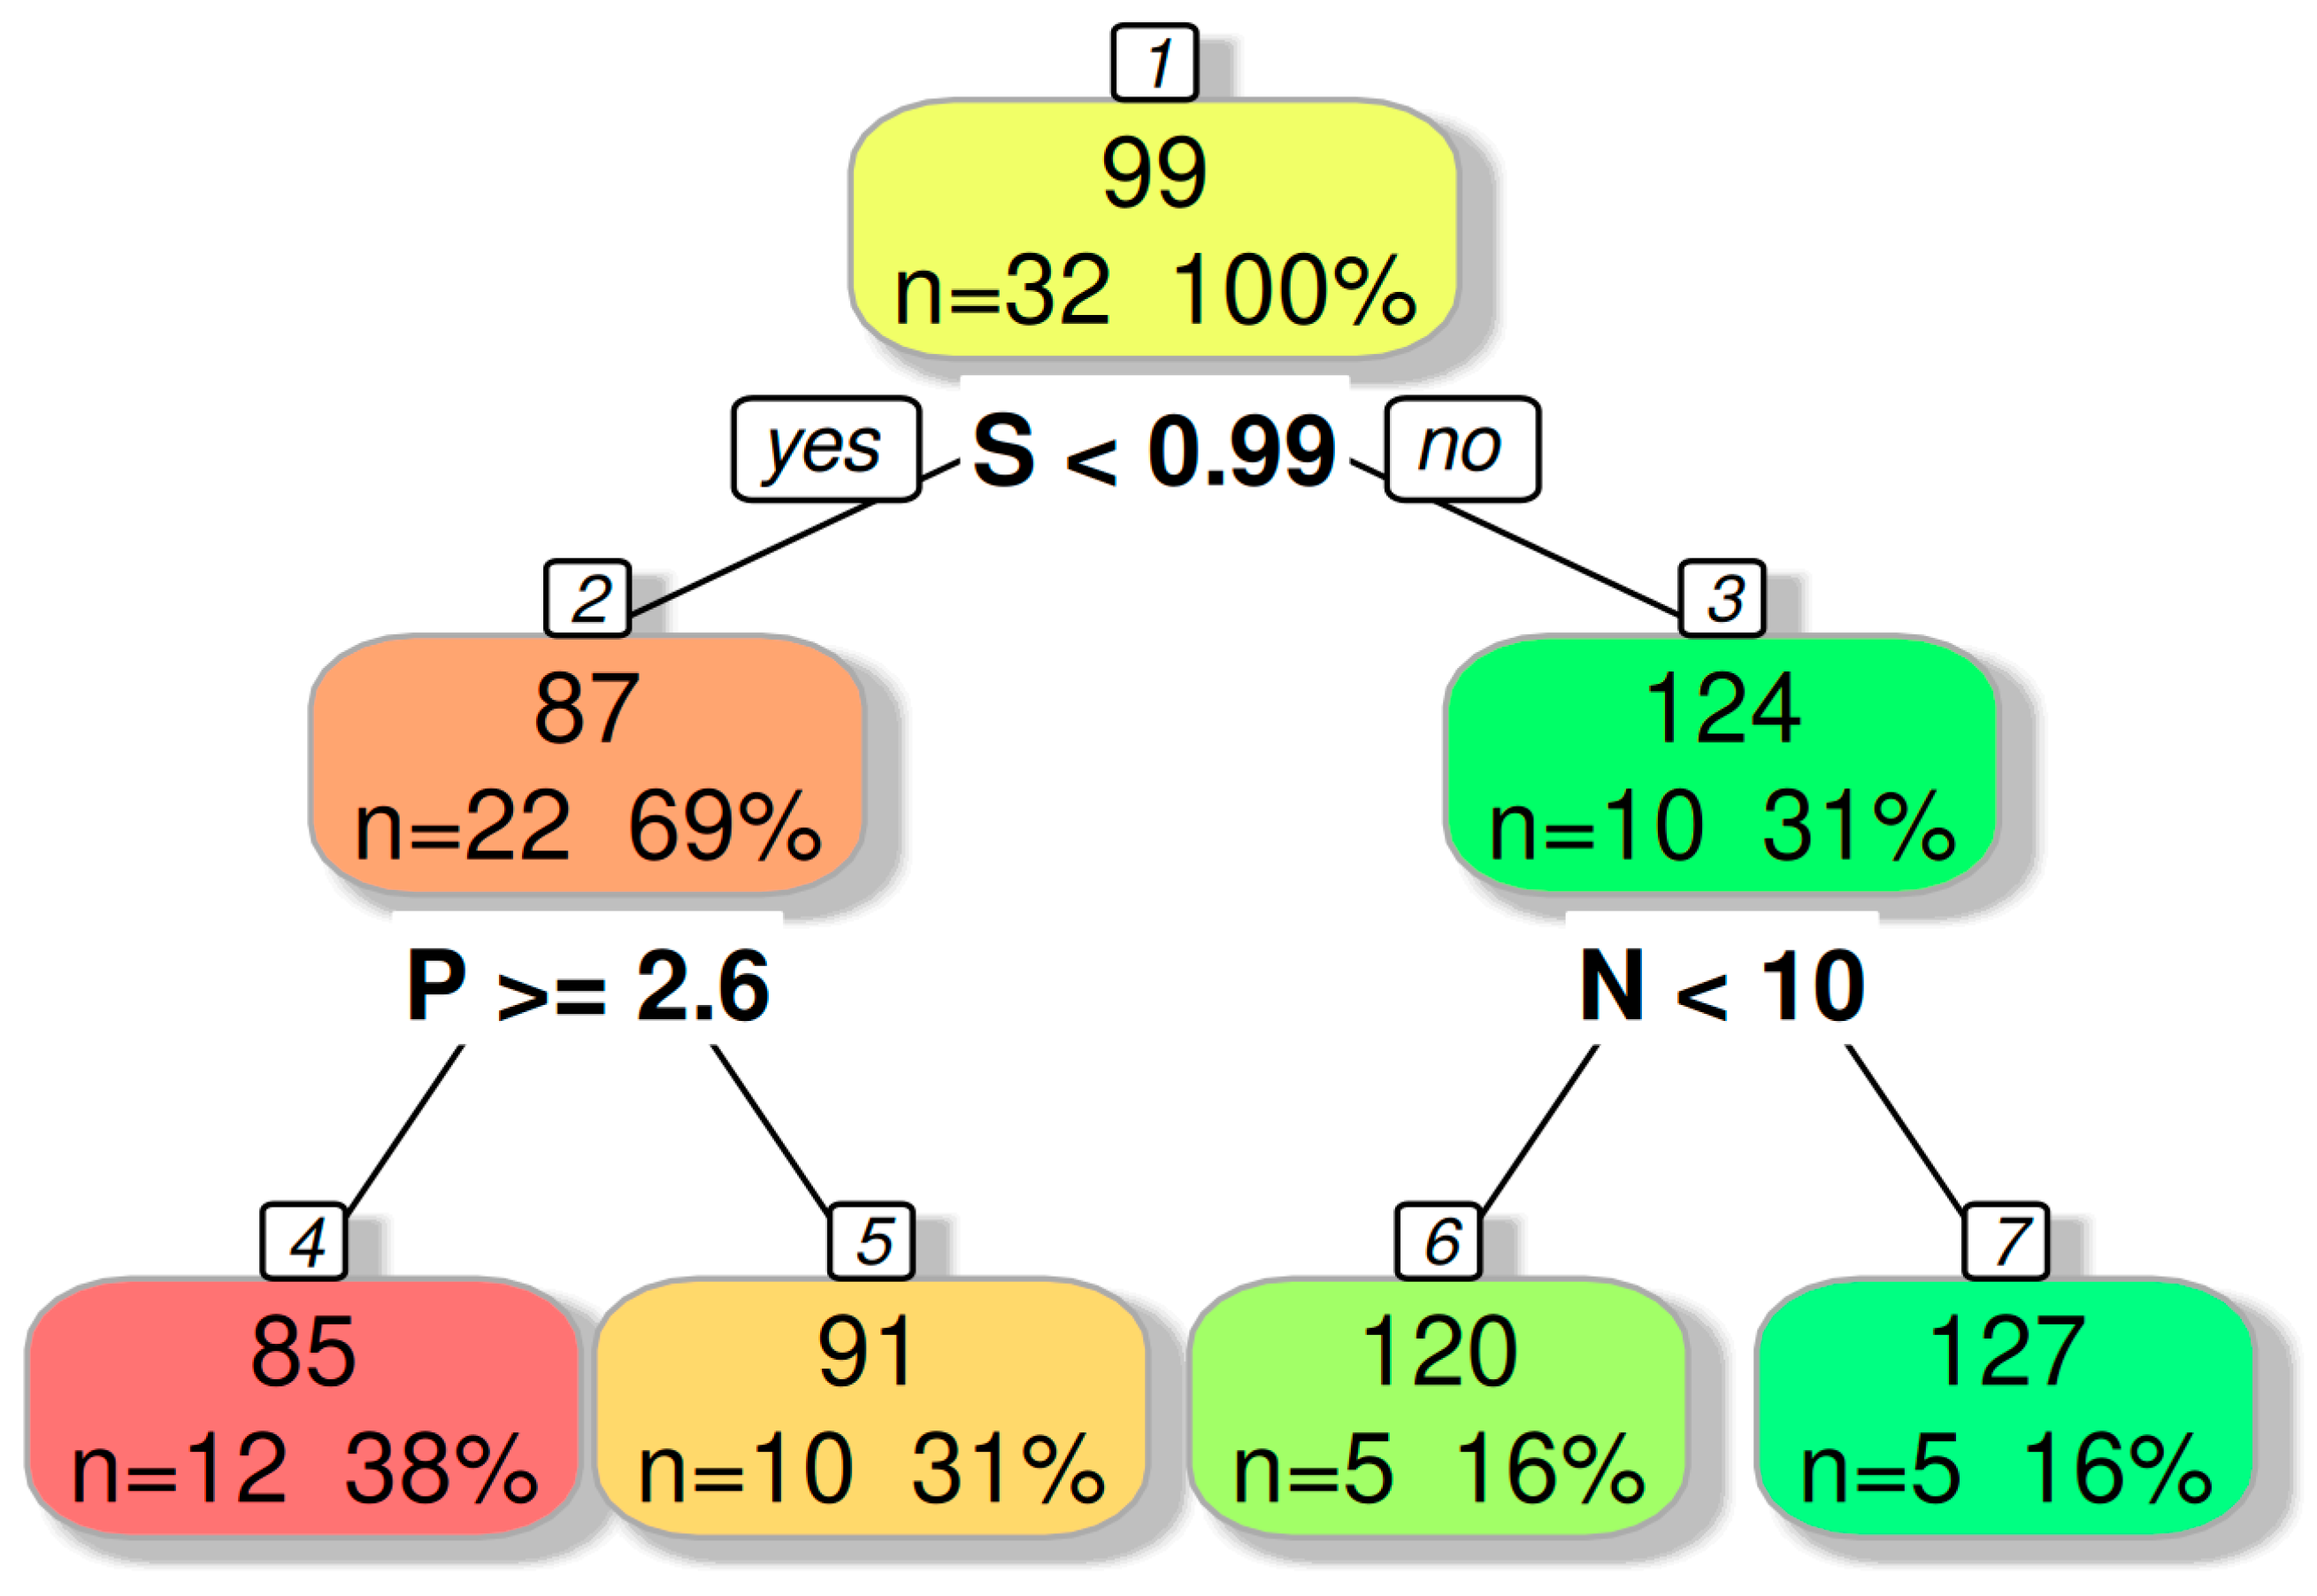
2 = 0.991, RMSE = 2.93 g), confirming excellent model fit. Sulfur (S) remained the main splitting variable (S < 0.99 g kg
−1 DM), while subsequent divisions involved phosphorus (P ≥ 2.6 g kg
−1 DM) and nitrogen (N < 10 g kg
−1 DM) (
Figure 4). Variable importance analysis indicated nearly balanced contributions of N (22.8%), P (22.7%), K (22.6%), and S (22.6%), with Mg showing a smaller effect (9.3%).
Although potassium showed high statistical importance, it was not selected as a splitting variable in the decision tree, suggesting it was not a primary discriminator among treatments or conditions (
Figure 3).
Comparison of nutrient hierarchies between water regimes reveals contrasting nutritional strategies. Under drought (FWC 30%), the pooled analysis (n = 36, all treatments) showed sulfur–potassium co-dominance (49.2% combined importance), with potassium appearing as an essential factor for osmoregulation.
Under optimal irrigation (FWC 60%), nutrient importance was balanced (N ≈ P ≈ K ≈ S, ~22–23% each), with potassium absent from the tree structure despite high statistical importance. However, as demonstrated in
Section 3.5, this sulfur–potassium dominance pattern is treatment-dependent rather than a universal drought response, with unfertilized control plants maintaining nitrogenph–osphorus prioritization even under water deficit.
The sulfur–potassium co-dominance in ES-treated plants under drought likely reflects complementary drought tolerance mechanisms: sulfur may enable antioxidant defense, while potassium likely provides osmoregulation. This coordinated S-K strategy may explain superior drought tolerance in ES + SA-soil. In contrast, nitrogen–phosphorus dominance in unfertilized controls suggests growth limitation rather than effective stress defense.
3.5. Treatment-Specific Nutrient Limitation Patterns
To distinguish whether the observed sulfur–potassium dominance under drought reflects an intrinsic physiological response or a treatment-mediated effect, we performed exploratory CART analysis restricted to unfertilized control plants. It is worth noting that this subset analysis has limited statistical power (
n = 6 per FWC level;
n/
p ratio = 1.2) and falls below recommended sample sizes for CART analysis [
16]. Therefore, these results should be interpreted as hypothesis-generating rather than definitive, and they require validation with larger sample sizes in future studies.
In unfertilized control plants, the nutrient hierarchy pattern differed markedly from the pooled analysis. Variable importance ranking showed nitrogen as the dominant predictor (27.1%), followed by phosphorus (26.7%), magnesium (19.5%), and potassium (17.8%), while sulfur showed the lowest importance (8.9%). This N-P dominance (53.8% combined) indicates that unfertilized plants under drought continued to prioritize growth-related nutrients (protein synthesis, energy metabolism) rather than shifting toward sulfur-dependent defensive functions. The model achieved high predictive accuracy (R2 = 0.997), though this must be interpreted cautiously given the small sample size.
Under optimal irrigation, control plants showed a more balanced nutrient distribution: phosphorus (28.7%), potassium (27.6%), and magnesium (27.6%) showed nearly equal importance, followed by sulfur (14.9%), while nitrogen was lowest (1.2%). This pattern differs from both the drought-stressed control (N-P dominance) and the pooled optimal irrigation analysis (N ≈ P ≈ K ≈ S balance).
The contrasting patterns between control-only and pooled analyses demonstrate that the sulfur–potassium dominance observed under drought (
Section 3.4) is treatment-mediated rather than a universal physiological response. In unfertilized plants, drought does not induce a shift toward S-K dominance; instead, nitrogen and phosphorus remain the primary limiting factors (combined 53.8% importance). The S-K dominance in pooled analysis (49.2% combined importance) arises because three of six treatments included elemental sulfur supplementation (ES-foliar, ES-soil, ES + SA-soil), which increased tissue sulfur content and altered nutrient limitation priorities.
3.6. Micronutrient Contribution to Biomass Variation
To test whether micronutrients (Cu, Fe, Mn, Zn) contributed to biomass variation beyond macronutrients, we performed regression tree analysis on model residuals from the macronutrient CART model (
Section 3.4). Micronutrients explained minimal additional variance (FWC 30%: ΔR
2 = 3.3 percentage points; FWC 60%: ΔR
2 = 0.2 percentage points), confirming that macronutrients are the primary limiting factors for maize growth under sulfur and salicylic acid treatments.
3.7. Principal Component Analysis
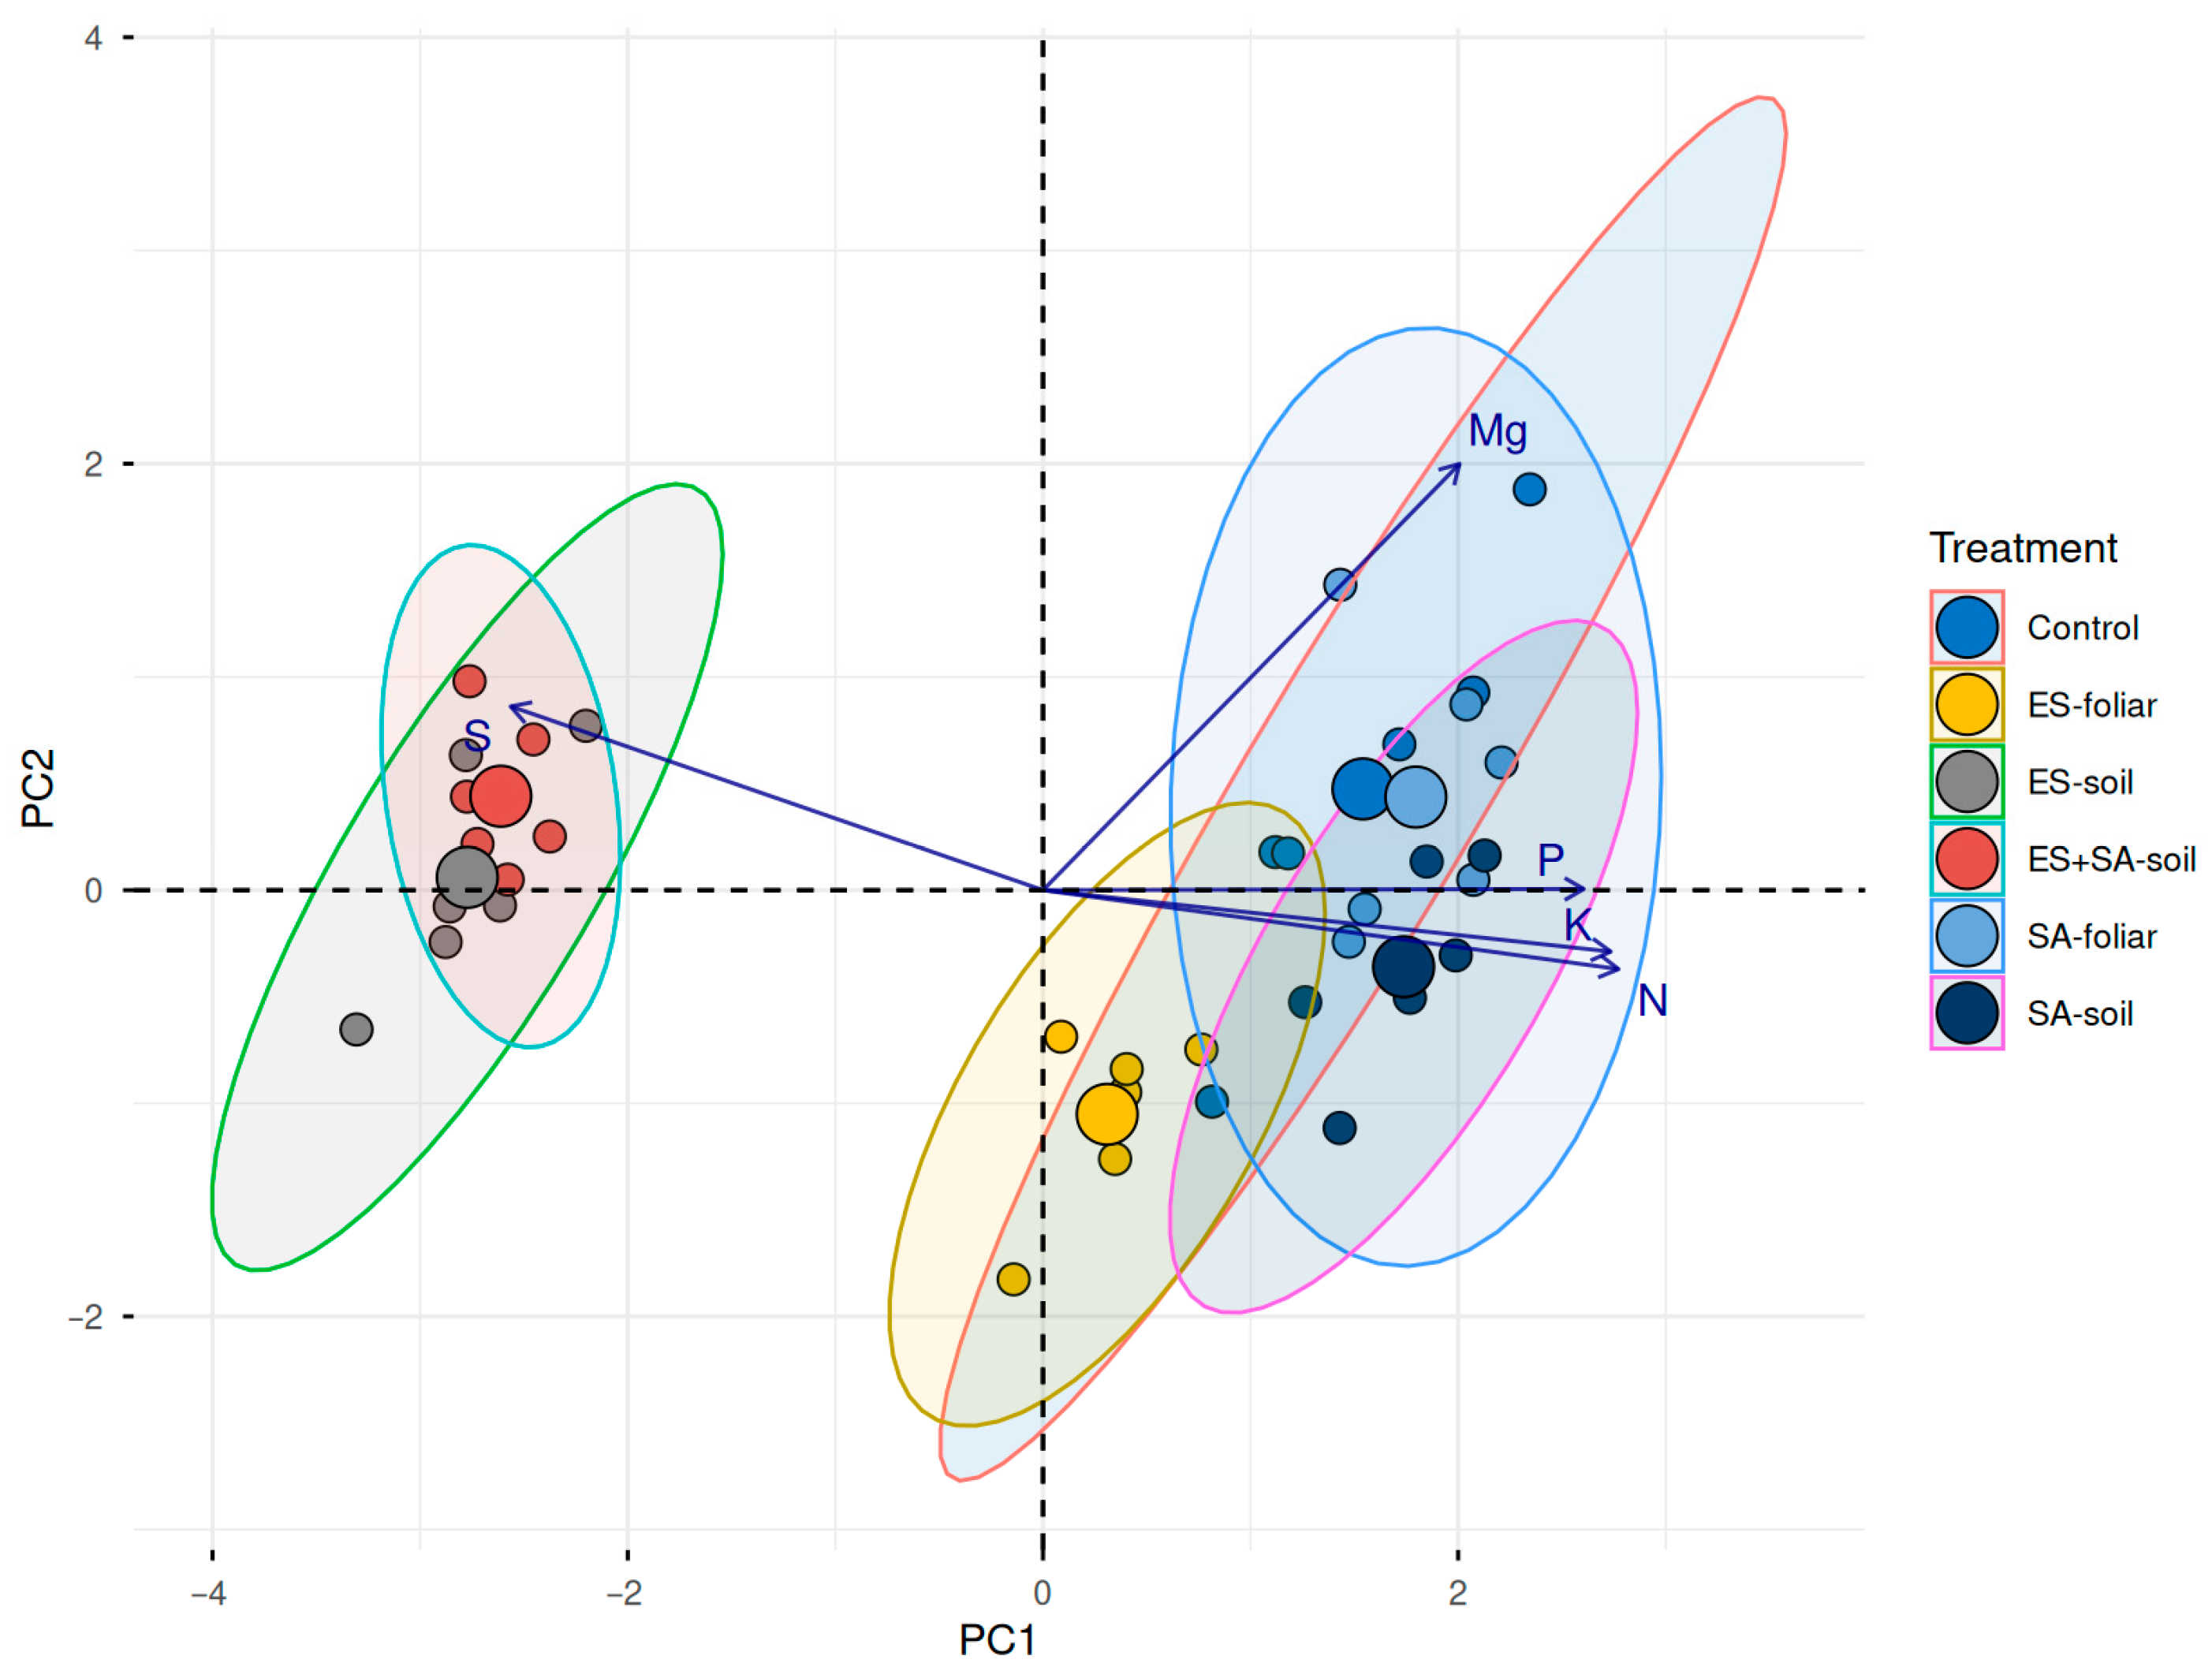
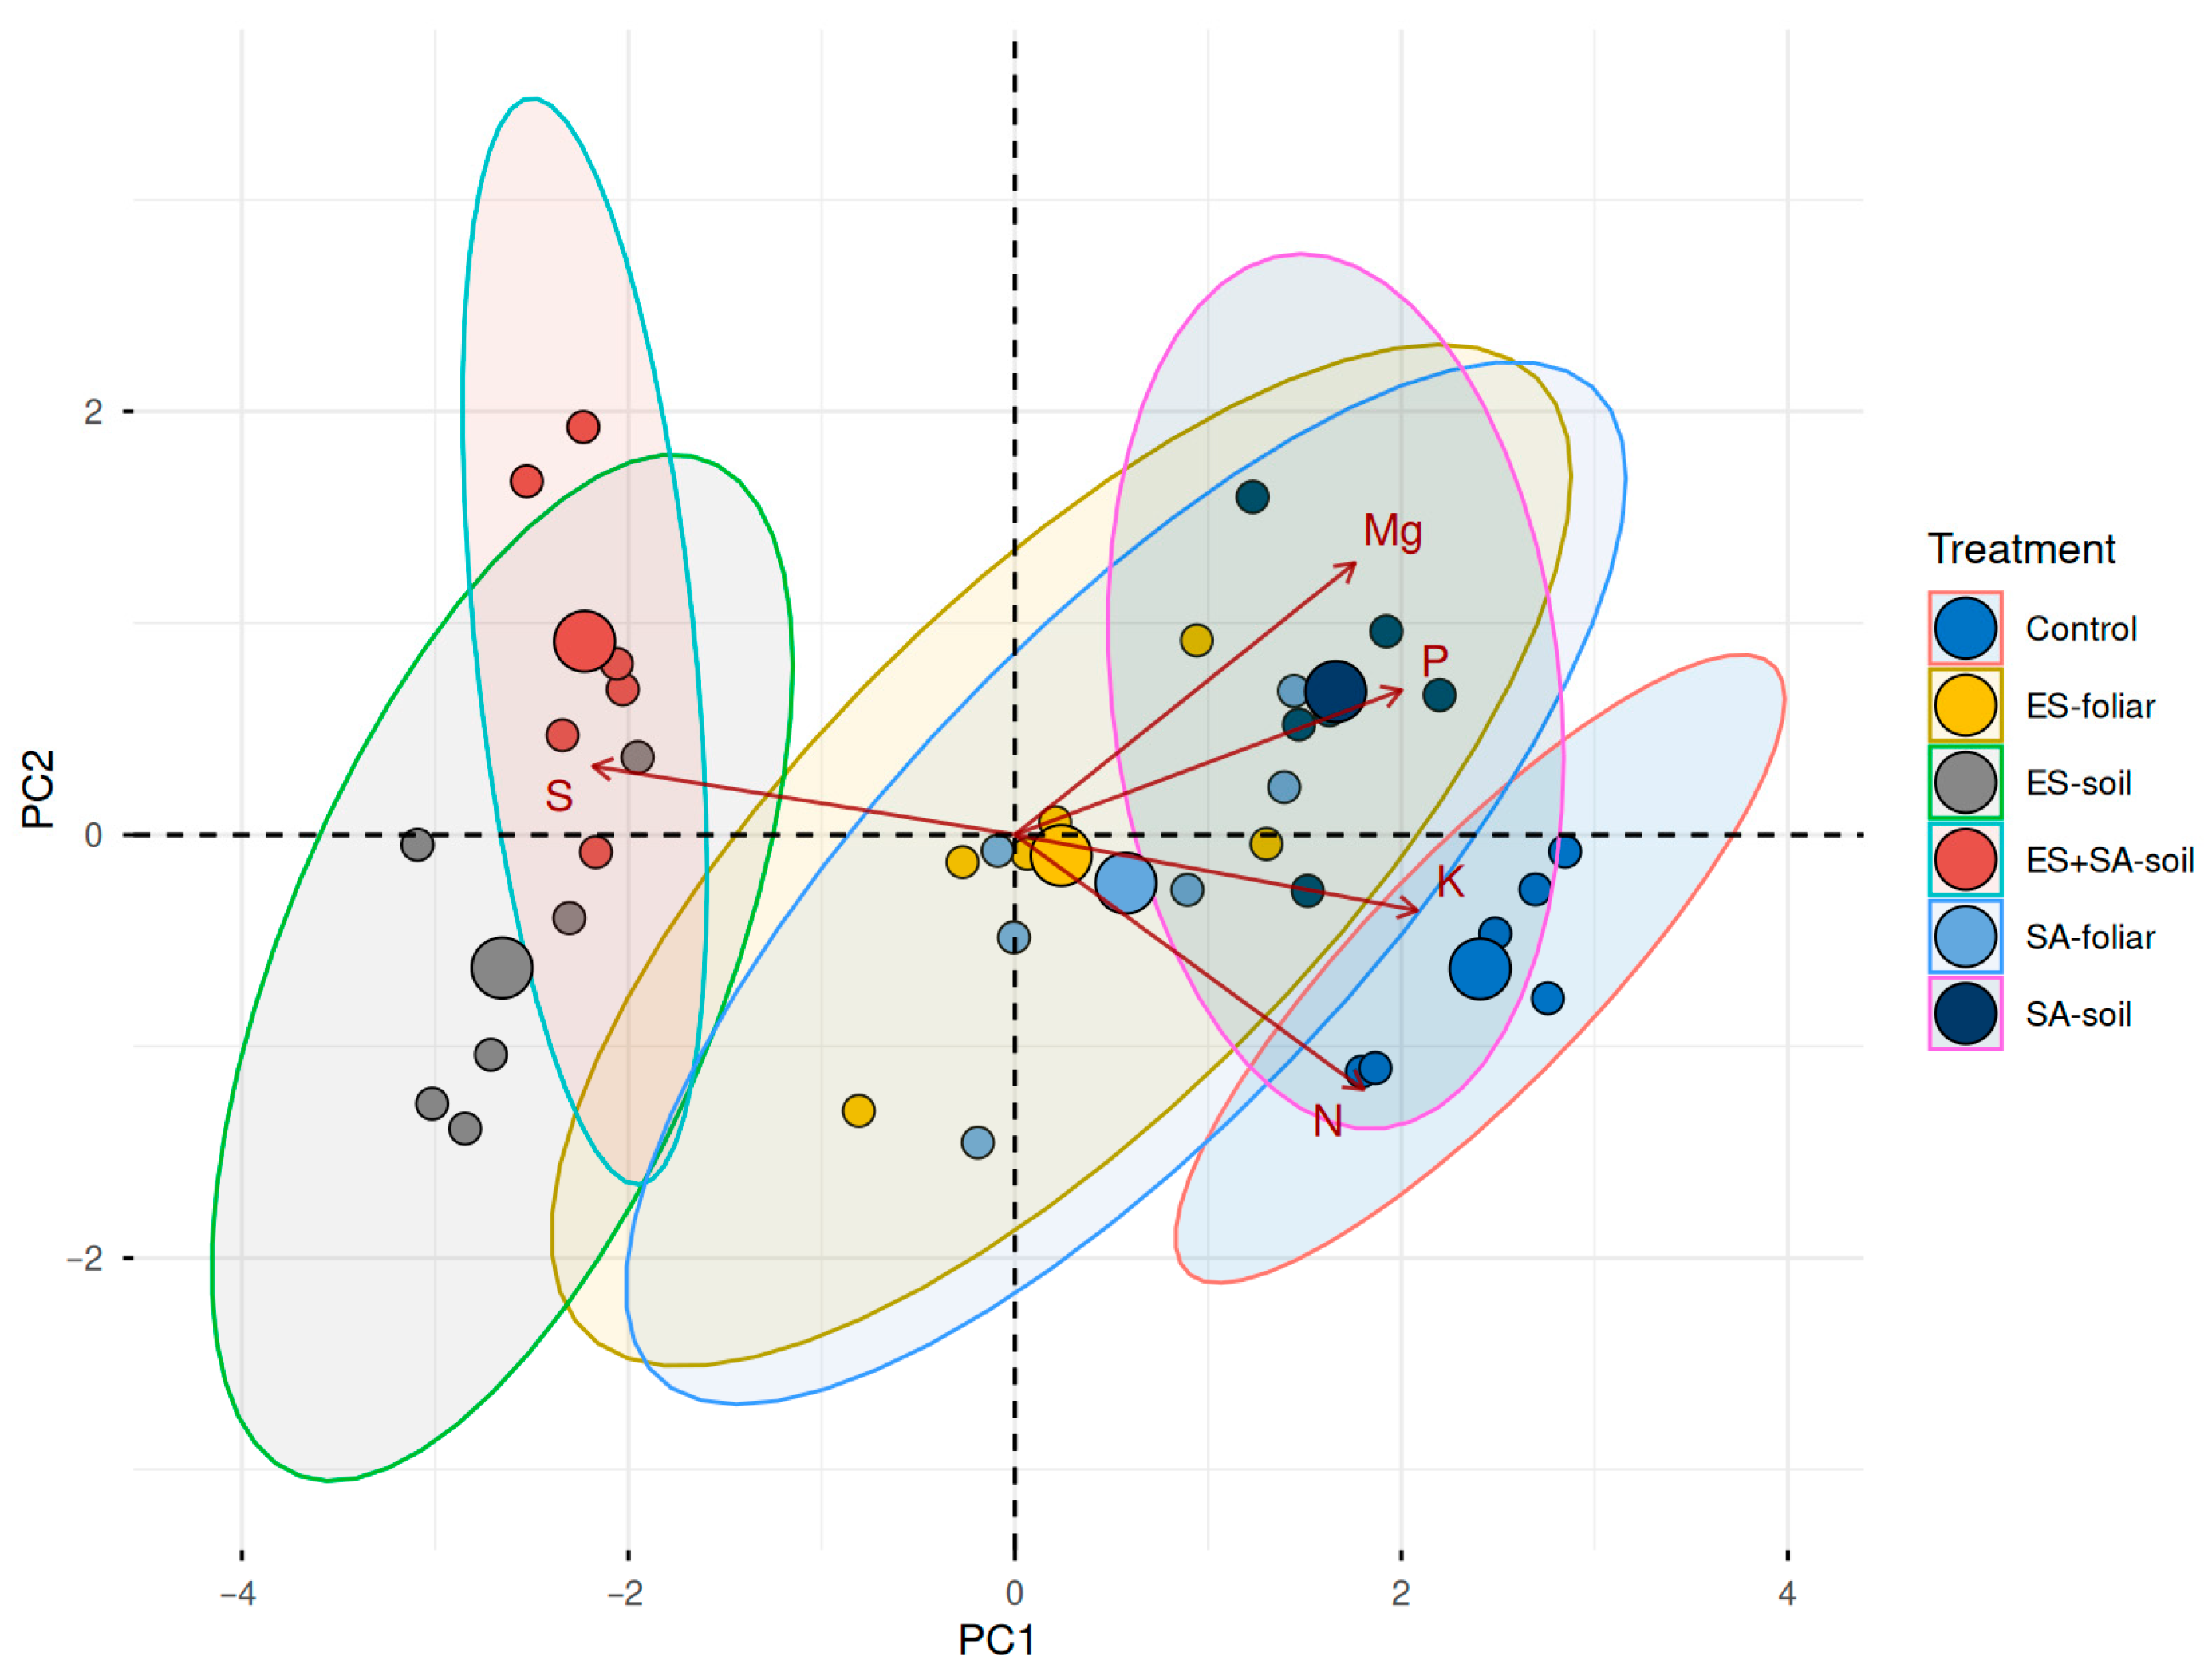
Principal component analysis (PCA) was performed to visualize overall patterns of nutrient variation across treatments and water regimes. Analysis was conducted using five macronutrients (N, S, P, K, Mg) to maintain consistency with CART analysis (
Section 3.4), as macronutrients explained >91% of biomass variance while micronutrients contributed <5% additional variation. PCA biplots for optimal irrigation (
Figure 5) and drought stress (
Figure 6) are presented below.
3.8. Redundancy Analysis—Variance Partitioning of Macronutrient Composition
To quantify the relative contributions of treatment and water availability to macronutrient composition, we performed redundancy analysis (RDA) using the same five macronutrients (N, S, P, K, Mg) as in the CART (
Section 3.4) and PCA (
Section 3.7) analyses. The RDA model explained 95.3% of the total variance in macronutrient composition (adjusted R
2 = 0.944,
Table 5), indicating excellent predictive power. Both treatment (F = 87.05,
p < 0.001) and water availability (F = 749.80,
p < 0.001) significantly affected nutrient profiles, with a significant interaction effect (F = 4.89,
p < 0.001) demonstrating that treatment effects varied between water regimes.
Variance partitioning revealed that water availability (FWC) explained 63.4% of macronutrient variation, while treatment effects accounted for 34.3%, demonstrating that water regime is approximately two times more influential than ES/SA treatment type in determining plant macronutrient composition (
Table 5). The negative shared effect (−4.9%) indicates an antagonistic interaction between treatment and FWC, meaning that treatment effects on nutrient composition differ between drought and optimal irrigation conditions. Unexplained variance was minimal (7.3%), confirming the robustness of the model.
These results complement CART analysis (
Figure 3 and
Figure 4) by quantifying variance partitioning, and they align with PCA visualization (
Figure 5 and
Figure 6) showing clear FWC-driven separation of nutrient profiles. The convergence of three independent multivariate approaches (CART, PCA, RDA) on the same conclusion—water availability as the primary driver of macronutrient composition—provides robust evidence for the dominant role of water regime over treatment type in determining plant nutrient status.
3.9. Soil Properties After Experiment
Soil physicochemical properties at harvest showed significant treatment effects, particularly for pH and sulfur content, indicating persistent changes in soil chemistry following elemental sulfur and salicylic acid applications (
Table 6).
Treatment significantly affected soil pH (
p < 0.001, η
2G = 0.77), with SA-soil showing the highest pH (5.86), while ES-soil and ES + SA-soil treatments resulted in the lowest pH values (5.32–5.34). This soil acidification in elemental sulfur treatments reflects the oxidation of elemental sulfur to sulfuric acid by soil microorganisms (
Thiobacillus spp.), a well-documented process in sulfur fertilization [
17]. Recent pot experiments with perennial ryegrass in sulfur-deficient sandy soil demonstrated that both elemental sulfur and sulfate fertilizers stabilize soil organic matter (SOM) through enhanced mycorrhizal efficiency, with increased glomalin-related soil proteins (GRSPs) indicating improved fungal activity [
18]. The pH reduction of approximately 0.3–0.5 units compared to control (5.6) demonstrates the soil-modifying effect of elemental sulfur application. Water availability showed a marginal non-significant effect (
p = 0.053, η
2G = 0.07), with slightly lower pH under optimal irrigation (5.57) compared to drought (5.51).
Treatment effects on soil organic carbon were significant but modest (p = 0.022, η2G = 0.19). ES-soil treatment showed the highest carbon content (8.90 g kg−1), while SA-soil and ES + SA-soil showed the lowest (7.80–8.12 g kg−1). These relatively small differences (±10% from mean) likely reflect variations in root exudation and rhizosphere carbon dynamics rather than major changes in soil organic matter. Water availability had no significant effect (p = 0.052).
Soil nitrogen content was significantly affected by both treatment (p = 0.007, η2G = 0.23) and water availability (p < 0.001, η2G = 0.17), with a significant interaction (p = 0.002, η2G = 0.26). Control plants maintained the highest soil nitrogen (0.792 g kg−1), while ES-foliar and ES-soil treatments showed lower values (0.725–0.739 g kg−1), suggesting enhanced nitrogen uptake efficiency in these treatments. Under optimal irrigation, soil nitrogen averaged 0.771 g kg−1 compared to 0.732 g kg−1 under drought, reflecting reduced plant nitrogen uptake under water stress. The significant interaction indicates that treatment effects on soil nitrogen varied between water regimes, with drought intensifying nitrogen depletion in some treatments (e.g., ES-foliar: 0.763 → 0.687 g kg−1).
Sulfur content in soil showed the strongest treatment effect (p < 0.001, η2G = 0.69), directly reflecting elemental sulfur application. ES-soil and ES + SA-soil treatments resulted in markedly elevated soil sulfur (230–231 mg kg−1 DM), representing a 29% increase over control (179 mg kg−1). This residual sulfur indicates incomplete sulfur uptake by plants during the growing season, leaving a sulfur reserve in the soil that could benefit subsequent crops. Foliar sulfur applications did not significantly increase soil sulfur content (180 mg kg−1), confirming that foliar-applied sulfur enters the plant directly without substantial soil accumulation. Water availability had no significant effect on soil sulfur (p = 0.092), but the interaction effect was significant (p = 0.004, η2G = 0.25), indicating differential sulfur retention patterns between water regimes.
The soil acidification effect observed in ES-soil treatments (ΔpH = −0.3 units, from 5.6 to 5.32–5.34) aligns with previous observations from our laboratory, where elemental sulfur application at 60 mg S kg
−1 produced similar acidification (ΔpH = −0.3 units) in wheat pot experiments [
9]. This consistency across experiments and species (wheat and maize) confirms that elemental sulfur undergoes predictable microbial oxidation to sulfuric acid (via
Thiobacillus spp.), providing a reliable soil modification tool. Importantly, Kulczycki et al. [
9] demonstrated that this acidification did not impair nutrient availability or plant growth in moderately acidic soils (pH 5.3–5.6), and it may even enhance micronutrient solubility (Fe, Mn, Zn) in calcareous or neutral soils. However, our results confirm that the acidification effect requires careful monitoring in already acidic soils, where liming may be necessary to prevent pH decline below optimal ranges (pH 5.5–6.5 for maize).
Implications for soil fertility: The persistent changes in soil pH and sulfur content demonstrate that elemental sulfur application has both immediate nutritional benefits and longer-term soil modification effects. The acidification effect (ΔpH = −0.3 units) may be beneficial in calcareous or alkaline soils but requires monitoring in already acidic soils. The residual soil sulfur (230 mg kg−1) provides a sulfur reserve for subsequent crops, potentially reducing fertilization requirements in the following seasons. However, the lack of major changes in soil carbon and nitrogen suggests that the experimental duration (110 days) was insufficient to substantially alter soil organic matter dynamics.